Martin O’Malley, Governor | Anthony G. Brown, Lt. Governor | Robert M. Summers, Ph.D., Secretary
Transport Team Update
Preliminary Attainment Modeling Results and a Status Report on a Collaborative Solution to the Ozone
Transport Problem
Tad Aburn, Air Director, MDE OTC Committee Meetings – September 24, 2014
• Background
• Transport Team Update
• Technical Analyses to Date
• Maryland’s Modeling and Analyses of Emissions Data
• Our “Good Neighbor” Ask of Upwind States
• Timing and Future Efforts
• Discussion
Topics
Page 2
Background – Ozone Transport
• Many, many balls in the air
• Supreme Court has acted
• Not real clear on what happens next
• “Expand the OTR” Petition under Section
176A of the Clean Air Act (CAA)
• Challenges to EPA over large nonattainment
areas (CAA Section 107)
• Challenges to EPA over “Good Neighbor”
SIPs (CAA Section 110A2D)
• EPA’s Transport Rule Process
• A collaborative effort between upwind and
downwind states to address the ozone
transport issue
• Remainder of this presentation will focus on
modeling results and the collaborative effort
Page 3
• On August 6, 2013- Approximately 30 Air Directors began a technical collaboration on ozone transport in the East
• There was discussion … and general agreement … on beginning technical analyses of a scenario (called “Phase 1”) that would try and capture the progress that could be achieved if:
• The EPA Tier 3 and Low Sulfur Fuel program is effectively implemented
• The potential changes in the EGU sector from shutdowns and fuel switching driven by MATS, low cost natural gas and other factors were included
• The potential changes in the ICI Boiler sector driven by Boiler MACT and low cost natural gas were also included
• Multiple calls and meetings since August 2013
• In early April 2014, preliminary discussions between Commissioners began
• These discussions continue
Background – Collaboration
Page 4
Why Is MD Pushing So Hard • Only state East of the Mississippi designated as a
“Moderate” nonattainment area by EPA
• Baltimore is the only nonattainment area in the
East required to submit an “Attainment” SIP by
June of 2015
• This SIP must be supported by an “Attainment
Demonstration”
• The Attainment Demonstration must be based upon
photochemical modeling and other technical analyses
• It must show that monitors in the Baltimore area are
expected to comply with the ozone standard by 2018
• We have enough modeling and technical analysis
completed to understand what Maryland needs in
it’s plan to bring the State into attainment
• This analysis also shows that most other areas in the
East should attain the 75 ppb standard Page 5
• Number 1 Need – The Tier 3 Mobile Source and Fuel Standards
• The most important new program to reduce high ozone in MD and the OTR
• Number 2 – OTC Measures
• Additional local reductions in MD and close-by neighboring states to reduce mobile source emissions and emissions from other sectors
• New mobile source efforts in the Ozone Transport Region and new Maryland control programs are on the books or in the works
• Number 3 - Good Neighbor SIPs or Commitments to address transport
• Current analyses shows that if …
• Power plants in upwind states simply run the controls that have already been purchased efficiently, and
• Planned retirements and other changes occur by 2018
• That transport for the 75 ppb ozone standard will be addressed
The Key Elements of Maryland’s Plan
Page 6
• The Maryland modeling looks at more than just upwind power plants
• New federal control programs for mobile sources, like the Tier 3 vehicle and fuel standards, are critical
• Maryland’s plan … and the modeling … includes new OTC controls like:
• California car programs
• Aftermarket catalyst initiatives
• RACT requirements
• Consumer products and paints
• Diesel Inspection and Maintenance
• Non-traditional control efforts
• Many more
Addressing Mobile Sources and …
Page 7
… other “along the I-95 corridor” controls
• Maryland has conducted preliminary modeling of the Plan and believes that the Plan will allow MD to come very close to meeting the 75 ppb ozone standard
• Will most likely allow most other areas in the East to attain the standard by 2018
• MD’s modeling has been conducted as part of the OTC effort … primarily with the OTC platform that uses 2007 as the base year and 2018 as the attainment year
• As Jeff described earlier, OTC and MD are updating the modeling to use the newer platform based upon EPA modeling efforts
• This platform uses 2011 as the base year and 2018 as the attainment year
• Based upon available comparisons, it appears that modeling with the 2011 platform will generate results consistent the 2007 platform
Modeling the Maryland Plan
Page 8
The Bottom Line
2007 Base
2018 Scenario A3
Before Scenario A3 After Scenario A3
Page 9
Maryland’s plan is currently being modeled as “Attainment Run #3” or “Scenario A3”
10
Toughest Monitors
in the East
Design Value
2007
After Scenario A3
2018
Harford, MD 90.7 74.7
Prince Georges, MD 85.3 65.1
Fairfield, CT 88.7 70.8
New Castle, DE 81.3 66.3
Bucks, PA 90.7 76.8
Suffolk, NY 88.0 71.0
Camden, NJ 87.5 74.2
Fairfax, VA 85.3 66.9
Franklin, OH 84.7 69.7
Fulton County, GA 90.3 73.7
Wayne, MI 81.3 74.5
Sheboygan, WI 83.3 70.8
Mecklenberg Co, NC 87.0 67.6
Knoxville, TN 80.7 70.7
Jefferson County, KY 80.0 67.0
Lake County, IN 77.5 77.4
Cook County, IL 77.0 75.0
Bottom Line by Monitor … Before and After Scenario A3
Page 10
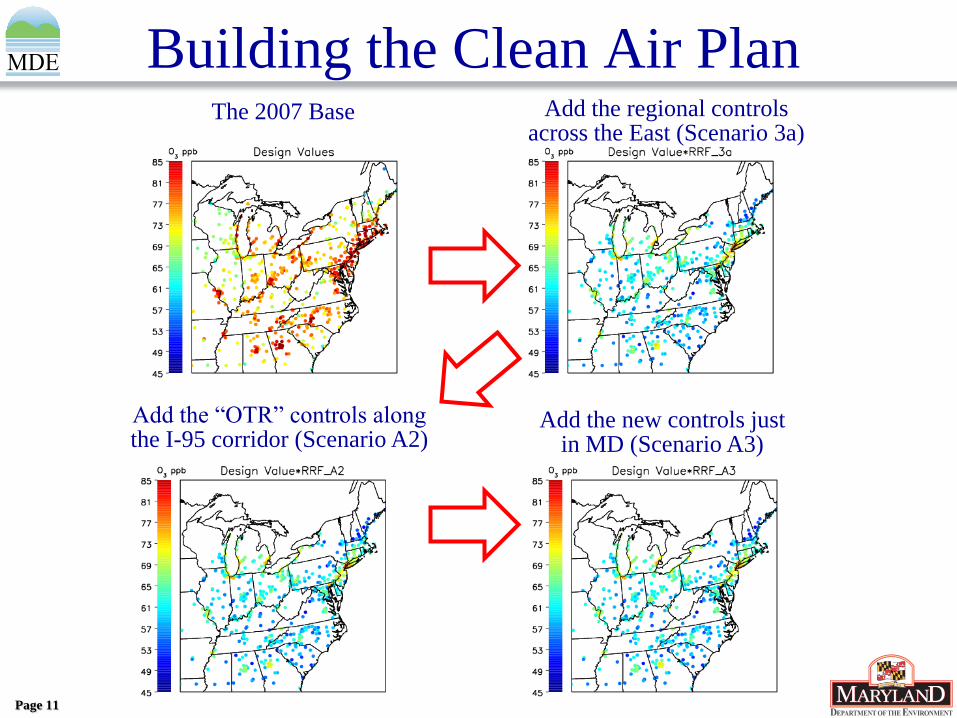
Building the Clean Air Plan The 2007 Base
Page 11
Add the “OTR” controls along the I-95 corridor (Scenario A2)
Add the regional controls across the East (Scenario 3a)
Add the new controls just in MD (Scenario A3)
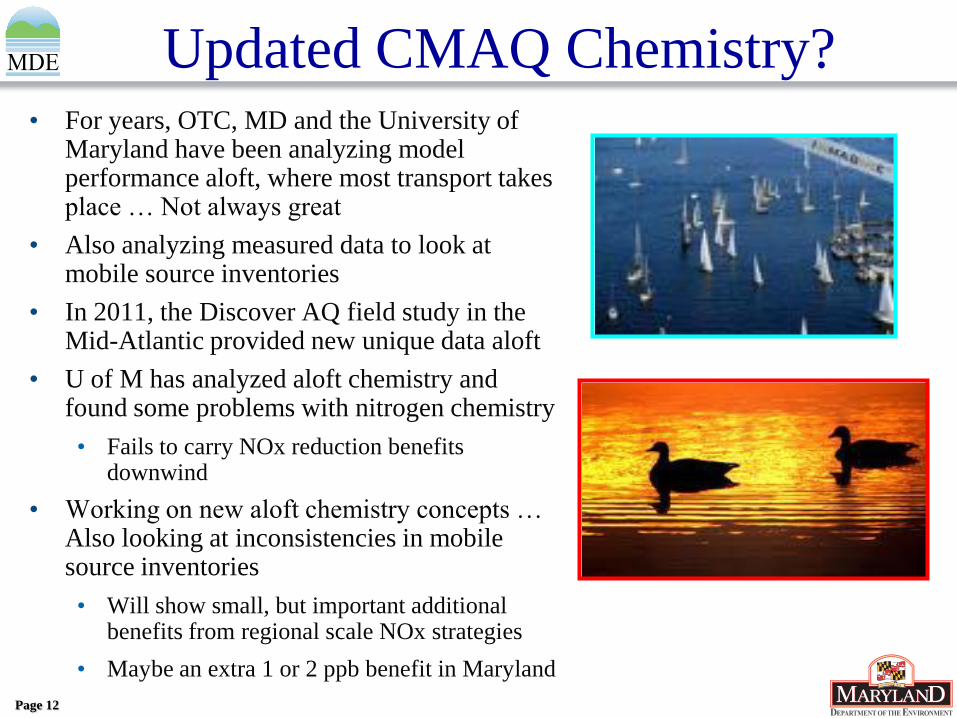
Updated CMAQ Chemistry? • For years, OTC, MD and the University of
Maryland have been analyzing model performance aloft, where most transport takes place … Not always great
• Also analyzing measured data to look at mobile source inventories
• In 2011, the Discover AQ field study in the Mid-Atlantic provided new unique data aloft
• U of M has analyzed aloft chemistry and found some problems with nitrogen chemistry
• Fails to carry NOx reduction benefits downwind
• Working on new aloft chemistry concepts … Also looking at inconsistencies in mobile source inventories
• Will show small, but important additional benefits from regional scale NOx strategies
• Maybe an extra 1 or 2 ppb benefit in Maryland
Page 12
• Scenario A3 includes control measures to address local emissions and transport. It includes the following:
• Implementation of the federal Tier 3 vehicle and fuel standards across the East
• Implementation of all “on-the-books” federal control programs across the East
• Implementation of new and old “Inside the Ozone Transport Region” control measures like the new OTC Aftermarket Catalyst initiative and continued implementation of California car standards
• Implementation of new local measures in certain states like Maryland, Connecticut and New York
• Good Neighbor SIPs or commitments from 10 upwind states to insure that power plants run previously purchased controls during the core summer ozone season
A Little More Detail on Attainment Run 3
Page 13
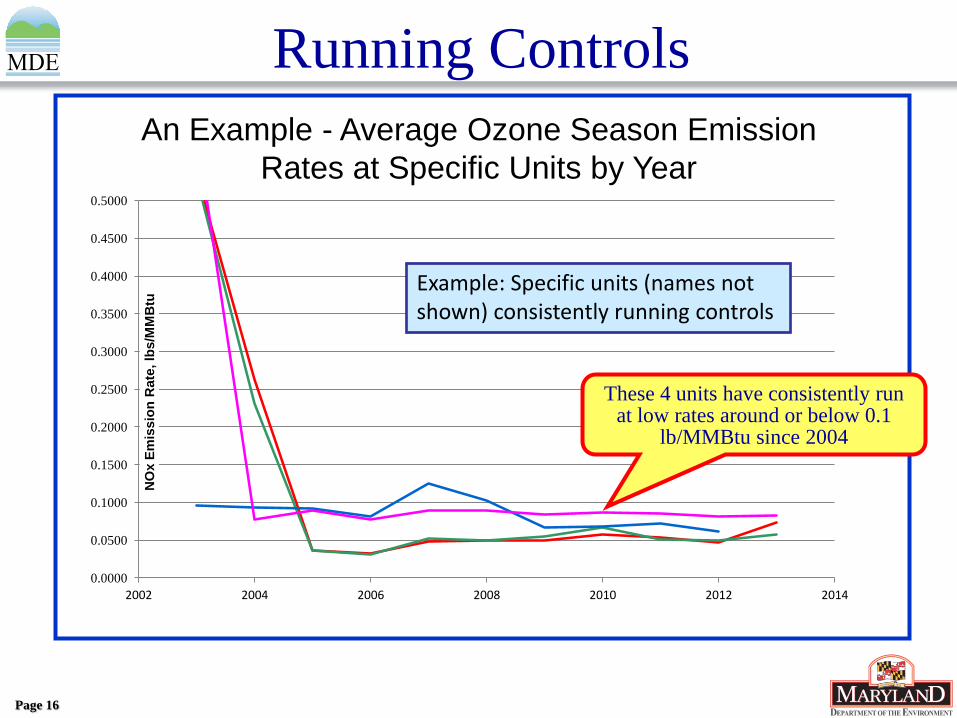
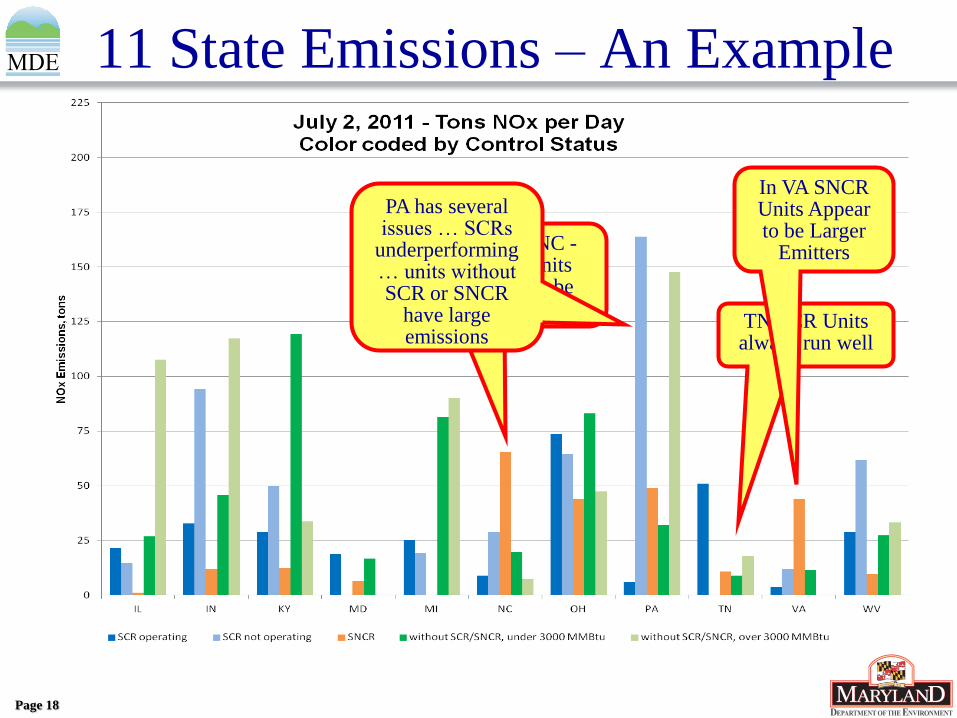
• OTC, MD and several other states have analyzed power plant (Electric Generating Unit or EGU) emissions data from Continuous Emissions Monitors (CEMS) to see how well existing pollution controls are being run
• This data is managed by EPA’s Clean Air Markets Division (CAMD)
• Changes in the energy market, a regulatory system that is driven by ozone season tonnage caps and inexpensive NOx allowances have created an unexpected situation where many EGU operators can meet ozone season tonnage caps without operating their control technologies efficiently
• Sometimes not at all
Running Power Plant Controls Effectively
Page 14
• Building from work performed by the OTC SAS Committee, MD began its data analyses in late 2012
• Looked at EGUs in the 9 upwind states named in the 176A Petition (IL, IN, KY, NC, MI, OH, TN, VA, WV) … MD and PA
• Primary data used was CAMD CEM data from sources and state supplied ERTAC EGU data to capture projected changes between 2012 and 2018
• Shared drafts of the data analyses with other states multiple times
• Included updates and new information as provided
• Analyzed data between 2002 and 2014 and conducted detailed daily analyses for a 2011 and 2012 ozone episode
• The episodes analyzed capture two of the worst ozone periods in 2011 and 2012
• Other states, like Wisconsin and Delaware have done similar analyses and reached similar conclusions
The EGU Data Analyses
Page 15
0.0000
0.0500
0.1000
0.1500
0.2000
0.2500
0.3000
0.3500
0.4000
0.4500
0.5000
2002 2004 2006 2008 2010 2012 2014
NO
x E
mis
sio
n R
ate
, lb
s/M
MB
tu
An Example - Average Ozone Season Emission
Rates at Specific Units by Year
Example: Specific units (names not shown) consistently running controls
Running Controls
Page 16
These 4 units have consistently run at low rates around or below 0.1
lb/MMBtu since 2004
0.0000
0.0500
0.1000
0.1500
0.2000
0.2500
0.3000
0.3500
0.4000
0.4500
0.5000
2002 2004 2006 2008 2010 2012 2014
NO
x E
mis
sio
n R
ate
, lb
s/M
MB
tu
An Example - Average Ozone Season Emission
Rates at Specific Units by Year
Example: Specific units (names not shown) not running controls in later years.
Not Running Controls as Well
Page 17
These 3 units have been running at higher rates since 2009
11 State Emissions – An Example
Page 18
TN SCR Units always run well
In VA SNCR Units Appear to be Larger
Emitters Same in NC - SNCR Units Appear to be
Larger Emitters
PA has several issues … SCRs
underperforming … units without SCR or SNCR
have large emissions
Reductions That Could Have Been Achieved
Page 19
… An Example - 11 State Total
Average daily reductions that could have
been achieved … about 490 tons per day
• Maryland has performed several very preliminary model runs to look at how much running EGU controls inefficiently might increase ozone levels
• Three runs:
• Scenario 2B – Total Benefit
• What is the total incremental benefit provided by current SCR and SNCR controls
• Scenario 3B – A worst data run
• Assumes SCR and SCR units all run at worst rates seen in CAMD data - 2005 to 2012
• Scenario 3C – Based upon CAMD data analysis for actual EGU performance in 2011 and 2012
• Assumes that units that had higher ozone season emission rates were operating at the best ozone season rates observed since 2005
How Might This Affect Ozone?
Page 20
These are Preliminary Runs …
Page 21
… as the modeling improves some of the details will change, but the overall conclusions will not
• These are sensitivity runs
• They are not perfect, but they are clearly meaningful and policy relevant
• From our 2007 platform
• One month screening runs
• Input data continues to be enhanced
Total Benefit from Controls
Page 22
… Current SCR and SNCR controls
• Difference plot … 2018 with and without controls
Domain Wide Concentrations
Preliminary
Page 23
• Difference plot … DVs … 2018 with and without controls
Difference in Design Values
Preliminary
Total Benefit from Controls - DVs
… Current SCR and SNCR controls
Lost Ozone Benefits – Worst Data
Page 24
… SCR or SNCR controls run at highest rates in CAMD data
• Difference plot … DVs … 2018 with and without controls
Difference in Design Values
Preliminary
Lost Ozone Benefits – 2011/2012
Page 25
… based upon 2011 and 2012 CAMD EGU performance data
• Difference plot … DVs … 2018 with and without controls
Difference in Design Values
Preliminary
26
Most Difficult
Monitors
Increased Ozone in 2018 – 2 EGU
Control Scenarios
County
Using worst rate
CAMD Data
(Scenario 3B)
Using actual
2011/2012 Data
(Scenario 3C)
Harford, MD 1.2 0.5
Prince Georges, MD 1 0.5
Fairfield, CT 0.3 0.1
New Castle, DE 0.8 0.4
Bucks, PA 0.6 0.4
Suffolk, NY 0.4 0.2
Camden, NJ 0.5 0.3
Fairfax, VA 1 0.5
Franklin, OH 1.7 1
Fulton County, GA 0.3 0.2
Wayne, MI 0.5 0.2
Sheboygan, WI 0.1 0.1
Mecklenberg Co, NC 1.8 1.2
Knoxville, TN 0.7 0.5
Jefferson County, KY 2 1.5
Lake County, IN 0.2 0.1
Cook County, IL 0.2 0.1
Potential Lost Ozone Benefit in PPB
Page 26
Preliminary
27
Projected to be
Clean in 2018 …
Potentially at Risk
Increased Ozone in 2018 – 2 EGU
Control Scenarios
County
2018 – Controls
Running Well
(Scenario 3A)
Using worst rate
CAMD Data
(Scenario 3B)
Using actual
2011/2012 Data
(Scenario 3C)
Blair, PA 58.7 64 62.7
Armstrong, PA 66.4 70.7 68.8
Washington, OH 60.1 68.9 66.2
Warren, OH 68.8 72.1 70.9
Kanawa, WV 64.5 67.8 66.3
Monogolia, WV 61.4 64.4 63.1
Oldham, KY 67.2 70.2 69.1
Boone, KY 57.5 64.7 61.6
Campbell, KY 61.6 64.3 63.3
Greene, IN 61.8 67.3 65.2
Vanderburgh, IN 62.3 65.8 64.7
Person, NC 60.2 71.7 63.6
Garrett, MD 58.7 62.6 61.1
Potential Lost Ozone Benefits – Clean Monitors
Page 27
… EPA will propose a new ozone standard soon … 60 to 70 ppb range … designations to most likely be based upon 2014 to 2016 or 2015 to 2017 data
Greater than 70 ppb 65 to 70 ppb 60 to 65 ppb
Preliminary
Next Steps With this Modeling
• Run for full ozone season
• Run some regional sensitivity tests
• Run with enhanced chemistry and mobile source adjustments from research
• This will show slightly greater loss of benefit from not always running controls effectively
• Run with 2011/2018 Platform ASAP
• Work with the Midwest Ozone Group (MOG) on this issue
• Modeling and potential solution
• Continue to refine as part of the Maryland Attainment SIP
Page 28
How Do We Move Forward?
• Preliminary discussions with other
states and EGU operators have
been very positive
• Maryland believes that a collaborative
solution is within reach
• Clearly continue the technical
collaboration at the Air Director
level with other states
• Continue Commissioner level
discussions
• Work towards a resolution by the
end of 2014 or early 2015 Page 30
A Closing Comment
0
20
40
60
80
100
1980 1983 1986 1989 1992 1995 1998 2001 2004 2007 2010 2013
Maryland 8-hour Ozone Exceedances and ≥ 90 °F Days at BWI
Ozone Exceedances 90 Degree Days
• In 2014, the Baltimore area recorded the lowest ozone levels seen in the last 30 years
• Yes … it was also one of the coolest and climatologically different summers we’ve ever seen
• The ozone was so low we believe that the data for our worst monitor … the Edgewood monitor … in the past, the highest reading monitor east of the Mississippi … may be meeting the standard
• Cool weather is not the only reason we’ve seen such low ozone
• Many emission reduction programs have clearly helped – local and regional emissions were low in 2014
• We did not see the traditional weather patterns in MD that transports ozone and precursors from the south and west … i.e. … We had no transport
• Unfortunately
• The weather patterns appear to have not been so kind to CT. Transport weather patterns shifted to the north in 2014
• Our research also shows us that ozone weather cycles in 3 to 4 year periods from “cool and friendly” to “hot and unfriendly” - 2014 was at the friendliest part of the current cycle
Thanks … Questions?
Page 32