60
Road Weather and Transportation Systems Rhonda Young, P.E., PhD Associate Professor Dept. of Civil & Arch. Engineering Portland State University April 18, 2014
| Date post: | 14-Apr-2017 |
| Category: |
Engineering |
| Upload: | trec-at-psu |
| View: | 363 times |
| Download: | 5 times |

Road Weather and Transportation Systems
Rhonda Young, P.E., PhDAssociate Professor
Dept. of Civil & Arch. Engineering
Portland State UniversityApril 18, 2014
Engineering Perspective of Road Weather
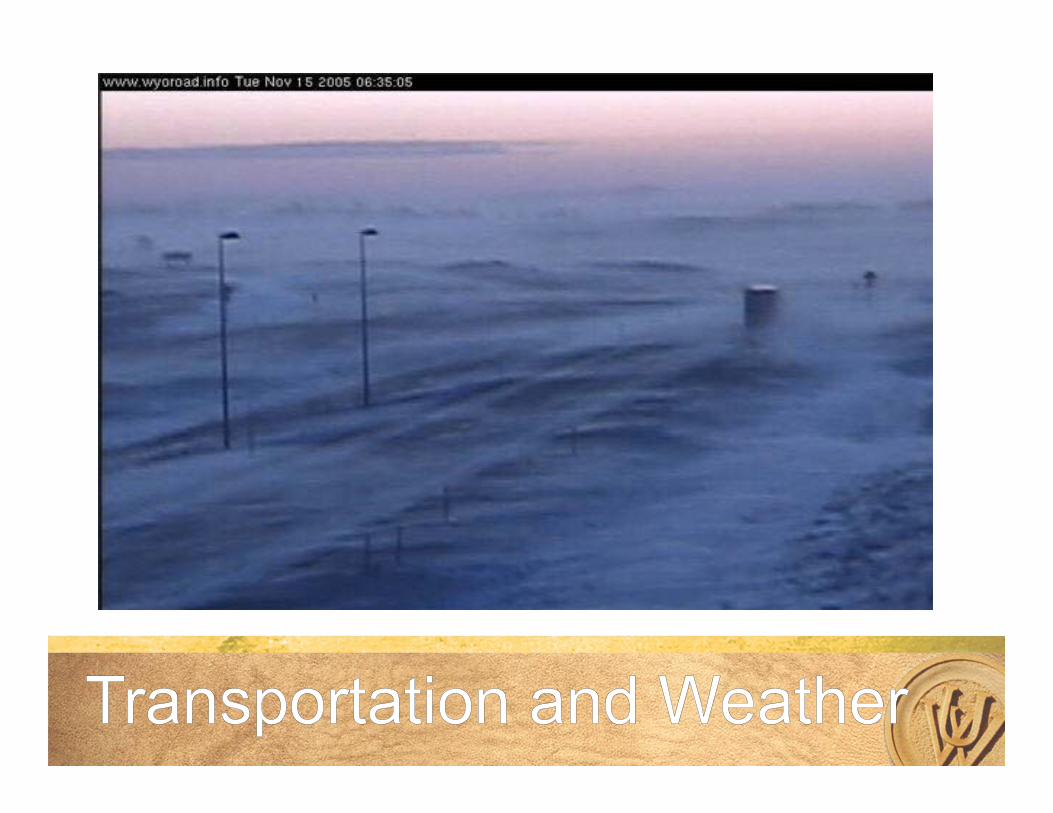
• How does weather impact transportation systems?
• As engineers, is there anything we can do to mitigate these impacts?
Meteorological Perspective of Road Weather
• What weather information do engineers need to make their systems work safer and more efficiently?
• How does this information differ from typical weather forecasts?
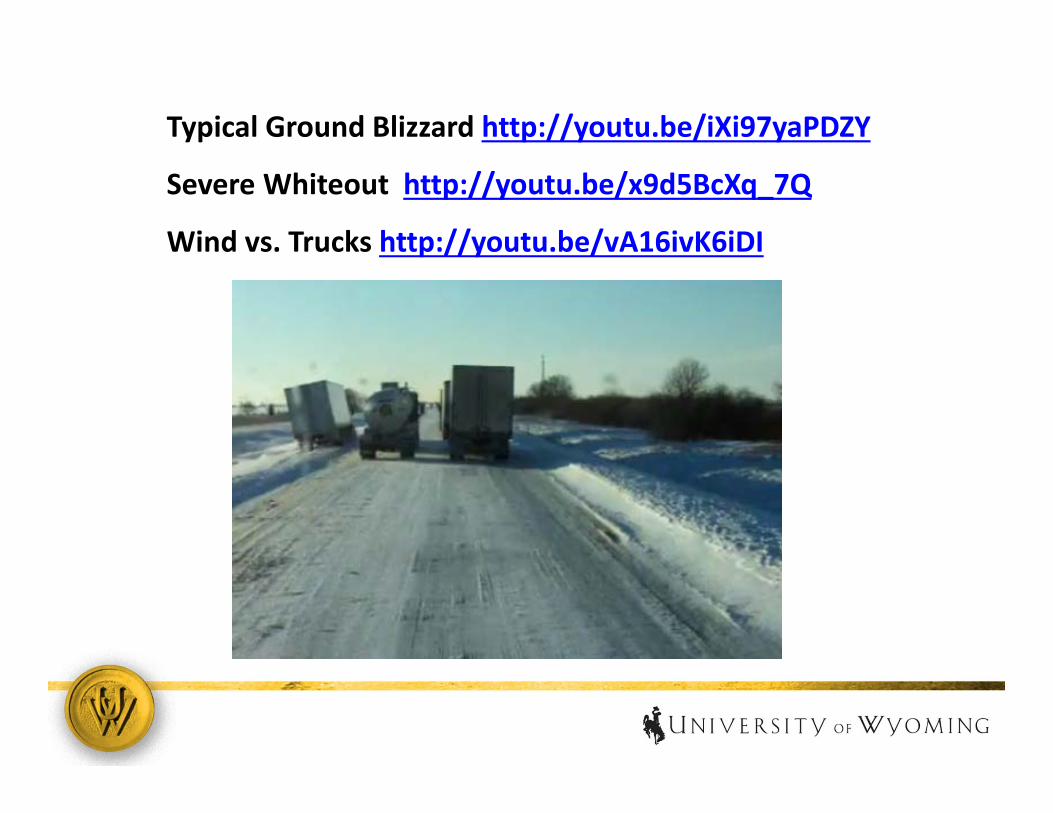
Typical Ground Blizzard http://youtu.be/iXi97yaPDZY
Severe Whiteout http://youtu.be/x9d5BcXq_7Q
Wind vs. Trucks http://youtu.be/vA16ivK6iDI
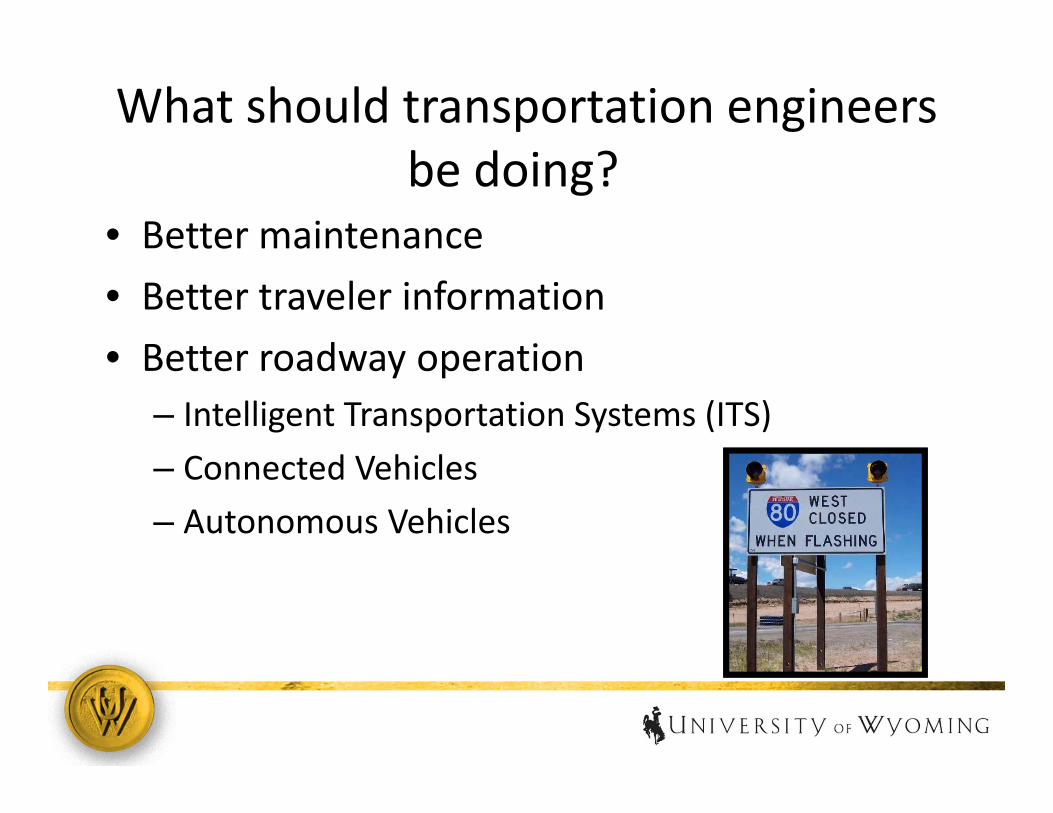
What should transportation engineers be doing?
• Better maintenance• Better traveler information• Better roadway operation
– Intelligent Transportation Systems (ITS)– Connected Vehicles– Autonomous Vehicles
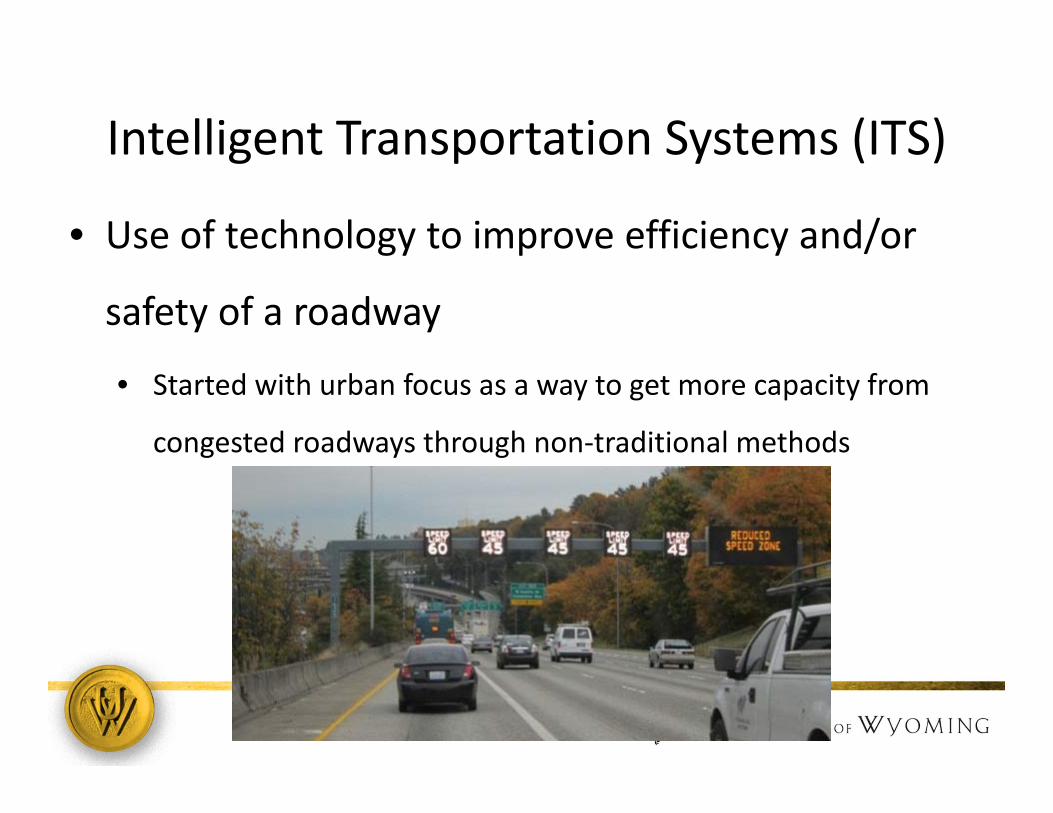
Intelligent Transportation Systems (ITS)
• Use of technology to improve efficiency and/or
safety of a roadway
• Started with urban focus as a way to get more capacity from
congested roadways through non‐traditional methods
Intelligent Transportation Systems (ITS)
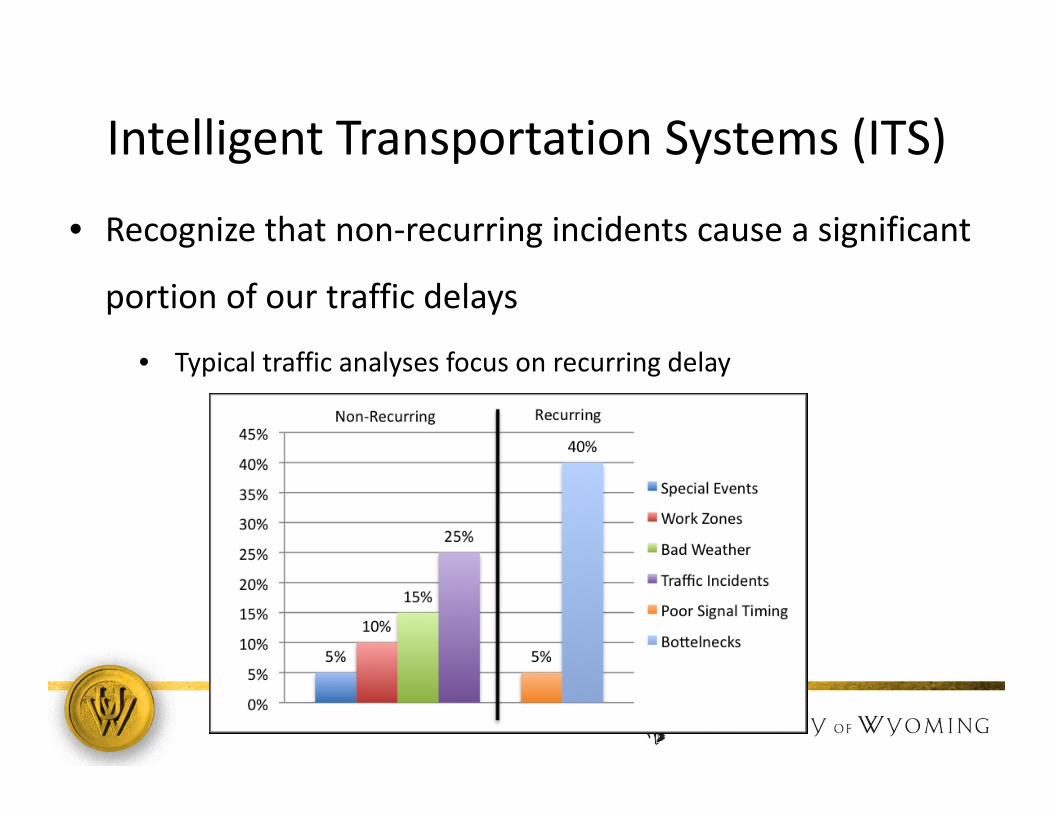
• Recognize that non‐recurring incidents cause a significant
portion of our traffic delays
• Typical traffic analyses focus on recurring delay
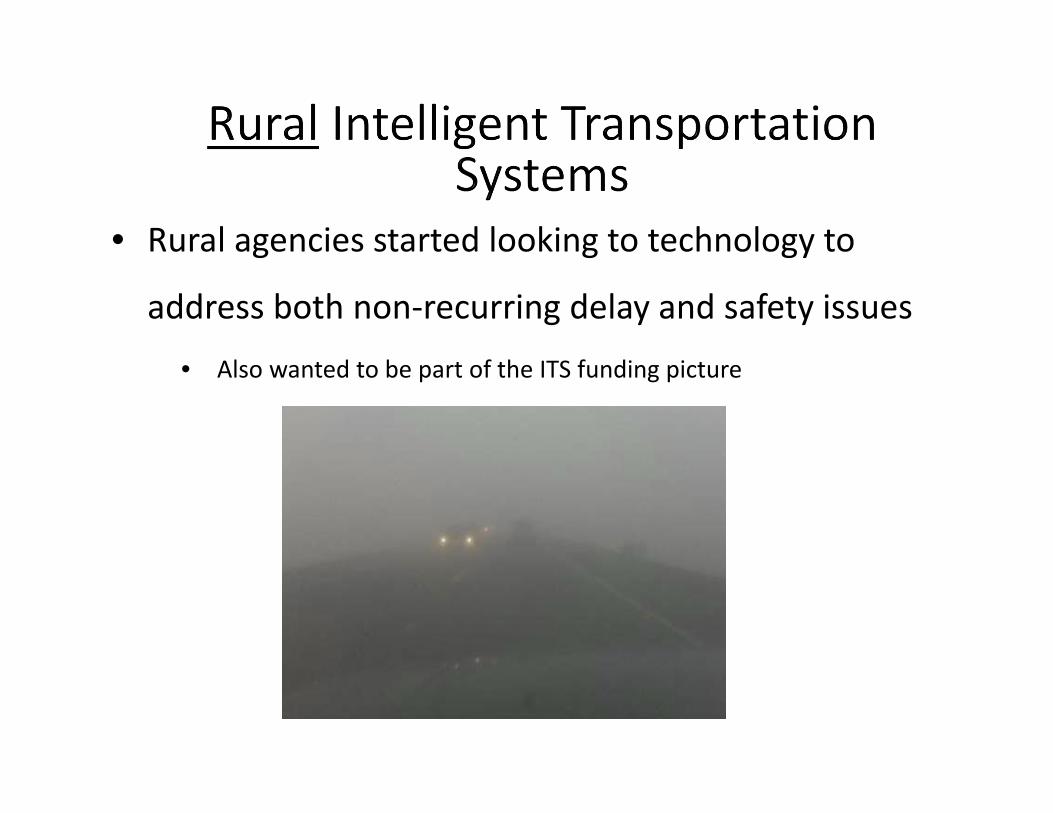
• Rural agencies started looking to technology to
address both non‐recurring delay and safety issues
• Also wanted to be part of the ITS funding picture
• How would ITS improve safety on a rural
roadway?
• During weather events specifically?
• How would ITS reduced delay due to non‐
recurring conditions?
• During weather events specifically?
• Challenges specific to rural weather events• Fast moving weather events
• Severe weather events
• Severity of crash can be worsened by environmental conditions and
long delays in emergency help
• Can be difficult to gauge severity of weather at decision points
• Long distances between decision points
• Weather events can be highly localized making detection difficult
• What components are necessary to a rural ITS to
address weather events?
• Technology to detect the weather
• Method of getting weather information to the public
• Control system to operate roadway
• Change the speed limit
• Introduce warning signs
• Spray bridge decks with anti/deicing
• Close the roadway to all or some vehicles
• Implement evacuations
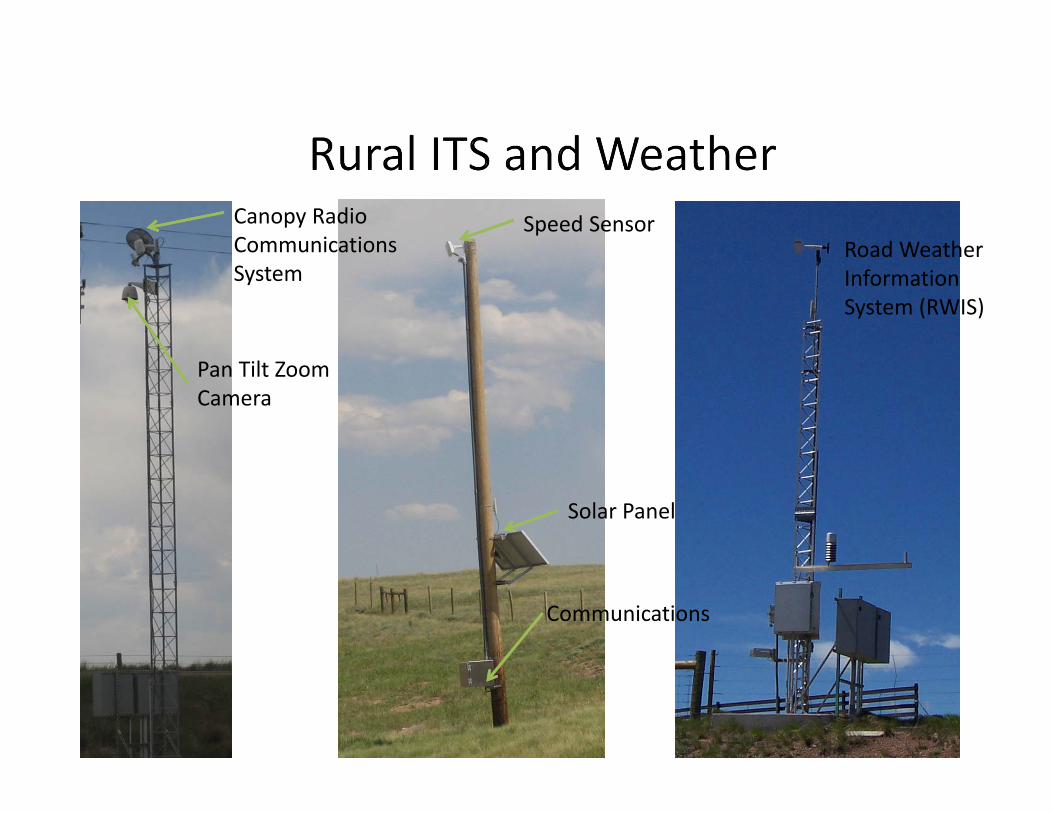
Pan Tilt Zoom Camera
Canopy Radio Communications System
Speed Sensor
Solar Panel
Communications
Road Weather Information System (RWIS)
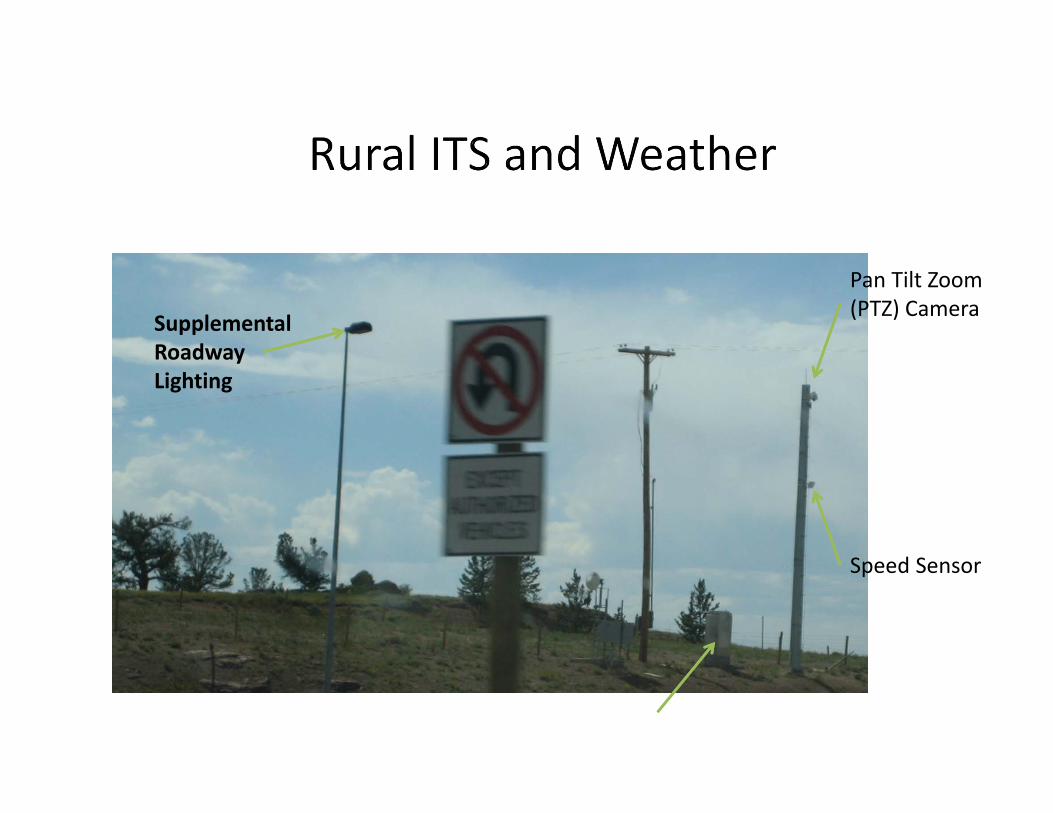
Pan Tilt Zoom (PTZ) CameraSupplemental
Roadway Lighting
Communications & Power
Speed Sensor
• Technology to detect weather events
• Spacing of sensors
• Confidence in sensors ability to detect weather event
• Reliability in communication and power systems
• Durability of equipment
• Linking with road weather forecasts
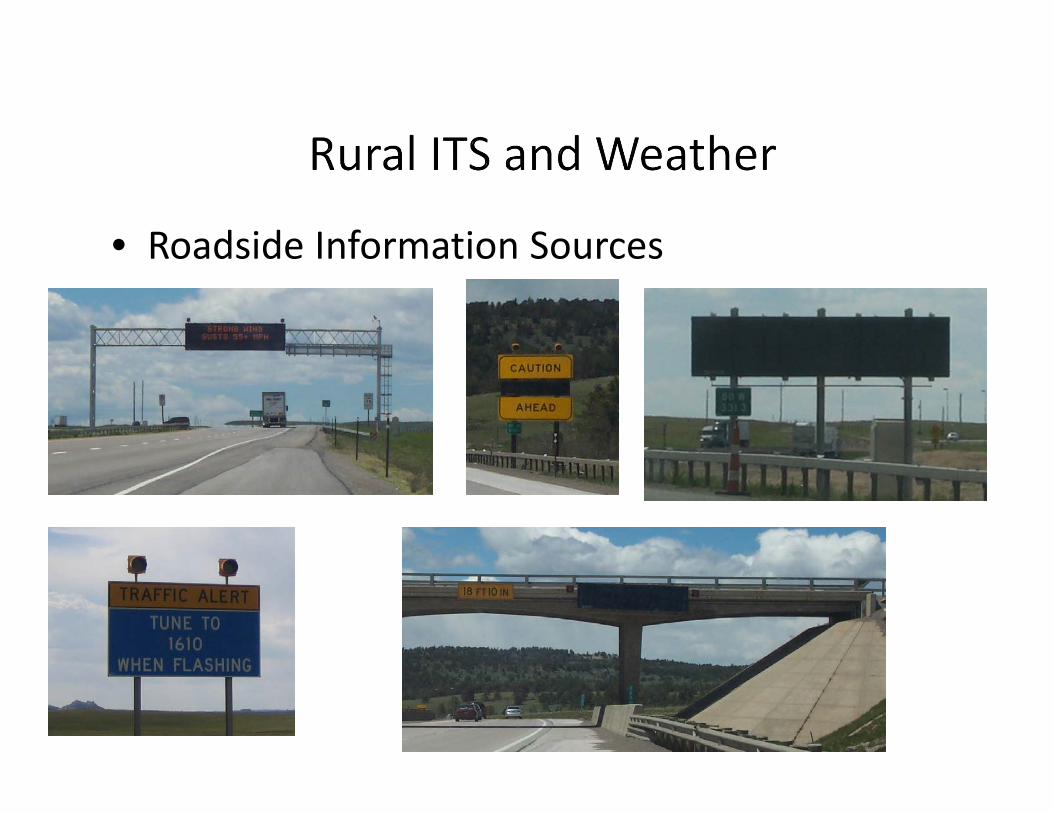
• Roadside Information Sources
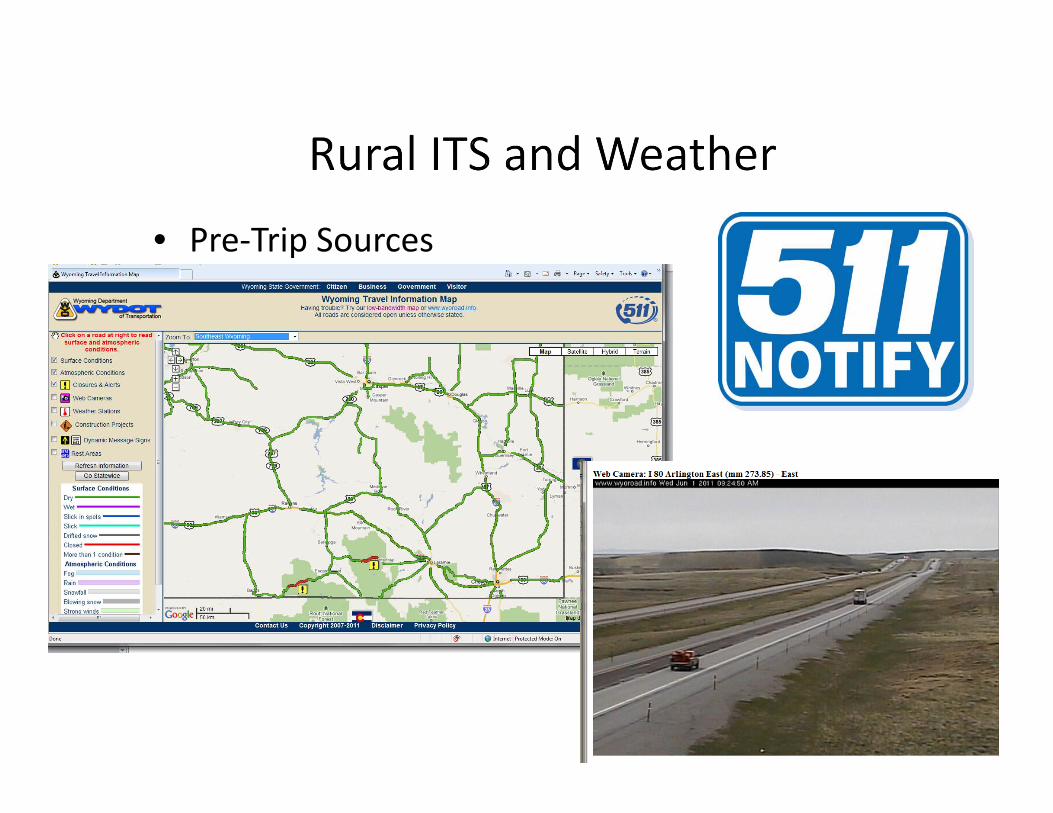
• Pre‐Trip Sources
• What about in‐vehicle technology (GPS units with
real time information, smart phone apps)?
• Emerging field for rural ITS applications but currently
limited
• May have promise for driving decision (lower speeds, turn
off cruise control) but more limited for go/no go/route
choice decisions in rural areas
• Control strategy for operating roadways
• Most challenging and innovative task for implementing ITS
• Large amounts of data to synthesis
• Need for the system to responsive and reliable
• What level of human operator interaction to system
operation is desirable?
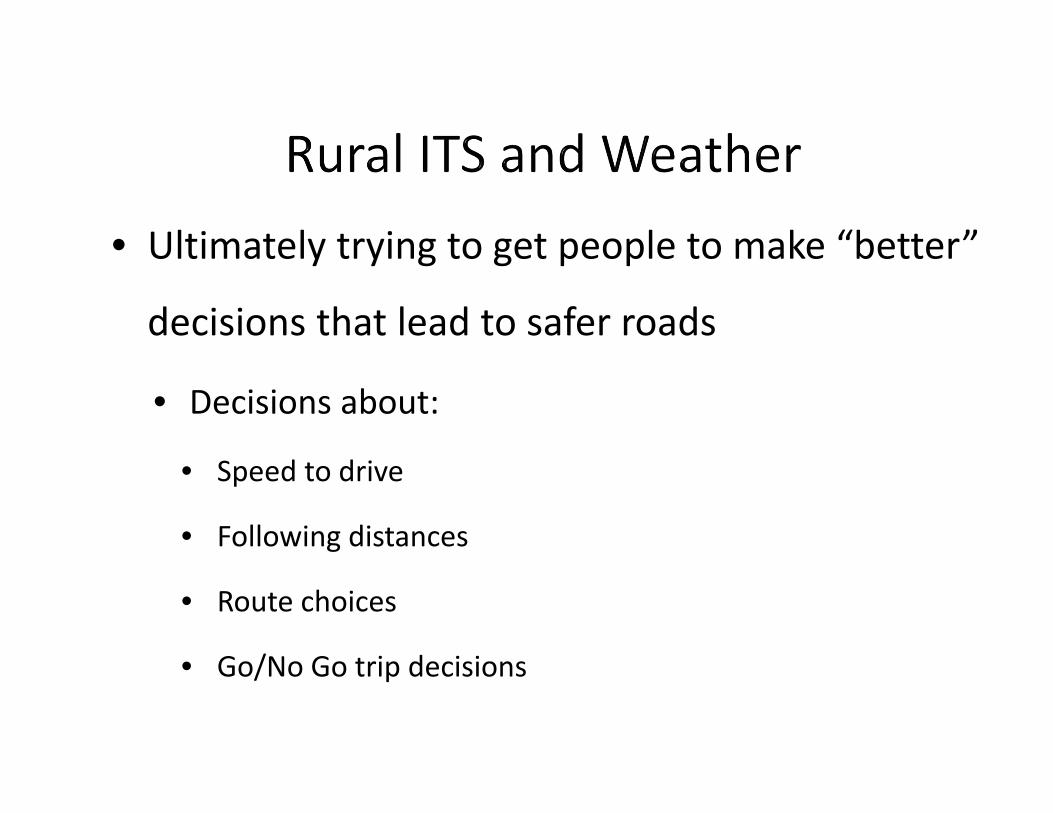
• Ultimately trying to get people to make “better”
decisions that lead to safer roads
• Decisions about:
• Speed to drive
• Following distances
• Route choices
• Go/No Go trip decisions
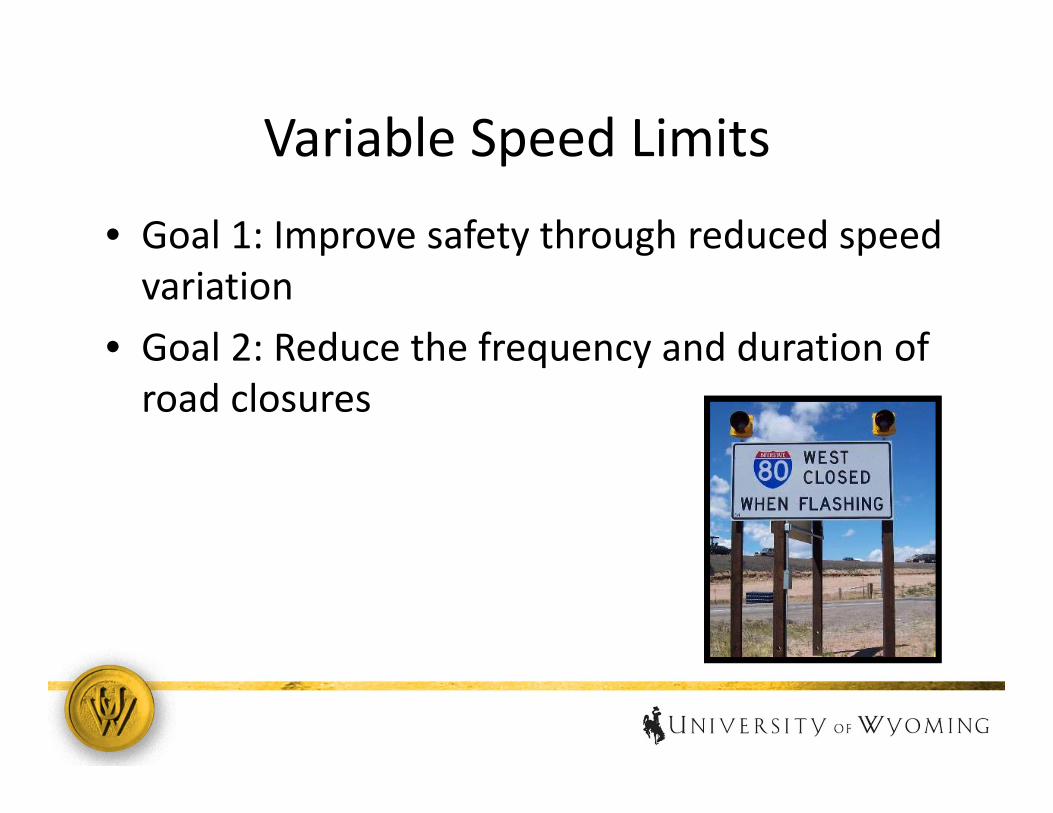
Variable Speed Limits
• Goal 1: Improve safety through reduced speed variation
• Goal 2: Reduce the frequency and duration of road closures

The Problem
• “Driving too fast for conditions” common factor in crashes– Difficult to enforce and often cited only after crash has occurred
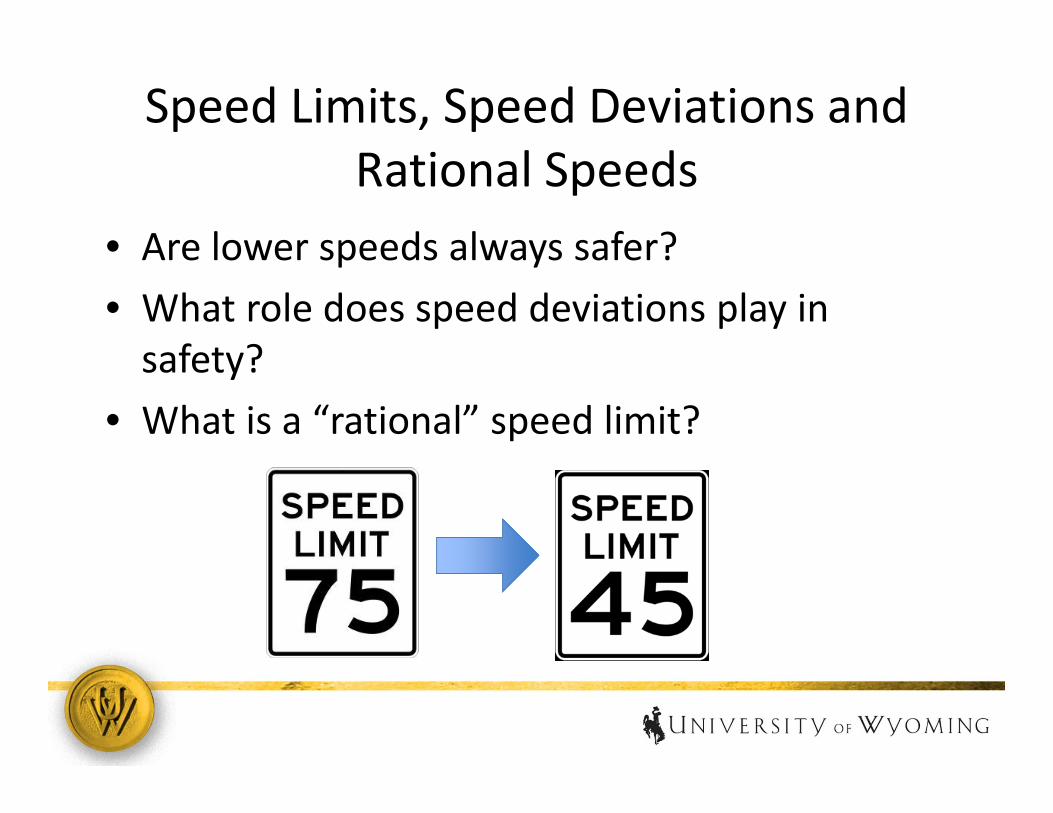
Speed Limits, Speed Deviations and Rational Speeds
• Are lower speeds always safer?• What role does speed deviations play in safety?
• What is a “rational” speed limit?
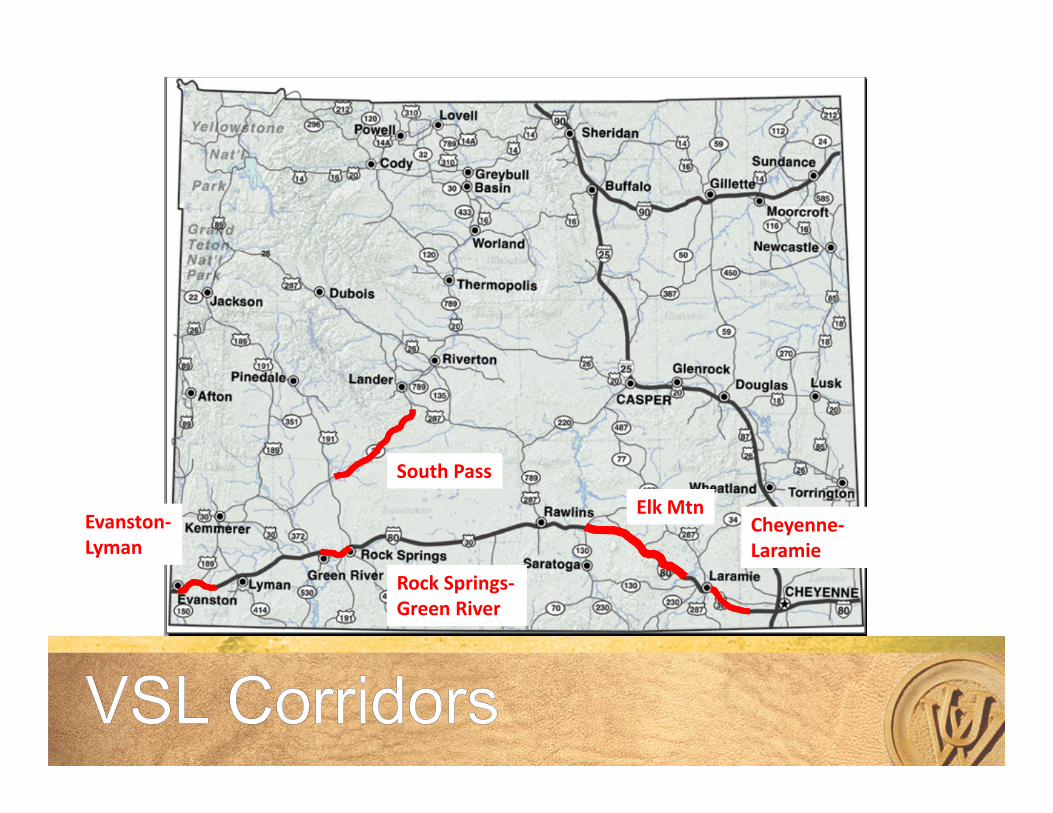
Elk Mtn
Rock Springs‐Green River
Evanston‐Lyman
Cheyenne‐Laramie
South Pass
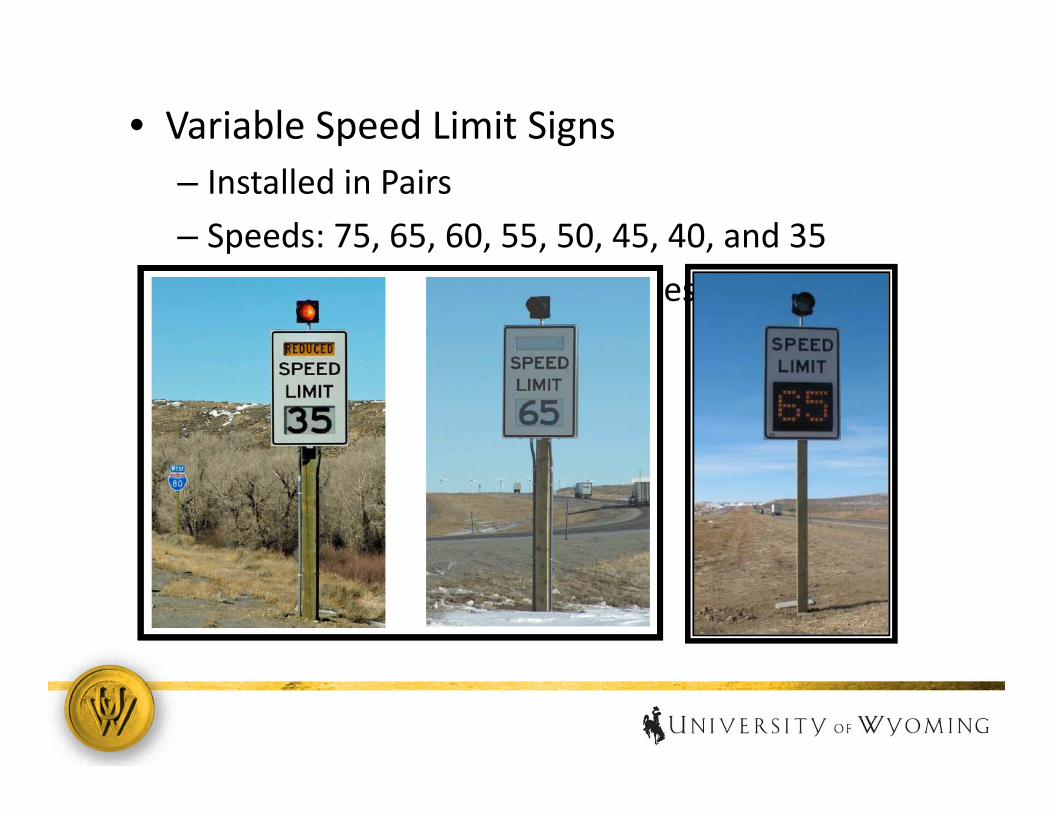
• Variable Speed Limit Signs– Installed in Pairs– Speeds: 75, 65, 60, 55, 50, 45, 40, and 35– Scrolling Film and LED sign types
27
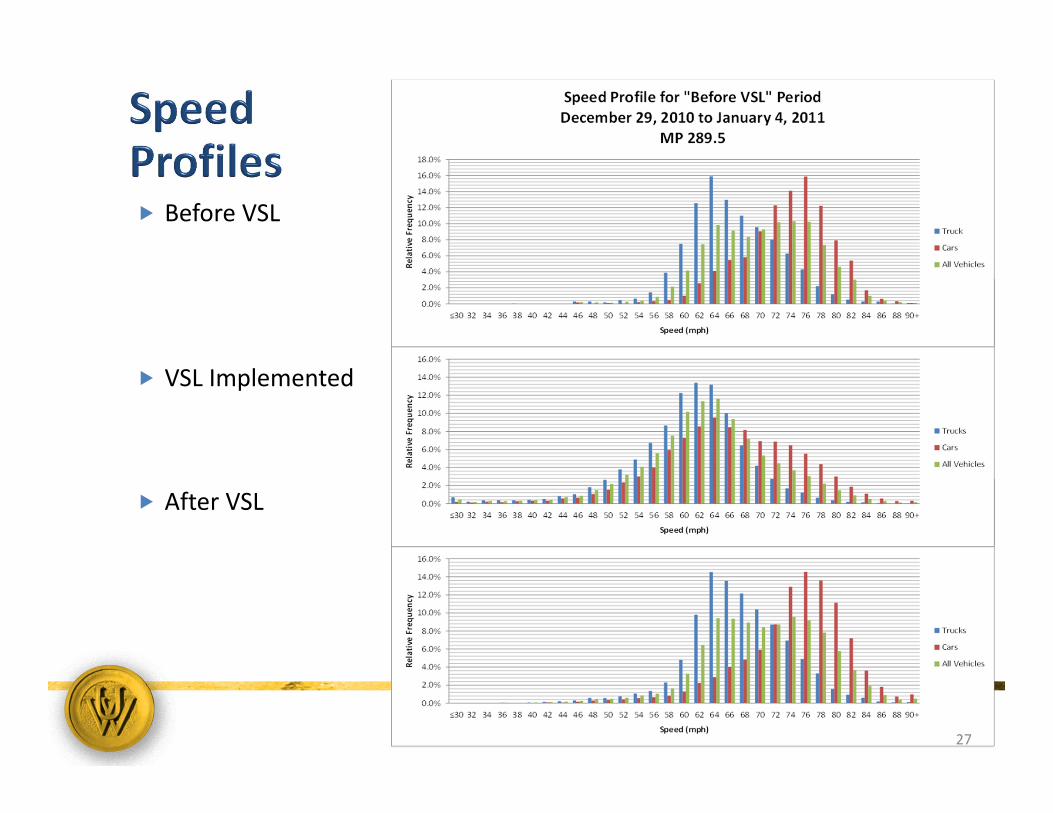
Before VSL
VSL Implemented
After VSL
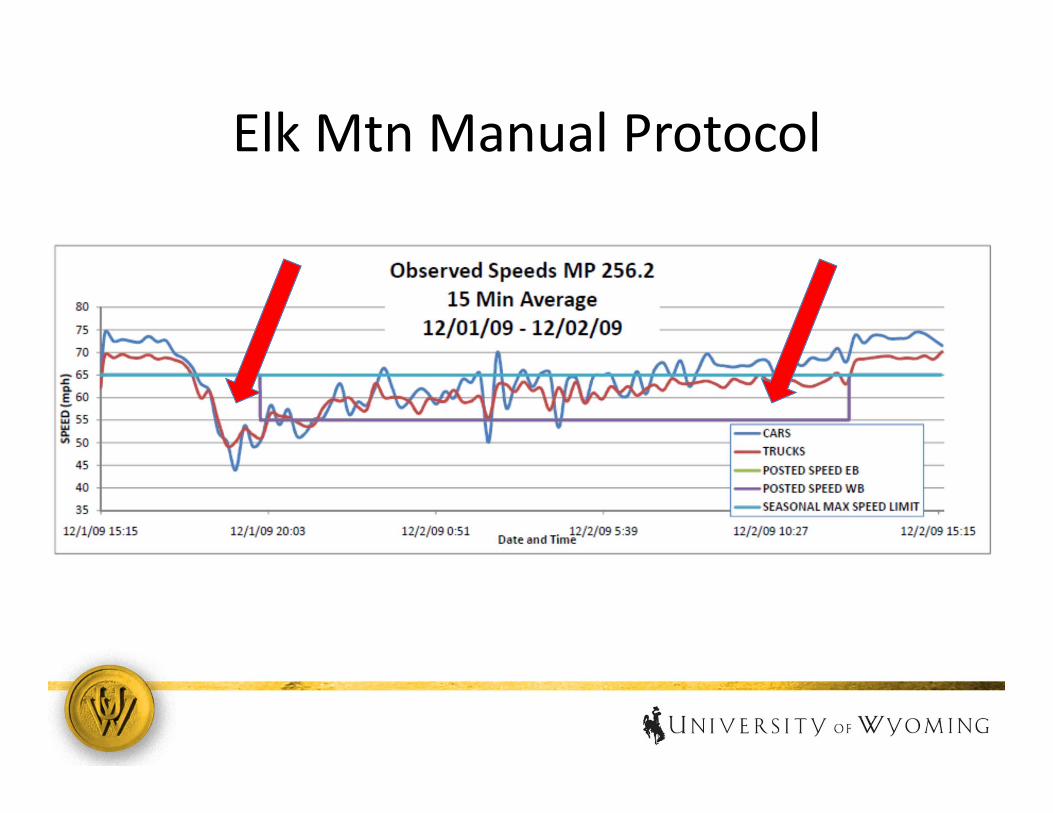
Elk Mtn Manual Protocol
• Can we improve performance of VSL system?– Faster response– Improve consistency for what speed limits are set?– More rational speed limits
• Would these changes improve speed compliance and further reduce speed variation?
Elk Mtn Manual Protocol
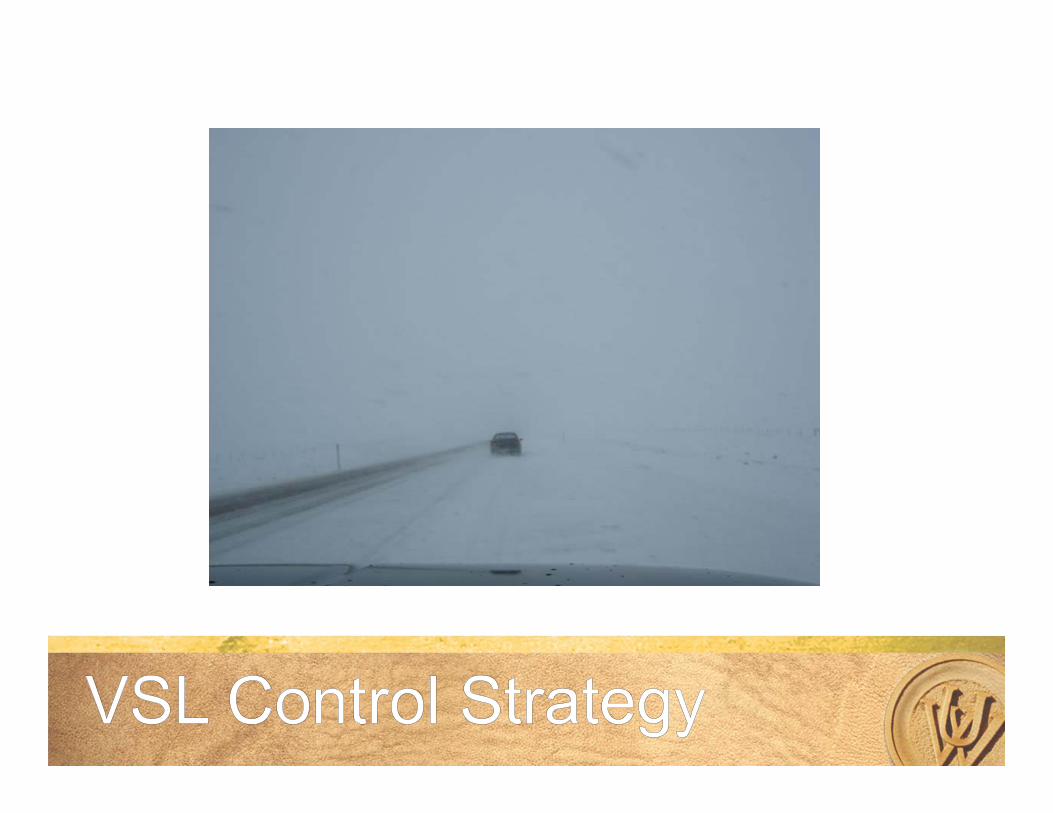
Control Strategy Objective
• Develop a methodology that automates speed
posting decisions based on real time observed
vehicle speeds and weather variables
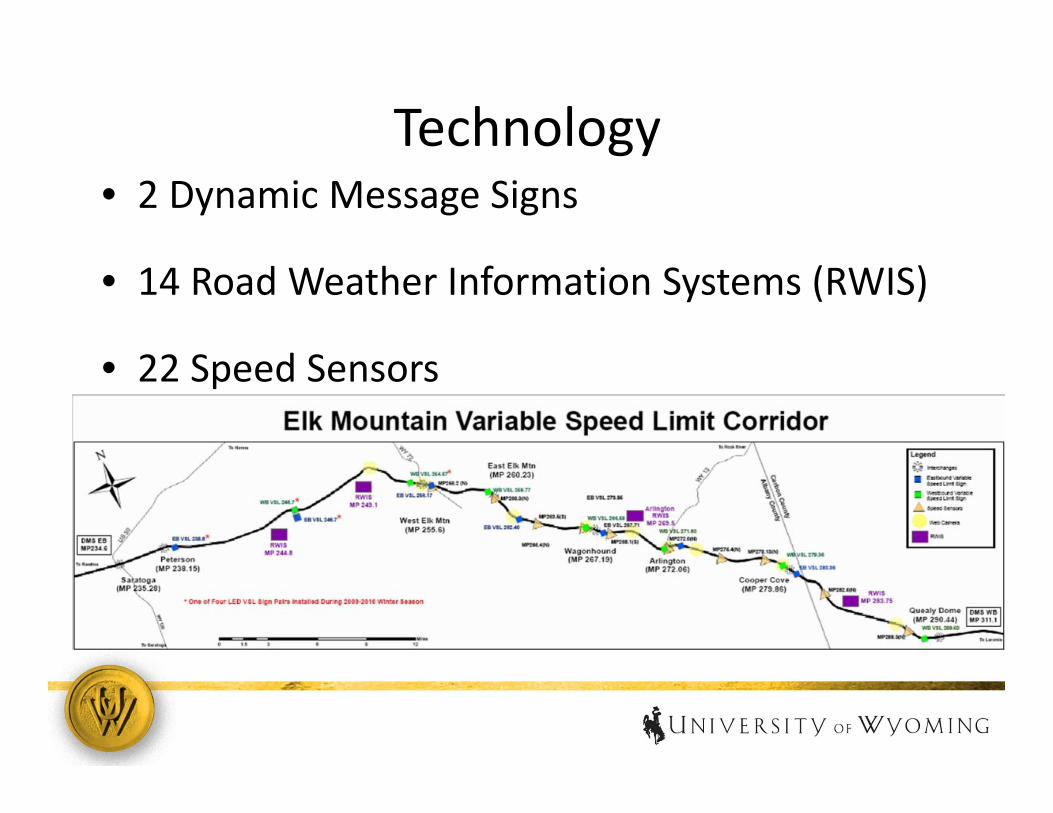
• 2 Dynamic Message Signs
• 14 Road Weather Information Systems (RWIS)
• 22 Speed Sensors
Technology
METHODOLOGY
• Algorithm includes
– Speed Perspective
– Weather (RWIS) Perspective
METHODOLOGY
• Speed Perspective
– Data Source – speed sensors
– Updates recommended speed limit every 15 minutes
– Variables used – traffic count, observed speed (mph)
– Independent of weather variables
METHODOLOGY
• Weather Perspective
– Data Source – RWIS
– Updates recommended speed limit every 15 minutes
– Variables used – pavement surface condition, surface
temperature, RH, average wind speed and visibility
– Independent of speed observations
– Utilizes Regression Tree Methodology
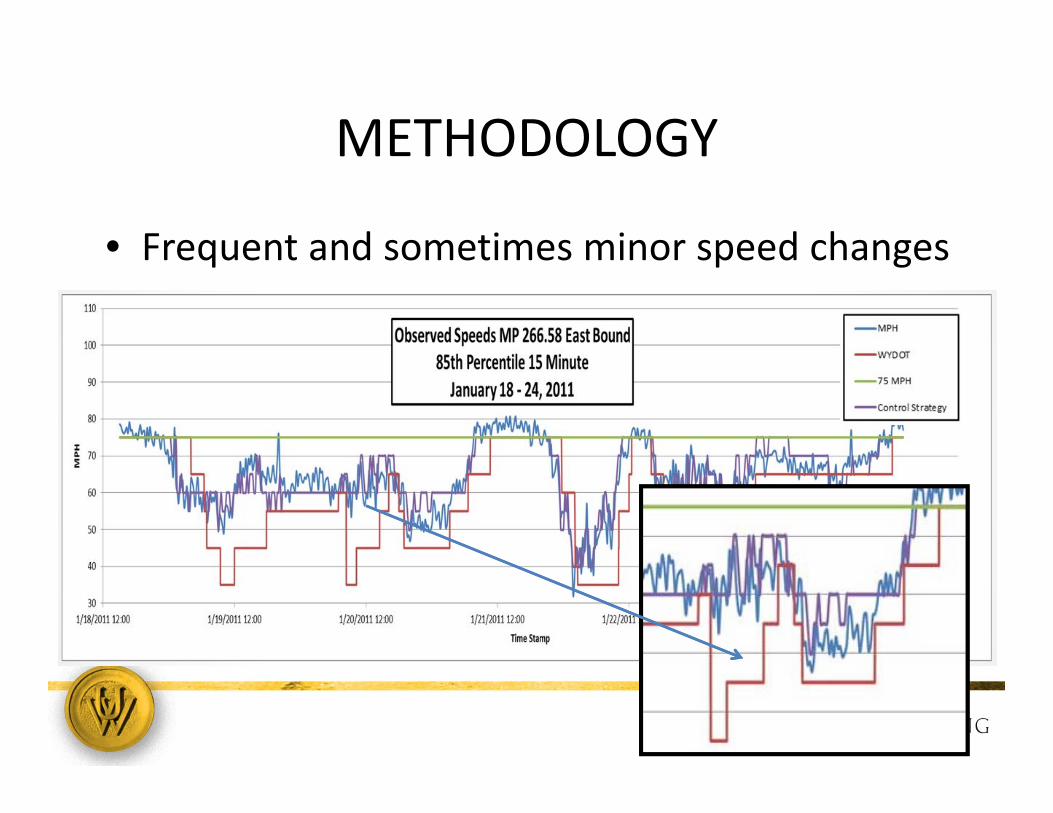
METHODOLOGY
• Frequent and sometimes minor speed changes
Observations
• Simulation experiments run of storm events
with and without automated control strategy
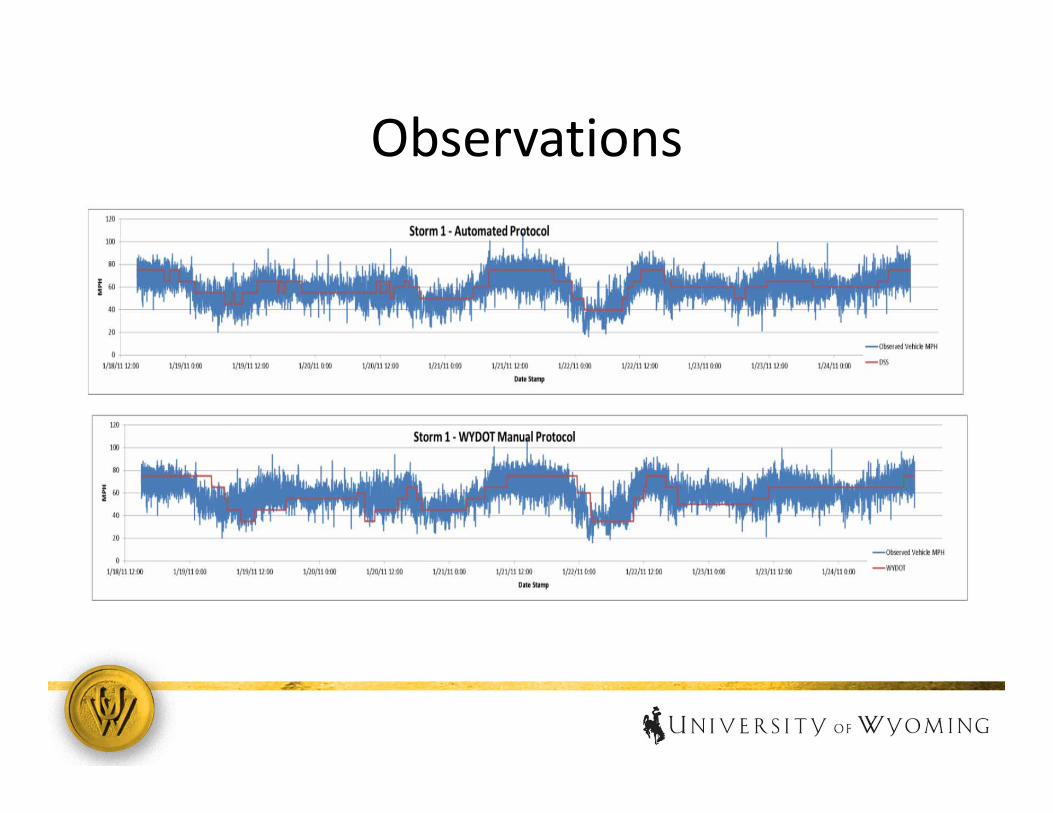
Observations
OBSERVATIONS
• Higher speed compliance and reduced speed
variance under automated protocol.
• Automated speed limit recommendations are
more responsive to changing conditions.
• Higher speed limit change frequency.
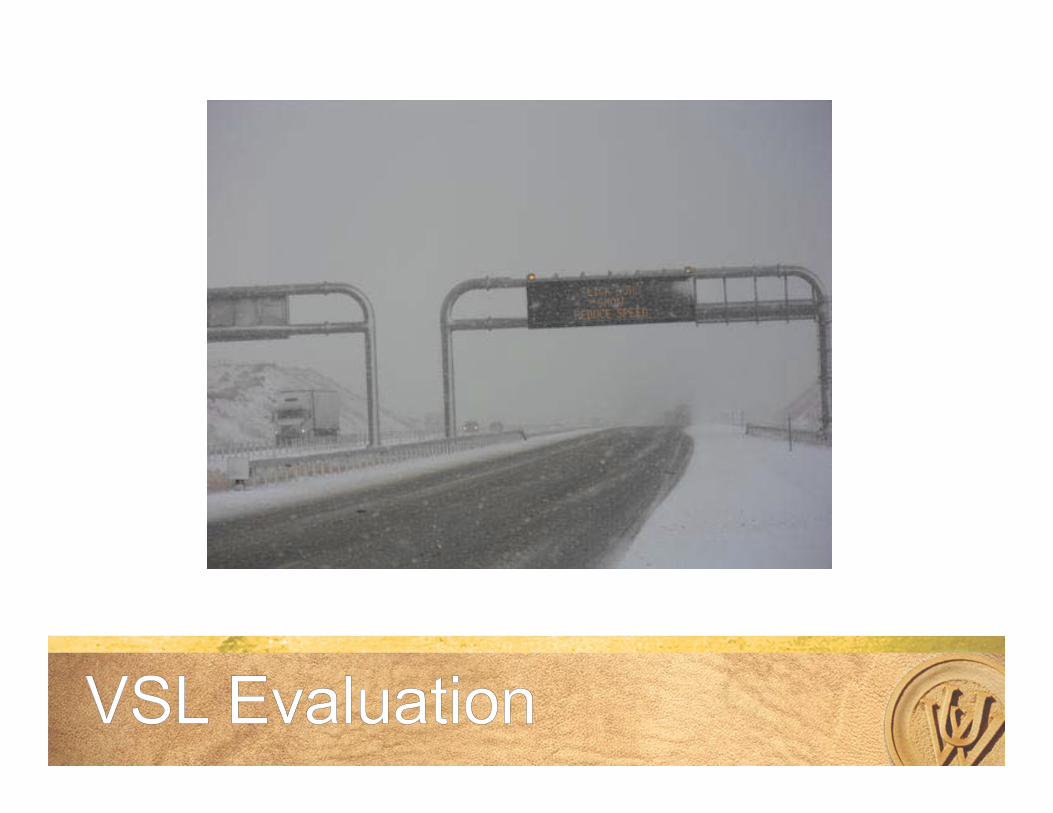

Evaluation of VSL Corridors
• Level of Speed Compliance and Speed
Variation
• Crash Analysis
• Road Closure Analysis
Speed Compliance and Variation Analyses
1. 85th Percentile Speeds2. Standard Deviation3. Further Analyses of Standard Deviation and
Speeds4. Speed Compliance5. Speed Profiles6. Statistical Analysis (Linear Regression)
Speed Compliance and Variation Analyses
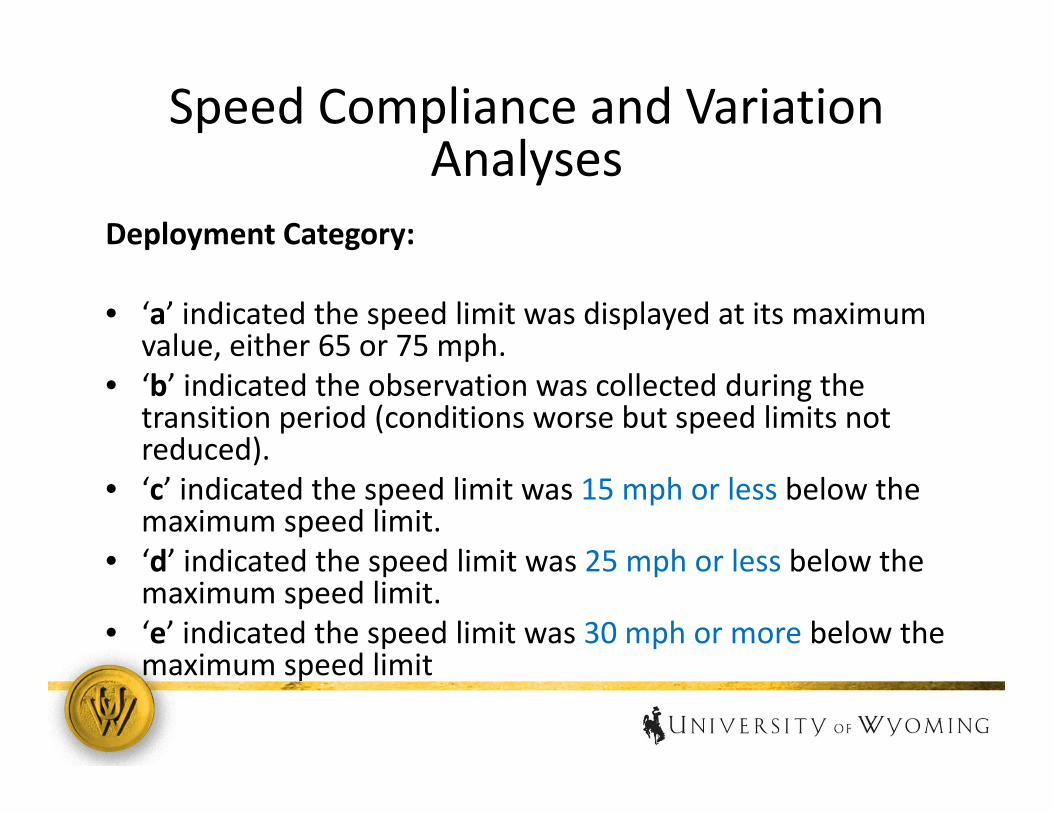
Deployment Category:
• ‘a’ indicated the speed limit was displayed at its maximum value, either 65 or 75 mph.
• ‘b’ indicated the observation was collected during the transition period (conditions worse but speed limits not reduced).
• ‘c’ indicated the speed limit was 15 mph or less below the maximum speed limit.
• ‘d’ indicated the speed limit was 25 mph or less below the maximum speed limit.
• ‘e’ indicated the speed limit was 30 mph or more below the maximum speed limit
Speed Compliance and Variation Analyses ‐ Conclusions
• VSL implementation helps to decrease speed variation.
• Driver compliance is highly correlated with how rationale posted speed reduction is and drivers seem to have a low tolerance for large reductions in posted speed.
Crash Analyses
• Task 1: Baseline Safety Analysis: Determine the change in safety performance with the implementation of VSL system.
• Task 2:Safety Performance Function: Identify the effectiveness of VSL system
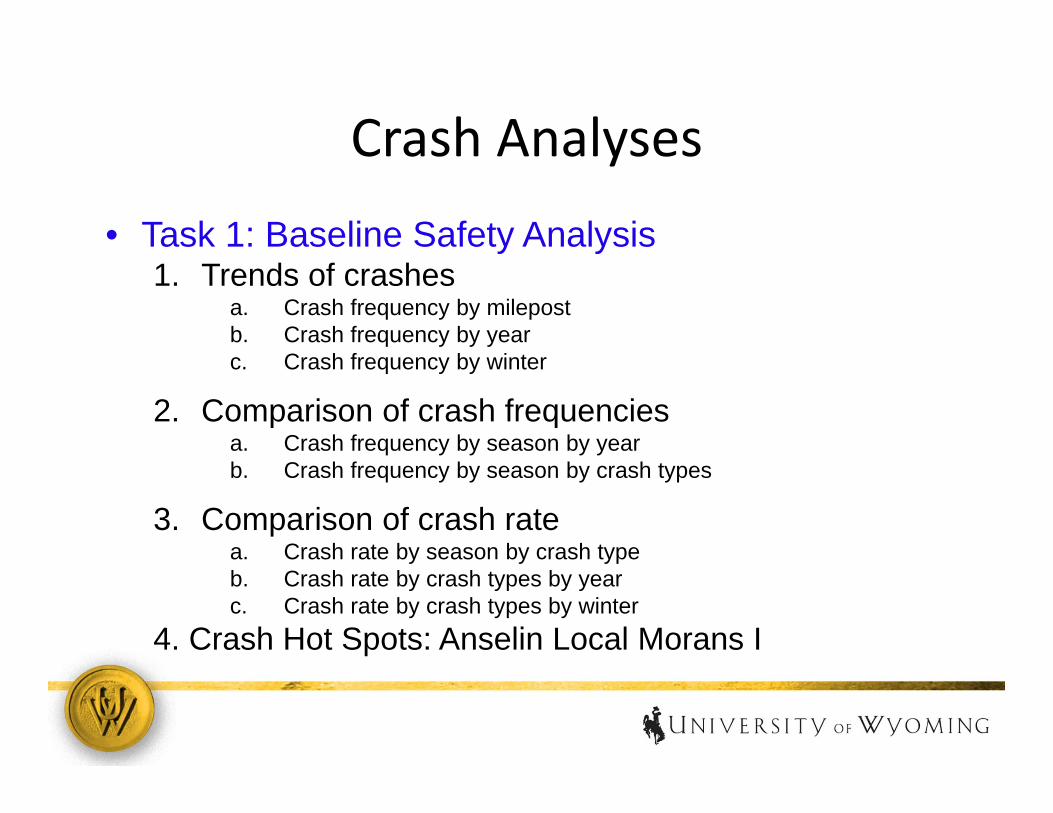
Crash Analyses• Task 1: Baseline Safety Analysis
1. Trends of crashes a. Crash frequency by milepostb. Crash frequency by yearc. Crash frequency by winter
2. Comparison of crash frequencies a. Crash frequency by season by yearb. Crash frequency by season by crash types
3. Comparison of crash ratea. Crash rate by season by crash typeb. Crash rate by crash types by yearc. Crash rate by crash types by winter
4. Crash Hot Spots: Anselin Local Morans I
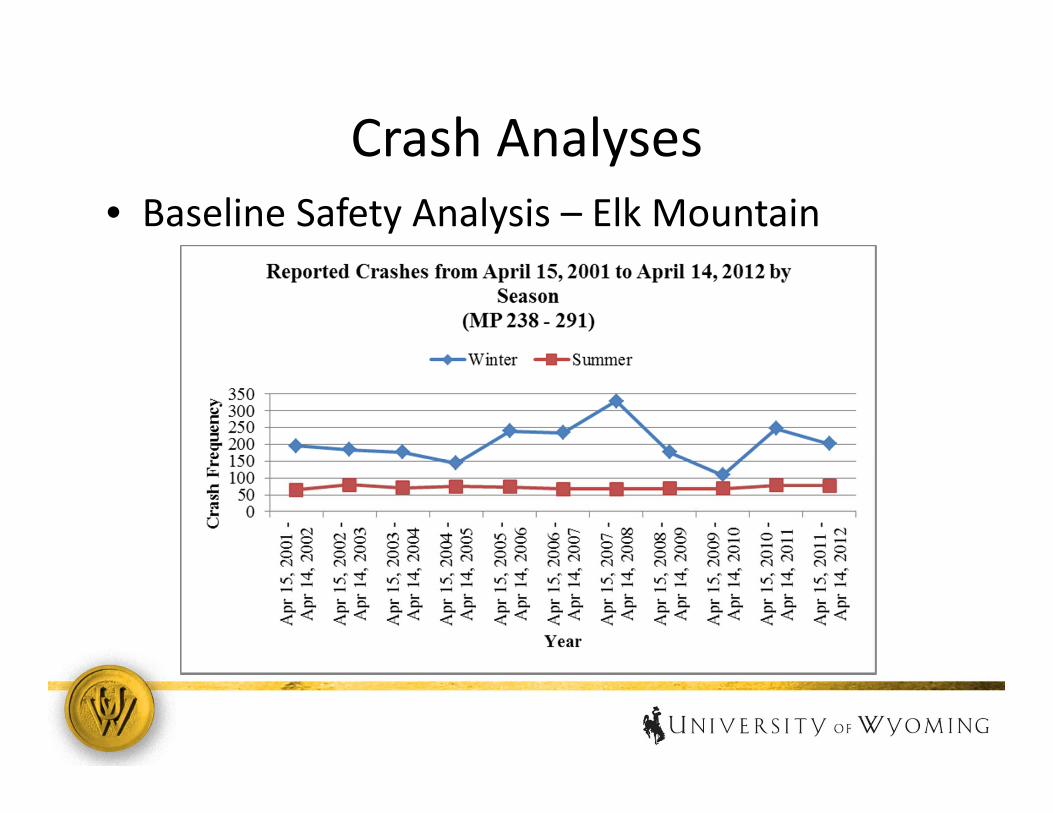
Crash Analyses• Baseline Safety Analysis – Elk Mountain
Data Analysis: Safety Performance Function
48
Task 2
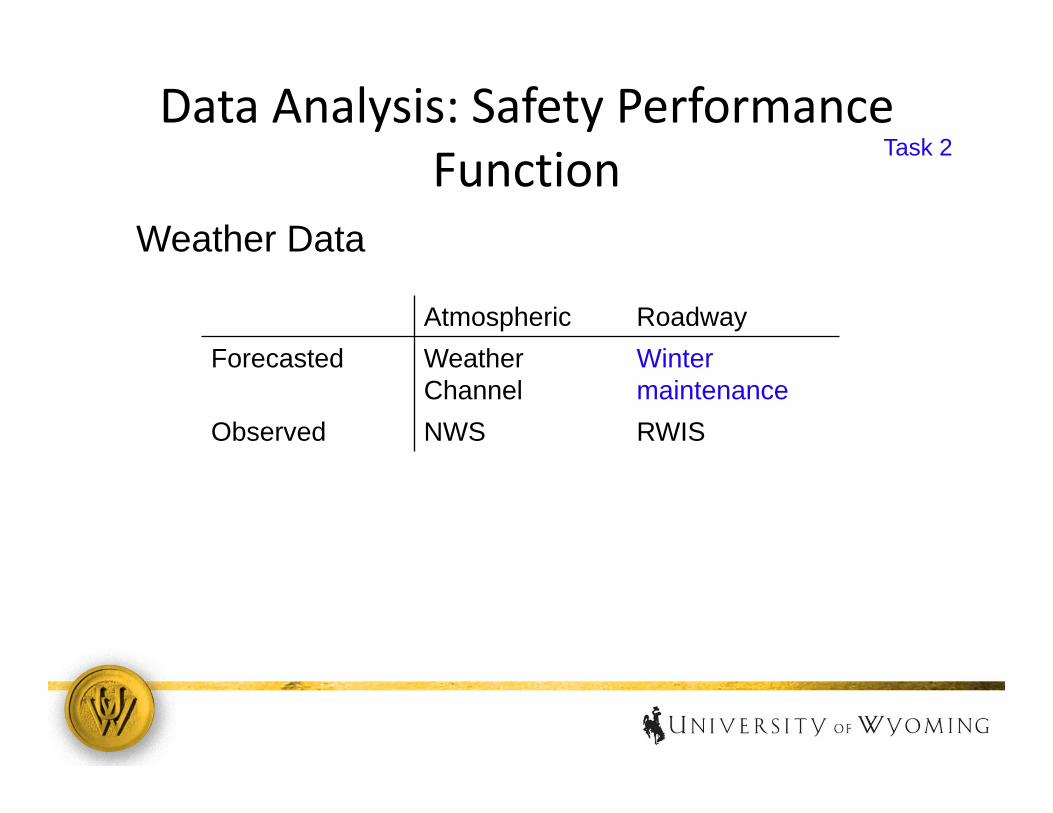
Weather Data
Atmospheric RoadwayForecasted Weather
ChannelWinter maintenance
Observed NWS RWIS
Data Analysis: Safety Performance Function
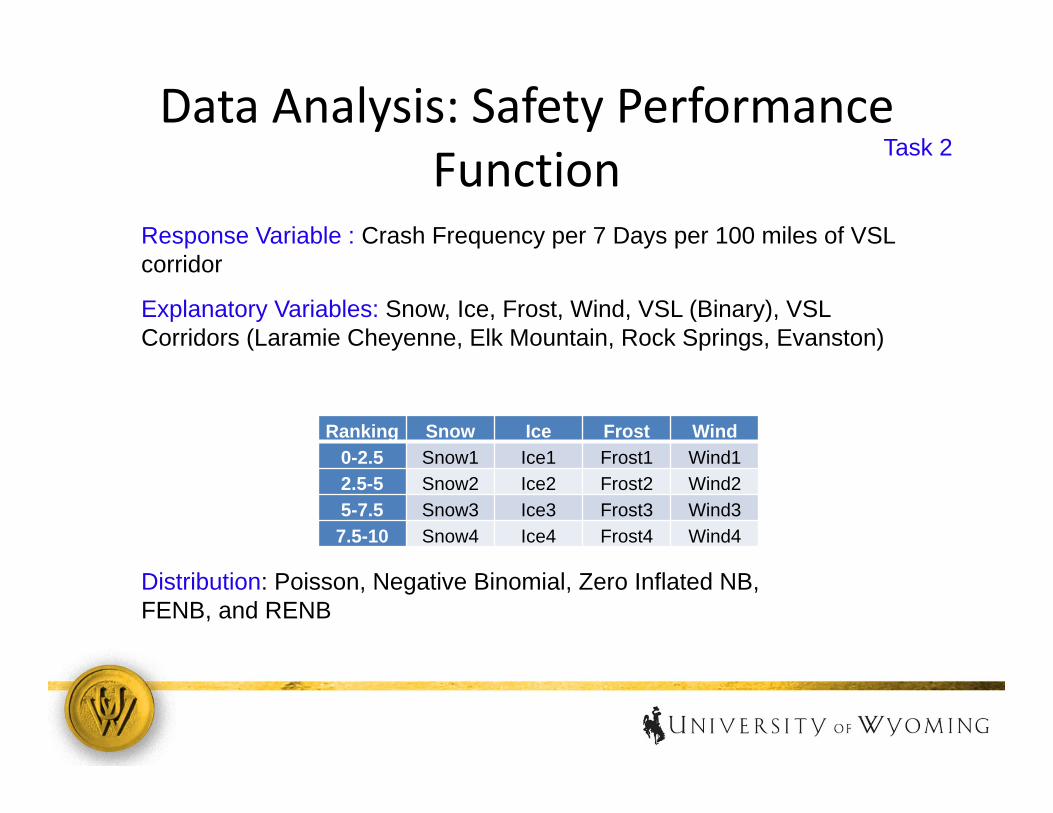
Response Variable : Crash Frequency per 7 Days per 100 miles of VSL corridor
Explanatory Variables: Snow, Ice, Frost, Wind, VSL (Binary), VSL Corridors (Laramie Cheyenne, Elk Mountain, Rock Springs, Evanston)
Ranking Snow Ice Frost Wind0-2.5 Snow1 Ice1 Frost1 Wind12.5-5 Snow2 Ice2 Frost2 Wind25-7.5 Snow3 Ice3 Frost3 Wind37.5-10 Snow4 Ice4 Frost4 Wind4
Distribution: Poisson, Negative Binomial, Zero Inflated NB,FENB, and RENB
49
Task 2
Data Analysis: Safety Performance Function
50
Task 2
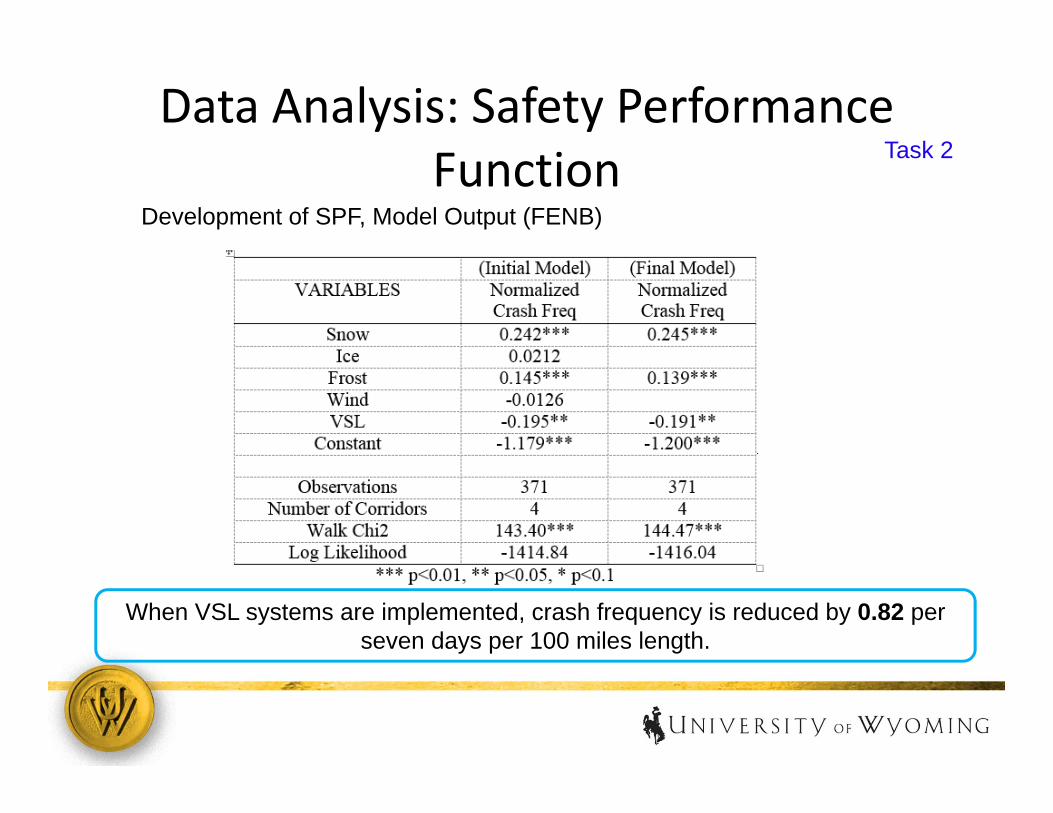
Development of SPF, Model Output (FENB)
When VSL systems are implemented, crash frequency is reduced by 0.82 per seven days per 100 miles length.
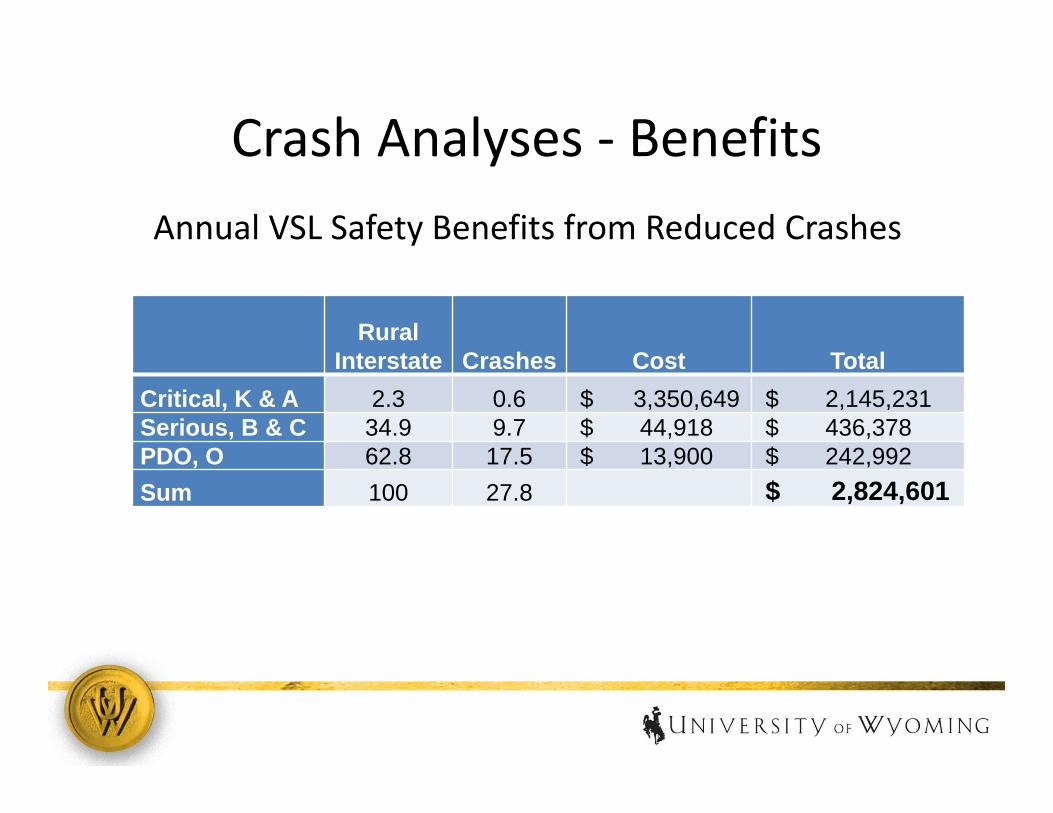
Crash Analyses ‐ BenefitsAnnual VSL Safety Benefits from Reduced Crashes
Rural Interstate Crashes Cost Total
Critical, K & A 2.3 0.6 $ 3,350,649 $ 2,145,231Serious, B & C 34.9 9.7 $ 44,918 $ 436,378PDO, O 62.8 17.5 $ 13,900 $ 242,992Sum 100 27.8 $ 2,824,601
Road Closure Analysis
• Similar analysis to the crash reduction model was estimated and over $54 million in annual benefits estimated
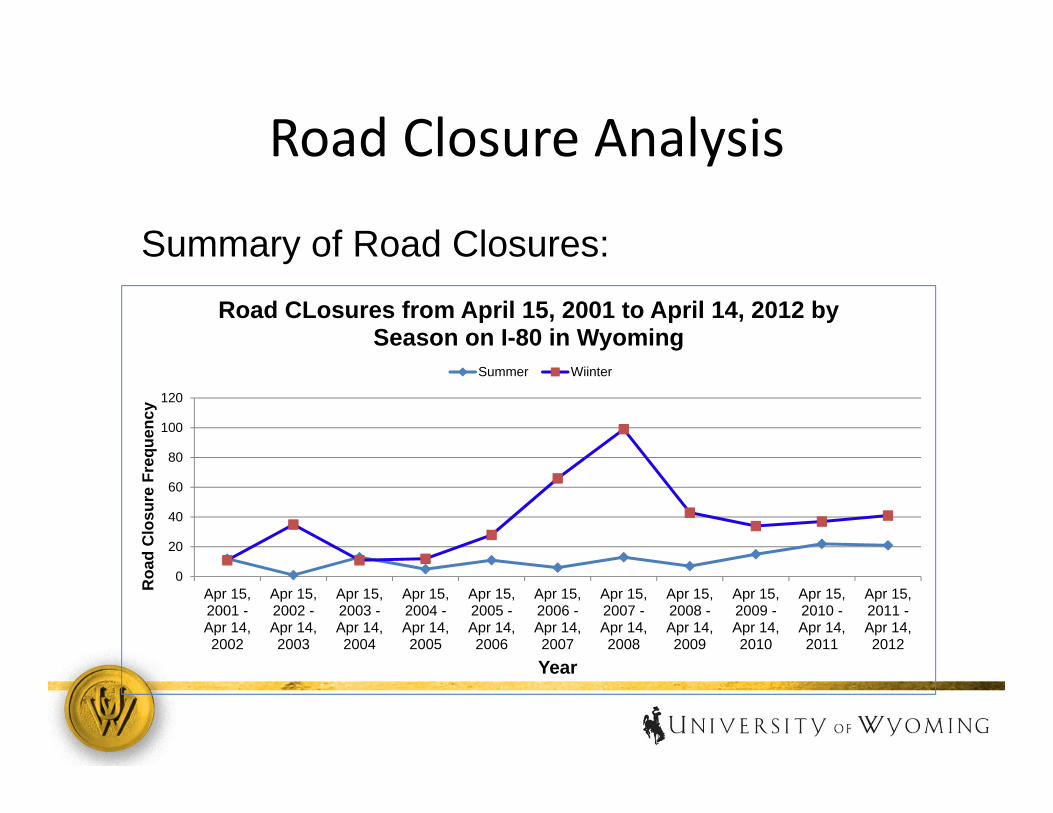
Road Closure Analysis
Summary of Road Closures:
0
20
40
60
80
100
120
Apr 15,2001 -Apr 14,2002
Apr 15,2002 -Apr 14,2003
Apr 15,2003 -Apr 14,2004
Apr 15,2004 -Apr 14,2005
Apr 15,2005 -Apr 14,2006
Apr 15,2006 -Apr 14,2007
Apr 15,2007 -Apr 14,2008
Apr 15,2008 -Apr 14,2009
Apr 15,2009 -Apr 14,2010
Apr 15,2010 -Apr 14,2011
Apr 15,2011 -Apr 14,2012
Roa
d C
losu
re F
requ
ency
Year
Road CLosures from April 15, 2001 to April 14, 2012 by Season on I-80 in Wyoming
Summer Wiinter
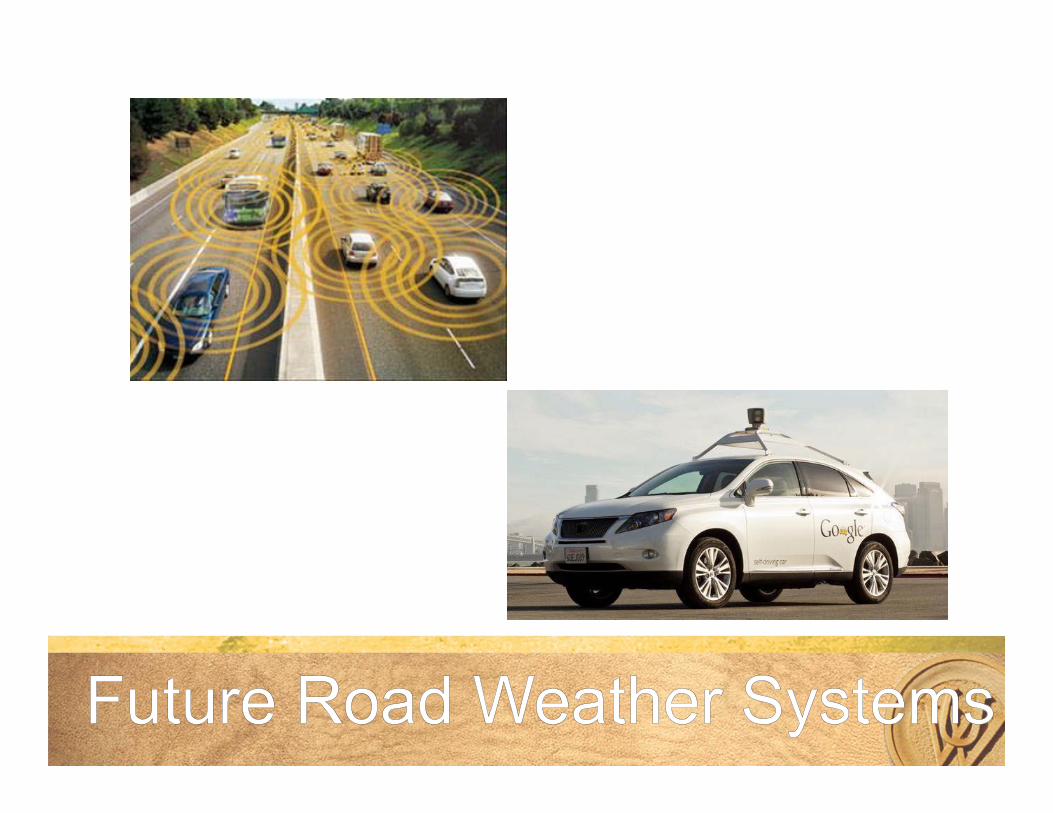
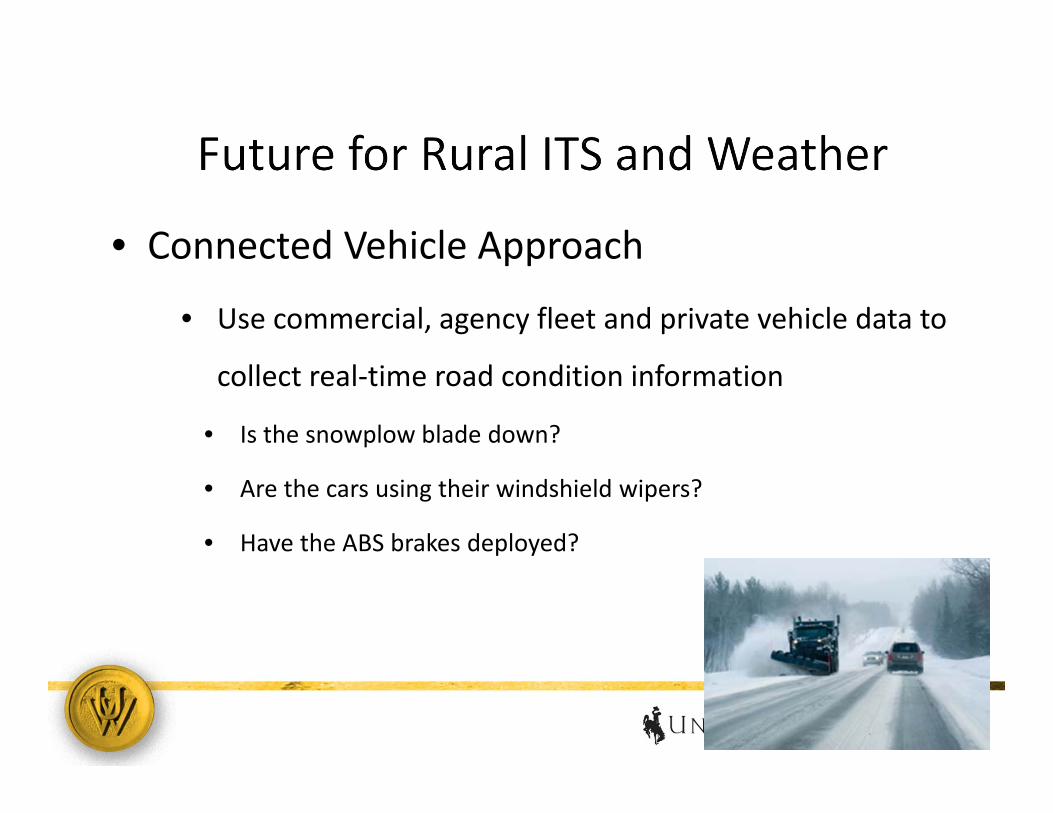
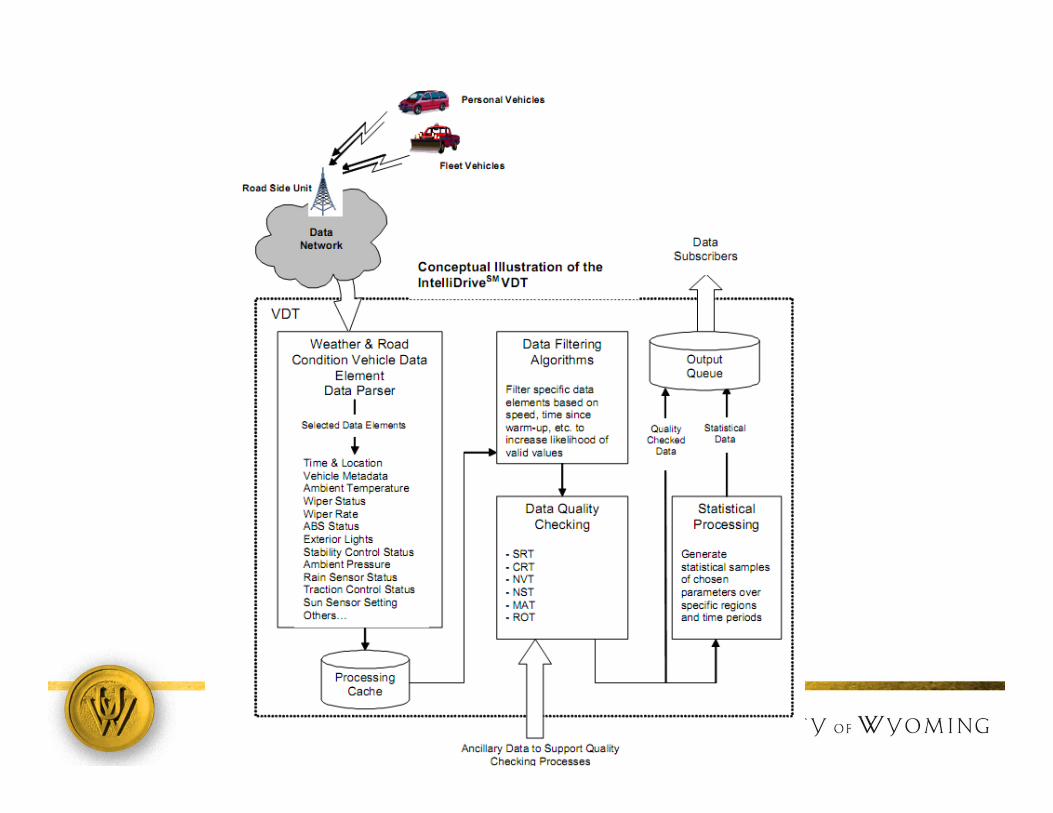
• Connected Vehicle Approach
• Use commercial, agency fleet and private vehicle data to
collect real‐time road condition information
• Is the snowplow blade down?
• Are the cars using their windshield wipers?
• Have the ABS brakes deployed?
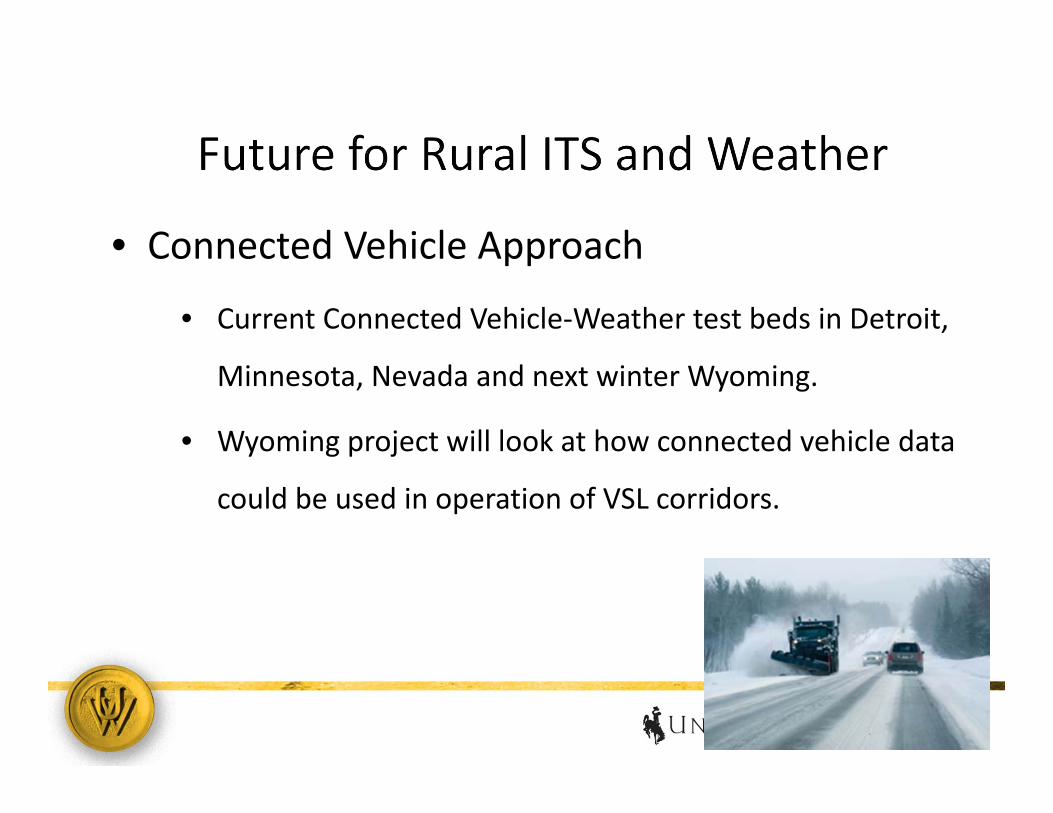
• Connected Vehicle Approach
• Current Connected Vehicle‐Weather test beds in Detroit,
Minnesota, Nevada and next winter Wyoming.
• Wyoming project will look at how connected vehicle data
could be used in operation of VSL corridors.
• Autonomous Vehicles
• Currently developed autonomous vehicles operate in ideal weather
conditions.
• How can the control algorithms be developed for different weather
conditions?
• How would this work for different when the number of autonomous
vehicles increase?
• Will autonomous vehicles make weather‐based ITS solutions
obsolete?