TREATMENT TECHNOLOGY FOR AUTO FLUFF Michael C. Mensinger and Amir Rehmat Institute of Gas Technology Chicago, IL 60616 Satish C. Saxena and N. S. Rao University of Illinois Chicago, IL 60612 INTRODUCIlON Auto fluff is the nonmetallic material that remains after junked automobiles are stripped and then shredded to recover their metal (primarily ferrous) and other valuable components. The composition of auto fluff varies, however, it is generally comprised of scrap metal (wire, molding, etc.), plastic, vinyl, leather, cloth, sponge, foam, glass, and other noncombustibles. In addition, t r a m of lead, cadmium, chromium, and mercury are present along with organic compounds, such as oil, antifreeze, transmission and brake fluids, and polychlorinated biphenyls (PCB). It is estimated that each year, the 200 or so automobile shredders' in the US. generate as much as 3 to 4 million tons of auto fluff.2 Currently, most auto fluff is sent to municipal landfills or is stored on the site of the auto shredder facilities. The presence of PCBs and heavy metals in auto fluff render some samples hazardous wastes according to the U.S. Environmental Protection Agency (EPA) Toxicity Characteristic Leaching Procedure (TCLP). These materials must be stored in specially designed land- or monofills. The reduction of existing landfill capacity, mounting disposal costs and more stringent legislation on auto fluff disposal have spurred the development of alternative methods of disposing or reducing the volume of material that must be landfilled. "0-STAGE AGGCOM COMBUSTOR The Institute of Gas Technology (IGT) is developing the two-stage fluidized-bed/cyclonic agglomerating (AGGCOM) combustor (Figure 1) for treating soils and other materials, such as auto fluff, that are contaminated with both organic and inorganic compounds. The AGGCOM combustor combines the fluidized-bed gasification and cyclonic combustion technologies that have been developed at IGT over many years. The AGGCOM combustor efficiently destroys organic compounds and encapsulates inorganic contaminants within benign, glassy agglomerates suitable for disposal in ordinaly landfills. The first stage of the combustor is a sloping-grid, agglomerating fluidized-bed reactor that can operate under either substoichiometric or excess air conditions. In addition to the sloping grid, the first stage incorporates a central jet and classification section. Fuel gas and air enter the central jet while only air is admitted through the grid and classifier. The contaminated waste material is admitted directly into the fluidized bed. With a unique distribution of fuel and air, the bulk of the fluidized bed is controlled at a temperature of 1500" to 2000T, while the central spout temperature can be varied from 2000" to 3000'F. This feature is key to the combustor's ability to produce benign agglomerates. Upon introduc- tion of contaminated wastes into the bed, the organic fraction is immediately volatilized and partially combusted. The inorganic fraction undergoes melting and subsequent agglomeration. Volatilized organic compounds are destroyed in the second stage of the AGGCOM'combustor. This second stage is a cyclonic combustor, which provides intense mixing to ensure complete combustion of these organic compounds. Either secondary air or a mixture of fuel gas and air is fed to this stage to maintain a temperature in the range of 1800" to 2400°F. The destruction and removal efficiency (DRE) 837 c
Transcript
TREATMENT TECHNOLOGY FOR AUTO FLUFF
Michael C. Mensinger and Amir Rehmat Institute of Gas Technology
Chicago, IL 60616
Satish C. Saxena and N. S. Rao University of Illinois Chicago, IL 60612
INTRODUCIlON Auto fluff is the nonmetallic material that remains after junked automobiles are stripped and then shredded to recover their metal (primarily ferrous) and other valuable components. The composition of auto fluff varies, however, it is generally comprised of scrap metal (wire, molding, etc.), plastic, vinyl, leather, cloth, sponge, foam, glass, and other noncombustibles. In addition, t r a m of lead, cadmium, chromium, and mercury are present along with organic compounds, such as oil, antifreeze, transmission and brake fluids, and polychlorinated biphenyls (PCB).
It is estimated that each year, the 200 or so automobile shredders' in the U S . generate as much as 3 to 4 million tons of auto fluff.2 Currently, most auto fluff is sent to municipal landfills or is stored on the site of the auto shredder facilities. The presence of PCBs and heavy metals in auto fluff render some samples hazardous wastes according to the U.S. Environmental Protection Agency (EPA) Toxicity Characteristic Leaching Procedure (TCLP). These materials must be stored in specially designed land- or monofills. The reduction of existing landfill capacity, mounting disposal costs and more stringent legislation on auto fluff disposal have spurred the development of alternative methods of disposing or reducing the volume of material that must be landfilled.
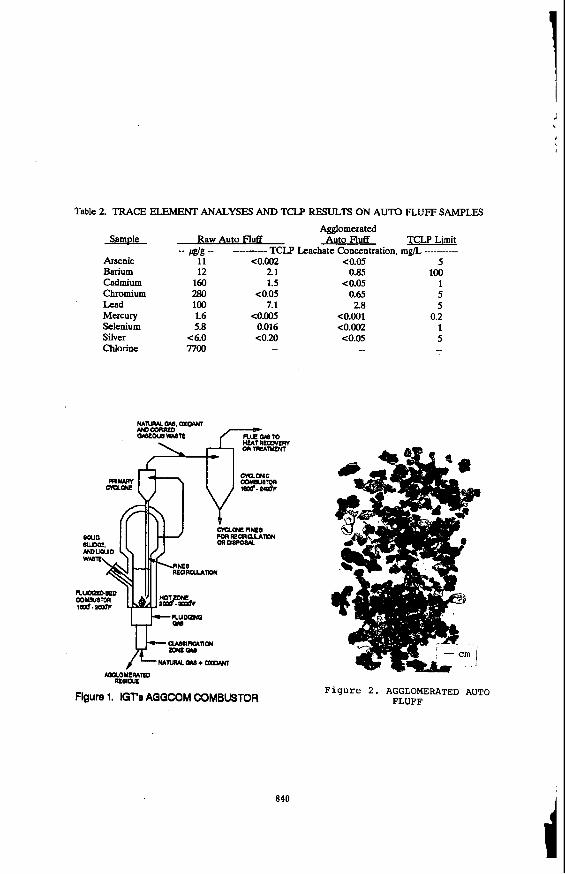
"0-STAGE AGGCOM COMBUSTOR The Institute of Gas Technology (IGT) is developing the two-stage fluidized-bed/cyclonic agglomerating (AGGCOM) combustor (Figure 1) for treating soils and other materials, such as auto fluff, that are contaminated with both organic and inorganic compounds. The AGGCOM combustor combines the fluidized-bed gasification and cyclonic combustion technologies that have been developed at IGT over many years. The AGGCOM combustor efficiently destroys organic compounds and encapsulates inorganic contaminants within benign, glassy agglomerates suitable for disposal in ordinaly landfills.
The first stage of the combustor is a sloping-grid, agglomerating fluidized-bed reactor that can operate under either substoichiometric or excess air conditions. In addition to the sloping grid, the first stage incorporates a central jet and classification section. Fuel gas and air enter the central jet while only air is admitted through the grid and classifier. The contaminated waste material is admitted directly into the fluidized bed. With a unique distribution of fuel and air, the bulk of the fluidized bed is controlled at a temperature of 1500" to 2000T, while the central spout temperature can be varied from 2000" to 3000'F. This feature is key to the combustor's ability to produce benign agglomerates. Upon introduc- tion of contaminated wastes into the bed, the organic fraction is immediately volatilized and partially combusted. The inorganic fraction undergoes melting and subsequent agglomeration.
Volatilized organic compounds are destroyed in the second stage of the AGGCOM'combustor. This second stage is a cyclonic combustor, which provides intense mixing to ensure complete combustion of these organic compounds. Either secondary air or a mixture of fuel gas and air is fed to this stage to maintain a temperature in the range of 1800" to 2400°F. The destruction and removal efficiency (DRE)
837 c
of organic contaminants in the AGGCOM system is expected to exceed 99.99% (99.9999% for PCBs, dioxins, etc.). Fine particulates collected in the cyclonic stage are returned to the fluidized-bed stage for assimilation in the agglomerates.
EPA SITE PROGRAM A multiyear program is currently undenvay at IGT to develop a data base for application of the AGGCOM technology at Superfund sites. The program is sponsored by the U.S. EPA Superfund Innovative Technology Evaluation (SITE) program, IGTs Sustaining Membership Program, and the Gas Research Institute. The program includes soil agglomeration tests in a &inch diameter fluidized-bed bench-scale unit (BSU), the design, construction, and operation of a 6-todday AGGCOM pilot plant, and the utilization of the pilot plant data to assess the commercial viability of the technology.. The primary objectives of the program include 1) determining the operating conditions in the fluidized bed that, for a given contaminated soil, will enhance the capture and encapsulation of inorganic contami- nants within the glassy matrix, 2) identifying operating conditions in both AGGCOM stages for the destruction of organic contaminants with a DRE to exceed 99.99%, and 3) minimizing utility requirements by maximizing p r o c w heat recovery.
The batch BSU tests with commercially available top soil were successfully completed; conditions required to produce soil agglomerates were determined. Samples of agglomerated soil were shown to be essentially non-leachable per the TCLP. Construction of the AGGCOM pilot plant has been completed and testing is underway.
AUTO FLUFF TESTS IGT conducted an experimental program to determine the operating conditions necessary for combusting auto fluff and for agglomerating the inorganic fraction of auto fluff. The University of Illinois (Chicago, UIC) participated in the program as a subcontractor to IGT. A bulk sample of auto fluff was obtained from a local auto shredder. Physical and chemical analyses of the bulk sample of auto fluff were determined (Table 1).
Fluidization tests were conducted with as-received and ground (-% inch) auto fluff and with auto fluff ash generated in the fluidized-bed combustor at UIC. The objective of the tests was to determine the fluidization characteristics of the auto fluff and ash. The raw and ground auto fluff did not fluidize well. The ash from the fluidized-bed combustion test behaved like discrete particles and the results from this test were considered more representative of the fluidization expected in the BSU. A minimum fluidization value ( U d of 1.5 ft/s (0.45 4 s ) was selected as the best compromise for both raw fluff and combusted ash.
Feeding o f the ground auto fluff to the BSU with existing equipment was also difficult. The 1 %inch screw was not capable of discharging auto fluff from the &inch diameter feed hopper. After much modification and testing, IGT and UIC developed an auger-stirred feed hopper that could effectively meter auto fluff into a horizontal pocket feeder. With air assist, this feed system could consistently feed up to 15 Ib/h of auto fluff into the BSU.
The combustiodagglomeration tests were conducted in the BSU with natural gas as the secondary fuel. The bottom of the BSU is fitted with a sloping-grid gas distributor, including venturi discharge, and central burner jet for generating the hot zone. Cyclones are installed downstream of the BSU to collect fine particles elutriated from the fluidized bed. A product gas scrubber is also used to capture fine par- ticles not removed by the cyclones. The BSU is equipped with external electric heaters for achieving temperatures up to '2000 T and a feed gas preheater.
Three auto fluff combustiodagglomeration tests were conducted in the BSU. Each test consisted of several set points in an attempt to identify conditions required to agglomerate the inorganic fraction of auto fluff. The operating conditions were temperatures of 1560" to 1950°F, superficial fluidization
838
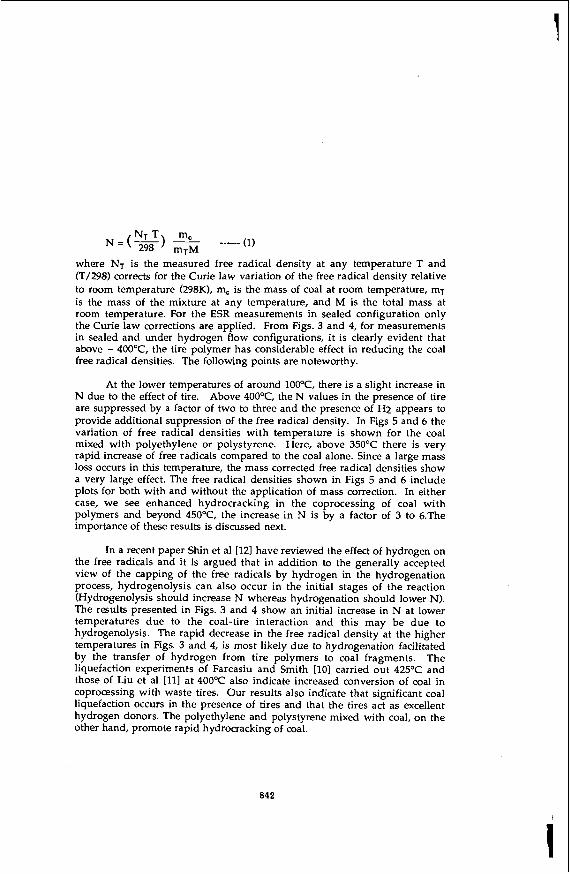
velocities of 2.3 to 4.6 ft/s (about twice the Ud, and auto fluff feed rates of 3.0 to 4.9 Ibh. Auto fluff agglomerates (Figure 2) were produced in two of the tests.
Three auto fluff combustion tests were also conducted in the UIC 6-inch diameter fluidized-bed reactor. The test conditions were temperatures of 1250" to 1590 T, fluidization velocities of 2.1 to 3.8 ft/s, and excess air of 12 to 99 percent. On-line gas analyzers indicated that auto fluff was not consistently fed to the bed by the screw feeder. The CO concentration increased and decreased in the range of 100 to over SO00 ppm during auto fluff feeding.
A sample of the ground auto fluff was anal+ for priority trace elements including chlorine. Raw ground auto fluff and the agglomerated auto fluff were subjected to the TCLP test. The trace element analysis and TCLP results are shown in Table 2. The results show that this sample of raw auto fluff has considerable cadmium, chromium, lead, and mercury contents and exhibits a toxic character per the TCLP test (see Cd and Pb concentrations). However, the leachability of the agglomerated auto fluff sample was significantly Iw than that of the raw fluff and the sample passed the TCLP test.
CONCLUSIONS The results of the bench-scale batch fluidized-bed agglomeration tests demonstrate that the inorganic fraction of auto fluff can'be agglomerated via IGTs sloping-grid technology. The leachability of auto fluff agglomerates is less than that of raw auto fluR the agglomerates pass the TCLP test. Product gas analyses of fluidized-bed combustion of auto fluff indicate that a second stage of cyclonic combustion is required to reduce the CO content to acceptable levels. The chlorine content of auto fluff may require the addition of sorbents to the fluidized bed to reduce HCI emissions to acceptable levels.
ACKNOWLEDGMENTS The authors gratefully acknowledge the funding of this research project by IGTs Internal Research and Development program. The efforts of Mr. Robert Schlusser in conducting the BSU tests are also acknowledged.
REFERENCES 1. "Detroit - The day of the throw-away car is over," Jack Keebler, Automotive News, March 4, 1991, p. 36.
2. "Process Recovers More From Junked Cars," Irwin Stambler, R&D Maeazine, January 1993, p. 14.
Table 1. PHYSICAL AND CHEMICAL CHARACTERISTICS OF AUTO FLUFF
Material wt % f d d Proximate Analvsis 8.8 Moisture Content 24.1 Scrap Metal
Hard Plastic
Rubber Vinyl + Leather Carpet +Cloth Other Fluffy Wood + Cardboard Glass Dirt+Other Total
Thermogravimetry and in-situ electron spin resonance spectroscopy of free radicals are used to investigate the coprocessing of blind canyon coal with waste tire rubber (Goodyear Vector) and with polystyrene and polyethylene. Temperature-programmed thermogravimetry shows improved conversion and the data of free radical density versus temperature to 5OO0C, under vacuum and flowing H2 gas conditions, show that waste tires act as good hydrogen donors. These findings suggest improved liquefaction of coal with waste rubber. Similar experiments of coprocessing of coal with polystyrene and polyethylene shows enhanced hydrocracking indicated by a large increase in the free radical densities above 350OC.
INTRODUCTION:
The free radicals in coals as monitored by electron spin resonance (ESR) spectroscopy are an integral part of the coal structure since their characteristic properties vary systematically with coal rank and coal macerals [1,21. As coals are subjected to pyrolysis, new free radicals are generated due to coal depolymerization whose intensities vary in a systematic fashion with pyrolysis temperature in bituminous coals [3-51. In the process of direct coal liquefaction, hydrogenation of the products of coal pyrolysis must occur resulting in the capping of the free radicals by transferred hydrogen [6-81. Therefore a decrease in the free radical density upon hydrogenation is indicative of the liquefaction. process. Consequently ESR spectroscopy is an important experimental technique for coal conversion studies if the experiments can be carried out in-situ under the practical conditions of high temperatures and pressures used in coal liquefaction. Recently we have developed such an ESR apparatus in which in-situ experiments for temperatures up to 6OOOC can be carried out under various atmospheres such as vacuum, flowing gases and H2 pressures up to 700 psi [9]. In the work reported here, we have employed this apparatus to investigate the coprocessing of coals with waste tires and we provide definite evidence of significant enhancement of coal hydrogenation facilitated by the tire polymers. These results are supportive of the increased coal liquefaction yield in the presence of waste tires reported first by Farcasiu and Smith [lo] and more recently by Liu et al [ill. Similar experiments on the coprocessing of coal with polyethylene and polystyrene show a rapid increase in the free
8 4 1
c
where NT is the measured free radical density at any temperature T and (T/298) corrects for the Curie law variation of the free radical density relative to room temperature (298K), m, is the mass of coal at room temperature, mT is the mass of the mixture at any temperature, and M is the total mass at room temperature. For the ESR measurements in sealed configuration only the Curie law corrections are applied. From Figs. 3 and 4, for measurements in sealed and under hydrogen flow configurations, it is clearly evident that above - 4OO0C, the tire polymer has considerable effect in reducing the coal free radical densities. The following points are noteworthy.
At the lower temperatures of around 100°C, there is a slight increase in N due to the effect of tire. Above 400°C, the N values in the presence of tire are suppressed by a factor of two to three and the presence of H2 appears to provide additional suppression of the free radical density. In Figs 5 and 6 the variation of free radical densities with temperature is shown for the coal mixed with polyethylene or polystyrene. Here, above 350°C there is very rapid increase of free radicals compared to the coal alone. Since a large mass loss occurs in this temperature, the mass corrected free radical densities show a very large effect. The free radical densities shown in Figs 5 and 6 include plots for both with and without the application of mass correction. In either case, we see enhanced hydrocracking in the coprocessing of coal with polymers and beyond 450°C, the increase in N is by a factor of 3 to 6.The importance of these results is discussed next.
In a recent paper Shin et a1 1121 have reviewed the effect of hydrogen on the free radicals and it is argued that in addition to the generally accepted view of the capping of the free radicals by hydrogen in the hydrogenation process, hydrogenolysis can also occur in the initial stages of the reaction (Hydrogenolysis should increase N whereas hydrogenation should lower N). The results presented in Figs. 3 and 4 show an initial increase in N at lower temperatures due to the coal-tire interaction and this may be due to hydrogenolysis. The rapid decrease in the free radical density at the higher temperatures in Figs. 3 and 4, is most likely due to hydrogenation facilitated by the transfer of hydrogen from tire polymers to coal fragments. The liquefaction experiments of Farcasiu and Smith [lo] carried out 425OC and those of Liu et a1 [111 at 4OOOC also indicate increased conversion of coal in coprocessing with waste tires. Our results also indicate that significant coal liquefaction occurs in the presence of tires and that the tires act as excellent hydrogen donors. The polyethylene and polystyrene mixed with coal, on the other hand, promote rapid hydrocracking of coal.
radical densities beyond -350°C indicating enhanced hydrocracking of coal with these polymers. These results are described below.
EXPERIMENTAL RESULTS AND DISCUSSION
The ESR studies reported here were carried out on a Blind Canyon coal obtained from the Penn State Coal Bank. The analysis of this coal as well as details of the x-band high temperature ESR cavity system were given in a recent paper [9]. The tire polymer used in these experiments was chipped from a used tire (Goodyear Vector) and it was mixed with the coal in 1:l ratio with mortar and pestle. Two samples of tire were cut from the central portion and from the rim of the tire and are referred to as tire(C) and tire(R) respectively. Polyethylene (spectrophotometric grade) and polystyrene (mol. wt. -2500) were obtained from Aldrich Chemical company Inc. Polymers were mixed 1:l with coal for TG and ESR measurements. For ESR, experiments were carried out under vacuum conditions (sealed tube) and in flowing H2 gas at a flow rate of 100cc/m [8,91. We also measured the weight loss in thermogravimetry in flowing H2 gas (100cc/m) at a heating rate of 10°C/m using a Mettler TA3000 system .
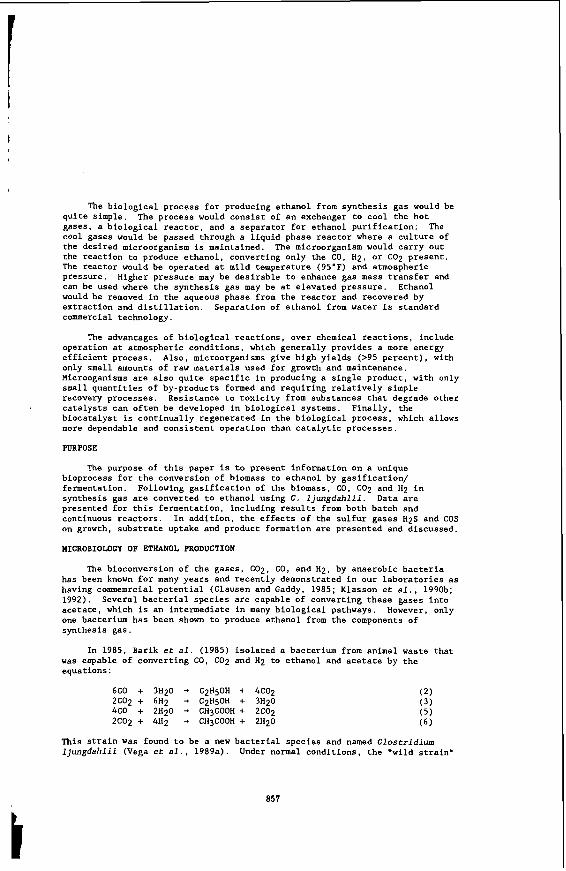
Fig. 1 shows the remaining weight (%) as a function of temperature for the Blind Canyon coal, the tire and the tire coal mixture in a flowing H2 experiment. Most of the weight loss due to release of volatiles occurs between 300 and 500°C and it is clearly evident that the coal-tire mixture has the highest weight loss. There is a no significant difference between the samples cut from the central or rim part of the tire in the variation of remaining weight with temperature. If we use the weight loss due to volatiles as the percentage conversion, then at 500"C, the percentage conversions for coal, tire and coal-tire respectively are about 32%, 48% and 66%. The presence of tire polymers has clearly enhanced the percentage conversion of coal. Fig 2. shows the plots of remaining weight (%) as a function of temperature for the polyethylene and polystyrene and for coal mixed with these polymers. For these cases also we see that the weight loss in the mixture is greater than a simple addition of weight loss of coal and polymer alone. Note also that in the mixture the major weight loss occurs at temperatures different from that for the individual polymers indicating strong reaction of polymers with coal.
For the ESR experiments, samples were either vacuum sealed in the ESR tube at room temperature followed by measurements at elevated temperatures or measurements were done in flowing H2 gas [8,9]. Only a single ESR line is observed from the coal sample and no ESR signal was observed from the tire or polymers as determined in a separate experiment up to 500OC. In Fig. 3 we show the temperature variation of the free radical density N for the coal and the coal-tire(R) mixture in sealed configuration and in Fig 4. for hydrogen flow configuration. For measurements in hydrogen flow the values of N plotted are determined by the equation(1):
a43
t
In summary, the results presented here on the free radical density of coals during coprocessing with tire and polymers suggest that tire polymers lower the free radical densities and act as good hydrogen donors. On the other hand polyethylene and polystyrene promote rapid hydrocracking of coal. Both of these findings are positive indicators for improved liquefaction of coals coprocessed with waste tires and polymers.
ACKNOWLEDGMENTS
This research was supported in part by the U.S. Department of Energy through CFFLS under Contract No. DE-FCZ-90PC90029.
REFERENCES
1. Retcofsky, H. L.; Stark, J. M.; Friedel, R. A. Anal. Chem. 1968, ~IJ 1699- 1704.
2. Silbernagel, B. G.; Gebhard, L. A.; Dyrkau, G. R.; Bloomquist, C. A. A. Fuel 1 9 8 6 , a 558-565.
3. Seehra, M. S.; Ghosh, 8.; Mullins, S. E. Fuel 1986, 65- 1315-1316. 4. Seehra, M. S.; Ghosh, B. J. Anal. Appl. Pyrolysis 1988, 209-220. 5. Fowler, T. G.; Bartle, K. D.; Kandiyoti, R. Fuel 1987,66- 1407-1412. 6. Neavel, R. C. Fuel 1 9 7 6 , g 237-242. 7. Petrakis, L. and Grandy, D. W. "Free Radicals in Coals and Synthetic
Fuels" 1983 (Elsevier Science Publication Co. N.Y.). 8. Ibrahim, M. M.; Seehra, M. S. Energy & Fuels 1991,s 74-78. 9. Ibrahim, M. M.; Seehra, M. S. ACS Fuel Div. Preprints 1992,
10. Farcasiu, M.; Smith, C. ACS Fuel Div. Preprints 1992, 11. Liu, Z.; Zondlo, J. W.; Dadyburjor, D. B. (private communication). 12. Shin, S.-C.; Baldwin, R. M.; Miller, R. L., Energy & Fuels 1989,L 71-76.
1131-1140. 472-479.
844
0) e e a .- .- 5 a
100
80
60
4 0
-
-
-
- -Y coal+tire( R)
100 200 300 400 5 0 0 6 0 0
T(OC)
Fig 1. Remaining weight as a function of temperature for coal and coal tire mixtures (1:l by weight). Tire(C) and tire(R) are cut from the central and rim portions of the tire. All measurements were done in flowing hydrogen.
a9 E - 0) .- E
E
CD .- .- a a
coal + polyethylene
coal + polystyrene
0 100 2 0 0 300 400 5 0 0 6 0 0
T(OC)
Fig.2. Remaining weight as a function of temperature for coal and coal mixed with polyethylene and polystyrene(1:l by weight) Measurements were'done under hydrogen flow.
845
0 coal-sealed
A coal+tire(R) sealed
2
0 100 2 0 0 300 4 0 0 5 0 0 6 0 0
T ("C)
Fig 3. Variation of free radical densities with temperature for coal, and coal mixed with tire(R) (1:l by weight). Samples were evacuated and sealed. No corrections for mass changes were applied.
0 coal
0 coal+lire(C)
A coal+lire(R)
0 1 0 0 200 300 400 500 600
T PCI
Fig. 4. Variation of free radical densities with temperature for coal and coal tire mixtures (I:I by weight). Measurements were done under hydrogen flow. Free radical densities are corrected for changes in mass.
846
coal + polyethylene (mass corrected) r coal+polyethylene (no mass correction) 7
ul ai- - 0 - - z
0 100 200 300 400 5 0 0 6 0 0
T (‘C)
Fig 5. Variation of free radical densities for coal and coal mixed with polyethylene (1:l by weight). For the mixture, N is plotted both with and without the mass correction.
* O I l 5 t
Coal+ polystyrene (mass corrected) 10
coal+polystyrene (no mass correcti 5
0 0 100 200 300 400 500 600
T (“C)
Fig 6. Variation of free radical densities for coal and coal mixed with polystyrene (1:l by weight). For the mixture, N is plotted both with and without the mass correction.
THIS PAGE INTENTIONALLY
MADE BLANK
PAPER WITHDRAWN
FROM PROGRAM
ETHANOL FRON BIOWSS BY GASIFICATION/FEP.MENTATION
E. C. Clausen J . L. Gaddy
Department of Chemical Engineering University of Arkansas Payetteville, AR 72701
Bacteria have recently been isolated from natural sources that produce ethanol from CO, H2 and Cop. This paper describes a unique process for producing liquid fuel from biomass by gasification, followed by fermentation of the synthesis gas to ethanol. This process offers the advantage of very high yield (140 gal/ton), since the lignin and pentose fractions of the biomass can also be readily utilized. This presentation describes laboratory experiments with the culture and discusses bioreactor designs for this mass transfer limited fermentation.
INTRODUCTION
The United States currently imports about 20 percent of its total energy requirements of about 70 quads annually. prices rise, the U . S . must develop alternative energy resources.
As petroleum reserves decline and
The nation has about 1.5 billion tons of biomass residue and wastes that could be used as an energy source (Sitton et al., 1979). These residues could furnish 10 quads, or about 15 percent of our energy requirements, if converted at a 50 percent efficiency. arable rangeland and forestland (about 200 million acres), another 25 quads could be produced (Clausen et al., 1977). Therefore, the U.S. could supply half of its energy needs from renewable biomass and wastes.
In addition, if energy crops were grown on idle
Lignocellulosic matter may be used as a solid fuel and burned directly to produce energy. However, efficiencies are low and handling problems are serious. Consequently, biomass must be converted into gaseous or liquid forms of energy to be utilized in conventional energy processes. components of cellulosic biomass are hemicellulose, cellulose and lignin. The compositions of the biomass resources vary; however. most materials contain 15-25 percent hemicellulose. 30-45 percent cellulose, and 5-20 percent lignin. The carbohydrates may be hydrolyzed to sugars and fermented to ethanol or they may be converted into methane by anaerobic digestion. under development and may become economical in the future.
The major
These technologies are
Biomass may also be gasified to yield a low Btu gas consisting of H2, Co, Technology for pyrolysis or gasification of biomass has been COP, and N2.
under intensive development during the last two decades (Stasson and Stiles, 1988). Large scale demonstration facilities have been tested (Fisher et al., 1976) and small scale commercial facilities are now in operation. advantage of gasification of biomass is that all the carbohydrate and lignin are converted into energy forms, whereas the lignin is not converted by hydrolysis or digestion.
A major
855
The problems with the application of biomass gasification have not been technical, but economic. which is very cheap today. costs for gasification cannot be justified with such low income. components of synthesis gas were converted into a higher value fuel product, biomass gasification could become a viable alternative energy technology.
BIOLOGICAL PRODUCTION OF ETHANOL FROM BIOUASS SYNTHESIS GAS
The product from gasification is a heat source, Therefore, even nominal capital and operating
If the
Synthesis gases, consisting of CO, H2 and Cop, may be produced from biomass according to the approximate reaction (Alden et e l . , 1991):
8CH20 + (4N2) + 6CO + 2C02 + 8H2 + (4N2) biomass
There are many gasifier designs that have been demonstrated and are commercially available. Gas composition is a function of the amount of air or oxygen necessary to generate the heat for pyrolysis of the biomass, as well as the type of gasifier and the moisture content of the biomass. be added to adjust the hydrogen concentration. If oxygen is used, nitrogen is eliminated.
Steam may also
The components of synthesis gas may be converted into ethanol by certain anaerobic bacteria according to the equations (Klasson et al.. 1990a; 1990b; 1992; Barik et a l . , 1988):
6CO + 3H20 + CH3CH20H + 4C02 (2)
6H2 + 2C02 + CH3CH20H + 3H20 (3)
Equations ( 2 ) and (3) may be combined with Equation (1) to give
Since nearly all the biomass (including the lignin, but not the ash) can be converted into gas by Equation (l), yields of ethanol of about 50 percent of the total biomass are possible (135 gal per ton). only about 30 percent for enzymatic or acid hydrolysis/fermentation processes.
This compares to yields of
Synthesis gas compositions from biomass are variable, depending upon the raw material. temperature and process used. ratio of about one with CO and H2 compositions o f about 35 percent (Borgwardt et al., 1991; Alden et al., 1991). Yields of gas of about 90 percent are common. and Mansour, 1988).
Typical compositions show a CO:H2
Gas composition can also be tailored for fuels production (Collaninno
Fuel ethanol production from grain is about one billion gallons per year and expected to increase steadily as oxygenated fuels usage is mandated in many metropolitan areas. Prices have been as high as $1.85 per gallon, but have stabilized at about $1.20 per gallon (wholesale gasoline price plus tax credit of $0.54 per gallon) in recent years. The potential market for fuel ethanol is 10 billion gallons annually, at a 10 percent blend with gasoline. Higher percentages are, of course, possible and pure ethanol is marketed in Brazil. Therefore, the market for this product is quite large and the price is sufficient to support commercialization.
856
The biological process for producing ethanol from synthesis gas would be quite simple. gases, a biological reactor, and a separator for ethanol purification: The cool gases would be passed through a liquid phase reactor where a culture of the desired microorganism is maintained. The microorganism would carry out the reaction to produce ethanol, converting only the GO, Hp, or COP present. The reactor would be operated at mild temperature (95'F) and atmospheric pressure. Higher pressure may be desirable to enhance gas mass transfer and can be used where the synthesis gas may be at elevated pressure. would be removed in the aqueous phase from the reactor and recovered by extraction and distillation. Separation of ethanol from water is standard commercial technology.
The process would consist of an exchanger to cool the hot
Ethanol
The advantages of biological reactions, over chemical reactions, include operation at atmospheric conditions, which generally provides a more energy efficient process. A l s o , microorganisms give high yields (>95 percent), with only small amounts of raw materials used for growth and maintenance. Microoganisms are also quite specific in producing a single product, with only small quantities of by-products formed and requiring relatively simple recovery processes. Resistance to toxicity from substances that degrade other
biocatalyst is continually regenerated in the biological process, which allows more dependable and consistent operation than catalytic processes.
PURPOSE
' catalysts can often be developed in biological systems. Finally, the
The purpose of this paper is to present information on a unique bioprocess for the conversion of biomass to ethanol by gasification/ fermentation. Following gasification of the biomass, GO, C o p and H2 in synthesis gas are converted to ethanol using C. ljungdahlii. Data are presented for this fermentation, including results from both batch and continuous reactors. In addition, the effects of the sulfur gases HpS and COS on growth, substrate uptake and product formation are presented and discussed.
tlICROBIOLOCY OF ETHANOL PRODUCTION
The bioconversion of the gases, Cop. GO, and H2, by anaerobic bacteria has been known for many years and recently demonstrated in our laboratories as having commemrcial potential (Clausen and Gaddy, 1985; Klasson et al., 1990b; 1992). acetate, which is an intermediate in many biological pathways. However, only one bacterium has been shown to produce ethanol from the components of synthesis gas.
Several bacterial species are capable of converting these gases into
In 1985, Barik et el. (1985) isolated a bacterium from animal waste that was capable of converting GO, C o p and Hp to ethanol and acetate by the equations:
This strain was found to be a new bacterial species and named Clostridium ljungdahlii (Vega et al., 1989a). Under normal conditions, the "wild strain"
t
produced approximately 20 moles of acetate per mole of ethanol (Barik et al., 1988). However, by manipulating the culture and employing low pH and minimal nutrients, the culture has been found to be capable of producing only ethanol, with minimal amounts of acetate (Klasson et al.. 1992).
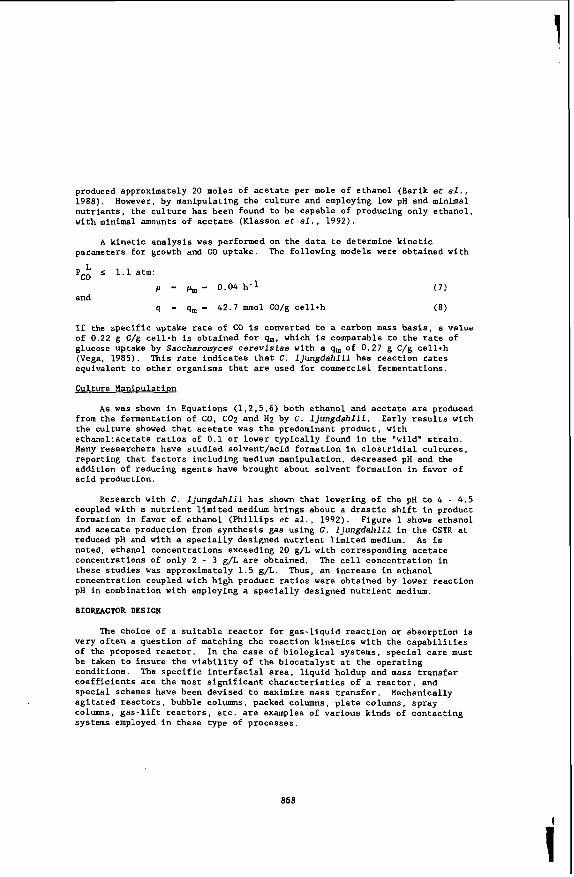
A kinetic analysis was performed on the data to determine kinetic parameters for growth and CO uptake. The following models were obtained with
L Pco 5 1.1 atm:
and p - - 0.04 h-l q - qm - 42.7 mmol CO/g ce1l.h
If the specific uptake rate of CQ is converted to a carbon mass basis, a value of 0.22 g C/g cell-h is obtained for qm. which is comparable to the rate of glucose uptake by Saccharomyces cerevisiae with a qm of 0 . 2 7 g C/g ce1l.h (Vega, 1985). This rate indicates that C. ljungdahlii has reaction rates equivalent t o other organisms that are used for commercial fermentations.
Culture ManiDulation
As was shown in Equations (1,2,5,6) both ethanol and acetate are produced from the fermentation of CO, CO2 and H2 by C. Ijungdahlii. Early results with the culture showed that acetate was the predominant product, with ethano1:acetate ratios of 0.1 or lower typically found in the "wild" strain. Many researchers have studied solvent/acid formation in clostridial cultures, reporting that factors including medium manipulation, decreased pH and the addition of reducing agents have brought about solvent formation in favor of acid production.
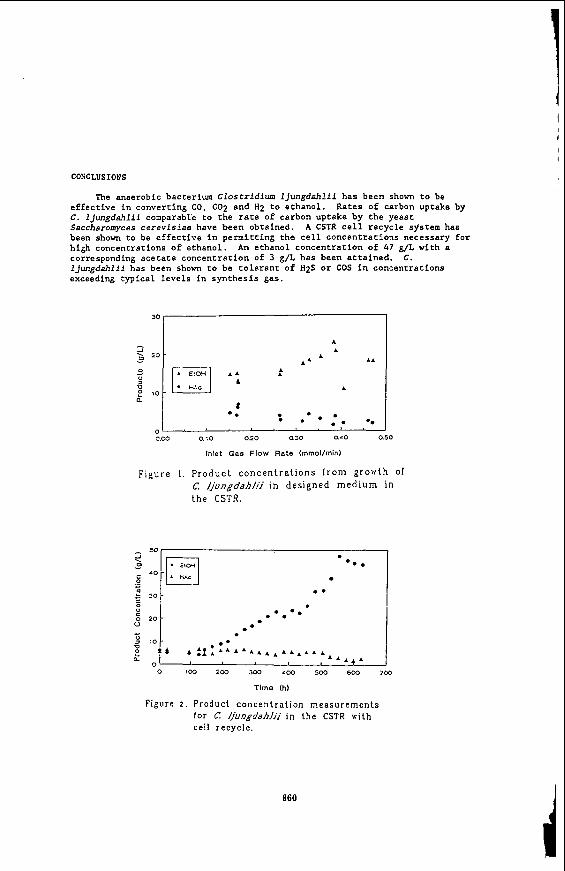
Research with C. ljungdahlii has shown that lowering of the pH to 4 - 4.5 coupled with a nutrient limited medium brings about a drastic shift in product formation in favor of ethanol (Phillips et ai., 1992). Figure 1 shows ethanol and acetate production from synthesis gas using C. ljungdahlii in the CSTR at reduced pH and with a specially designed nutrient limited medium. noted, ethanol concentrations exceeding 20 g/L with corresponding acetate concentrations of only 2 - 3 g/L are obtained. The cell concentration in these studies was approximately 1.5 g/L. Thus, an increase in ethanol concentration coupled with high product ratios were obtained by lower reaction pH i n combination with employing a specially designed nutrient medium.
As is
BIORWCTOR DESIGN
The choice of a suitable reactor for gas-liquid reaction or absorption is
In the case of biological systems, special care must very often a question of matching the reaction kinetics with the capabilities of the proposed reactor. be taken to insure the viability of the biocatalyst at the operating conditions. The specific interfacial area, liquid holdup and mass transfer coefficients are the most significant characteristics of a reactor, and special schemes have been devised to maximize mass transfer. Mechanically agitated reactors, bubble columns, packed columns. plate columns, spray columns, gas-lift reactors, etc. are examples of various kinds of contacting systems employed in these type of processes.
858
The rate of disappearance of CO from the gas phase can be related to the partial pressures in the gas and the liquid phase and the cell concentration, X. by the equation:
c
Under mass transfer limiting conditions, P
rate of disappearance of CO is proportional to the gas phase CO concentration. As the cell concentration, X, reaches a value at which mass transfer is controlling, the concentration of carbon monoxide in the liquid becomes zero and the reaction rate is controlled by the rate of transport of the substrate into the liquid phase. Thus, both high cell concentrations and fast gas transport are necessary to minimize reactor size. may be obtained in the reactor by employing a cell recycle system in which the cells are separated from the effluent and returned to the reactor. Fast mass transfer can occur by employing increased pressure or solvents to increase CO solubility .
n e Use of Cell Recycle in the CSTR
approaches zero so that the co
High cell concentrations
A cell recycle apparatus was used in conjunction with a standard CSTR as a method to increase the cell concentration inside the reactor. This is particularly important since total product formation with C. ljungdahlii has been shown to be proportional to the cell concentration inside the reactor.
Figure 2 shows the product concentration profile for the CSTR with cell recycle. In this experiment, the cell concentration increased (with agitation rate and gas retention time increases) from approximately 800 mg/L to over 4000 mg/L The maximum in the previous CSTR study without cell recycle was 1500 g/L. The CO conversion was consistently around the 90 percent level after 150 h of operation. averaged 70 percent up to a time of 500 h. fell, probably due to an accumulation of CO in the liquid phase. concentration ranged from 6 g/L at the beginning of the study to 48 g/L after 560 h of operation. The corresponding acetate concentrations at these times were 5 g/L and 3 g/L, respectively. from 1.2 g/g to 16 g/g. Thus, very high ethanol concentrations are possible and acetate production is nearly eliminated with high cell concentrations.
S e h Pressure ODeration
The Corresponding Hp conversion. on the other hand,
The ethanol At this time, the Hp conversion
The ratio of ethanol to acetate ranged
As was mentioned previously, elevated pressure may be used to increase the rate of mass transfer of CO into the liquid phase. (both CSTR and trickle bed reactor) has been constructed in the University of Arkansas laboratories. psig and can be used for both photosynthetic and non-photosynthetic bacterial systems. ljungdahlii to increased pressure.
A high pressure system
The system has a maximum operating pressure of 5000
The system is presently being used to gradually acclimate C .
859
CONCLUSIONS
The anaerobic bacterium Clostridium lJungdahlii has been shown to be effective in converting CO, CO2 and H2 to ethanol. C. ljungdahlii comparable to the rate of carbon uptake by the yeast Saccharomyces cerevisiae have been obtained. been shown t o be effective in permitting the cell concentrations necessary for high concentrations of ethanol. corresponding acetate concentration of 3 g/L has been attained. IJungdahlii has been shown to be tolerant of H2S or COS in concentrations exceeding typical levels in synthesis gas.
Rates of carbon uptake by
A CSTR cell recycle system has
A n ethanol concentration of 47 g/L with a C.
- 0
0 C.03 o.:o 0.20 0 . 3 D.LO 0.50
Inlet Gas Flow Rale (mmollmin)
Figure 1. P r o d u c t c o n c e n t r a t i o n s f rom g r o w t h of C. fjungdahfii i n des igned m e d i u m in t h e CSTR.
..
0 iM) 200 300 roo 503 600 7 0 0
Time Lhl
Figure 2 . Product concen t r a t ion measu remen t s for C fjungdahlji i n t he CSTR with cell recycle.
860
LIST OF REFERENCES
Alden, H., E. Bjorhman, and L. Waldheim. Energy from Biomass and Wastes IGT (March. 1991)
Barik, S . , S. Prieto, S.B. Harrison, E.C. Clausen, and J.L. Gaddy, (1988). "Biological Production of Alcohols from Coal Through Indirect Liquefaction," Appl. Biochem. Biotechnol., u. 18, 363 Barik, S . , R.E. Corder, J.L. Vega. E.C. Clausen. and J.L. Gaddy, (1985), "Biological Production of Liquid Fuels and Chemicals from Coal Synthesis Gas," Proceedings of the Coal-Liquid Fuels Technology Symposium.
Borgwardt, R.H., M. Steinberg, E.W. Grohse and Y. Tang, Energy from Biomass and Wastes, IGT (March, 1991).
Clausen, E.C. and J.L. Gaddy: "Biological Conversion of Coal Synthesis Gas," Annual Report, U.S. DOE-Morgantown Energy Technology Center, (May 1985).
Clausen. E.C., O.C. Sitton. and J.L. Gaddy, (1977), "Converting Crops into Methane," Chem. Eng. Prog.. 73.1. 71.
Collaninno, J . and Mansour, (1988), Proc. Energy from Biomass and Wastes IGT.
Fisher, T.F., M.L. Kasbohm, and J.R. Rivero, "The PUROX System,'' Proc. of Nat'l Waste Proc. Conf., Boston (May 1976).
Klasson. K.T.. M.D. Ackerson, E.C. Clausen, and J . L . Gaddy, "Bioconversion of Synthesis Gas into Liquid or Gaseous Fuels." Proceedings Int'l Symp. on Biol. Proc. of Coal, EPRI and DOE, Orlando (May 1990a).
Klasson, K.T., B.B. Elmore, J.L. Vega, E.C. Clausen, and J.L. Gaddy. (1990b). "Biological Production of Liquid Fuels from Synthesis Gas," Applied Biochem and Biotech. ~ 24/25, 857.
Klasson, K.T., M.D. Ackekrson, E.C. Clausen, and J.L. Gaddy, "Bioliquefaction of Coal Syntehsis GAS," presented at the San Francisco ACS Meeting (April 1992).
Phillips, J.R.. K.T. Klasson, E.C. Clausen, and J.L. Gaddy. "Biological Production of lEthanol from Coal Synthesis Gas: Medium DevelopmentStudies." presented at the 14th Symposoum on Biotechnology for Fuels and Chemicals," Gatlinburg, TN (May 1992)
Sitton, O.C.. G.L. Foutch, N.L. Book. and J.L. Gaddy. (1979), "Ethanol from Agricultural Residues," Chem. Eng.Prog., u, 52. Stasson, H.E.M. and H.N. Stiles, (1988), Proc. Energy from Biomass Wastes, IGT .
Vega, J.L. (1985), M. S . Thesis, University of Arkansas.
Vega, J.L., S , Prieto, B.B. Elmore, E. C. Clausen. and J . L . Gaddy. (1989a), Appl. Biochem. Biotechnol. 20/20, 781.
861
IDENTIFYING POTENTIAL BINDING AGENTS FOR UTILIZATION OF WASTES AND RENEWABLE RESOURCES
AS FUELS OR MATERIALS
Kenneth E. Daugherty Chemistry Department
University of North Texas P . O . BOX 5 0 6 8
Masters Hall. Room 5 Denton, Texas 76203
The following is a procedure developed at the University of North Texas for identifying potential binding agents for the utilization of wastes and renewable resources as fuel materials. This procedure is being used for other materials which will be described in the extended paper for book publication.
The goals were to find six low-cost, environmentally acceptable binders for preparing pellets of densified refuse derived fuel (RDF) . The binders had to be capable of being used with RDF to produce a pellet that could be produced in a more stable fashion than with water alone. The pellet produced had to be chemically and biologically stable and had to be capable of being stored for up to six months prior to being used as a fuel.
Over 100 potential binders were considered including glues, natural starches and celluloses, adhesives, waste liquors, fly ashes, dusts, hydraulic cements, reaction cements precipitation cements, etc.
The densification fabrication technique used must remove the pores between the RDF particles (accompanied by shrinkage of the component), combined with growth together and strong bonding between adjacent particles. The following criteria must be met before densification of the RDF can occur:
* A mechanism for material transport must be present
* A source of energy to activate and sustain this material must be present.
The primary mechanisms for transport are diffusion and viscous flow. Heat is the primary source of energy, in conjunction with energy gradients due to particle-particle contact and surface tension.
Much progress in understanding densification techniques has been achieved since 1935. NOW densification is studied by plotting density or shrinkage data as a function of time and by actual examination of the microstructure at various stages of densification by using scanning electron microscopy, transmission electron micros-opy, and lattice imaging.
862 i
Densification mechanisms may include vapor phase, solid phase, liquid phase, and reactive liquid phenomena. Probably the most applicable of these to RDF are solid phase mechanisms, although other forces are undoubtedly present. Diffusion will be important. The differences in free energy or chemical potential between the free surfaces of particles of RDF and free points of contact between adjacent particles will be important. The control of temperature and particle size for densified RDF will probably be extremely important, but control of time less important. Particle size distribution may be of critical importance. Particle shape will also be important.
Other processes are also available to achieve densification, deposition of a solid phase, or strong bonding. These types of processes include hot pressing, reaction densification, chemical vapor deposition, liquid particle deposition, and cementitious bonding. All of these processes were considered during the course of this project and in the pilot-plant phase. The application of pressure during densification of RDF might provide the following processing and property advantages:
Reduction of densification time,
* Reduction of densification temperature,
* Minimization of residual porosity, and
* Higher strengths than can be achieved through pressureless densification, due to the minimization of porosity and grain growth
The RDF was obtained from Madison, Wisconsin: Ames, Iowa: and Monroe County, New York. It was determined in our laboratory that the three sources of RDF were similar and behaved in approximately the same way to binders. The RDF was minus one inch in particle size. The RDF was first dried in the oven for several hours to remove as much moisture as possible at 100°C. Once dried, the RDF was suitable for preparation with binders and follow-up tests.
The preparation involves the weighing of a desired quantity of the dried RDF, usually 30 to 409, and adding to it 5 percent by weight of water. For those binders that are in liquid form, no water is added. All of these components are mixed and the binder- RDF mixture chopped and reduced in particle size with a food processor. The RDF/binder mixture is then placed into a stainless steel die and formed into pellets by a Carver laboratory pellet press using 5,000 lb of pressure. The pellets produced range in weight from 1 to 1.59. The process of making the pellets takes about 30-45 minutes. After the pellets are produced, various tests are conducted according to design protocols and a binder rating system.
863 c
For example, the durability test is conducted in order to determine the durability of the pellets when subjected to handling. Two pellets are weighed by difference and placed into a ball mill jar with then ceramic stones. The jar is allowed to tumble for ten minutes. After this specified time, the two largest remaining pieces are reweighed. The percent durability is calculated using the following formula, with 100% being the ideal:
% Durability = weiaht of lamest RDF pieces x 100 weight of RDF pellets
Another example is the water sorability test, which helps to determine the quantity of water that the pellets absorb within a given time frame (in this case, 2 4 hours). The pellets should absorb as little water as possible in order to further enhance their endurance potential. Two pellets are weighed into a petri dish (W,) and their weight obtained by difference (W). Twenty- five milliliters of water are added, and the pelletspare allowed to absorb water for one hour. Actually, the pellets remain on each side for 30 minutes in order to ensure equal water absorption, thus resulting in a total of one hour. The pellets are then placed into a desiccator with a constant 100% relative humidity and maintained for 24 hours; and the petri dish is then placed into an oven at 1 0 0 ° C to dry. Following the 2 4 hour period in the environmental chamber, the pellets are removed and reweighed (Wt). The percent absorbed water is calculated using the following formula, with the lower percentage being most favorable:
w, - w, WP
% Absorbed Water = x 100
The overall study was divided into two sections, a preliminary study and a laboratory study. The preliminary study was designed to reduce the number of binders that would be investigated in the laboratory study to approximately 50. In order to accomplish this, a series of protocols was developed for the preliminary study and the laboratory study in order to evaluate the potential binders discussed previously. The protocols were subjected to peer review early in the project and modified in some instances.
The preliminary study was divided into two parts. They were binder cost and environmental acceptability, rated at 6 0 points and 4 0 points, respectively, for a total of 100 points. Cost was considered to be the more important aspect of a suitable binder. This is because the RDF is a low-cost binder with a low-cost material. This would only make sense if the binder could be used in very low concentrations, and none of our studies indicated that this was possible. The environmental acceptability part was broken into three segments - toxicity, odor, and emissions - rated at 10 points, 10 points and 2 0 points, respectively.
864
The laboratory study was divided into 11 segments; binder dispersability, binder Btu content, binder ability to wet, binder ash content, pellet weatherability (including in the ice box at 32'F and in the environmental chamber at llO°F), pellet water sorability, pellet caking, pellet ignition temperature, moisture content, durability, and aerobic stability. These were considered to be in two parts, the first four segments being binder properties and the last seven segments being pellet properties. The binder properties were rated at 7 points per segment, and the pellet properties were rated at 9 points per segment (with the exception of weatherability, which was rated at 9 points each for the ice box test and the environmental chamber test).
The above concepts were also subjected to peer review, and comments generally favored this approach. Protocols for each study were developed and will be discussed in the extended paper.
Worksheets were prepared listing point values for the various binder and pellet properties identified previously. The sheets are arranged in order from the binder having the highest rating to the binder having the lowest rating. In some cases, binders with low preliminary study ratings were tested in the laboratory study, in order to evaluate different types of binders.
The top six binders were carbon black, calcium hydroxide, free lime, cement kiln dust, limestone and lignite fly ash. Further pilot plant work at Jacksonville Naval Air Station in Florida indicated that calcium hydroxide was the best binder. The above procedure, with some modifications, is being used with other solid waste problems. These will be briefly discussed in the extended paper.
865
t
PCFB GASIFICATION OF BIOMASS
ANDERS L. HALLGREN, INGEMAR BJERLE, LARS A. CHAMBERT
University of Lund Chemical Center
Dept. of Chem.Eng. II Box 124, S-221 00 Lund
Sweden
Keywords: pressurized circulated fluidized bed biomass gasification; hot gas filtering; hot gas alkali removal
INTRODUCTION
Gasification technology is and has been widely used in different ways of commercial fuel gas production. Coal gasification technology has shown to have potential also in biomass gasification although it must be kept in mind that coal and biomass show quite different behavior in thermochemical processes. The technology has been applied to biomass gasification and numerous research efforts are referred to in the literature. These represent in many ways a firm theoretical base [1,2].
Nevertheless, additional comprehensive information is needed for taking the technology of pressurized biomass gasification into industrial scale applications. However, the real commercial impact in powcr generation is yet to be seen mainly because of perhaps immature biomass pretreatment and conversion technology, lacking hot gas cleaning solutions and of course depending o n relatively low oilprices. A successful commercial development of the technology is neededand how fastthis is goingtotakeplaceiscrucial fortheintroductionofbiomass basedpower production.
Research activities in the United States Considerable efforts and substantial resources have been invested in studying pressurized gasification. A small selection of :he recent efforts is presented below [3,4].
The Institute of Gas Technology (IGT) in Chicago (IL) has been conducting research with an oxygenblown, fluidized-bed gasification reactor designed to operate at pressures up to 3.5 MPa. IGT has carried out acomprehensive test matrix with the Renugas process development unit with funds from the US. Department of Energy (Don). These tests have been completed to determine the effects of various process variables in order to obtain parametric information for process optimization with refuse derived fuels (RDF) and other biomass feedstocks.
On the Maui island of Hawaii the Pacific International Center for High Technology Research (PICHTR), Hawaii Natural Energy Institute of the University of Hawaii, Hawaiian Commercial SugarCompany,TheRalph M. Parson Engineering Company, and IGT are planning a demo-scale plant for biomass (bagasse) gasification. The start of operation is scheduled for the second half of 1993 and theexperimental program will be supported by the US Department of Energy. The IGT Renugas process is going to be applied, Le. the pressurized air-blown fluidized bed gasifier. Apart from the main fuel bagasse other biomass and wastes such as eucalyptus wood chips, RDF, and agricultural wastes will be used as well.
The University ofMissouri-Rollahas been investigating thetechnical feasibilityof using ametal fired-tub heat-exchanger to provide heat for a fluidized-bed gasifier. This concept allows the production of medium-energy gas or synthesis gas without the use of oxygen. The gasifier is a stainlesssteel reactor fitted with an internal heat exchangerbundleconsistingofthirty stainlesssteel U-tubes. Hot combustion flue gases, which could be produced by burning a portion of the product gas or other fuels such as char, are passed through the heat exchanger. Extensive series have been conducted in order to determine the effect of various process variables. Wood feed rates ranged from 45 kg/h to 180 kg/h producing a product gas with a higher heating value ranging from 14.6 to 2 1.6 MJ/Nm’.
866
Battelle-Columbus Laboratories (BCL), Columbus (Ohio) has conducted research on a medium-energy gasification process which involved an indirectly heated dual fluidized bed gasifier by circulating low density, incandescent sand to the gasifier. Entrained sand and any non-reacted char leaving the gasifier are separated from the gas product in acyclone. The char and sand are fed into a fluidized-bed, air-fired, combuster where the char and supplementary fuel are bumed. The BCL gasification process is capable of operations at temperatures up to 870°C and pressures slightly above atmospheric. The gasifier has been tested with a number of biomass feedstocks including hard and soft woodchips, sawdust, hogged fuel and bark strips at wood feed rates as high as 960 kg/h. The gas product higher heating value has been ranging from 16.0 to 19. I MJ/Nm3and the carbon conversion to gas in the gasification reactor varied from 50 to over 90 % for wood containing 3-34 % moisture.
Research activities in Europe A commercial application of gasifiers developed in Finland is the A. Ahlstrom Oy PYROFLOW circulating fluidized-bed gasifier. Amaximum thermal output of 35 MWis accomplished using not only wastewoodasthemain fuel butalsopeatisawell-suitedfeedstock.ThePYROnOWgasifier consists of a refractory-lined cylindrical vessel and a refractory-lined cyclone. A fluidized-bed of hot sand is operated in a circulating mode where dry waste wood is entering the bed through the side of the reactor.
The German company Lurgi GmbH has been involved in developing and designing commercial gasifiers applicable for various feedstocks ranging from coal to biomass, wastes and RDF. The circulating fluidized-bed gasification system is commercially available for the production of low- energy gas. The gas produced is suitable for a number of processes and particular interesting for the paper and pulp industry, where sufficient bark and wood-waste are produced without costly transportation and distribution overheads to partly substitute oil and gas.
Besides the applied biomass gasification technology, basic research has been reported in the literature from different places in Europe. However, the topics covers a broad scientific spectrum which is sometimes difficult to overview. Research groups at VTT in connection with universities in Finland represent a forward position in this field and additionally the University of Saragossa (Spain) should bementioned in thiscontext. Lately herebasic research was successfully conducted in catalytic steam gasification of biomass and wastes sponsored by the governmental funds.
Research activities in Sweden The biomass gasifiers built in Sweden so far have been, with few exception, atmospheric updraft/ downdraftorfluidized bedgasifiersforthe productionof burnablegases for district heating systems and the paper pulp industry. One of theexceptions is the Studsvik MINO-plant which was planned for the production of synthesis gas from wood through pressurized oxygen gasification. Comprehensive research efforts were made with the MINO plant and gave the Studsvik Energy, Thermal Processes Laboratory a leading position in gasification technology [5].
During the last years the power industry in Sweden has shown a growing interest in the gasification technology and particularly in biomass gasification. Through combinedcycle applications good possibilities are supposed to begiven in producingenvironmentally favourable powerat high efficiency. In the light of 10 GW nuclear power generation in Sweden phasing out after the year 2010, ithasbeenshownthat Sweden hasapotentialof 33-53TWh/yearofelectricityfrombiomass based gas turbine systems.
Taken inconnection withSweden'straditionally genuineknowledgein thefieldofthermcchemical processing and particularly in the gasification technology, abundant opportunities should be available for succussfully implementing biomass based power generation.
The PCFB biofuel gasifier at Lund Institute of Technology (LIT) The pressurized gasifier is intended to be a small flexible test rig which will offer adequate scientific results and constitute the link between lab-scale developments and industrial scale application. The pilot plant will to acertain degreebeoperated parallel to the Sydkraft biomassgasifier at Vamamo forevaluation andconfirmation ofthe test results. Thegasifier at LIT isconstructed as acirculating
867
i
fluidized bedand theintentionsare to study gasificationofdifferentbiomass feedstocks atpressures up to 2.5 MPa and at temperatures between 600 - 1050°C.
The objective of the test program is to investigate the influences of the process parameters on each other and on the product distribution and composition. This will be done in as realistic circumstances as possible regarding pressure intervals, temperature and residence time intervals. In addition to studying the gasification process as such, investigations will be made regarding finishing treatments of the gas products at elevated temperatures and pressures. Examples of such treatments will be. dust separation at high temperatures, desulfurization, tar cracking, catalytic ammonium dissociation, and hot gas alkali removal.
APPARATUS
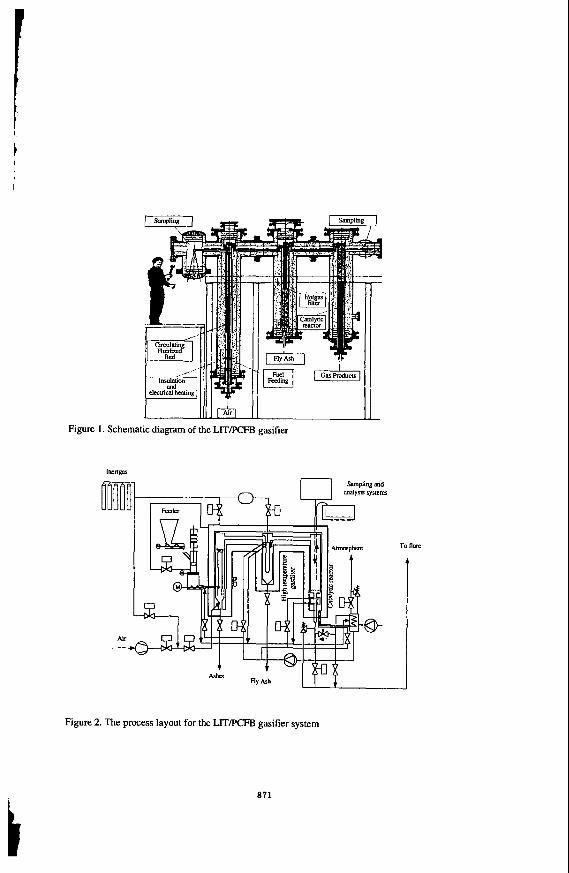
Theequipment which isgoing tobeusedcan becharacterizedasaprocessdevelopmentunit(PDU). The PDU consist of four main parts; feeder, circulating fluidized bed (CFB), hot gas filter, and a reactor for catalytic treatment of dust free gas. The warm parts, i.e. the gasification reactor, the hot gas filter, and the catalytic reactor are concentrically placed inside an outer pressure vessel consistingofthreevertical tubesof0.5m indiameter.Thegaspressureinside thesetubesissuppose to balance the process gas pressure. The pressure vessel alsocontainselectric heating elements and insulation. A schematic diagram of the apparatus is shown in Figure 1.
The feediig system A well defined portion of the feeded biomass is transported with screws into a pressure chamber where the feeded material together with the gas are compressed by means of a hydralic piston. From this chamber the biomass is screwed into the reactor inlet. This setup will demonstrate batch compression followed by continuous feeding into the reactor. Similar technical design has scarcely been seenreportedin theliteratureorin studyingpatents, hence, the feederconstruction mightoffer novel solutions in pressurized feeding systems.
The gasifier The gasifier is constructed as a circulating fluidized bed (CFB) gasifier with options to operate it asabubblingbedgasifier.Greatattention hasbeenpaidtogivetheexperimentalsetupabroadrange of flexibility for modifications. The reactor will have adiameter of 40.9 mm and an approx. height of 3 meter. This makes it possible to operate the CFB at fluidizing velocities and residence times that are comparable with those of industrial scale applications.
Flow conditions typical to CFBwith small diameters have been reported in the literature [6]. A large amount of basic work regarding analyses of flow dynamics have been made with small scale equipment at atmospheric pressure and at various temperatures
Figure 3 shows the primary range of operation at 950 "C and at the pressure interval 0.4 - 2.0 MPa. Calculations have been done in order to find the influences of various fluidization velocities on the total gas production andfueVairconsumption. As can benoted in the diagram, thecalculated maximum gas production is 42.24 Nm'h at an air and fuel feed of 22.78 Nm'h and 18 kgh respectively.
Afluidization velocityof 1 . O d s isthecalculatedminimumvelocity inorderestablishreasonable fluidization in the gasifier of diameter 40.9 millimeter. Accordingly, the maximum calculated fluidization velocity is 2.0 m/s in the pressure interval mentioned above.
The reactor consist of an inner and an outer tube with an annular space in between. The feed including hedmateiial is introduced directly into the inner gasifier. Solid material will be separated from the gas phase with a low pressure axial cyclone at the top of the reactor. The separated solid materials are forced down through the annular space between the inner and outer reactor tube. At the bottom, material re-introduction into the riser at minimum acceleration losses and increased circulation is possible due to the design of the gas inlet distributor. The material recirculation is supposed to be governed by the height of the material in the return tube. High transport density and good mixing of the feed material and the separated solid materials are wanted in order to insure
868
i t
gasification and gas quality.To demonstrate the function of these parts will propably show major practical significance in industrial scale applications.
The hot gas filter Before the hot gas from the gasifier enters the filter element is cooled down to a temperature between 300-800°C depending on given circumstances. The gas is cooled by letting it pass aspiral shaped tube heat exchanger containing water at 2.0 MPa and 212°C.
The hot gas filter element consists of a sintered granular ceramic material. The filter is 1 meter long and have outer diameter of 60 mm and is designed as a single conventional industrial filter. The potential of the filter will be tested with respect to the function within a broad temperature interval for the optimization of future plants gas turbine inlet gas temperature.
The catalytic reactor The catalytic reactor will be used for investigations concerning adsorption of alkalihaw metal elements, tar cracking, ammonia reduction, and H,S . The reactor is of a downdraft type and consists of a stainless steel tube filled with the catalytic material. As for the gasifier and the hot gas filter, the catalytic bed reactor isconcentrically placed inside an outerpressure vessel containing electric heat elements for heating up to approx. 1OOO"C.
EXPERIMENTAL
Background Pyrolysis, thermal dissciation of an organic material in an oxidizing free atmosphere, is a thermal precursor to gasification. Gasification of solid materials is normally regarded as the combination of pyrolysis followed by heterogeneous and homogenous chemical reactions of chars, tars, and primary formed gaseous components.
In pure pyrolysis sufficient energy must be added for the conversion while in gasification adequate or at least part of the energy required for the reactions is internally produced mainly through oxidation of the pyrolysis products. Consequently, additional indirect heating can be kept at aminimum and sub-stoichiometric amounts of of air, oxygen, and water vapor produce burnable gaseous products.
Through varying different parameters, e.g. temperature, pressure, and material residence time, the gasification reactions can be influenced in the desired direction that establish different spectra of the gas product composition. The equibrilium composition of the gas product for an adiabatic airhiomass conversion at different air to fuel ratios is indicated in Figure 4.
The experimental program Sawdustfrom woodand forestwastes in the first phaseoftheexperimental program. Possibly other feedstocks such as RDF and agricultural wastes will be taken into account as feedstocks in future research programs.
A complete survey of the gasification products, including closing material balances, as well as scientific adequate gasification investigations are judged possible. The basic properties of the reactor will be studied including monitoring the flexibility influenced by different process conditions. In addition to general gasification studies the experimental program, based on two years, will focus on the following subjects:
- influences from the inherent moisture and the particle size distribution of the solid biofuel on product distribution and composition
- qualitativdquantitative analyses of the distribution of alkaliltrace element metals in the gasification products
- influences from dolomite and other additives in the bed material - tar and ammonia cracking as a function of the type catalysts.
869 c
Apart from the experimental program, verifications of dynamic modelling work of the reactor function will be carried out.
SUMMARY
A pilot plant biomass PCFB-gasifier is being installed at the Chemical Center in Lund. The official project start-up wasin February 1992 afteraone-yearextensive feasibility study with involvement's from design consultants and Sydkraft AB. However, the financial issue wasn't completely solved until late April 1992 which delayed the actual project start-up to the beginning of June 1992.
The purposeofthe projectis toestablish realisticconditionsforthermal gasification ofbiofuel andgascleaning,andtostudy thevariousparametersinvolvedin theprocessandhowthey influence each other.
Project status May 1993 A first version of a comprehensive literature survey has been concluded. This survey will be published and available through Nutek.
After a very busy investment period we are now escalating our efforts in assembling the pilot plant. A first pressurized test series with the biofuel feeding system has been successfully completed. Fluidization and feeding tests will be continued during the summer of 1993. Due to problems involved with the delivery of certain parts and materials, the experimental program start- up is delayed The first phase of the experimental program will be implemented during the second half of 1993 and 1994
ACKNOWLEDGMENTS
This project is finacially supported by theNational BoardforIndustrial andTechnica1 Development (NUTEK), Sydkraft AB, and the Swedish Energy Development Corporation (SWEDCO).
REFERENCES
1. Rensfelt, E., "Practical Achievements in Biomass Gasification" paper presented at BioEnergy 84, June 18-21 1984, Gothenburg, Sweden.
2. Bridgewater, A.V., "An overview of thermochemical biomass conversion technolo ies", in Wood:fuel for thought. Proceedings of the conference held at Bristol(6K) 23-25 Oct.1991
3. Schiefelbein, G. F., "Biomass Thermal Gasification Research : Recent Results from the United States DOE'S Research Program", Biomass 19 (1989) 145-159.
Trenka, A.R, Kinoshita, C.M., Takahashi, P.K., Philli s, V D , Caldwell , C., Kwok, R., Onishak, M., Babu, S.P.,"Demonstration pyant forpressurized asification of biomass feedstocks". 15th Annual Conference on Energy from
Biomass and Wastes, Washington DC, March25-29 1991.
Rensfelt,E.,Waldheim,L., Blackadder, W.H., "Gasification research anddevelo ment 1980-1990 by Studsvik", internal report STUDSVIK-EP-9IR. April 30, 1981.
4.
5.
6 . Mori, S . , et al, "Turbulent fluidization phenomena", Nagoya Inst. of Technology, Showa, Nago a, Mitsubishi Gas Chemical Co Ltd, Matsuhama, Niigata; CFB Conference I{ Compiagne 1988.
870
Figure 1. Sc
Air
:hematic diagram of the LITPCFB gasifier
I I 7
Figure 2. The process layout for the LITPCFB gasifier system
871
bar A
Figure 3. Test rigg range of operation as a function of the fluidization velocity.
Figure 4.
................................... i’ ..
......................... / _. ............................................................... R H 2 D -
Gas product composition for adiabatic airhiomass conversion versus the air to fuel ratio at 0. I MPa.
872
Genetic Engineering for Productivity in the Fermentation of Xylose to Ethanol
XU, Jie; Das, Anu; Erbe, Jarrod; Hall, L.M. & Taylor, K.B. Department of Biochemistry, The Fermentation Facility, The University of Alabama at Birmingham, University Station, Birmingham, AL 35294
With the increased awareness of the limitations in the world supplies of petroleum came an increased interest in gasoline extenders and additives. The use of ethanol as an extender on a national scale is associated with advantages (1,2): the security of fuel sources; a more favorable foreign trade balance; and the renewability of the raw materials for production. Although ethanol can be produced either from a petroleum component or by fermentation, the latter source is the only one associated with all of the advantages above. The most attractive raw materials for ethanol production in this country are corn sugar, and sugar derived from wood and crop residues (lignocellulosic materials). Corn ($98-$104 per ton), (2) can be competitive only in special circumstances, such as government subsidy. However, lignocellulosic material ($20-$70 per ton) could be competitive, if the technical limitations associated with processing and fermentation could be overcome. Although the approximate price of corn-derived ethanol is currently $1.20 per gallon, it is estimated that the cost of fuel ethanol fromlignocellulosic materials should be $0.60-$0.80 per gallon
The most productive and cost effective processing of lignocellulosic material currently consists of mild acid hydrolysis to release a fraction containing primarily xylose (15%-40% of dry weight) followed by strong acid treatment to release the glucose (30%-60%), (4,5,6). The sugars are then fermented, usually separately, to ethanol. However, there are two steps in particular that limit the productivity and increase the cost of this process: the hydrolysis of cellulose and the fermentation of xylose. The most promising solution to the former problem is enzymatic hydrolysis, but currently the enzymes remain too expensive and the hydrolysis is incomplete. The problem with xylose fermentation results from a poor overall yield. It is estimated that the efficient conversion of xylose would reduce the cost of ethanol by about $0.40/gal ( 7 ) .
A number of both yeasts and bacteria will convert xylose to ethanol and other products (8,9,10), but most of the attention has been given to three yeast strains: Pachysolen tannophilus, Candida shehatae, and Pichia.stipitis. Yeast has the advantages of growing in a simple, inexpensive medium; growing at a low pH to minimize contamination; and being the subject of much past experience. Although both bacteria and yeast generally convert D-xylulose to hexose (as the phosphate esters) and convert the hexose to ethanol by the classic fermentation pathway, they differ with respect to the methods used to convert D-xylose to D-xylulose. Most bacteria carry out the conversion with a single enzyme, xylose isomerase; whereas most yeast reduce the xylose to xylitol with xylose reductase and subsequently reoxidize it to xylulose with xylitol dehydrogenase.
The principal limitation to the ethanol yield in the yeast fermentation is the accumulation of xylitol in molar amounts equal to
( 3 ) *
c 813
or exceeding that of ethanol (11). Furthermore, the accumulated xylitol is not further utilized. Fermentation under micro-aerobic conditions reduces the amount of xylitol (12,13) accumulated, but the oxygen also promotes the further oxidation of ethanol.
The ethanol yield has been improved by the addition to the medium of fatty acids (14), polyethylene glycol (15), azide (16), or acetone (17). In addition mutants with increased yield have been reported (18,19,20). However, none of these strategies seems to have become widely used in practice. xylose isomerase has been utilized in the fermentation to facilitate the conversion of xylose to xylulose (21), but neither the equilibrium of the reaction nor the pH optimum of the enzyme is favorable (22). Several workers have described strains of saccharomyces cerevisiae (23,24) and Schizosaccharomyces p o m e (25) into which the xylose isomerase gene has been cloned, but the productivity was low presumably because of low levels of transport systems, xylulokinase, transketolase, and transaldolase.
The most important unanswered questions deal with the causes of xylitol accumulation and its non-utilization. Several investigators have attributed xylitol accumulation to the fact that the majority of the xylose reductase activity requires NADPH, whereas the xylitol dehydrogenase requires NAD (26,27). However, if this nucleotide imbalance were the only cause, the utilization of xylose would quickly stop, because of the low concentration of intracellular nucleotides.
The poor xylitol utilization is inconsistent with its status as an intermediate. Although the utility of oxygen and acetone in xylitol conversion, as well as its redox status, indicates that an electron acceptor is necessary, xylitol still accumulates to a very significant extent and the utilization of extracellular xylitol remains very poor in the presence of oxygen.
The present work was undertaken to provide answers to these questions and to utilize the answers to design and implement a strategy of metabolic and genetic engineering to develop a strain of Pachysolen tannophilus to ferment xylose efficiently.
RESULTS
Whole, resting cells of Pachysolen tannophilus converted xylose to ethanol (yield, 1.11 mole/mole) but did not convert xylitol (28). However, a cell-free extract, prepared by French pressure cell and low- speed centrifugation, produced ethanol from both xylose (yield, 1.1 mole/mole) and xylitol (yield, 1.64 mole/mole; theor, 1.67 mole/mole). These results supported the hypothesis that the cell permeability to xylitol limits its utilization and the fact that nystatin, amphotericin B, and filipin; all agents that increase the cell-membrane permeability of yeast and fungi (29,30), increased the rate 40-fold.
In order to simplify the investigation of the requirements for xylose metabolism the putative pathway was separated into two parts by the inclusion of xylose isomerase (Spezyme GI, Finnsugar Biochemicals, Inc.) in the incubations with the fractions of the cell-free extract. Preliminary experiments showed that ethanol formation from xylose by the crude cell extract was stimulated 9-fold by added xylose isomerase.
In the Presence of Xylose Isomerase the activity of the HMw fraction, prepared by gel filtration of a soluble fraction of the cell- free extract, was restored by the addition of both ADP and NAD' (Table 1). Although NAD+ stimulated ethanol formation in this preparation (fraction A), its complete removal required treatment three times with
a74
gel filtration and once with charcoal (fraction B, Table 1). In contrast to our previous results with xylitol ( 2 8 ) xylose is
metabolized in the absence of oxygen, and xylose is metabolized by soluble fractions of the cell-free extract fromwhich the membranes and organelles have been removed by centrifugation.
Although the addition of NAD' and ADP restored the production of ethanol from xylose by the HMW fraction, in the presence of xylose isomerase, their addition failed to restore ethanol formation from xylose by the same fraction in the absence of xylose isomerase. In addition, the inclusion of NADP+, NADPH, or ATP in addition to NAD+ and ADP, as well as the inclusion of a variety of other coenzymes and metal ions in the presence of NAD+, NADP' and ADP failed to restore activity.
Because of the fact that added NADPH was rapidly consumed by the HMW fraction in the absence of xylose and the fact that, at higher concentration (>lo0 pM), both NADPH and NADP' inhibited ethanol formation from xylose by the unfractionated cell extract, three NADPH generation systems were tested to maintain a constant supply of the reduced coenzyme at low concentration: partially purified transhydrogenase from E . coli K-12, NADP-linked isocitrate dehydrogenase from porcine heart, and NADP-linked alcoholdehydrogenase from Thermoanaerobium brockii. Although transhydrogenase activity ineffective in the restoration of ethanol production, both the NADP- linked isocitrate dehydrogenase and the alcohol dehydrogenase stimulated the formation of ethanol from xylose by about 60 and 8 0 fold respectively (Table 2 ) .
A number of factors contribute to the causes of xylitol accumulation. Certainly the fact that xylose reductase requires NADP whereas xylitol dehydrogenase requires NAD (nucleotide imbalance) is one of the factors. Another is certainly the fact that extracellular xylitol is not normally utilized by whole cells.
In experiments containing purified cell-free fraction, xylose isomerase, NAD and ADP, xylitol was produced during xylose metabolism (Table 3 ) . Furthermore, the gas chromatographic assay for ethanol contained an additional peak that had the same retention time as acetaldehyde. Therefore, some of the NADH generated by glyceraldehyde phosphate dehydrogenase is reoxidized in the generation of xylitol, presumably from xylulose by xylitol dehydrogenase. The addition of NADP' had little effect on the amount of ethanol made from xylose, but it increased the xylitol accumulation by 2.5-fold; increased the xylose consumption by 2-fold; and eliminated the acetaldehyde peak (Table 3). Therefore, most of the xylitol is generated by xylose reductase in these extracts containing all of the cofactors and presumably in the whole cells.
Xylose is reduced to xylitol with electrons from the pentose- hexose cycle, but the poor coupling of the rate with the rate of xylitol dehydrogenase causes xylitol to accumulate faster than it is utilized. The intracellular xylitol leaks out of the cell and becomes diluted in the medium, from which it is not reutilized because the transport back into the cell is limiting. The intracellular xylitol can be metabolized, if oxygen is present. Thus oxygen is required for optimum xylose metabolism.
The logical strategy for process improvement according to the results above would be the transformation and expression of the gene for xylose isomerase in one of the xylose-fermenting yeasts. However, it would also be necessary to inhibit both the xylose reductase and xylitol dehydrogenase, in order to prevent xylitol accumulation. However, the transformants should be able to ferment xylose to ethanol
t 875
anaerobically. The genetic engineering strategy to accomplish these objectives
takes advantage of homologous recombination in yeast, at least in Saccharomyces cerevisiae, in which genetic material with homologous DNA sequences will insert in the homologous gene with high frequency. Therefore, the desired genetic construct will contain the gene of interest, xylose isomerase plus a suitable promoter, flanked on either end with DNA sequences homologous to those for xylose reductase or those for xylitol dehydrogenase. These constructs should take advantage of the high frequency of recombination to increase the transformation frequency as well as inactivate the target gene.
In preliminary experiments a gene conferring antibiotic resistance, e.g. kanamycin, will be used in place of the xylose isomerase gene because the feasibility of the strategy and the optimal experimental conditions can be determined with an easily selectable marker. The successfully transformed strain should be resistant to the antibiotic and be unable to grow on xylose. In subsequent experiments the gene for antibiotic resistance will be put in tandem with the gene for xylose isomerase. In the latter case the successfully transformed strain should be antibiotic resistant and grow anaerobically on xylose.
The identification of and the determination of the sequences for xylose reductase and xylitol dehydrogenase in Pachysolen tannophilus require a probe with an homologous DNA sequence. The gene for each of the two enzymes from Pichia stipitis has been identified and sequenced (31,32), and part of the amino acid sequence of xylose reductase from Pachysolen tannophilus is known (33). A homologous probe for the Pachysolen gene for xylose reductase has been designed and constructed by back translating the amino acid sequence of a region that is highly homologous with the Pichia sequence according to the most frequent codon usage of Pachysolen. This probe was made radioactive and used to test binding to whole Pachysolen DNA, a restriction enzyme digest of Pachysolen DNA, and to the DNA from clones from a xylose-induced cDNA library of Pachysolen DNA. The positive results from each experiment are being tested further with this and similar probes, and the appropriate DNA will be sequenced to identify the limits of the coding sequences and the promoter for the gene.
876
Literature Cited
1. Lynd L. R. Appl. Biochem. Biotechnol. 1990, 24/25, 695-719. 2. WyIIIan, C. E., and Hinman, N. D. Appl. Biochem. Biotechnol. 1990,
3. Lynd L. R., cushman, J. H., Nicholas, R. J. and Wyman, C. E. Science 1991, 259, 1318-1323. 4. Whistler, R. L., Bachrach, J. and Bowman, D. R. Arch. Biochem. 1948, 19, 25-33. 5. Weihe, H. D., and Phillips, M. J. Agr. Res. 1940, 60, 781-786. 6. Rosenberg, S. L. Enz. Microb. Technol. 1980, 2, 185-193. 7. Hinman, N. D., Wright, J. D., Hoagland, W and Wyman, C. E. Appl. Biochem. Biotechnol. 1989, 20121, 391-401. 8. Skoog K., and Hahn-Hagerdal, B. Enzyme Microb. Technol. 1988, 10, 66-80. 9. Toivola, A., Yarrow, D., van den Bosch, E., van Duken, J. and Scheffers, W.A. Appl. Environ. Microbiol. 1984, 47,1221-1223. 10. Nigram J. N., Ireland, R. S., Margaritis, A. and Lachance, M. A. Appl. Environ. Microbiol. 1985, 50, 1486-1489. 11. Taylor., K. B., Beck, M. J., Huang, D. H. and Sakai, T. T. J. Ind. Microbiol. 1990, 6, 29-41. 12. du Preez, J.C., Prior, B. A. and Monteiro, A. M. T. Appl. Microbiol. Biotechnol. 1984, 19, 261-266. 13. Debus, D., Methner, H., Schulze, D. and Dellweg, H. Appl. Microbiol. Biotechnol. 1983, 17, 287-291. 14. Dekker, R. F. H. Biotechnol. Bioeng. 1986, 6, 605. 15. Hahn-Hagerdal, B. Joensson, B. and Lohmeier-Vogel, E. Appl. Microbiol. Biotechnol. 1985, 21, 1173-175. 16. Hahn-Hagerdahl, B., Chapman, T. W. and Jeffries, T. W. Appl. Microbiol. Biotechnol. 1986, 24, 287. 17. Alexander, N. Appl. Microbiol. Biotechnol. 1986, 25, 203-207. 18. Jeffries, T. W. Enz. Microb. Technol. 1984, 6, 254-258. 19. Lochke, A. H. and Jeffries, T. W. Enz. Microb. Technol. 1986, 8, 353-359. 20. Lee, H. James, A. P. Zahab, D. M. Mahmourides, G., Maleszka, R. and Schneider, H. Appl. Environ. Microbiol. 1986, 51, 252-1258. 21. Gong, C. S., Chen, L. F., Flickinger, M. C. Chiang, L. C. and Tsao, G. T. Appl. Environ. Microbiol. 1980, 41, 430-436. 22. Olivier, S. P. and du Toit, P. J. Biotechnol. Bioeng. 1986, 28,
23. Sarthy, A. V. Appl. Environ. Microbiol. 1987, 53, 1996. 24. Batt, C. A. Carvallo, S., Easson, D. D., Jr., Akedo, M. and Sinskey, A. J. Biotechnol. Bioeng. 1986, 28, 549. 25. Chan, E. C., Ueng, P. P. and Chen, L. Biotechnol. Lett. 1986, 8, 231. 26. Bruinenberg, P. M., DeBot, P. H. M., Van Dijken, J. P. and Scheffers, W. A. Eur. J. Appl. Microbiol. Biotechnol. 1983, 18, 287- 292. 27. Bruinenberg, P. M., DeBot, P. H. M., Van Dijken, J. P. and Scheffers, W. A. Appl. Microbiol. Biotechnol. 1984, 19, 256-260. 28. XU, J. and Taylor, K. B. Appl. Environ. Microbiol. 1993, 59, 231- 235. 29. Bolard, J. Biochim. Biophys. Acta 1986, 864, 226-234. 30. SUttOn, D. D., Arnow, P. M. and Lampen, J. 0 . Proc. SOC. Exp. Biol. Med. 1961, 108, 170-175.
24/25, 735-753.
984-699
31. Takuma, S. Nakashima, N. Tantirungkij, M., Kinoshita, S., Okada, H., Seki, T.. and Yoshida, T. Appl. Biochem. Biotechnol. 1991, 28, 327- 40. 32. Kotter, P., Amore, R., Hollenberg, C. P. and Ciriacy, M. Current Genet. 1990, 18, 493-500. 33. Bolen, P. L., Bietz, J. A . and Detroy, R . W. Biotechnol. Bioeng. SYlUp. 1985, NO 15, 129-148.
Table 1. speed supernatant fraction (HSSF)"
Effects of Sephadex column and charcoal treatment of the high
Additional EtOH Fraction Components mgD1
HMW <0.01 HMW - NAD+ <0.01
Fraction Ab ADP 0.12 Fraction A ADP NAD+ 0.64 Fraction BC ADP <0.01 Fraction B ADP NAD+ 0.62
- - - -
bFraction A, the HMW fraction of the high speed supernatant fraction has undergone two consecutive gel filtration treatments. 'Fraction B, Fraction A was treated with charcoal.
Table 2. Restoration of ethanol formation from xylose in the HMW fraction of the crude cell extract in the presence of an NADPH generation system'
Reaction Mixture Substrate EtOH Made mglml
None Xylose <o. 01 IC' + ICDH' none 0.057 IC + ICDH Xylose 0.710 cPen-OH' i ADH' none 0.016 cPen-OH i ADH Xylose 0.925 THb i NADPH (0.1 mM) Xylose <0.01