Trends & Super Cycles in Energy & LME Metals Prices John T. Cuddington,* Daniel Jerrett,** & Abdel Zellou*** April 18, 2015 * Research Professor, Colorado School of Mines ** Denver Regional Council of Governments *** TD Williamson, Inc.
Transcript
Trends & Super Cycles in Energy & LME Metals Prices
John T. Cuddington,* Daniel Jerrett,** & Abdel Zellou***
April 18, 2015
* Research Professor, Colorado School of Mines ** Denver Regional Council of Governments
*** TD Williamson, Inc.
Industry-University Collaboration
In CSM’s Division of Economics and Business, we welcome opportunities to engage Mineral and Energy Economics faculty members and graduate students in industry-funded research projects.
This is a great way to help graduate students studying economics, finance, and operations research with applications in the mining, minerals and energy sectors.
This paper extends evidence of super cycles in energy & metal prices thru 2014 using the asymmetric Christiano-Fitzgerald band-pass filter to extract particular cyclical components.
“The study of super cycles necessarily begins with the measurement of super cycles”(Baxter-King 1999)
Our earlier papers on this topic are Cuddington-Jerrett (2008), Jerrett-Cuddington (2008) & Zellou-Cuddington (2012). Cuddington-Zellou (2012) provides a conceptual model that can generate super cycles in metal prices.
Abstract (cont.)
What phase of the super cycle are we currently in?
Crude oil price – super cycle trough in 1996, peak in 2010
Natural gas price – Super cycle trough in 1994; peak in 2006, heading to trough (in 2017, perhaps)
Coal price – Super cycle expansion began in 1999, still moving upward toward peak
Abstract (cont.)
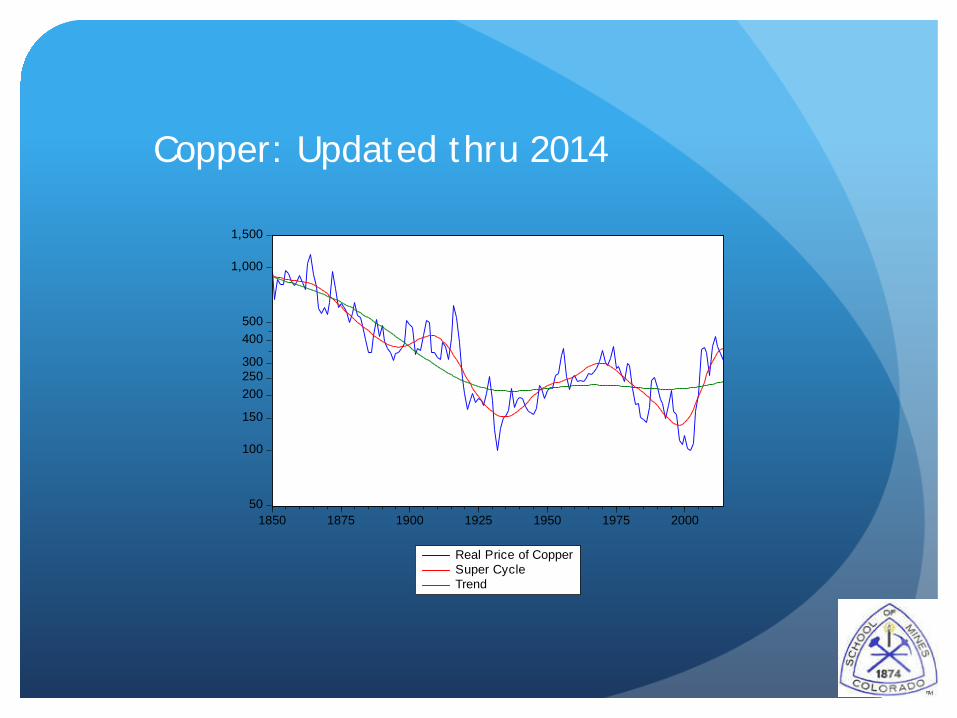
Copper – SC trough in 1998; peak in 2015 (perhaps)
Aluminum – SC trough in 1995; peak in 2011
Lead – SC trough in 1992; peak in 2015 (perhaps)
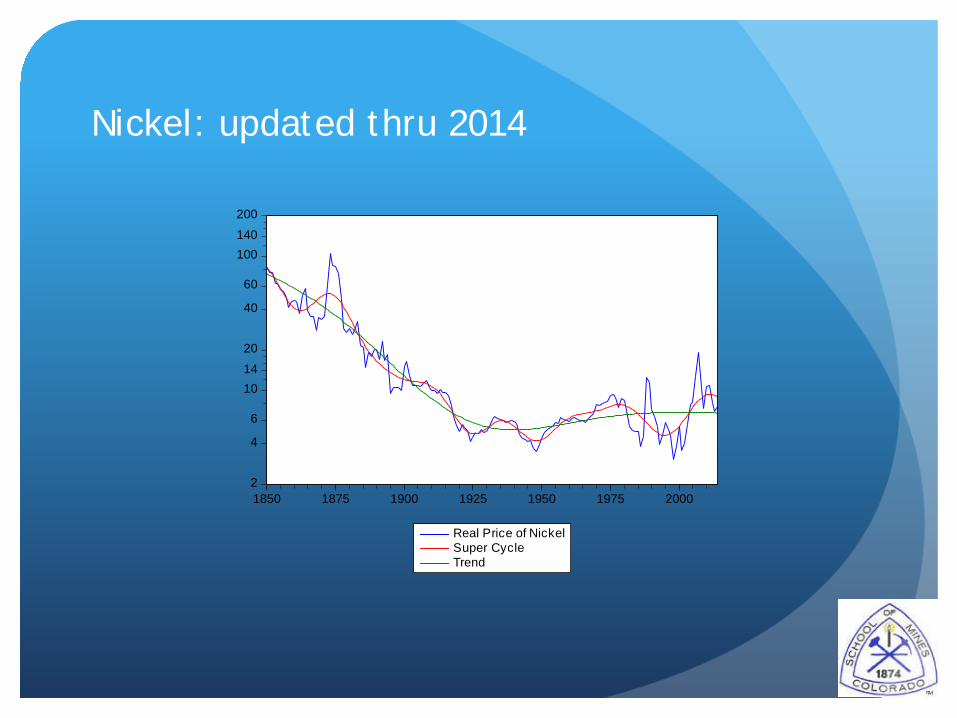
Nickel – SC trough in 1995; peak in 2012
Tin – SC trough in 1998; still heading towards peak as of 2014
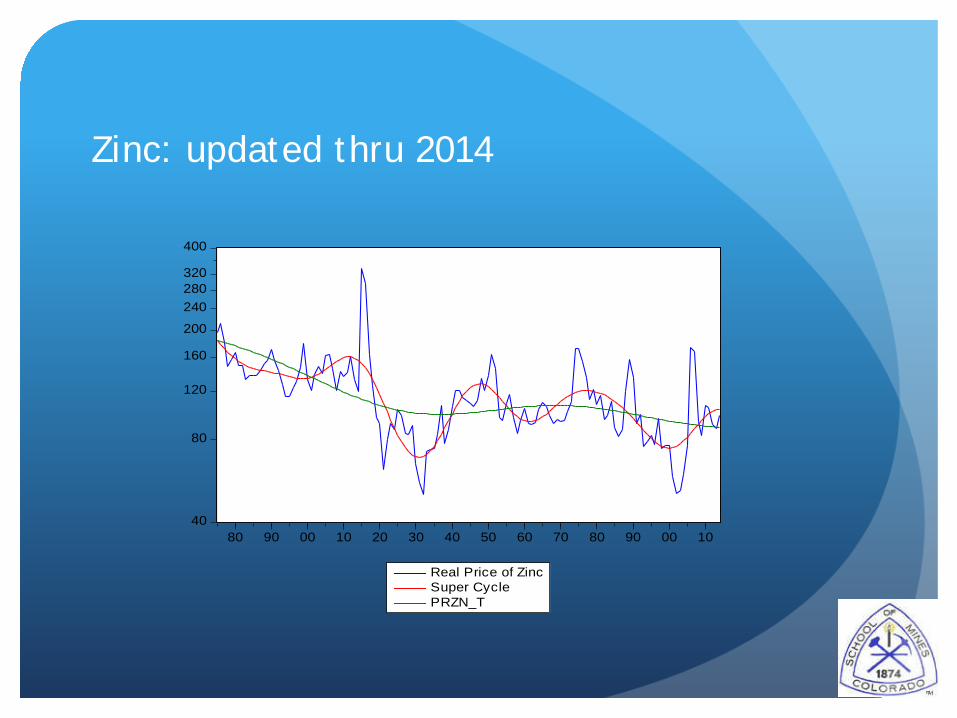
Zinc - SC trough in 1999, still heading toward peak as of 2014
Motivation/Background
Skepticism about long cycles:
Academic economists have expressed skepticism about the existence of long cycles
Inappropriate de-trending techniques can produce cycles that are statistical artifacts (aka ‘spurious periodicity’)
Ongoing interest in trends and cycles in the prices for nonrenewable resources
Comin & Gertler (2006) have found longer cycles in US macro series.
Super Cycles
Alan Heap (Citigroup) argued in March 2005 that “a super cycle is underway, driven by material intensive economic growth in China” (Heap 2005 on p.1)
“A super cycle is a prolonged (decades) long trend rise in real commodity prices, driven by urbanization and industrialization of a major economy” (Heap 2005 on p.1)
“Super cycles are demand driven” (Heap 2005 on p.2)
“There have been two super cycles in the past 150 years: late 1800s - early 1900s, [driven by] economic growth in the USA; and from 1945 to 1975 as a result of post-war reconstruction in Europe, and subsequently by the Japanese economics renaissance” (Heap 2005 on pp. 1 - 2)
Methods for Studying Trends and Cycles
Informal inspection of the data combined with a good knowledge of economic history and particular markets being studied
Formal statistical methods, which have begun to appear in the macroeconomic ‘business cycle’ literature.
Hodrick-Prescott (1997) filter for isolating long-term growth effects (trends) and business cycles.
Band-pass filters of Baxter-King (1999) and Christiano-Fitzgerald (1999).
Band-Pass Filters
Economic time series can be represented as a combination of cyclical components of various periodicities
Christiano and Fitzgerald: “The theory of the spectral analysis of time series
provides a rigorous foundation for the notion that there are different frequency components of the data. An advantage of this theory, relative to other perspectives on decomposing time series, is that it does not require a commitment to any particular statistical model of the data. Instead it replies on the Spectral Representation Theorem, according to which any time series within a broad class can be decomposed into different frequency components. The theory also supplies a tool for extracting those components. That tool is the ideal band pass filter.” (1999 p. 1)
Methodology
Use the Christiano-Fitzgerald asymmetric band-pass filter to decompose (the natural logs of) real energy & LME metal prices into several components
Long-term Trend defined as LP_BP(70,infinity)
Trend is assumed to be an I(1) process with drift
Sum of all cyclical components: LP_BP(2,70)
Methodology (cont.)
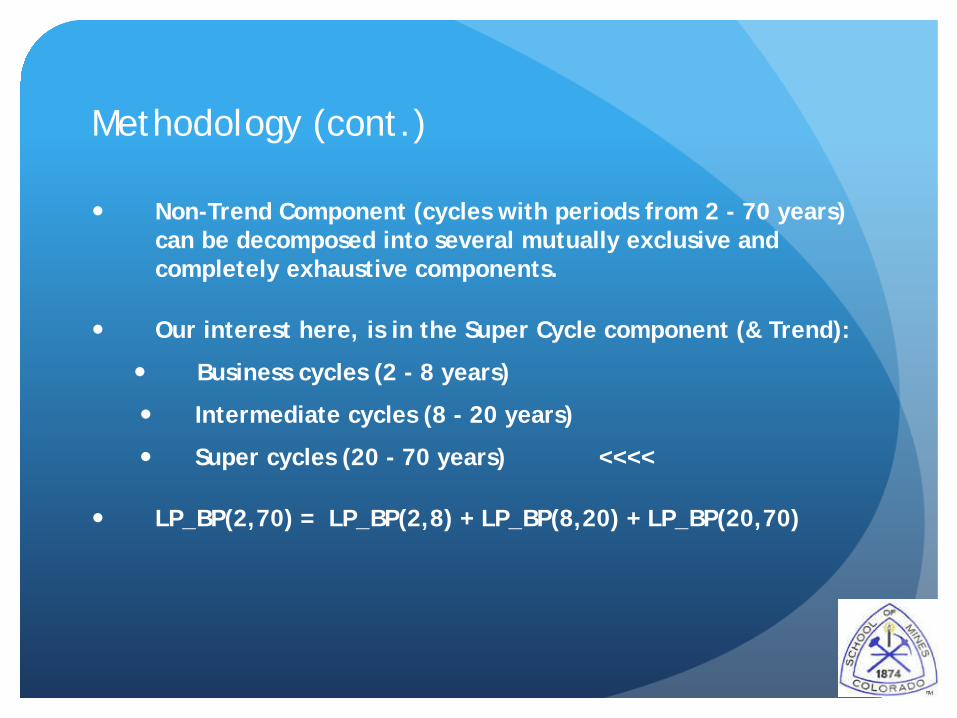
Non-Trend Component (cycles with periods from 2 - 70 years) can be decomposed into several mutually exclusive and completely exhaustive components.
Our interest here, is in the Super Cycle component (& Trend):
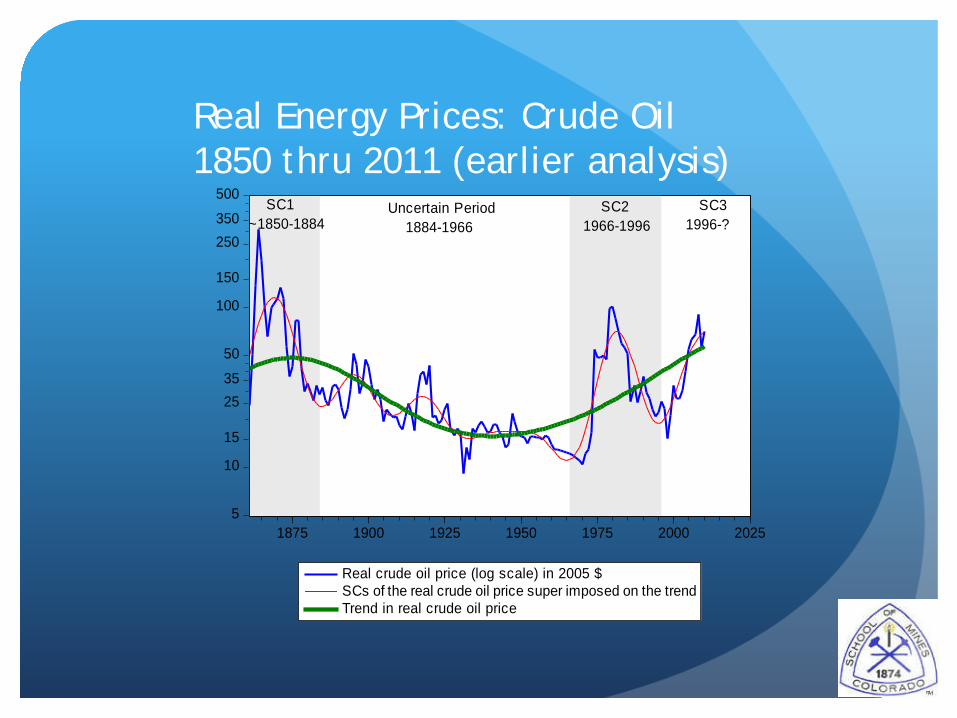
Real Energy Prices: Crude Oil 1850 thru 2011 (earlier analysis)
500
350250
150
100
50
3525
15
10
51875 1900 1925 1950 1975 2000 2025
Real crude oil price (log scale) in 2005 $SCs of the real crude oil price super imposed on the trendTrend in real crude oil price
SC1~1850-1884
Uncertain Period 1884-1966
SC21966-1996
SC31996-?
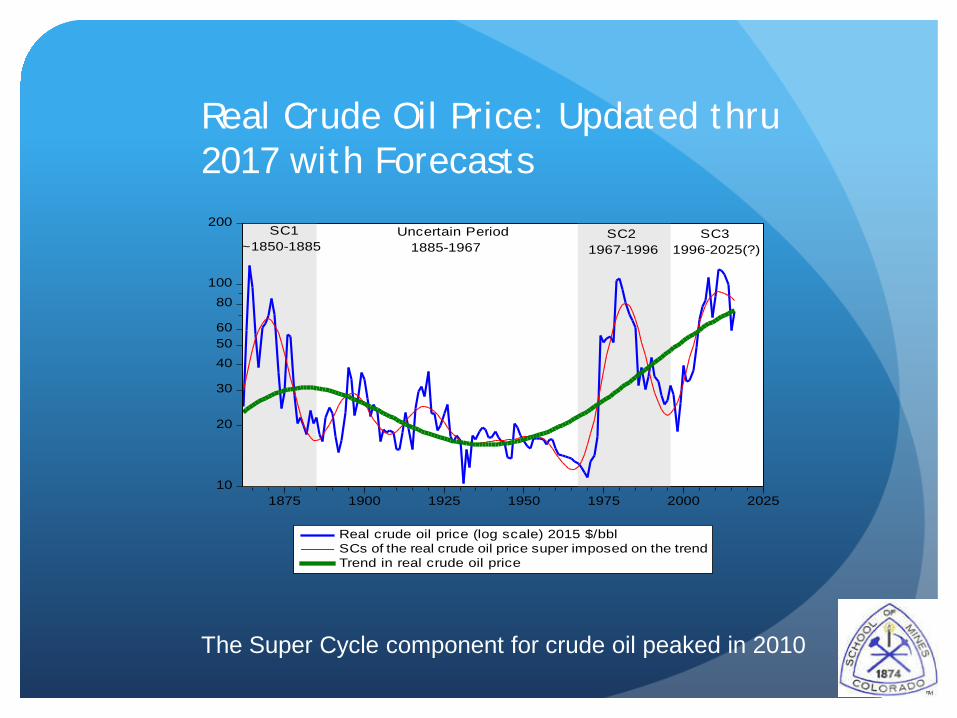
Real Crude Oil Price: Updated thru 2017 with Forecasts 200
10080
605040
30
20
101875 1900 1925 1950 1975 2000 2025
Real crude oil price (log scale) 2015 $/bblSCs of the real crude oil price super imposed on the trendTrend in real crude oil price
SC1~1850-1885
Uncertain Period 1885-1967
SC21967-1996
SC31996-2025(?)
The Super Cycle component for crude oil peaked in 2010
Info on Real Crude Oil Components
The trend component remains on its post World War II course with a positive slope averaging roughly 2% per year in real terms
• The crude oil super cycle component peaked in 2010.
• The current super cycle is showing similar duration to the
previous one (SC2) with a duration of 29 years from through to trough. If we consider that the current SC (SC3) will have same duration and amplitude, one could expect the trough to be reached around 2025 with a value around $50/bbl in real value using 2015 $.
• We should see a downward movement in the Super Cycle
component continuing over the next decade (through roughly 2025)
• The SC in oil prices peaked in 2010. This was barely
detected in our 2011 study, but seemed to be confirmed in this 2015 update (with data through 2014, plus three years of forecasts going forward)
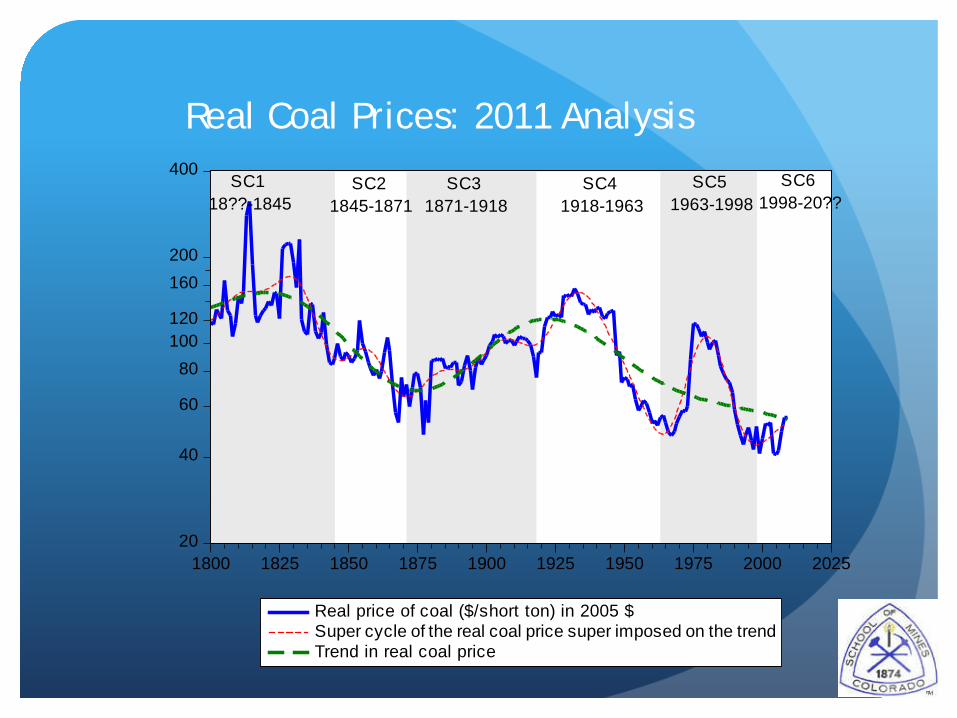
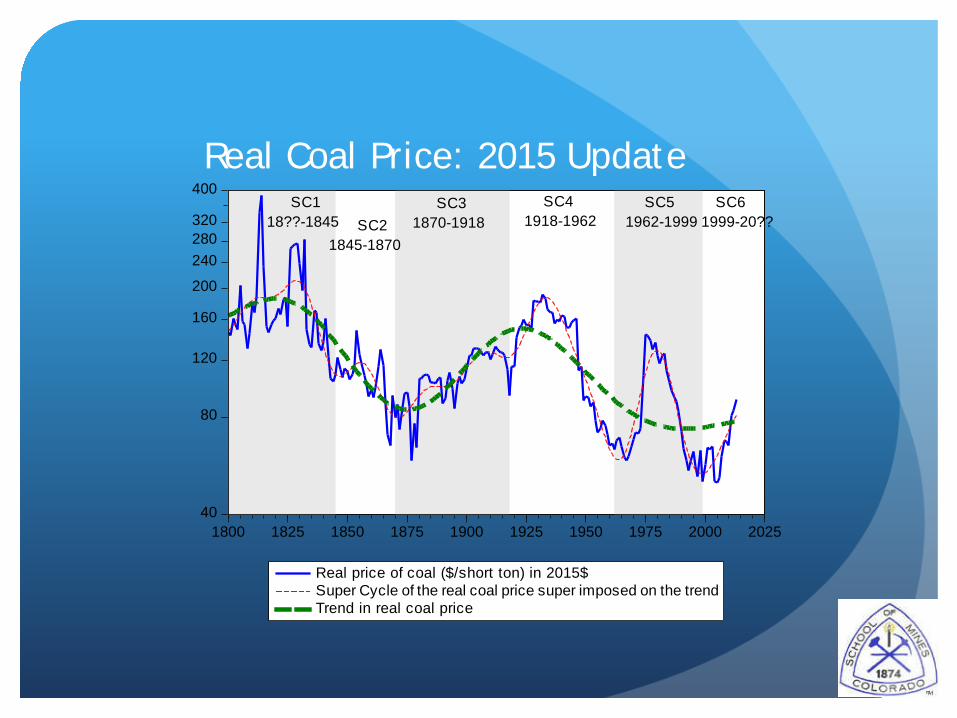
Real price of coal ($/short ton) in 2015$Super Cycle of the real coal price super imposed on the trendTrend in real coal price
SC118??-1845 SC2
1845-1870
SC31870-1918
SC41918-1962
SC51962-1999
SC61999-20??
Coal Discussion •In the 2015 update, the trend component is showing a reversal, suggesting that depletion is now more than offsetting technological change. •The recent SC in coal prices bottomed out in 1999. The peak has not been reached yet.
•SC4 and SC 5 had durations of 43 years and 37 years, respectively. If we assume a similar duration for the current SC (SC6), say 40 years, one may expect the peak to occur in the next two years or so.
Real price of natural gas ($/mcf) in 2015 $.Super cycle of the real natural gas price super imposed on the trendTrend in real natural gas price
SC11948-1970
SC21970-1994
SC31994-2017
Natural Gas Discussion: Update thru 2015 only
• The trend component for the real price of natural gas is
showing a reversal. • This suggests that the ongoing race between depletion
and technology is currently being won by technological improvements (i.e. hydraulic fracturing and horizontal drilling)
• The SCs in natural gas prices hit a trough 1994, then
peaked in 2006. Currently, real nat’l gas prices in super cycle downturn again. [Price is at Henry Hub]
• The current super cycle is showing similar duration to the
previous two (SC2) with a duration of about 23 years from through to trough.
• If the current SC (SC3) has same duration and amplitude as SC2, one could expect the trough to be reached around 2017 with a value around $2.75/mcf in real value using 2015 $.
Real Natural Gas Prices: Discussion (cont.)
Real Prices for LME Metals using US CPI as Deflator
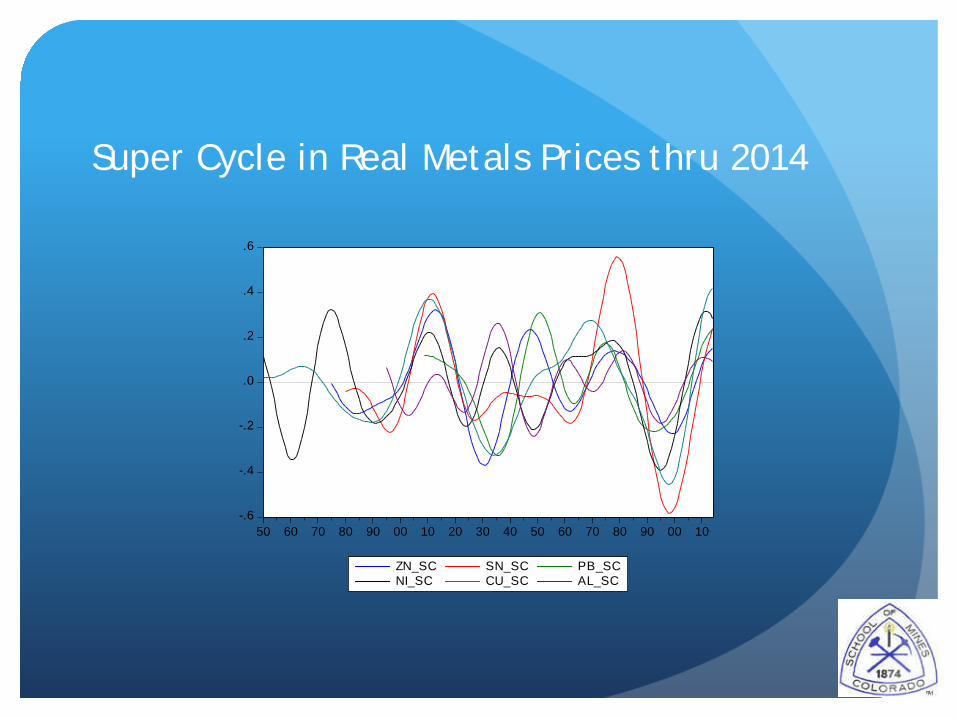
Correlations among the super cycle components in the LME metal are very high
‘Principal component’ analysis supports view that there is a single component that explains a large portion (68%) of the super cycle component in each of the LME metal series
Principal Component Analysis thru 2014
Principal Component Cumulative Proportion
1 68%
2 85%
6 100%
Conclusions
Considerable evidence of Super Cycles, although the timing varies somewhat by energy or metal commodity.
Super cycles in three energy products are studied here. The position in the super cycle differs among crude oil, coal, and natural gas. Crude oil and natural gas are past their super cycle peaks and into their contraction phases.
Super cycle components for the six LME metals have a high positive correlation. As of 2014, most of the LME six are past their super cycle peaks and headed downward toward their troughs.
References
Baxter, M. and King, R.G. 1999. Measuring Business Cycles: Approximate Band-Pass Filters for Economic Time Series. Review of Economics and Statistics 81 (4): 575–593. http://dx.doi.org/10.1162/003465399558454.
Bennaceur, K. 2010. World Energy Congress 2010 interview. Energy2- point0, 15 September 2010, http://www.energy2point0.com/2010/09/15/kamel-bennaceur-chief-economist-schlumbergerw/ (accessed May 2012).
BP. 2011. Statistical Review of World Energy 2011: BP Energy Outlook 2030, http://www.bp.com/sectionbodycopy.do?categoryId¼7500&contentId¼7068481 (accessed May 2012).
Christiano, L.J. and Fitzgerald, T.J. 2003. The Band Pass Filter. International Economic Review 44 (2): 435–465. http://dx.doi.org/10.1111/1468-2354.t01-1-00076.
Comin, D. and Gertler, M. 2006. Medium-Term Business Cycles. American Economic Review 96 (3): 523–551. http://dx.doi.org/10.1257/ aer.96.3.523.
Cuddington, J.T. and Jerrett, D. 2008. Super Cycles in Real Metals Prices. IMF Staff Papers 55 (4): 541–565. http://dx.doi.org/10.1057/imfsp.2008.19.
Cuddington, J.T. and Zellou, A.M. 2012. A Simple Mineral Market Model: Can It Produce Super Cycles in Prices? Resources Policy 38, 1 (March), 75-87.
Deaton, A. and Laroque, G. 1992. On the Behaviour of Commodity Prices. The Review of Economic Studies 59 (1): 1–23. http://dx.doi.org/10.2307/2297923.
Deaton, A. and Laroque, G. 1996. Competitive Storage and Commodity Price Dynamics. The Economic Journal 104 (5): 896–923. http:// dx.doi.org/10.1086/262046.
Dvir, E. and Rogoff, K.S. 2009. Three Epochs of Oil. Working Paper No. 14927, National Bureau of Economic Research, Washington, DC.
Hamilton, J.D. 2011. Historical Oil Shocks. Working Paper No. 16790, National Bureau of Economic Research, Washington, DC.
Heap, A. 2005. China—The Engine of a Commodities Super Cycle. Research Report, Citigroup Global Markets/Smith Barney, Sydney, Australia (31 March 2005), http://www.fallstreet.com/Commodities_ China_Engine0331.pdf.
IMF. 2010. World Economic Outlook: Recovery, Risk, and Rebalancing.
World Economic and Financial Surveys, International Monetary Fund, Washington, DC (October 2010),http://www.imf.org/external/pubs/ft/weo/2010/02/pdf/text.pdf.
Jerrett, D. and Cuddington, J.T. 2008. Broadening the statistical search for metal price super cycles to steel and related metals. Resources Policy 33 (4): 188–195. http://dx.doi.org/10.1016/j.resourpol.2008.08.001.
Jerrett, D.L. 2010. Trends and Cycles in Metals Prices. PhD dissertation, Colorado School of Mines, Golden, Colorado.
Kuznets, S. 1973. Modern Economic Growth: Findings and Reflections. The American Economic Review (AER) 63 (3): 247–258.
Tol, R.S.J., Pacala, S.W., and Socolow, R. 2006. Understanding Long-Term Energy Use and Carbon Dioxide Emissions in the USA. Working Papers No. 2006.107, Fondazione Eni Enrico Mattei, Milan, Italy (Au- gust 2006)http://ideas.repec.org/p/fem/femwpa/2006.107.html.
Yergin, D. 1991. The Prize: The Epic Quest for Oil, Money, and Power. New York: Free Press.
Zellou, Abdel and John T. Cuddington. 2012. Is There Evidence of Super Cycles in Oil Prices? SPE Economics & Management 4, 3 (July), 171-181.