79
MASTER THESIS T.R.N.C NEAR EAST UNIVERSITY INSTITUTE OF HEALTH SCIENCES A NOVEL LINK BETWEEN OBESITY AND LIPID METABOLISM BIOCHEMISTRY PROGRAM NICOSIA-2016 EZE CHIDIEBERE EGEONU

MASTER THESIS
T.R.N.CNEAR EAST UNIVERSITY
INSTITUTE OF HEALTH SCIENCES
A NOVEL LINK BETWEEN OBESITY AND LIPID METABOLISM
BIOCHEMISTRY PROGRAM
NICOSIA-2016
EZE CHIDIEBERE EGEONU

T.R.N.CNEAR EAST UNIVERSITY
INSTITUTE OF HEALTH SCIENCES
ADVISORASSIST. PROF. DR. EDA BECER
BIOCHEMISTRY PROGRAMMASTER THESIS
NICOSIA-2016
EZE CHIDIEBERE EGEONU
A NOVEL LINK BETWEEN OBESITY AND LIPID METABOLISM

ii
APPROVAL

iii
ACKNOWLEDGEMENTS
Firstly, I would like to express my sincere gratitude to my pricinple supervisor
Assoc. Prof. Dr. Eda Becer for the continious support, patience, motivation and
immense knowledge during my master study related research. Her guidance helped me
throughout the time of my research and writing of this thesis. I could not have imagined
having a better supervisor and mentor for my Master study.
Besides my supervisor, I would like to thank all the members of the jury
committee for their insightful comments and encouragement, also for the vital questions
to widen my research from various perspectives.
A special thanks to my family. Words cannot express how grateful i am to my
mother, father, Mr.&Mrs. Egeonu. Eze, for the sacrifices that they made on my behalf.
Your prayers for me was what sustained me this far. I would also like to thank all my
friends who supported and inspired me during the course of this research project.

iv
INDEX
APPROVAL .................................................................................................................... İİ
ACKNOWLEDGEMENTS............................................................................................İİİ
INDEX ........................................................................................................................... İV
TABLE LIST ................................................................................................................. Vİ
FIGURE LIST............................................................................................................... Vİİ
SYMBOLS / ABBREVIATIONS ...............................................................................Vİİİ
ABSTRACT.................................................................................................................. Xİİ
1. INTRODUCTION ........................................................................................................1
1.1. Obesity .....................................................................................................................1
1.1.1. Classes of Obesity...............................................................................................3
1.1.2. Types of Obesity .................................................................................................4
1.1.2.1. Android Obesity .............................................................................................4
1.1.2.2. Gynoid Obesity ..............................................................................................4
1.1.3. Clinical Consequences of Obesity ......................................................................5
1.1.3.1. Obesity and Cancer ........................................................................................6
1.1.3.2. Obesity and Diabetes Mellitus .......................................................................9
1.1.3.3. Obesity, Cardiovascular Disease and Hypertension (HTN) ........................10
1.1.3.4. Obesity and Sleep Apnea .............................................................................13
1.1.3.5. Obesity in Skin Infection and Cellulitis .......................................................14
1.1.3.6. Obesity and Nonalcoholic Fatty Liver Disease............................................14
1.2. Adipose Tissue.......................................................................................................16
1.2.1. Adipose Tissue as an Endocrine Organ ............................................................21
1.2.1.1. Leptin ...........................................................................................................21
1.2.1.2. Resistin.........................................................................................................23
1.2.1.3. Adiponectin ..................................................................................................24
1.2.1.4. Apelin...........................................................................................................25
1.2.1.5. Chemokines..................................................................................................26
1.2.2. Chemerin...........................................................................................................26
1.2.2.1. Structure of Chemerin ..................................................................................27
1.2.2.2. G-Protein Coupled Receptors of Chemerin .................................................29

v
1.2.2.3. Chemerin in Metabolism and Obesity..........................................................30
1.2.2.4. Chemerin and Inflammation ........................................................................34
1.2.2.5. Role of Chemerin in Glucose Homeostasis .................................................36
1.2.2.6. Role of Chemerin and Diabetes ...................................................................37
1.2.2.7. Role of Chemerin in Psoriasis......................................................................38
1.2.2.8. Role of Chemerin as a Potential Biomarker of Tumors ...............................38
2. MATERIALS AND METHODS................................................................................39
2.1. Subjects ..................................................................................................................39
2.2. Anthropometric measurements ..............................................................................39
2.3. Biochemical parameters.........................................................................................39
2.4. Chemerin measurements by ELISA.......................................................................40
2.4.1. Assay Procedure................................................................................................40
2.5. Statistical Analysis.................................................................................................41
3. RESULTS ...................................................................................................................42
4. DISCUSSION.............................................................................................................45
REFERENCES ...............................................................................................................47
vi
TABLE LIST
Table 1.1. Body Mass Index (BMI) and weight status……………………………….....3
Table 3.1. Baseline anthropometric and metabolic characteristics ………………..... .42
Table 3.2. Correlation of plasma chemerin levels with baseline parameters in non-obesegroup……………………………………………………………………………………43
Table 3.3. Correlation of plasma chemerin levels with baseline parameters in obese
group……………………………………………………………………………………44

vii
FIGURE LIST
Figure 0.1. Fundamental principles of energy balance……………………………….....2
Figure 0.2. Types of obesity according to distribution of excess fat in the body………..4
Figure 0.3. Concept of metabolic syndrome……………………………….....................5
Figure 0.4. Effects of adipokines on lipid and glucose metabolism…………………….16
Figure 0.5. Lipogenesis and lipolysis.............................................................................18
Figure 0.6. Adipokines secreted by white adipose tissue………………………............20
Figure 0.7. Proteolytic processing of chemerin........................................................28

viii
SYMBOLS / ABBREVIATIONS
ACE: Angiotensin Converting Enzyme
A-FABP: Adipocyte Fatty-Acid-Binding Protein
AF: Atrial Fibrillation
AKT: Protein Kinase B
ASCVD: Atherosclerotic Cardiovascular Disease
ATGL: Adipose Triglyceride Lipase
BMI: Body Mass Index
CCL-2: CC Chemokine ligand-2
CCRL2: C-C Chemokine Receptor-like 2
CHD: Coronary Heart Disease
CNS: Central Nervous System
CMKLR1: Chemokine-like Receptor 1
CRP: C-Reactive Protein
CRP: C-Reactive Protein
CVD: Cardiovascular Disease
DCs: Dendritic Cells
DGAT2: Diglyceride acyltransferase 2
EPIC: European Prospective Investigation into Cancer and Nutrition
FPRL1: Formyl Peptide Receptor-like 1
GLUT2: Glucose Transporter type 2
GLUT4: Glucose Transporter type 4
GPR1: G Protein-Coupled Receptor 1
GPCR: G-Protein-Coupled Receptor
GSK: Glycogen Synthase Kinase

ix
HCC: Hepatocellular Carcinoma
HDL: High-Density Lipoprotein
HF: Heart Failure
HIV-1: Human Immunodeficiency Virus 1
HTN: Hypertension
HSL: Hormone Sensitive Lipase
HTR2B: 5-Hydroxytryptamine Receptor 2B
IARC: International Agency for Research on Cancer
ICAM-1: Intercellular Adhesion Molecule-1
IgE: Immunoglobulin E
IGFs: Insulin-like Growth Factors
IL-1: Interleukin-1
IL-1Ra: Interleukin-1 Receptor Antagonist
IL13RA2: Interleukin-13 Receptor Subunit Alpha-2
IP-10: Interferon-gamma Increducible Protein 10
IRSs: Insulin Receptor Substrates
IRS-1: Insulin Receptor Substrate 1
IRS-2: Insulin Receptor Substrate 2
kDa: Kilodaltons
LA: Left Auricle
LAR: Leukocyte Antigen-related Phosphatase
LPL: Lipoprotein Lipase
LPS: Lipolysaccharide
LVH: Left Ventricular Hypertrophy
LV: Left Ventricle
MCP-1: Monocyte Chemotactic Protein 1

x
MCP-1: Monocyte Chemoattractant Protein-1
MI: Myocardial infraction
mRNA: Messenger Ribonucleic Acid
NAFLD: Nonalcoholic Fatty Liver Disease
NASH: Nonalcoholic Steatohepatitis
NADPH: Nicotinamide Adenine Dinucleotide Phosphate
NF-kB: Nuclear Factor Kappa B
NK: Natural Killer Cell
OR: Odds ratio
OSA: Obstructive Sleep Apnea
PAI: Plasminogen Activator Protein
PCOS: Poycystic Ovary Syndrome
pDCs: Plasmacytoid Dendritic Cells
P13K: Phosphatidylinositide 3-Kinase
PTPs: Protein Tyrosine Phosphatases
PTP1B: Protein-Tyrosine Phosphatase 1B
RANTES: Regulated upon Activation Normal T-cell Express Sequence
RARRES2: Retinoic Acid Receptor Responder 2
RNA: Ribonucleic Acid
ROS: Reactive Oxygen Species
SFA: Subcutaneous Fat Area
SIV: Simian Immunodeficiency Virus
SNP: Single Nucleotide Polymorphism
TGF-β: Transforming Growth Factor Beta
TIG2: Tazarotine-induced Gene 2
T2DM: Type 2 Diabetes Mellitus
xi
TLR4: Toll-like Receptor 4
TNFα: Tumor Necrosis Factor Alpha
UNOS: United Network of Organ Sharing
VCAM-1: Vascular cell-adhesion Molecule-1
VFA: Visceral Fat Area
WAT: White Adipose Tissue
WC: Waist Circumference
W.H.O: World Health Organization
WHR: Waist-to-Height Ratio
xii
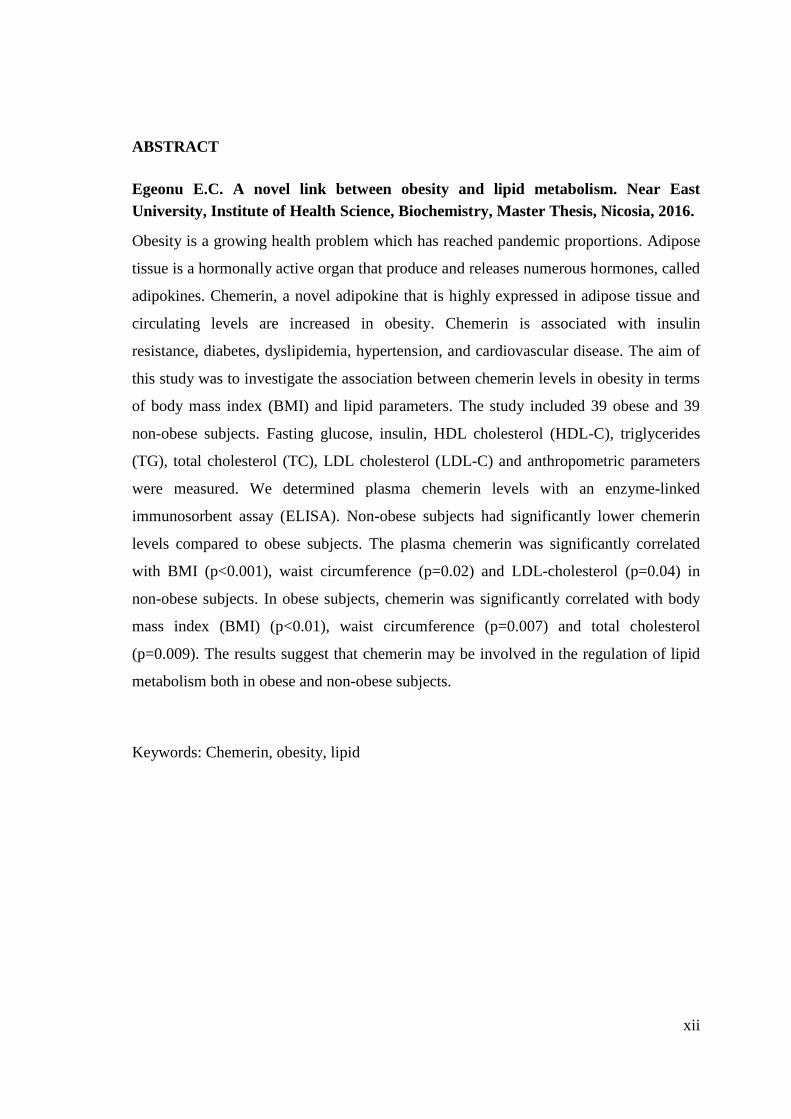
ABSTRACT
Egeonu E.C. A novel link between obesity and lipid metabolism. Near EastUniversity, Institute of Health Science, Biochemistry, Master Thesis, Nicosia, 2016.
Obesity is a growing health problem which has reached pandemic proportions. Adipose
tissue is a hormonally active organ that produce and releases numerous hormones, called
adipokines. Chemerin, a novel adipokine that is highly expressed in adipose tissue and
circulating levels are increased in obesity. Chemerin is associated with insulin
resistance, diabetes, dyslipidemia, hypertension, and cardiovascular disease. The aim of
this study was to investigate the association between chemerin levels in obesity in terms
of body mass index (BMI) and lipid parameters. The study included 39 obese and 39
non-obese subjects. Fasting glucose, insulin, HDL cholesterol (HDL-C), triglycerides
(TG), total cholesterol (TC), LDL cholesterol (LDL-C) and anthropometric parameters
were measured. We determined plasma chemerin levels with an enzyme-linked
immunosorbent assay (ELISA). Non-obese subjects had significantly lower chemerin
levels compared to obese subjects. The plasma chemerin was significantly correlated
with BMI (p<0.001), waist circumference (p=0.02) and LDL-cholesterol (p=0.04) in
non-obese subjects. In obese subjects, chemerin was significantly correlated with body
mass index (BMI) (p<0.01), waist circumference (p=0.007) and total cholesterol
(p=0.009). The results suggest that chemerin may be involved in the regulation of lipid
metabolism both in obese and non-obese subjects.
Keywords: Chemerin, obesity, lipid

1. INTRODUCTION
1.1. ObesityObesity is characterized as an irregular or extreme fat amassing that includes a
danger to wellbeing. The central reason for overweight or obesity is a positive energy
balance, in which energy admission surpasses energy consumption over a drawn out
time prompting the expanded body mass including the aggregation of subcutaneous and
visceral fat (Fair et al. 2009). Nonetheless, obesity is a mind boggling malady brought
on by various components, for example, hereditary, eating routine, way of life and
natural variables (Moreno-Aliaga et al. 2005).
Obesity speaks to a noteworthy wellbeing trouble influencing more than 20% of
Western populaces with relentlessly expanding rate. Obesity outstandingly expands the
danger of creating type 2 diabetes, hypertension, coronary heart disease, stroke, fatty
liver disease, dementia, obstructive sleep apnea and a few sorts of cancer. However,
projections from the World Health Organization (WHO) anticipate for the first time a
decrease in the mean life as a result of obesity-related comorbidities, for example,
atherosclerosis, diabetes and cancer in 2020. In any case, therapeutic mediation for
obesity treatment have given just restricted achievement and there is an unmet
requirement for novel pharmacological treatment patterns to advance negative energy
balance in backing of nutritional and mental guidance and in addition expanding
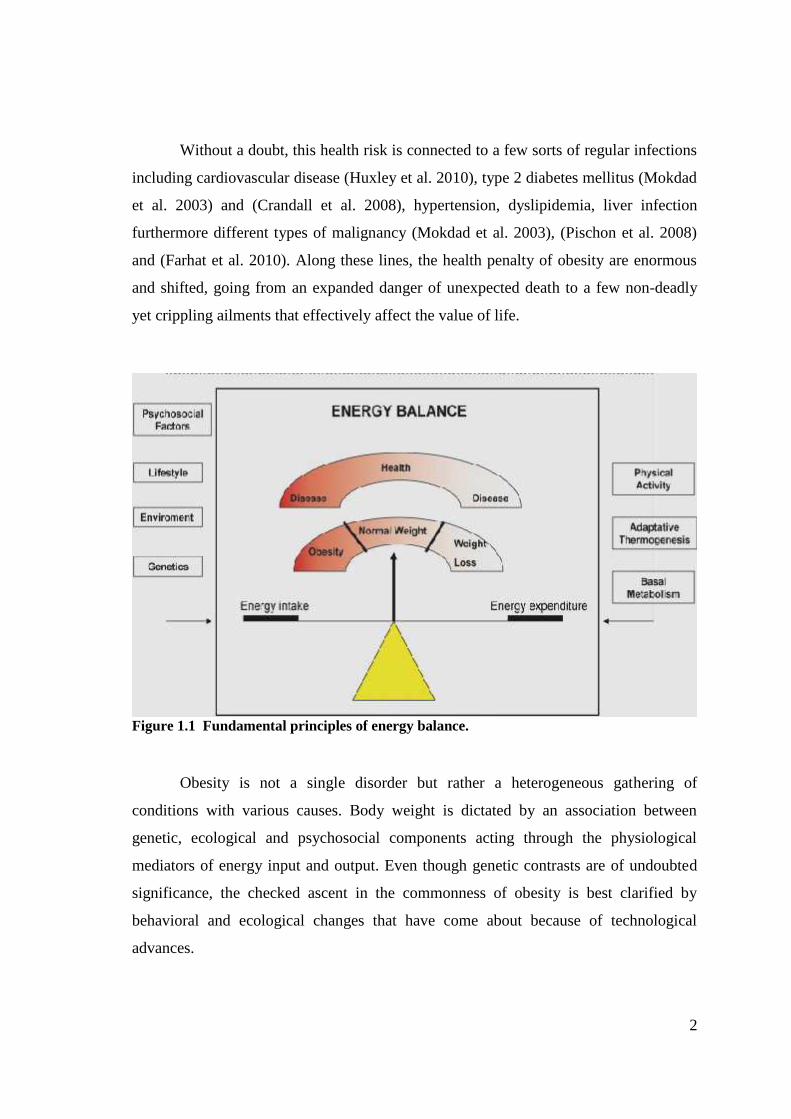
physical action. A positive energy balance happens when energy admission is more
prominent than energy consumption and advances weight pick up/obesity (Olshansky et
al., 2005). On the other hand, a negative energy parity or balance advances weight
reduction (Figure 1.1).
The predominance of obesity among youngsters, teenagers and grown-ups has
been drastically expanding amid the most recent decades (Calle et al. 2004). The World
Health Organization (WHO) evaluates that there are presently more than 1.6 billion
overweight grown-ups and no less than 400 million of these are obese. Subsequently,
obesity is procuring the attributes of a strong pandemia and it has been perceived as one
of the major worldwide health issues.
2
Without a doubt, this health risk is connected to a few sorts of regular infections
including cardiovascular disease (Huxley et al. 2010), type 2 diabetes mellitus (Mokdad
et al. 2003) and (Crandall et al. 2008), hypertension, dyslipidemia, liver infection
furthermore different types of malignancy (Mokdad et al. 2003), (Pischon et al. 2008)
and (Farhat et al. 2010). Along these lines, the health penalty of obesity are enormous
and shifted, going from an expanded danger of unexpected death to a few non-deadly
yet crippling ailments that effectively affect the value of life.
Figure 1.1 Fundamental principles of energy balance.
Obesity is not a single disorder but rather a heterogeneous gathering of
conditions with various causes. Body weight is dictated by an association between
genetic, ecological and psychosocial components acting through the physiological
mediators of energy input and output. Even though genetic contrasts are of undoubted
significance, the checked ascent in the commonness of obesity is best clarified by
behavioral and ecological changes that have come about because of technological
advances.

3
1.1.1. Classes of ObesityBMI is a conclusive measure of an individual's height and weight, figured by
separating an individual's weight in kilograms by the square of their tallness in metres.
Utilizing a measure, for example, BMI takes into account a person's weight to be
standardized for their height, consequently giving rise to people of various heights to be
compared (Sweeting et al. 2007).
BMI is the most generally utilized measure for observing the predominance of
overweight and obesity at population level. It is likewise the most ordinarily utilized
method for evaluating whether a distinctive individual is overweight or obese. In spite
of the fact that BMI is utilized to group people as obese or overweight, it is just an
intermediary measure of indicating issue of accumulated body fat (Table 1.1) (Sweeting
et al. 2007).
Table 1.1. Body Mass Index and Weight Status
BMI (kg/m2) Weight Status
Below 18.5 Underweight
18.5 to 24.9 Healthy weight
25 and above Overweight
30 and above Obese
BMI does, in any case, have a few disadvantages. It is just an intermediary
pointer of body fatness; variables, for example, fitness (muscle mass), ethnic inception
and puberty can modify the relationship amongst BMI and body fatness. Along these
line, BMI may not be an exact instrument for evaluating weight status at an individual
level, and different methods for measuring body composition might be more valuable
and precise (Flegal et al. 2008).
4
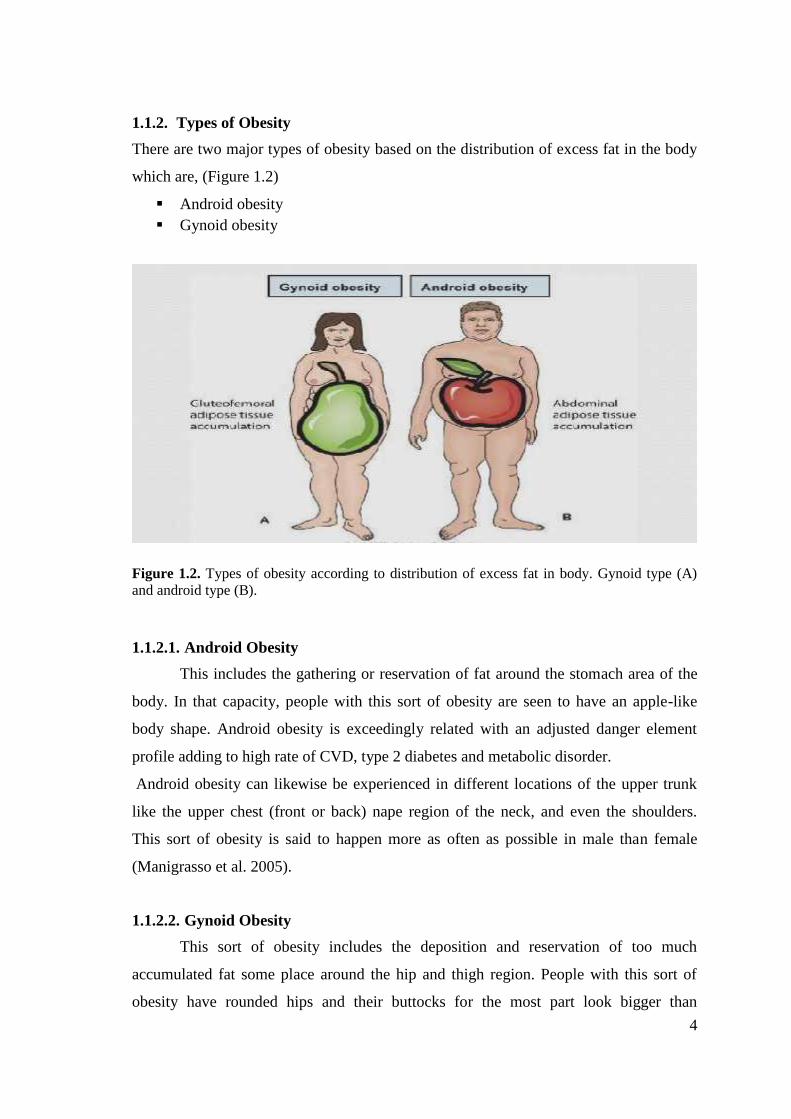
1.1.2. Types of ObesityThere are two major types of obesity based on the distribution of excess fat in the body
which are, (Figure 1.2)
Android obesity Gynoid obesity
Figure 1.2. Types of obesity according to distribution of excess fat in body. Gynoid type (A)and android type (B).
1.1.2.1. Android ObesityThis includes the gathering or reservation of fat around the stomach area of the
body. In that capacity, people with this sort of obesity are seen to have an apple-like
body shape. Android obesity is exceedingly related with an adjusted danger element
profile adding to high rate of CVD, type 2 diabetes and metabolic disorder.
Android obesity can likewise be experienced in different locations of the upper trunk
like the upper chest (front or back) nape region of the neck, and even the shoulders.
This sort of obesity is said to happen more as often as possible in male than female
(Manigrasso et al. 2005).
1.1.2.2. Gynoid ObesityThis sort of obesity includes the deposition and reservation of too much
accumulated fat some place around the hip and thigh region. People with this sort of
obesity have rounded hips and their buttocks for the most part look bigger than

5
ordinary. People with gynoid obesity are called pear obese in light of the fact that they
have a body frame that looks strikingly like the state of the pear fruit. Gynoid obese
people are said to have much saver circumstance than the android obese people since
they have lesser danger of creating unending ailments connected to obesity and
overweight (Manigrasso et al. 2005).
1.1.3. Clinical Consequences of ObesityAs indicated by the World Health Organization, the worldwide pervasiveness of
obesity has about multiplied somewhere around 1980 and 2008, and more than 10% of
the grown-ups age ranged 20 and over is obese in 2008. Projections in light of the ebb
and flow obesity patterns evaluate that there will be 65 million more obese grown-ups
in the USA and 11 million more obese grown-ups in the UK by 2030, thus, collecting
an extra 6–8.5 million instances of diabetes, 5.7–7.3 million instances of heart disease
and stroke for USA and UK joined together. The expanded pervasiveness in obesity is
additionally connected with expanding commonness of nonalcoholic fatty liver disease
(NAFLD). Among the Americas, the predominance of NAFLD is most noteworthy in
the USA, Belize and Barbados and Mexico, which have a high commonness of obesity.
Obesity, particularly abdominal obesity, is one of the reoccurring notable risk factors
for metabolic disorder. Obesity encourages the danger of building up an assortment of
pathological conditions, including insulin resistance, type 2 diabetes, dyslipidemia,
hypertension and NAFLD (Figure 1.3). Accumulating proof recommends that chronic
irritation in adipose tissue may assume a basic part in the advancement of obesity-
related metabolic dysfunction (Jung et al., 2014).

6
Figure 1.3. Concept of metabolic syndrome.
1.1.3.1. Obesity and CancerEnergy irregularity is connected with obesity and diverse studies have found a
relationship amongst obesity and cancer (Donohoe et al. 2010). The idea of a
relationship between dysregulated metabolism and carcinogenesis was initially
enunciated by Otto (Warburg et al. 1956). In 2002, the International Agency for
Research on Cancer (IARC) expert panel assessed the connection amongst weight and
cancer (IARC. 2007) and presumed that some cancers could be averted by maintaining
a strategic distance from weight gain. Since the IARC report, numerous observational
and epidemiological studies have further researched the relationship amongst adiposity
and cancer types including those of colon (Slattery et al. 2010), esophagus, breast, (in
postmenopausal ladies) (Maccio et al. 2010), endometrium, kidney, liver, gallbladder
and pancreas (Percik et al. 2009). Obesity management is an open door for cancer
avoidance (Anderson et al. 2009), and adipose tissue has been proposed as an objective
in the treatment of hormone-dependent breast tumor and different sorts of malignancy.
Breast cancer is the second most well-known cancer on the planet and the most
well-known neoplasia among ladies. The relationship between markers of body size and
danger of breast cancer has been inspected in various studies (Trentham-Dietz et al.
2000). Obesity heightens breast cancer hazard in postmenopausal ladies by around 50%,

7
presumably by increasing serum concentration of free estradiol (Trentham-Dietz et al.
2000). Interestingly a few studies set up that the relationship between body size and the
danger of breast cancer varied by menopausal status (Begum et al. 2009). Actually BMI
and body weight have been observed to be positively associated with the danger of
breast cancer among postmenopausal ladies, this relationship is more grounded among
non-hormone-replacement treatment users than among hormone replacement treatment
users (Potischman et al. 1996). However the systems that underlie the relationship
amongst obesity and breast cancer danger are not totally caught on. A few hypothesis
have been proposed, including adjustments in sex hormones, growth factor and
cytokines (Pischon et al. 2008). Another component by which obesity may affect the
advancement of breast cancer includes insulin and/or insulin-like growth factor (IGFs)
(Frasca et al. 2008).
Colorectal malignancy is the third most basic cancer on the planet. Incidence
rates are roughly 10-fold higher in developed than in developing nations (Pischon et al.
2006). A possible relationship between an overabundance of body weight and danger of
colon cancer has been inspected in numerous epidemiological and cohort research
which have inferred that obesity is connected with a higher danger of colorectal cancer
(Bergstrom et al. 2001). Diverse studies have proposed that waist circumference and the
waist/hip proportion are likewise emphatically identified with a higher danger of
colorectal cancer and large adenomas in men as supported by European Prospective
Investigation into Cancer and Nutrition (EPIC), while body weight and BMI are
connected with colon cancer hazard in men yet not in ladies (Giovannucci et al. 1995).
The purposes behind the sex contrast are theoretical. One hypothesis is that abdominal
adiposity, more normal in men than in ladies, is a more grounded indicator of colon
malignancy hazard than fringe adiposity (Yamamoto et al. 2010). Be that as it may, the
systems required in the relationship between abdominal obesity and increased colon
malignancy hazard remains unexplained.
Prostate malignancy is the cancer most often analyzed in men in Europe (Ferlay
et al. 2007). More than 40 studies, including forthcoming and case-control studies,
looking at the relationship amongst obesity and danger of prostate cancer have given
clashing results (Hsing et al. 2007). Be that as it may, a late meta-examination has

8
proposed a powerless noteworthy positive relationship with an expected increment in
prostate cancer hazard (5% excess hazard for every 5 unit increase of BMI) (MacInnis
et al. 2006). The relationship between waist circumference or waist hip-proportion and
danger of prostate cancer has been analyzed in just a not very many most studies
reporting no huge affiliations (MacInnis et al. 2006).
Obesity is connected with a 3-fold increment in risk for adenocarcinoma of the
throat (Calle et al. 2004). The connection amongst obesity and danger of esophageal
cancer has as of late been affirmed by quantitative meta-examination that included
twelve case-control studies (Kubo et al. 2006). High BMI is connected with gastro-
esophageal reflux and reoccurring reflux is firmly connected with esophageal
adenocarcinoma (Chow et al. 1995). In this way the expanded event in gastro-
esophageal reflux itself is thought to be a noteworthy danger element for esophageal
malignancy.
Primary liver cancer is a standout amongst the most widely recognized and
destructive tumors around the world. The rate is expanding and hepatocellular
carcinoma (HCC) has ascended to wind up the fifth most regular cancer and third
driving reason for cancer death (El-Serag et al. 2007). Obesity has been set up as a
noteworthy danger element for liver ailments. A huge imminent mortality study showed
that high BMI was altogether connected with higher rates of liver tumor related death.
In comparism with patients with common BMI, the relative danger of mortality from
liver malignancy was 1.68 times higher in ladies and 4.52 times higher in men with
BMI > 35 kg/m2 (Gomaa et al. 2008). Correspondingly, information acquired from the
United Network of Organ Sharing (UNOS) database on all liver transplantation from
1991 to 2000 completed in the United States demonstrated that the general rate of HCC
in patients experiencing liver transplantation was 3.4% with a marginally higher
pervasiveness among obese patients at 4.0%. Additionally, in this study obesity was
affirmed to be an autonomous danger component for HCC in patients with alcoholic
cirrhosis (chances proportion [OR], 3.2) and cryptogenic cirrhosis (OR,11.1) (Nair et al.
2002). Obesity has decisively been set up as a danger component for the promotion of
HCC. It is likely that this affiliation represent the progression basic NAFLD to cirrhosis,

9
but it stays indistinct whether cirrhosis is a fundamental basis for the growth of HCC
(Caldwell et al. 2004).
1.1.3.2. Obesity and Diabetes MellitusA solid affiliation exists between obesity, glucose intolerance and T2DM. As per
the Coronary Artery Risk Development in Young Adult study, an increment in BMI
brought about an expanded rate of defected fasting glucose and diabetes in both men
and ladies (Lloyd-Jones et al. 2007). Interestingly, both insulin levels and BMI have
appeared to be free indicators of cardiovascular ailment (Wing et al. 1989). The danger
of developing T2DM appeared to associate with increasing BMI in ladies (Colditz et al.
1995). In this study, a partner of more than 100,000 nurses was followed over a 14 years
period. In light of their discoveries, ladies with a BMI of 24.0 to 24.9kg/m2 had five
times the danger of T2DM contrasted with ladies with BMI of not exactly 22 kg/m2.
The risk of T2DM in women with a BMI greater than 31 kg/m2 and 35kg/m2 was
increased further to 40 times and 93 times, respectively (Colditz et al. 1995).
In reproductive aged women, an elevated BMI at initial pregnancy and at 28-48
year follow-up were both associated with risk of T2DM. The women that developed
T2DM had an absolute weight gain of 14 ± 13 kg, with odds of developing T2DM
increasing three times with greater than 16 kg weight gain following pregnancy
(Dawson et al. 2003). Furthermore, a BMI greater than 30 kg/m2, or clinically obese by
definition, increased the odds of T2DM by 11 times. A similar study in male health
professionals, reported 42 times the risk of T2DM in men with BMI greater than 35
kg/m2 compared to men with BMI of less than 23 kg/m2 (Chan et al. 1994). They also
reported both BMI at age 21 and absolute weight gain as independent risk factors for
T2DM. Schienkiewitz et al. reported that weight gain in men and women during early
adulthood (between ages 25 and 40 years) was associated with increased risk of diabetes
than with weight gain in late adulthood (between ages 40 and 55 years) (Schienkiewitz
et al. 2006). Furthermore, in those that gained weight in early and late adulthood, the
relative risk of T2DM was greater than 14 times compared to those that maintained their
BMIs.
10
The relationship between weight gain and diabetes appears to be relatively
consistent among different ethnicities. In cross-sectional study by Cohen et al., the risk
of T2DM increased in both obese African American and white adults from the US
(Cohen et al. 2009). The relative risk of T2DM increased by 3-4 times with weight gain
greater than 40Ibs. Despite the high rate of obesity in African American women, one
study found this demographic to have the lowest increase in the risk of diabetes with
weight gain. Interestingly, however, Nguyen et al. reported increased prevalence of
T2DM in morbidly obese (BMI > 40 kg/m2) US men and women compared to those of
normal weight (BMI < 25 kg/m2), however African American BMI and diabetes in
Korea, however at a much lower BMI than in most western studies. They report that the
odds of T2DM are increased three times with BMI > 21.9 kg/m2 (Moon et al. 2002).
The linked between obesity and T2DM is important to delineate to implement
interventional strategies.
1.1.3.3. Obesity, Cardiovascular Disease and Hypertension (HTN)Obese persons have a higher prevalence of elevated blood pressure
(hypertension) than lean persons. Moreover, a higher blood pressure is a strong risk
factor for CVD (cardiovascular disease), (Chobanian et al. 2004). Well known
complication of hypertension are coronary heart disease, stroke, left ventricular
hypertrophy (LVH), heart failure, and chronic renal failure. Typically, HTN leads to
thickening of ventricular walls without chamber dilation, a process referred to as CR
when left ventricle mass is not increased or concentric left ventricular hypertrophy
when LV mass is increased, whereas obesity is characterized as increasing chamber
dilation without marked increases in wall thickness, a process that leads to eccentric
LVH (Lavie et al. 2003).
Despite having a higher prevalence of HTN in obesity, recent data have shown
an obesity paradox. Uretsky et al. (Uretsky et al. 2007) investigated the effect of obesity
on CV (cardiovascular) outcomes in 22,576 treated hypertensive patients with known
congenital heart disease. During 2-year follow up, all-course mortality was 30% lower
in overweight and obese patient, despite less effective blood pressure control in these
patients compared with the normal weight group. A previous study also showed
decreased stroke risk and total mortality among overweight patient compared with lean
11
patients (Wassertheil-Smoller et al. 2000). Similarly, another major HTN study showed
a U-shaped relationship between all-cause, CV and non-CV mortality and BMI,
meaning excess mortality at both extremes of BMI (Stamler et al. 1991). In another
study of 800 elderly hypertensive patients, total mortality and CV and non-CV major
events were highest in those with the leanest BMI quintile (Tuomilehto et al. 1991). The
association between BMI and major CV events was U-shaped, whereas non-CV
mortality decreased with increasing BMI. In aggregate, these studies suggest that
although obesity may be a powerful risk factor for HTN and LVH, obese hypertensive
patients may paradoxically have a better prognosis, possibly because of having lower
systemic vascular resistance and plasma renin activity compared with more lean
hypertensive patients (Lavie et al. 2007).
In a study of 5,881 Framingham Heart Study participants, Kenchaiah et al.
(Kenchaiah et al. 2002) shows that during a 14 year follow-up for every 11kg/m2
increment in BMI, the risk of HF increased 5% in men and 7% in women. In fact, a
graded increase in the risk of HF was observed across all categories of BMI. In a study
of 47 morbidly obese patients, nearly one-third had clinical evidence of HF and the
probability of HF increased dramatically with increasing duration of morbid obesity
(Alpert et al. 1997).
Despite the known adverse effects of obesity on both systolic and particularly
diastolic CV function and the epidemiologic data showing a strong link between
obesity, generally defined by BMI criteria, and HF, many studies have suggested that
obese HF patients had a better prognosis (Horwich et al. 2001). It was previously
showed in a small study of 209 patients with chronic systolic HF that both higher BMI
and percent body fat were independent predictors of better event-free survival (Lavie et
al. 2003). Preliminary data in nearly 1,000 patients with systolic HF also showed the
prognostic impact of body fat on total survival (Lavie et al. 2003).
In a recent meta-analysis of 9 observational HF studies (n = 28,209) in which
patients were followed up for an average of 2.7 years, Oreopoulos et al (Oreopoulos et
al. 2008) showed that compared with individual without elevated BMI, overweight and
obese HF patients had reductions in CV (- 19% and – 40%, respectively) and all-cause

12
(- 16% and – 33%, respectively) mortality. Likewise, in an analysis of BMI and in-
hospital mortality for 108,927 decompensated HF patients, higher BMI was associated
with lower mortality (35). In fact for every 5-unit increase in BMI, the risk of mortality
was 10% lower (p < 0.001).
Although these investigators raised the possibility that selection bias and
baseline characteristics may have affected these results, they also suggested that excess
body weight may confer some protective effects on HF mortality (Lavie et al. 2003).
Because advanced HF is a catabolic state, obese patients with HF may have more
metabolic reserve (Lavie et al. 2003). Cytokines and neuroendocrine profiles of obese
patients also may be protective (Oreopoulos et al. 2008). Adipose tissue produces
soluble tumor necrosis factor-alpha receptors and could play a protective role in obese
patients with acute or chronic HF by neutralizing the adverse biological effects of tumor
necrosis factor-alpha (Mohamed-Ali et al. 1999). Additionally, overweight and obese
patients with acute and chronic HF have lower levels of circulating atrial natriuretic
peptide (Mehra et al. 2004). Obese patients with HF may have attenuated sympathetic
nervous system and renin-angiotensin responses (Oreopoulos et al. 2008). Because
obese patients typically have high levels of arterial pressure, they may have a better
prognosis in advanced HF and may tolerate higher levels of cardio-protective
medications (Oreopoulos et al. 2008). Higher circulating lipoproteins in obese patients
may bind and detoxify lipopolysaccharides that play a role in stimulating the release of
inflammatory cytokines, all of which may serve to protect the obese patient with HF
(Lavie et al. 2005). Unfortunately, these studies do not typically adjust BMI for other
measures of adiposity.
Obesity plays a major role in adversely affecting major Coronary Heart Disease
(CHD) risk factors, including HTN, dyslipidemia, and diabetes mellitus (DM), is the
major component of metabolic syndrome, and is probably an independent risk factor for
atherosclerosis and CHD events (Lavie et al. 2007). Although recent studies indicate
that the various measures to define obesity are not all created equally regarding overall
CV disease risk, the consensus is that compared with the traditional BMI assessments,
the more refined modalities (e.g., WC, WHR, waist-to-height ratio, and so on) do not
add significantly to the BMI assessment from a clinical standpoint (Gelber et al. 2008),

13
although this has not been assessed risk of CV diseases and CHD. Additionally, excess
adiposity has been strongly related to first non-ST-segment myocardial infraction (MI)
occurring at a younger age (Madala et al. 2008).
Nevertheless, as with HTN and HF, many studies have also reported an obesity
paradox in CHD, including in patients treated with revascularization (Romeo-Corral et
al 2006). In a recent systematic review of over 250,000 patients in 40 cohort studies
followed up for 3.8 years, Romero-Corral et al. (Romeo-Corral et al 2006) reported that
overweight and obese CHD patients have a lower risk for total and CV mortality
compared with underweight and normal-weight CHD patients. However, in patients
with a BMI ≥ 35 kg/m2, there was an excess risk for CV mortality without any increase
in total mortality. These investigators explained the better outcomes for CV and total
mortality in overweight and mildly obese CHD groups, which could not be explained by
confounding factors, by implicating the lack of discriminatory power of BMI to
differentiate between body fat and lean mass. However, data from a recent study have
shown the same obesity paradox when comparing patients with high and low percent
body fat as with high and low BMI, although did not assess (waist circumference ) WC,
(waist hip ratio) WHR, and other body composition parameters (Lavie et al. 2009).
Importantly, the obesity paradox has also been shown in patients after MI and
revascularization, and more recently has been shown in patients referred for exercise
stress testing (Romeo-Corral et al 2006). Although the mechanism for this effect is
uncertain, in aggregate, these studies suggest that despite the fact that obesity increases
the risk for developing CHD, at least overweight and mild obesity do not seem to
adversely affect prognosis in patients with established CHD.
1.1.3.4. Obesity and Sleep ApneaObesity is a classic cause of alveolar hypoventilation and the obstructive sleep
apnea (OSA) syndrome (Trollo et al. 1996). Sleep apnea can be a problem with serious
implication for anesthetic management, surgery, effect on pulmonary hypertension,
stroke coronary artery disease and cardiac arrhythmias (Candiotti et al. 2009). In fact,
OSA may contribute to the pathogenesis of HTN and increased inflammatory and CRP
(Shamsuzzaman et al. 2002). Clearly, patients with OSA have increased risk of HTN,

14
dysrhythmias, pulmonary HTN (present in 15% to 20% with OSA), HF, MI, stroke and
overall mortality (Partinen et al. 1988).
1.1.3.5. Obesity in Skin Infection and CellulitisObesity causes change in the skin barrier function, the lymph system, collagen
structure and function, and wound healing. Evidence suggests that the vascular supply is
impaired in obese persons and obesity affects both macro and microcirculation. Obesity
is associated with a wide range of skin diseases (Yosipovitch et al. 2007). Case-control
studies indicate an increased risk of cellulitis and skin infections in the overweight
(Dupuy et al. 1999) and obese (Karppelin et al. 2010, Bjornsdottir et al, Bjornsdottir et
al. 2005). In a prospective case-control study showed obesity to constitute a risk factor
for cellulitis in a univariate model, but in a multivariate model the finding no longer
persisted after controlling for other factors. However, several studies have indicated that
obesity predisposes to erysipelas independently of potential confounders (Karppelin et
al. 2010). One prospective cross-sectional study has indicated that obesity is a frequent
disease in patients with erysipelas (Pereira de Godoy et al. 2010). Data indicate that
obesity predisposes to a significantly increased risk of recurrent soft-tissue infections
(Sreeramoju et al. 2011). Data on the association between obesity and the outcome of
skin infections are limited. A prospective cohort study has indicated the outcome of
cellulitis to be worse in the morbidly obese as compared with non-obese subjects.
1.1.3.6. Obesity and Nonalcoholic Fatty Liver DiseaseNonalcoholic fatty liver disease (NAFLD) is another consequence of the current
obesity epidemic and the hepatic manifestation of the metabolic syndrome. This term
encompasses a clinicopathologic spectrum of disease ranging from isolated hepatic
steatosis to nonalcoholic steatohepatitis (NASH), the more aggressive form of fatty liver
disease and characterized by steatosis, inflammation and progressive fibrosis, ultimately
leading to cirrhosis and end-stage liver disease (Ong et al. 2007). The most widely
accepted theory that explains the pathogenesis of NASH is titled the “Two Hit Theory”
resulting from fatty infiltration of the liver due to obesity and insulin resistance,
followed by inflammatory insults, potentially due to oxidative stress (Farrell et al.
2006). Recent studies estimate that NAFLD affects 30% of the general population and
as high as 90% of the morbidly obese (Torreset al. 2008). Furthermore, obese patients

15
are at particularly high risk for NASH in view of the frequent co-existence of other
features of the metabolic syndrome; thus, the prevalence of NASH in those patients
ranges from 20% - 30% against 5% - 7% in the general population (Anguloet al. 2002).
However, patients with isolated steatosis generally have a benign prognosis,
some 26-37% of patients with NASH demonstrate progression of fibrosis over time
period of up to 5.6 years, with up to 9% progressing to cirrhosis (Adams et al. 2004).
BMI and diabetes constitute independent risk factors associated with the progression of
fibrosis (Adams et al. 2005). Thus, it has been reported that about 40%-62% of patients
with NASH-related cirrhosis develop a complication of cirrhosis after 5-7 years of
follow-up (Adams et al. 2005). The increase in the prevalence of childhood obesity
results in a rising prevalence of metabolic syndrome and type 2 diabetes mellitus in
populations. NASH was first observed in children in 1983 as a pattern of liver injury
and it can even develop in obese children under 10 years of age (Patton et al. 2008). The
significant relation between fasting insulin, insulin resistance and NAFLD in obese
children underlines the clinical dimension of these metabolic disturbances (Denzer et al.
2009).
1.1.3.8. Obesity and Prothrombotic State
Obesity is joined by an expansive number of coagulation and fibrinolytic
anomalies (De Pergola et al. 2002). This recommends that obesity stimulates a
prothrombotic state. What is not known at present is the manner by which a
prothrombotic state will either advance the formation of atherosclerosis or take an
interest in the advancement of intense ASCVD occasions. Maybe the most alluring
possibility for upgraded atherogenicity connected with coagulation and fibrinolytic
variations from the norm is endothelial disfuction. It is accepted by numerous workers
that endothelial disfunction is by one means or another required in the atherogenic
procedure (Widlansky et al. 2003). A few pathways have been proposed; in this way,
however none of these have been substantiated. Maybe more probable, the obesity
instigated procoagulant and antifibrinolytic elements adds to an exacerbating of intense
coronary disorders. Thrombosis happening with plaque crack or disintegration is a key
component in deciding the seriousness of the disorder. On the off chance that typical
16
coagulation and fibrinolysis are weakened at the period of infection crack or
disintegration, then a bigger thrombus ought to form. An alluring theory is that intense
plaque interruption is normal, yet just when thrombosis is large there is a noteworthy
intense coronary disorder. Assuming this is the case, such could make the nearness of a
prothrombotic state critical for deciding the clinical result.
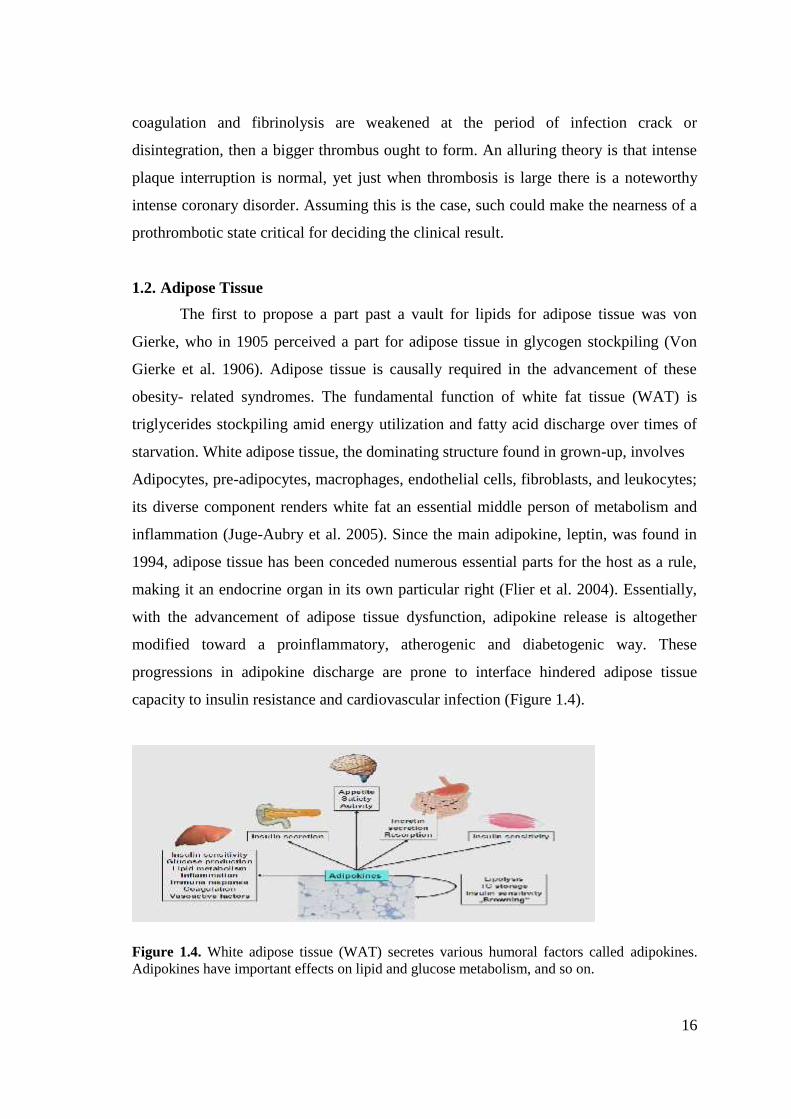
1.2. Adipose TissueThe first to propose a part past a vault for lipids for adipose tissue was von
Gierke, who in 1905 perceived a part for adipose tissue in glycogen stockpiling (Von
Gierke et al. 1906). Adipose tissue is causally required in the advancement of these
obesity- related syndromes. The fundamental function of white fat tissue (WAT) is
triglycerides stockpiling amid energy utilization and fatty acid discharge over times of
starvation. White adipose tissue, the dominating structure found in grown-up, involves
Adipocytes, pre-adipocytes, macrophages, endothelial cells, fibroblasts, and leukocytes;
its diverse component renders white fat an essential middle person of metabolism and
inflammation (Juge-Aubry et al. 2005). Since the main adipokine, leptin, was found in
1994, adipose tissue has been conceded numerous essential parts for the host as a rule,
making it an endocrine organ in its own particular right (Flier et al. 2004). Essentially,
with the advancement of adipose tissue dysfunction, adipokine release is altogether
modified toward a proinflammatory, atherogenic and diabetogenic way. These
progressions in adipokine discharge are prone to interface hindered adipose tissue
capacity to insulin resistance and cardiovascular infection (Figure 1.4).
Figure 1.4. White adipose tissue (WAT) secretes various humoral factors called adipokines.Adipokines have important effects on lipid and glucose metabolism, and so on.
17
Adipose tissue is the main site for storage of abundantly extra energy as
triglycerides, and it contains different cell sorts, including for the most part adipocytes,
preadipocytes, endothelial cells and immune cells. Amid positive energy parity, fat
tissue stores abundance energy as triglycerides in the lipid beads of adipocytes through
an expansion in the quantity of adipocyte (hyperplasia) or an extension in the span of
adipocytes (hypertrophy) (Hausman et al., 2001). The quantity of adipocytes is for the
most part decided in youth and pre-adulthood and stays consistent amid adulthood in
both incline and fat subjects, even after checked weight reduction. Thus, an expansion
in fat mass in adulthood can essentially be ascribed to hypertrophy. Be that as it may,
late study has reported that typical weight grown-ups can extend lower-body
subcutaneous fat, however not abdominal area subcutaneous fat, by means of
hyperplasia because of overfeeding, recommending hyperplasia of adipocytes can
likewise happen in adulthood. Albeit general obesity is connected with metabolic
infections, adipose tissue dysfunction brought about by hypertrophy has been proposed
to assume a critical part in the improvement of metabolic ailments such as insulin
resistance. In contrast to positive energy balance states, when energy is needed between
meals or during physical exercise, triglycerides stored in adipocytes can be mobilized
through lipolysis to release free fatty acids into circulation and the resulting free fatty
acids are transported to other tissues to be used as an energy source. It is generally
accepted that free fatty acids, a product of lipolysis, play a critical role in the
development of obesity-related metabolic disturbances, especially insulin resistance. In
obesity, free fatty acids can directly enter the liver via the portal circulation, and
increased levels of hepatic free fatty acids induce increased lipid synthesis and
gluconeogenesis as well as insulin resistance in the liver. High levels of circulating free
fatty acids can also cause peripheral insulin resistance in both animals and humans.
Moreover, free fatty acids serve as ligands for the toll-like receptor 4 (TLR4) complex
and stimulate cytokine production of macrophages, thereby modulating inflammation of
adipose tissue which contributes to obesity-associated metabolic complications.
However, circulating free fatty acid concentrations do not increase in proportion to fat
mass and do not predict the development of metabolic syndrome, although many studies
suggest a relationship between the release of free fatty acids from adipose tissue and
obesity-related metabolic disorders (Kim et al., 2007).
18
Determinate of adipose tissue mass includes adipocyte volume and cell number
(Arner et al. 2010). Adipocyte volume in turn is regulated by storage and removal of
triglycerides (Klein et al. 1980). Triglyceride removal rate, is also known as lipid
turnover, refers to the removal of lipid of adipose stores through lipolysis (hydrolysis of
triglyceride) followed by irreversible process of oxidation. Lipid turnover rate can be
estimated by the measurement of lipid age through incorporation of 14C derived from
above ground nuclear bomb text into adipocyte triglycerides (Arner et al. 2011). Lipid
turnover rate is the inverse of lipid age, so a high lipid age is indicative of low lipid
turnover. Lipid age does not appear to be related to adipocyte size, age, or gender
(Arner et al. 2011). However lipid age and hence lipid turnover rate is altered by obesity
as triglyceride removal rate is decreased in this condition (Arner et al. 2011). Lipid
turnover is also inversely related to insulin resistance (Arner et al. 2011).
Three enzymes intercedes fat tissue lipolysis. Adipose triglyceride lipase
(ATGL), hormone sensitive lipase (HSL), monoglyceride lipase, (Zimmermann et al.
2002) of these; the initial two intercede the rate restricting step. HSL intercede the
cleavage of the second ester bond (Haemmerle et al. 2002). The last enzyme
monoglyceride lipase complete lipolysis by separating to the last ester bond from
monoglyceride, prompting glycerol discharge (Fredrikson et al. 1986). Basal lipolysis is
controlled by ATGL. While HSL intervene catecholamine-invigorated lipolysis and
lipolysis stimulated by hormones, for example, insulin and natriuretic peptide. Amid
fasting, glucagon and catecholamines invigorate lipolysis in the adipocytes by initiating
through PKA a few lipases, bringing about a preparation of FFA from the adipocyte to
the dissemination, which are then bound bumin and transported to muscle, liver, heart
and different tissues for its oxidation or reesterification. Beta-adrenergic receptors
instigate lipolysis, while alfa2-adrenergic receptors intervene lipogenesis. For instance,
visceral fat cells are more receptive to beta-adrenergic receptors in contrast with
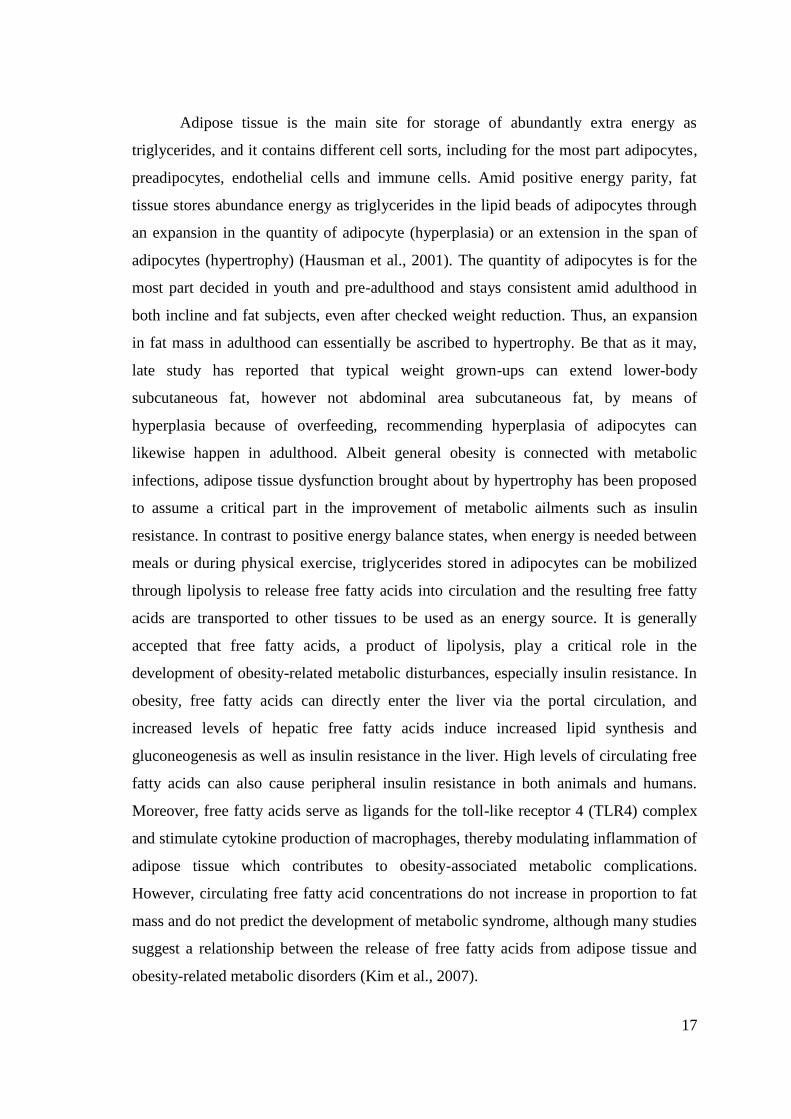
subcutaneous adipocytes. (Figure 1.5) (Langin et al. 2005).
19
Figure 1.5. Lipogenesis and lipolysis. Excess glucose is oxidized via glycolysis to acetyl-CoA in theadipocyte and then converted into acyl-CoA, which are then esterified in the endoplasmic reticulum (ER)to triglycerides (TG). These are then translocated into the lipid droplet. Fatty acids (FA) obtained fromlipoproteins are also esterified into TG and stored. Under fasting conditions, lipolysis is activated by G-protein-coupled receptors resulting in an increase in cAMP that phosphorylates the protein perilipinlocated in the membrane of the lipid droplet. cAMP also phosphorylates the hormone-sensitive lipase(HSL) that triggers its translocation from the cytoplasm to the lipid droplet and induces with highestspecific activity the hydrolysis of diglycerides produced by the adipocyte triglyceride lipase (ATGL) toform monoglycerides (MG). MG is then released to nonadipose tissues, mainly for energy purposes.
Obesity is connected with expanded triglyceride stockpiling and lessen lipid
turnover rate (Arner et al. 2011). The lessen lipid turnover in obesity is for the most part
identified with the diminished catecholamine invigorated lipolysis (Arner et al. 2010).
Blunted catecholamine invigorated lipolysis in obesity gives off an impression of being
free of fat mass as it is even present in first degree non-obese relatives of obese subject
(Hellstrom et al. 1996) and after weight reduction in obese insulin-resistant subject
(Jocken et al. 2007). Diminished articulation of HSL and ATGL has been see in isolated
adipocyte from obese subject (Berndt et al. 2008) and in insulin resistance state free of
obesity (Jocken et al. 2007). Diminished articulation of lipolytic B2 adrenoceptors and
expanded antilipolytic properties of α-2 adrenoceptors (Mauriege et al. 1991) have
likewise been accounted for in obesity and in insulin resistance state and add to the
diminishment in catecholamine instigate lipolysis. Also different components, for
example, leptin may tweak the outflow of ATGL and HSL in obese subject (Jocken et

20
al. 2007). In spite of blunted catecholamine actuate lipolysis in obese subject; FAA
levels are raised in the obese as a result of higher basal lipolysis identified with higher
adipose tissue mass.
Notwithstanding lipid stockpiling, adipocyte number is a determinant of fat
tissue mass (Spalding et al. 2008). Indeed, even in adulthood adipocytes are in a
consistent condition of flux as preadipocytes convert to lipid-filled full grown
adipocytes and older adipocytes experience cell demise (Spalding et al. 2008). It is
assessed that 10% of adipocytes are recreated yearly in grown-ups autonomous of BMI
(Spalding et al. 2008). In any case, in spite of this steady turnover, adipocyte number is
kept consistent free of BMI, (Spalding et al. 2008) and just ascents with great obesity
(Arner et al. 2010). Obese grown-ups have higher number of adipocytes contrasted and
nonobese grown-ups; in any case, the overabundance adipocytes seem to have collected
before adulthood. Indeed, even after noteworthy weight reduction after bariatric
surgery, the quantity of adipocytes in the obese grown-ups continues as before
(Spalding et al. 2008). ). Lipid dividing is another critical controller of body weight.
Lipoprotein lipase (LPL) is a multifunctional compound that is delivered by numerous
tissues including fat and skeletal muscle and is included in lipid dividing by affecting
the accessibility and uptake of FFAs from fat tissue or triglycerides. Varieties in LPL
gene have been connected with obesity and DM2 in people (Ehrenborg et al. 1997).
Differential articulation of LPL in various tissues can prompt obesity and advance
weight recapture after supported weight reduction. As an illustration, fat tissue LPL
expression is expanded in obesity yet its responsiveness to insulin is decreased (Sadur et
al. 1991). All the more essentially, supported weight decrease is connected with an
expansion or no change in basal fat tissue LPL expression yet more prominent
responsiveness to insulin. These progressions would support weight recover. Moreover,
skeletal muscle articulation of LPL is fundamentally diminished after maintained
weight lessening. This diminishing prompts an expansion in respiratory quotient and
decreases in fat use favoring weight recover.

21
1.2.1. Adipose Tissue as an Endocrine OrganAdipose tissue secretes various peptide hormones and bioactive molecule that
demonstration in auto-, para-and endo-crine styles to manage fat tissue and systemic
metabolism. As of late, the quantity of adipokines has extended quickly and these
additionally incorporate adiponectin, resistin, visfatin, apelin, vaspin, hepcidine, tumor
corruption element alpha (TNF-α), chemerin, omentin, MCP-1, and plasminogen
activator protein (PAI), numerous initially portrayed as having begun from other tissues
than fat tissue (Figure 1.4). Adding to the many-sided quality is heterogeneity as for
body site: the contrasting fat warehouses in the body assume particular parts, emitting
distinctive arrangements of adipokines (Gesta et al. 2007).
Figure 1.6. Adipokines secreted by white adipose tissue.
1.2.1.1. LeptinLeptin, a 16-KDa non-glycosylated anorexia peptide, hypothalamically balances body
weight, food ingestion, and fat stores (Ge et al. 2002). Leptin, from the Greek-leptos
implies incline and is a protein with an molecular weight of 16 kDa, constituted by 167
amino acids. It directs energy metabolism, expanding energy use and diminishing
energy utilization. It is now considered that leptin is a metabolic sign for energy
adequacy (Zhang et al., 1994). Leptin role was set up by studies utilizing hypothalamic
wounds in the brain of corpulent rodents. It was then inferred that leptin controls
adipose tissue development through its activity at the central nervous system. Actually,
native expression of leptin in hypothalamic locales lessens food intake and body weight
in animals. It is at present realized that leptin delicate neurons are situated in the dorsal,
22
ventral, medial and premammilary nucleus of the hypothalamus. Along these lines,
hypothalamus leptin receptors control satiety and energy stability. A few research
studies likewise have found that leptin receptors are available in various organs and
tissues, for example, liver, skeletal muscle, heart, kidney, pancreas, and among others.
These receptors have a place with the class I cytokine receptors and three sorts of leptin
receptors have been recognized: long (ObRb), short with 4 isoforms (ObRa, ObRc,
ObRd and ObRf) and dissolvable (ObRe) forms. The long isoform (ObRb) is fit for
activating complete sign transduction started by leptin connected with energy
metabolism. ObRb dimerizes and ties to two molecules of leptin producing a complex
that pulls in the Janus kinase 2 (Jak2), which thus phosphorylates itself and the leptin
receptor. The phosphorylated receptor ties the transcription component STAT which,
after its phosphorylation by Jak 2, dimerizes and translocates into the core to affect
articulation of expression of gene, for example, those included in beta-oxidation,
uncoupling proteins, and control of food intake. Blockade of leptin flagging is
intervened by initiation of phosphatase PTP-1B and SOCS-3 that meddles with Jak2
phosphorylation. These proteins are profoundly communicated in obesity impelled by
high fat utilization, diminishing leptin activity and bringing about leptin resistance
(Bates et al., 2004).
Leptin levels are relative to insulin levels and conversely corresponding to
glucocorticoid concentration (Ge H et al. 2002). Inflammatory cytokines, including
TNF, interleukin-1 (IL-1), and leukemia inhibitory element affect leptin creation
(Gualillo et al. 2000). Testicular steroids diminish and ovarian steroids increment leptin
fixations (Castracane et al. 1998). Leptin manages pancreatic islet cells, growth
hormone levels, immunology homeostasis, hematopoiesis, angiogenesis, wound
recovery, osteogenesis, and gastrointestinal capacity (Ashwin et al. 2007). In the
cerebrum leptin has been appeared to impact the cortex, hippocampus and
hypothalamus, applying in the last local control over appetite and levels of sex steroids,
thyroxin and growth and development hormone (Irving et al. 2006). Leptin organization
can control puberty in grown-ups and youngsters (Strobel et al. 1998). Diminished
leptin flagging or receptor capacity expanded energy admission and brings down energy
consumption (Friedman et al. 1998), with leptin lack or malfunction itself being a
known reason for extreme early-onset obesity, hypogonadism, hyperinsulinemia,

23
hyperphagia, and impaired T-cell-mediated imminity, treatable with recombinant leptin
(Farooqi et al. 2002). Abnormal amounts of leptin in obese patients don't impact hunger
concealment as a result of resistance to the hormone, which has been set to be because
of leptin receptor flagging defects, downstream blockade in neuronal circuits, and
inconsistency in leptin transport over the blood-brain barrier (Flier et al. 2004).
Moreover, obesity regularly prompts insulin and leptin resistance and a change to
adipose tissue. These conditions cause metabolic dysregulation with increased
circulating fatty acid and an expanded discharge of pro-inflammatory adipokines. At the
point when left untreated, these conditions cause lipotoxicity, chronic inflammation,
hypertension, atherosclerosis and cardiovascular ailment (Gade et al. 2010 and Mathieu
et al. 2010). The relationship between hypertension and obesity is very much recorded.
Both systolic and diastolic blood pressure increment with BMI (body mass index).
Subsequently, fat individuals present higher danger to experience hypertension in
examination with non-obese individuals (Kurukulasuriya et al. 2008). Fat people are
oftentimes portrayed by an impeded lipid profile, in which plasma triglycerides are
raised. This aggravated metabolic profile is all the more frequently seen in obese
patients with a high gathering of intra-abdominal fat and has reliably been identified
with an expanded danger of cardiovascular maladies (Ohman et al. 2009 and Mathieu et
al. 2009). A positive relationship amongst obesity and the danger of creating type 2
diabetes mellitus has been likewise over and again reported in various studies. Intra-
abdominal fat amassing has been connected with an expanded danger of prediabetic
conditions, for example, impaired glucose resilience and insulin resistance (Ginsberg et
al. 2009).
1.2.1.2. ResistinResistin is a 12 kDa peptide that for the most part flows as a high-molecular-
weight hexamer additionally has an unmistakable, more dynamic low-sub-molecular-
weight complex (Patel et al. 2004). The hormone is communicated in most noteworthy
concentration in mono-nuclear cells, but on the other hand is found in muscle,
pancreatic cells, and adipocytes (Kusminski et al. 2005). Resistin encoding messanger
RNA (mRNA) shows an even more extensive territory, having been found in white fat,
spleen, hypothalamus, adrenal gland, skeletal muscle, gastrointestinal tract, and
pancreas (Kusminski et al. 2005).
24
Resistin has been agreed a diabetogenic part in mice, however its role in the
pathogenesis of human diabetes remains a matter of open deliberation, with no
unequivocal part allocated to it as for insulin resistance, its name in any case (Savage et
al. 2001). Atherosclerosis aneurysmal vessel wall macrophages discharge resistin (Jung
et al. 2005). Chronic kidney illness increments resistin levels (Verma et al. 2003). The
hormone amasses in the synovial coating of rheumatoid joint inflammation patients
(Kusminski et al. 2005).
1.2.1.3. AdiponectinThe gene for adiponectin, is situated at chromosomal band 3q27, a vulnerability
locus for diabetes and cardiovascular ailment (Saito et al. 1999). Adiponectin has both a
connector protein, APPL-1, as well as two receptors, AdipoR1 and AdipoR2, each
involving seven trans-membrane spaces (Mao et al. 2006). AdipoR1 and AdipoR2 are
the fundamental adiponectin receptors regarding glucose and lipid metabolism (Bjursell
et al. 2007). Current trials additionally recommend a particle known as T-cadherin to be
adiponectin receptor (Hug et al. 2004). The protein, found in both murine and human
blood (Menzaghi et al. 2007), represents 0.01% of human plasma protein; its fixation
uniquely reduces with morbid obesity (Xu et al. 2007). Adiponectin affects endothelial
VCAM-1, ICAM-1, and pentraxin-3 expression (Juge-Aubry et al. 2005). Adiponectin
enlarges endothelial nitrous oxide generation, acting to secure the vasodilation (Matsuo
et al. 2007).
Adiponectin itself might be hostile to atherosclerotic, as it goes about as an
endogenous against thrombotic variable (Ouchi et al. 2003) and hinders macrophage
initiation and foam cell amassing, both being basic cytologic components of atheromas
(Wang et al. 2005). Stroke, coronary illness, steatohepatitis, insulin resistance,
nonalcoholic fatty liver disease, and a wide cluster of malignancy have been connected
with diminished adiponectin levels (Trujillo et al. 2005). Hypoadonectinemia has been
corresponded with expanded atherosclerosis-related compounds, including adipocyte
fatty-acid-binding protein (A-FABP), lipocalin-2, and in addition different markers of
oxidative stress (Maturese et al. 2007). The compound has extraordinary potential as a
marker for atherosclerotic ailment, its reduction having been appeared to be prescient of

25
intense coronary disorder, myocardial infarction, coronary artery ailment, and ischemic
cerebrovascular illness (Lee et al. 2006).
1.2.1.4. ApelinApelin, delivered by adipocytes, vascular stromal cells, and the heart, increment
with expanded insulin levels furthermore with obesity (Lee et al. 2006). Cardiovascular
apelin levels are down-regulated by angiotensin II and reestablished with angiotensin
type I receptor blocker in animal models with heart failure 48. Ischemic
cardiomyopathy (Atluri P. et al. 2007) and hypoxia (Ronkainen et al. 2007) increment
in apelin levels, Atrial filbrillation and severe heart failure have been connected with
diminished apelin levels (Chong et al.2006). Apelin has positive hemodynamic impact,
having been appeared to be an inotrope in healthy and failing rat hearts and in
disconnected cardiomyocytes (Grisk et al. 2007). Apelin may control insulin resistance
by encouraging articulation of brown fat tissue uncoupling proteins and modifying
adiponectin levels (Higuchi et al. 2007).
1.2.1.5. Visfatin, Hepcidine, Omentin, Vaspin, Adipsin and Angiopoietin
Less very much depicted, yet likely similarly imperative, different compounds
have been found to be results of white fat. Visfatin, additionally delivered by
lymphocytes, diminishes insulin resistance (Fukuhara et al. 2005). Visfatin hinders
apoptosis of enacted neutrophils (Jia et al. 2004), ensnaring it both as a reason for harm
in such conditions as intense lung damage (Ye et al. 2005) and as a potential helpful
agent in sepsis (Jia et al. 2004). Visfatin organization to mice diminishes blood glucose
levels, mice having one allele have expanded plasma glucose (Fukuhara et al. 2005).
Levels of hepcidine, which was initially portrayed as a urinary antimicrobial peptide,
increment with obesity and connect with levels of C reactive protein and IL-6 (Jia et al.
2004). Vaspsin, a serine protease inhibitor, lessens levels of leptin, resistin, and TNF, it
enhances insulin affectability and shows diminished concentration in the physically fit
and expanded concentration in obese patients, particularly those with weakened glucose
resilience (Youn et al. 2008). Hepcidine directs iron ingestion by enterocytes, and iron
transport over the placenta. Omentin levels diminish with obesity and insulin resistance

26
and expansion as high-density lipoprotein and adiponectin build up (De Souza C.M et
al. 2007).
Adipsin, otherwise called complement factor D, is predominantly delivered by
monocytes rate-restricting step in the complement initiation elective pathway and, some
way creates an acylation stimulating protein that expands adipocyte triglyceride
generation (White et al. 1992). Angiopoietin-like peptide-4, prompted by peroxisome
proliferator-activated receptor PPAR-α in liver and PPAR-γ in fat tissue, demonstrates
levels that relate with lipoprotein (Mandard et al. 2006) on the grounds that other
comparative proteins are inhabitant in the liver and the gut, the protein may well be a
piece of a flagging pathway that directs lipid metabolism and reservation (Mandard et
al. 2006).
1.2.1.5. ChemokinesChemokines, customarily seen as controllers of chemotaxis of inflammatory
cells, are presently known to be vital mediators betweens a wide array of phenomena,
including lymphoid organ advancement, rheumatoid arthritis, and atherosclerosis,
chemokines act locally, implying that one can see chemokine movement in perivascular
fat in cardiovascular ailment, subcutaneous fat in inflammatory skin infections, and
perirenal fat in glomerulonephritis (Momtani et al. 2004). Chemokines created by fat,
including IL-8, MCP-1, interferon-gamma increducible protein 10 (IP-10), and
managed upon enactment typical T-cell express arrangement (RANTES) are regularly
controlled by hormone-like adipokines, including leptin, obesity, and insulin-resistance-
affecting hormones (Kralisch et al. 2007). Epicardial fat creates more MCP-1 than does
subcutaneous fat (Mazurek T. et al. 2003); there exists a MCP-1 polymorphism
connected with high coronary atherosclerosis hazard (Kim et al. 2007).
1.2.2. ChemerinThe chemerin gene was initially distinguished as a novel retinoid-responsive
gene in psoriatic skin sores. It is otherwise called tazarotine-induced gene 2 (TIG2) or
retinoic acid receptor responder 2 (RARRES2) (Nagpal et al. 1997). The main
confirmation for the natural capacity for the chemerin protein came later, with a report
27
which showed chemerin as a discharged ligand of the vagrant G protein-coupled
receptor chemokine-like receptor1 (CMKLR1) (Wittamer et al. 2003).
Late studies and revelations have exhibited that chemerin likewise serves as a
ligand for no less than two extra receptors including; chemokine (C-C motif) receptor-
like (CCRL2) and G protein-coupled receptor (GPR1). In spite of the fact that the
capacity of GPR1 and CCRL2 in mammals stay unclear, yet diverse cell sorts required
in inborn and adaptive immunity express CMKLR1, and chemerin is currently referred
to work as a chemoattractant that advances the enlistment of these cells to lymphoid
organs and locales of injury (Vermi et al. 2005). It has been appeared in a parallel line
of examination that chemerin expression and release has been appeared to increment
significantly with adipocyte differentiation (Bozaoglu et al. 2007). Besides, loss of
chemerin or CMKLR1 expression totally annuls adipogenesis in cell-based models, and
changes the outflow of gene imperative in glucose and lipid metabolism, including
GLUT4, DGAT2, leptin and adiponectin (Goralski et al. 2007).
1.2.2.1. Structure of ChemerinHuman prochemerin is synthesized as a 163-aa protein with a 20-aa hydrophobic
signal peptide which is expelled by obscure proteases. The discharged full grown
prochemerin contains 143-aa (chem 21-163) with insignificant chemotactic action.
Chemerin share little homology in essential amino acid arrangement with other known
proteins. Rather, it has a collapsed structure like cystatins and cathelicidins (Zabel et al.
2006). The anticipated structure of chemerin taking into account cystatins uncovered an
opposite orientation of chemokines, having a cluttered C-end, a β-pleated sheet, and a
N-terminal α-helix. Inside the cystatin-fold space of chemerin, there are three intra-
chain disulfide bonds, though cystatin is balanced out by just two disulfide bridges.
Essential structure of chemerin is exceedingly monitored among various species,
particularly in the C-terminal locale. Human chemerin offers a general 84%, 76%, 66%,
and 63% amino acid grouping relate to pig, steers, rat, and mouse chemerin,
individually. Inside the exceedingly labile C-terminal area is the arrangement
"AGEDxxxxxxPGQFAFxK(R)ALxxx" Wittamer et al, found that the 9-mer peptide
YFPGQFAFS got from human chemerin is most dynamic in chemotaxis of CMKLR1-
positive cells. As of late, Cash et al. showed that the 15-mer peptide

28
AGEDPHGYFLPGQFA got from mouse chemerin has strong anti-inflammatory
properties. (Cash et al. 2008).
Chemerin is interpreted as a 163 amino acid pre-proprotein that is emitted as a
143 amino acid proprotein, with a molecular weight of 18kDa, after proteolytic
cleavage of a signal peptide (Meder et al. 2003) (Figure 1.7). This proprotein has low
biological function, and along these lines requires further extracellular C-terminal
handling by plasmin, carboxypeptidases or serine proteases of the coagulation,
fibrinolytic and inflammatory cascade (Zabel et al. 2006).
The degree of C-terminal cleavage is needy of the area from which chemerin is
detached. For instance, chemerin from human ovarian ascites liquid, serum and
hemofiltrate need six, eight and nine C-terminal amino acids, individually (Zabel et al.
2006). These are predictable discoveries taking into account the perceptions that few
proteins are fit for preparing chemerin to a dynamic structure. As indicated by in vitro
research, it has been demonstrated that cathepsin G cleaves seven C-terminal amino
acids from prochemerin, elastase can bind to six, eight, or eleven, plasmin cleaves five,
and tryptase cleaves five or eight (Zabel et al. 2005) (Figure 1.7.).
Figure 1.7. Proteolytic processing of chemerin. Chemerin is produced as a pre-proprotein, pre-prochemerin (1–163), which requires N-terminal cleavage of a secretion signalpeptide before itis secreted as an inactive precursor protein, prochemerin (20–163). Extracellular proteolyticprocessing of the carboxyterminus of prochemerin exposes the bioactive region. Cathepsin Gcleaves seven C-terminal amino acids from prochemerin (chemerin-156), elastase is able tocleave six (chemerin-157), eight (chemerin-155) or eleven (chemerin-152), plasmin cleaves five

29
(chemerin-158), and tryptase cleaves five (chemerin-158) or eight (chemerin-155). Multiplecleavages might be required to fully activate chemerin, with an initial tryptase cleavageresulting in chemerin with low activity (chemerin-158), and a second cleavage bycarboxypeptidase N or B producing highly active chemerin (chemerin-157). Chemerin-156 and-157 activities are terminated by chymase cleavage to produce inactive chemerin-154.Chemerin-157 activity might also be terminated by ACE cleavage to produce inactivechemerin-155. The number (e.g. -157) refers to the terminal amino acid position of theprocessed protein. Solid arrows represent activation pathways; broken arrows representinactivation pathways.
Various cleavages are required to completely initiate chemerin sometimes. For
instance, an underlying tryptase cleavage at amino acid 158 results in chemerin with
low action. Be that as it may, this chemerin with low action serves as a substrate for a
brief moment cleavage via carboxypeptidase N or B, creating completely initiated
bioactive chemerin (Du et al. 2009) (Figure 1.7). Proteolytic handling is additionally
accepted to be included in the inactivation of chemerin. Especially, neutrophil-inferred
serine protease prtienase, mast cell chymase and angiotensin converting enzyme (ACE)
have been appeared to change over bioactive types of chemerin to inert subsidiaries
(John et al. 2007) (Figure 1.7). Accordingly proteolytic preparing of chemerin is a key
administrative component that may decide both systemic and local concentration of bio-
active chemerin.
1.2.2.2. G-Protein Coupled Receptors of ChemerinCMKLR1, additionally named as chemR23, is a G-protein-coupled receptor
(GPCR) communicated mostly by macrophages, natural killer cells, plasmacytoid
dendritic cells (pDCs), and myeloid dendritic cells (Vermi et al. 2005). CMKLR1 offers
phylogenetic homology with some chemo-attractant receptors including C5a-R, C3a-R,
and formyl peptide receptor-like 1 (FPRL1) (Zabel et al. 2006). It is accounted for that
eicosapentenoic acid determined lipid known as determining E1 is a ligand for
CMKLR1. Determining E1 is thought to apply inflammatory impacts through the
actuation of CMKLR1 (Arita et al. 2005). CMKLR1 is likewise utilized as a co-receptor
for immunodeficiency virus SIV and some essential HIV-1 strains (Martensson et al.
2006). Autonomous studies from a few research centers all exhibit that CMKLR1 is a
leukocyte chemoattractant receptor for chemerin. CMKLR1 is in charge of guiding the
relocation of dendritic cells to lymphoid organs and inflammed skin (Vermi et al. 2005).

30
GPR1 with obscure organic capacity is a vagrant GPCR. As of late, chemerin is
recognized as an endogenous ligand for GPR1. GPR1-transfected cells react to
chemerin incitement with a hoisted intracellular calcium discharge to a level 30% of
that seen in cells releasing CMKLR1 (Barnea et al. 2008). An iodinated chemerin C-
terminal section chem149-157 is utilized for radio-ligand–binding research and affirms
that chem149-157 ties to GPR1. The coupling constant (Kd) of chem149-157 with
GPR1-communicating cells is 5.3 nM, equivalent to 4.9 nM for CMKLR1-transferred
cells. With the identification of GPR1 as chemerin receptor, the new part of GPR1 other
than as a co-receptor of HIV and SIV infection ought to be investigated.
The third vagrant GPCR distinguished as chemerin receptor is CCRL2. Zabel et al.
characterized mouse mast cell-expressed CCLR2 as a silent chemokine receptor-like
GPCR which has a pro-inflammatory capacity by introducing bound attractants for
flagging receptor communicated on neighboring cells. (Zabel et al.2008). CCRL2 itself
does not trigger chemerin disguise or backing chemerin-driven signal transduction.
CCRL2 may encourage CMKLR1 capacity by expanding local chemerin fixation,
which is more available to cell-flagging receptor CMKLR1. Mast cell-communicated
CCLR2 can improve tissue swelling and leukocyte penetration in an IgE-interceded
mast cell-subordinate mouse passive cutaneous hypersensitivity model, particularly
when low measures of antigen-specific IgE are utilized (Yoshimura et al. 2008).
1.2.2.3. Chemerin in Metabolism and ObesityNotwithstanding having a vital energy stockpiling capacity, white adipose tissue
serves as a dynamic endocrine organ that secretes various hormone-like compounds
called adipokines (Goralski. et al. 2007). These adipokines incorporate proinflammatory
cytokines and related proteins, compliment related proteins, proteins of the fibrinolytic
cascade, vaso-active proteins, and other naturally dynamic peptides with hormone-like
activities.
Adipokine influence adiposity, adipocyte metabolism and inflammatory reaction
of adipose tissue, and have a noteworthy part in systemic lipid and glucose metabolism.
It was initially reported in 2007 that both chemerin and CMKLRI were emphatically

31
communicated in white adipose tissue from mouse, rodent and human examples, which
distinguish chemerin as a novel adipokine with potential autocrine and paracrine
capacities (Bozaoglu. et al. 2007). In expansion to this abnormal state of expression,
white adipose tissue perhaps at the same time has a considerable capacity to bioactivate
chemerin. For example, cathepsin G (Karlsson et al. 1998), and tryptase(Lopez et al.
2008) are communicated in fat tissue which propose that chemerin - 155,- 156 and - 158
all bioactive proinflammatory types of chemerin, can be delivered in this tissue.
Catheptin S, which is accepted to create a anti-inflammatory chemerin derivaties, is
likewise communicated in adipose tissue (Taleb et al. 2005).
In conclusion the declaration of chymase and ACE in fat tissue (Galvez-Prieto et
al. 2008), proposes that bioactive types of chemerin can be inactivated in the fat tissue.
Chemerin expression and discharge increment significantly with adipogenesis and loss
of chemerin or CMKLR1 expression in preadipocytes extremely debilitates separation
into mature adipocytes (Muruganandan et al. 2010).
Aside from this autocrine capacity in adipocyte, chemerin and CMKLR1
flagging may have paracrine capacities inside adipose tissue as proposed in the past
segment, chemerin serves as a chemoattractant for different sorts of inmmune cells and
may along these lines add to white fat tissue inflammation with obesity. What's more,
fat tissue is a very vascularized tissue and hindering angiogenesis has been appeared to
anticipate fat tissue development and the improvement of obesity, diabetes and
cardiovascular infection (Rupnick et al. 2002).
CMKLR1 is communicated in human endothelial cells and is upregulated by the
proinflammatory cytokines TNFα, IL-6, and IL-1β. Late studies have additionally
demonstrated that chemerin enacts key angiogenic pathways and actuates angiogenesis
in vitro (Kaur et al. 2010). In this way, the hoisted expression and discharge of
chemerin amid adipogenesis could likewise bolster fat tissue development by inciting
angiogenesis and expanding fat tissue vascularization. The main part of human
information bolsters a linkage between chemerin, obesity and metabolic disorder, a
bunch of metabolic issue that expand the danger for diabetes and cardiovascular
malady. For instance, an investigation of a Mexican-American populace reported

32
fundamentally higher serum chemerin levels in patients with type 2 diabetes mellitus
contrasted and normglycemic controls, and in obese and overweight subjects compound
with incline control (Bozaoglu et al. 2010). Plasma chemerin levels -corresponded
emphatically with body mass index, fasting glucose, fasting serum insulin, plasma
triglycerides and total serum cholesterol and adversely connected with high density
lipoprotein (HDL) cholesterol (Bozaoglu et al. 2009).
A different investigation of a Mauritan populace of blended ethnicity exhibited
that subsequent to modifying for sex and age, serum chemerin levels were essentially
lifted in overweight as well as obese subjects and that they were emphatically
corresponded with waist circumference, waist to hip proportion, Homeostasis Model
Assessment of Insulin Resistance result and triglycerides, and contrarily related with
HDL (Bozaoglu et al. 2007). Also, different studies have reported higher chemerin
levels in patient T2DM and obesity, and additionally a positive relationship between's
serum chemerin levels and leptin, resistin and C reactive protein, TNFα and IL-6
(Lehrke et al. 2009).
Another study on a Causcasian populace found that people with metabolic
disorder had altogether higher serum chemerin levels in comparison with health subjects
and constructive connections were seen between serum chemerin and glucose,
triglyceride, systolic blood pressure and diastolic blood pressure (Stejskal et al. 2008).
Moreover, selecting a serum chemerin focus limit of 240 ug/L permitted the scientists to
determine metabolic disorder to have an affectability of 75% and specificity of 67%
(Stejskal et al. 2008). Independent of the extensive proof interfacing coursing chemerin
levels with adiposity and different parts of the metabolic disorder, it is still uninformed
of any genome-worldwide investigations recognizing the gene encoding chemerin or
any related receptors as applicant susceptibility loci for human infection. Despite the
fact that a late extensive affiliation study (Bozaoglu et al. 2009), reported that serum
chemerin levels are firmly heritable and found that solitary nucleotide polymorphism
(SNP) demonstrating the most grounded proof of relationship with plasma chemerin
levels was situated in the EIDL3 gene, which has a known part in angiogenesis. At
present, focused on hereditary investigations of chemerin and CMKLR1 are
exceptionally restricted. The main case in the current logical writing reported that

33
despite the fact that SNPs of the chemerin quality were not connected with aggregate
adiposity, there was a relationship with expanded visceral fat mass in incline subjects
(Mussig et al. 2009).
This crude data proposes an impact of chemerin on local fat conveyance and
specifically, instinctive adiposity, which is most unequivocally connected with the
metabolic disturbances that can happen with obesity (Hamdy et al. 2006). These
previously stated studies exhaustively recognize a relationship between serum chemerin
levels and obesity. However the wellspring of raised chemerin levels which are
communicated in anatomical locales notwithstanding fat, for the most part eminently
the liver, stays to be absolutely settled.
A late examination of portal, hepatic and systemic venous blood chemerin levels
in people showed comparable chemerin levels in the portal and systemic vein,
proposing that visceral fat tissue is not a noteworthy giver to serum chemerin levels
(Weigert et al. 2010). Despite the fact that, chemerin levels were higher in hepatic vein
blood tests, showing that chemerin is incorporated and emitted by the liver (Weigert et
al. 2010). In a different study, serum chemrin levels in patients who had experienced
bariatric surgery with the end goal of weight reduction were fundamentally lessened
after surgery, and connected with BMI and fat mass (Sell et al. 2010). Likewise
examination of chemerin in ladies with polycystic ovary syndrome (PCOS), a typical
endocrinopathy connected with insulin resistance, pancreatic β-cell dysfunction,
disabled glucose resilience, T2DM, dyslipidemia and visceral obesity, uncovered that
both chemerin mRNA and protein levels are raised in subcutaneous and omental fat
tissue from patients with PCOS (Tan et al. 2009). Also, chemerin emission from female
fat tissue explants uncovered an essentially higher arrival of chemerin from obese
versus incline subjects (Sell et al. 2009). Despite the fact that proof exists for a linkage
between flowing chemerin levels and parts of metabolic disorder, different studies
recommend that local concentration may be a more vital determinant of pathologic
outcomes, for example, cardiovascular sickness. For instance, serum chemerin levels
were accounted for to be just feebly associated with coronary plaque burden and the
quantity of non-calcified plaques in people (Lehrke et al. 2009). In addition, after
alteration for built up cardiovascular sickness hazard factors, these relationships were

34
no more present. Be that as it may, another study exhibited that aortic and coronary
atherosclerosis was emphatically associated with chemerin expression in psoriatic and
pericoronary fat tissue, individually (Spiroglou et al. 2010) which recommends that
privately delivered chemerin influences the improvement of atherosclerosis in paracrine
way (Spiroglou et al. 2010). Despite the fact that serum chemerin levels don't foresee
coronary atherosclerosis, local chemerin fixations may impact plaque advancement.
Atherosclerosis is a dynamic inflammatory ailment and the gathering of macrophages in
atherosclerotic plaques decidedly connect with disease progression. A potential
clarification is that expanded local chemerin fixations in coronary vessels advance
macrophage enlistment and impact inflammatory reaction in atherosclerotic plaques.
Despite the fact that plainly serum chemerin levels are raised in obesity, the systems
managing chemerin expression remain ineffectively caught on. It has been demonstrated
that insulin increments chemerin emission from fat tissue both dosage and time
conditionally in vitro and in tissue explants (Tan et al. 2009). IL-1β, a proinflammatory
cytokine connected with insulin resistance, actuates chemerin mRNA expression and
emission measurements conditionally from 3T3-L1 determined adipocytes (Kralisch et
al. 2009). TNF-α, another proinflammatory cytokine connected with insulin resistance,
additionally expands serum chemerin levels in vitro and increases chemerin synthesis
and discharge from 3T3-L1 adipocytes (Parlee, et al. 2010). An impelling in expression
brought about by proinflammatory cytokines propose nuclear element kB may regulate
chemerin mRNA expression (Kralisch et al. 2009). These discoveries are upheld by the
way that hyperinsulinemia and hoisted proinflammatory cytokine levels are regularly
connected with obesity.
1.2.2.4. Chemerin and InflammationThe initially recognized capacity of chemerin, acting through CMKLR1, was to
advance chemotaxis of immature dendritic cells (DCs) and macrophages (Wittamer et
al. 2003). CMKLR1 is currently surely understood to be communicated in a number
invulnerable cells, including juvenile plasmacytoid DCs, myeloid DCs, macrophages
and natural killer cell (NK) (Prolini et al. 2007), and that serum chemerin levels relate
with levels of the pro-inflammatory cytokines tumor necrosis factor (TNF)- α,
interleukin (IL-6) and C receptive protein (CRP) (Lehrke et al. 2009). Pathologically,
chemerin is communicated in psoriatic sores (Nagpal et al. 1997) and a few effector

35
cells of the innate inmmune framework that are affected by chemerin, including DCs,
monocytes, macrophages and NK cells have been embroiled in the pathogenesis of
psoriasis (Ottaviani et al. 2006). Chemerin expression is accepted to be a marker for the
early period of newly developing lesion, furthermore is thought to advance the
enrollment and enactment of plasmaacytoid DCs (Skrzeczynska-Moncznik et al. 2009).
This proposes chemerin and CMKLR1 are included in the enrollment of different
immune cells into the lesion and might impact the cross-talk between various cell type
in charge of controlling the progression of psoriatic aggravation (Grosa et al. 2005).
Chemerin and CMKLR1 seem to assume critical parts in other immune system
states, for example, trial immune system encephalomyelitis, a murine model of
numerous sclerosis. In this model, CMKLR1 invalid mice grew less extreme clinical
what's more, histologic sickness and had lower CNS irritation with respect to control
mice (Graham et al. 2009). Since macrophages assume a critical part in proliferating the
inflammatory cascade, lost CMKLR1-subordinate enrollment of these cells by chemerin
could represent the watched inflammatory cascade. Despite the fact that much test proof
backings a pro-inflammatory role for chemerin/CMKLR1, different studies propose that
this flagging pathway may have an anti-inflammatory capacity. For example, a study by
Luangsay et al, utilizing a lipolysaccharide (LPS)-induced mouse model of intense lung
aggravation exhibited that chemerin treatment at the same time expanded the assembly
of airway macrophages and diminished neutrophil recruitment and enactment,
recommending both a pro-inflammatory and anti-inflammatory function of chemerin
and CMKLR1. (Luangsay et al. 2009). These chemerin-prompted impacts were not seen
in CMKLR1 invalid mice (Luangsay et al. 2009). Curiously, CMKLR1 invalid mice
treated with LPS alone showed unmistakably more noteworthy neutrophil and
macrophage enrollment in lung tissue contrasted and that of wild type mice,
demonstrating the significance of CMKLR1 as an anti-inflammatory middle person. As
of late, it is presently clear that obesity is ordinarily connected with endless poor quality
systemic inflammation.
Notwithstanding adipocytes, fat tissue contains various lymphocytes situated in
the stromal vascular portion, including macrophage, NK cells and T-cells (Anderson,
E.K. et al. 2010). As people get to be obese coming about to the extension of their

36
adipocytes, fat tissue experiences molecular and cell adjustments influencing systemic
metabolism and inflammation. Serum levels of the inflammatory markers TNF-α, IL-6
and CRP are lifted in obesity (Cottam et al. 2004) and fat tissue seems, by all accounts,
to be a significant wellspring of these cytokines (Trayhurn et al. 5005).
1.2.2.5. Role of Chemerin in Glucose HomeostasisObesity is a built up danger component for insulin resistance and T2DM and
modifications in adipokine emission in obesity are accepted to assume a noteworthy
part in the improvement of these metabolic disorder (Muoio et al. 2006). The hoisted
serum chemerin levels seen in human and mice propose that chemerin may likewise
impact the dysregulation of glucose metabolism that regularly happens with obese.
Nonetheless, it is noteworthy to note that hyperinsulinemia, which regularly found in
patients who are obesed and have T2DM, has been accounted for to build serum
chemerin levels (Tan et al. 2009). In vitro studies utilizing 3T3-L1 adipocytes have
given clashing results, with one study reporting diminished insulin-empowered glucose
uptake (Takahashi et al. 2008) and another demonstrating expanded insulin-fortified
glucose uptake and insulin receptor substrate 1 (IRS1) tyrosine phosphorylation after
chemerin treatment (Kralisch et al. 2009). Despite the fact that the approach of these
studies contrasted in a few regards. For instance, the study reporting expanded glucose
uptake treated 3T3-L1 adipocytes with around 6 nM chemerin for 12 hours in media
with serum before measuring insulin-invigorated glucose uptake (Takahashi et al.
2008).
The study that experienced a diminishing glucose uptake treated the adipocytes
with 10 uM chemerin for 49 hours without serum media before measuring glucose
uptake (Kralisch et al. 2009). In this manner, the distinctive focuses, treatment terms
and conditions may have added to the discrepant results, so that the shorter, lower
dosage treatment may have created an intense increment in glucose uptake, while the
more drawn out, higher measurement treatment may have brought about a negative
input reaction, or conceivably the foundation of a safe express that delivered a net
lessening in glucose uptake.
In another study, treatment of essential human skeletal muscle cells with 60 nM
chemerin for 24 hours brought about an expansion in phosphorylation of an IRS1 serine
37
buildup known for adversely adjusting the activity of insulin incidental with a
diminishing in insulin-stimulated glucose uptake (Sell et al. 2010). A corresponding
lessening of AKT, glycogen synthase kinase (GSK) 3α and GSK3βphosphorylation was
additionally watched. In mice, chemerin treatment intensifies glucose intolerance in
obese/diabetes (db/db), however not normoglycemic models by diminishing serum
insulin levels, lessening fat tissue glucose uptake and bringing about a huge abatement
in liver and aggregate tissue glucose uptake (Ernst et al. 2010).chemerin-induced
dysregulation of glucose uptake in adipocyte and myocyte societies recommends an
insulin-subordinate GLUT4 mechanism, though a decline in serum insulin levels and
liver glucose in obese/diabetic (db/db) mice recommend an insulin-subordinate GLUT-2
component. In this manner, the instrument by which chemerin adjusts glucose
homeostasis stays obscure and these clashing discoveries show a need to clear up the
part of chemerin in glucose metabolism.
1.2.2.6. Role of Chemerin and DiabetesChemerin is a recently depicted adipokine with consequences for adipocyte
separation and metabolic in vitro (Bozaoglu et al. 2007). Studies have demonstrated that
chemerin expression is expanded amid the separation of 3T3-L1 cells murine pre-
adipocytes into adipocytes. Hereditary thump down of chemerin or its receptor,
CMKLR1, impedes separation of 3T3-L1. Articulation of chemerin and CMKLR1 in
full grown adipocytes recommends an autocrine/paracrine system. These information
show that chemerin is a novel adipokine managing adipocyte capacity. Hatching of
3T3-L1 cells with recombinant chemerin protein advanced insulin-fortified glucose
uptake with upgraded insulin flagging. This recommend chemerin may assume a part in
insulin sensitivity and therefore a potential restorative focus for diabetes. Chemerin
affects ERK1/2 phosphorylation in 3T3-L1 cells. ERK1/2 flagging is typically required
in adipogenesis and lipolysis. Quality articulation of chemerin and CMKLR1 is
fundamentally higher in adipose tissue of obese diabetes inclined Psammomys obesus.
In human, plasma chemerin levels in healthy contributors are not fundamentally not
quite the same as type 2 diabetes patients. Be that as it may, plasma chemerin levels in
mass index, coursing triglycerides, and circulatory triglyceride, proposing a solid
relationship of this protein with weight related entanglements (Bozaoglu et al. 2007).

38
1.2.2.7. Role of Chemerin in PsoriasisPsoriasis is a sort 1 interferon-driven T cell-intervened infection. It is described
by the enlistment of pDCs into the skin. Immunohistochemistry examination uncovers
that chemerin is distinguished in prepsoriatic skin adjacent to active sores and early
sores, yet not from ceaseless plaques. Neutrophils and CMKLR1-positive pDCs are
likewise decidedly stained. Fibroblast refined from the skin of psoriatic injuries express
more elevated amounts of chemerin mRNA and protein than fibroblasts from unaffected
psoriatic skin or healthy donor and advance pDC movement in vitro in a chemerin-
subordinate way (Albanesi et al. 2009). Skrzeczynska-Moneznik et al (Skrzeczynska-
Moneznik et al. 2009). Reported that chemotactically dynamic chemerin is available in
lesional skin of psoriasis patient, which involves the determined power of pDC
amassing in psoriatic skin. In this way, chemerin/CMKLR1 axis assumes an essential
part in psoriasis and may give a restorative focus to this ailment.
1.2.2.8. Role of Chemerin as a Potential Biomarker of Tumors
Adrenocortical tumor (benevolent) is a typical illness with a rate of 4% in the
US populace. Utilizing microarray investigation, chemerin is among the main five
qualities that have a positive relationship with tumor size. The other four qualities are
IL13RA2, HTR2B, CCNB2, and SLC16A (Fernansez-Ranvier et al. 2008). Chemerin
protein and transcript are additionally identified in skin squamous cell carcinoma (SSC).
They are rich in typical epidermis and contiguous skin to SSC lessions, yet scarcely
noticeable around the keratin pearls of SCC (Zheng et al. 2008). Interestingly, chemerin
mRNA expression in mesothelioma is up-directed contrasted and non-harmful
mesothelial cells (Mohr et al. 2004). Taken together, chemerin might be a valuable
biomarker for tumor diagnostics.

39
2. MATERIALS AND METHODS
2.1. SubjectsThis prospective study examined patients who attended the outpatient clinic of
the Endocrinology Department in Famagusta Goverment Hospital and was performed
on two groups. One group was composed of 39 obese patients having a mean age of
44.95 ± 8.84 years and BMI 32.26 ± 4.55 kg/m². The second group was composed of 39
non-obese subjects. The mean age of subjects was 43.8 ± 7.64 years and their mean
BMI was 23.68 ± 1.41 kg/m². None of the participants had hypertension, liver, kidney,
thyroid, cardiovascular or any active inflammatory diseases and they were also
questioned for any medical therapy that might effect the lipid and glucose metabolism.
The participants neither received any medications nor participated in any dietary or
exercise program. All subjects provided written informed consent before enrollment in
the study and the study was approved by the Near East University Research Ethics
Committee.
2.2. Anthropometric measurementsAll the measurements were performed in the morning with the patients in a
fasting state and anthropometric measurements, including weight (kg), height (m), hip
circumference (cm) and waist circumference (cm) of each subject were measured
barefoot and lightly clothed. Hip circumference was measured by placing a tape
measure around the patient’s hips at the level of the prominences over the greater
trochanters of both femurs. Waist circumference was taken midway between the lowest
rip (laterally) and the iliocristale landmark by flexible tape. BMI was calculated as body
weight (kg) divided by the square of height (m²) and obesity was defined as BMI ≥30
kg/m² (World Health Organization, 1995).
2.3. Biochemical parametersBlood samples were obtained after an overnight fasting. The levels of serum
glucose, triglyceride (TG), total cholesterol, high-density lipoprotein cholesterol (HDL-
C) and low-density lipoprotein cholesterol (LDL-C) levels were measured by fully
automated clinical chemistry analyzer (Abbott Architect C8000).

40
2.4. Chemerin measurements by ELISAPlasma chemerin levels were measured using a commercially available enzyme-
linked immunosorbent assay (ELISA) human chemerin kit (Cat. No.: RD191136200R)
(BioVendor). Human chemerin kit was used according to the protocol of the
manufacturer. Results were expressed in ng/ml.
Reagent Supplied
Kit Components:
Antibody Coated Microtiter Strips
Biotin Labelled Antibody Conc. (50X)
Streptavidin- HRP Conjugate
Master Standard
Quality Control High
Quality Control Low
Biotin-Ab Diluent
Dilution Buffer
Wash Solution Conc. (10X)
Substrate Solution
Stop Solution
2.4.1. Assay Procedure1. Pipet 100 μl of diluted Standards, Quality Controls, Dilution Buffer (=Blank) and
samples, preferably in duplicates, into the appropriate wells.
2. Incubate the plate at room temperature ( 25°C) for 1 hour, shaking at 300 rpm on an
orbital microplate shaker.
3. Wash the wells 3-times with Wash Solution (0.35 ml per well). After final wash,
invert and tap the plate strongly against paper towel.
4. Add 100 μl of Biotin Labelled Antibody solution into each well.

41
5. Incubate the plate at room temperature (25°C) for 1 hour, shaking at 300 rpm on an
orbital microplate shaker.
6. Wash the wells 3-times with Wash Solution (0.35 ml per well). After final wash,
invert and tap the plate strongly against paper towel.
7. Add 100 μl of Streptavidin-HRP Conjugate into each well.
8. Incubate the plate at room temperature (25°C) for 1 hour, shaking at 300 rpm on an
orbital microplate shaker.
9. Wash the wells 3-times with Wash Solution (0.35 ml per well). After final wash,
invert and tap the plate strongly against paper towel.
10. Add 100 μl of Substrate Solution into each well.
11. Incubate the plate for 15 minutes at room temperature. The incubation time may be
extended [up to 20 minutes] if the reaction temperature is below than 20°C. Do not
shake the plate during the incubation.
12. Stop the colour development by adding 100 μl of Stop Solution.
13. Determine the absorbance of each well on a microplate reader set to 450 nm,
preferably with the reference wavelength set to 630 nm (acceptable range: 550 - 650
nm). Subtract readings at 630 nm (550 - 650 nm) from the readings at 450 nm. The
absorbance should be read within 5 minutes following step 12.
2.5. Statistical AnalysisThe distributions of continuous variables in groups were expressed as means ±
standard deviation (SD). Differences in baseline characteristics between groups were
analysed by Student’s t-test. Correlation analysis was performed using Pearson tests. A
P value of < 0.05 was considered to indicate statistical significance. All statistical
analyses were performed using the SPSS software (ver. 15.0; SPSS Inc., Chicago, IL).

42
3. RESULTS
Descriptive statistics of anthropometric and metabolic characteristics of the
study population are presented in Table 3.1. Obese and non-obese subjects did not differ
in age, total cholesterol and LDL cholesterol levels while plasma glucose and
triglycerides levels were significantly higher and mean HDL cholesterol levels were
significantly lower in obese than non-obese subjects. Obese subjects had significantly
higher chemerin levels compared to obese subjects.
Table 3. 1. Baseline anthropometric and metabolic characteristics
Parameter
Non-obese subjects
(n=39)
Obese subjects
(n=39) p
Age 43.18 ± 7.64 44.95 ± 8.84 0.34
BMI (kg/m²) 23.68 ± 1.41 32.26 ± 4.55 <0.001
Waist circumference (cm) 85.57 ± 9.25 102.69 ± 12.64 <0.001
Hip circumference (cm) 98.81 ± 9.73 115.14 ± 13.46 <0.001
Fasting glucose (mg/dL) 93.21 ± 6.74 102.02 ± 11.82 <0.001
Total cholesterol (mg/dL) 207.93 ± 22.26 213.57 ± 21.63 0.26
LDL cholesterol (mg/dL) 124.93 ± 19.90 128.54 ± 15.74 0.37
HDL cholesterol (mg/dL) 59.03 ± 6.90 54.09 ± 12.42 0.03
Triglycerides (mg/dL) 97.91 ± 21.97 119.42 ± 59.92 0.038
Chemerin (ng/ml) 90 ± 36.5 122 ± 28.9 <0.001
Data are expressed as means ± SD and were compared by t-test.BMI, body mass index; LDL, low-density lipoprotein; HDL, high-density lipoprotein.
Correlation coefficients between plasma chemerin levels with other biochemical
parameters in non-obese subjects are presented in Table 3.2. Chemerin levels
significantly correlated with BMI, waist circumference, and triglycerides while
chemerin levels did not significantly correlate with hip circumference, fasting glucose,
total cholesterol, LDL-cholesterol and HDL-cholesterol.

43
Table 3.2. Correlation of plasma chemerin levels with baseline parameters in non-obesegroup.
VariableChemerin
r P
BMI (kg/m²) 0.61 <0.001
Waist circumference (cm) 0.36 0.02
Hip circumference (cm) 0.25 0.12
Fasting glucose (mg/dL) 0.28 0.08
Total cholesterol (mg/dL) 0.23 0.16
LDL cholesterol (mg/dL) 0.33 0.04
HDL cholesterol (mg/dL) - 0.22 0.17
Triglycerides (mg/dL) 0.38 0.017
BMI, body mass index; LDL, low-density lipoprotein; HDL, high-density lipoprotein.
Table 3.3 shows correlation coefficients between plasma chemerin levels with
other biochemical parameters in obese subjects. Chemerin levels were significantly
correlated with BMI, triglycerides and total cholesterol levels. On the other hand,
chemerin levels did not significantly correlate with hip and waist circumferences,
fasting glucose, LDL-cholesterol and HDL-cholesterol.

44
Table 3.3. Correlation of plasma chemerin levels with baseline parameters in obese group.
VariableChemerin
r P
BMI (kg/m²) 0. 57 <0.001
Waist circumference (cm) 0.42 0.007
Hip circumference (cm) 0.22 0.17
Fasting glucose (mg/dL) 0.25 0.12
Total cholesterol (mg/dL) 0.41 0.009
LDL cholesterol (mg/dL) 0.21 0.19
HDL cholesterol (mg/dL) - 0.20 0.22
Triglycerides (mg/dL) 0.29 0.07
BMI, body mass index; LDL, low-density lipoprotein; HDL, high-density lipoprotein.

45
4. DISCUSSION
Obesity is characterized by an excess accumulation of white adipose tissue
which is an active endocrine organ, secretes a number of peptides with diverse
biological an physiological functions including regulation of satiety, carbohydrate, lipid
metabolism and insulin sensivity. The signaling molecules secreted from adipose tissue
are collectively called adipocytokines. Chemerin is an adipocytokine that plays a role in
obesity (Kershaw et al., 2004). In the present study, we observed that the chemerin was
significantly correlated with BMI and waist circumference in both obese and non-obese
subjects. Additionally, chemerin levels were correlated with total cholesterol in obese
subjects. In non-obese subjects, chemerin was positively correlated with LDL-
cholesterol levels.
The scientific literature describes chemerin level elevation as increasing the
human body mass index (BMI) above 25 kg/m2, compared to people with a BMI below
25 kg/m2. Chemerin levels correlate positively with body mass index; body fat mass is
the most important factor determining chemerin concentration. The positive correlation
of chemerin levels with BMI has been corroborated widely. Maghsoudi et al. (2015)
reported an association between the chemerin concentration and BMI in a population of
Iran. It has also been reported that chemerin levels correlated with obesity and high
BMI (Shin et al., 2012). In accordance, we also found a significant correlation between
BMI and chemerin concentration in both obese and non-obese subjects.
Waist circumference reflects primarily total abdominal fat, both visceral and
subcutaneous fat. Obese subjects with metabolic syndrome had elevated levels of
circulating and gluteal subcutaneous adipose tissue (SAT) secreted chemerin. In
addition, circulating chemerin levels were positively associated with deposition of
visceral adipose tissue (VAT) (Jialal et al. 2013, Maghsoudi et al. 2015 and Shin et al.
2012) showed that waist circumference was positive relation with chemerin levels.
Similar to the previous findings, we saw positive association between chemerin levels
and waist circumference in both obese and non-obese subjects. These results confirm
that high levels of chemerin expression in visceral adipose tissue and plasma are related
to increased adiposity.
46
Recent studies have demonstrated that chemerin induces insulin resistance in
adipocytes and skeletal muscle cells in vitro and that chemerin levels in humans are
associated with multiple components of the metabolic syndrome including body mass
index (BMI), triglycerides, total cholesterol, LDL- cholesterol and high-density
lipoprotein (HDL)- cholesterol and hypertension. These findings suggest that chemerin
may play a role in the pathophysiology of obesity (Becker et al., 2010). Lörincz et al.
(2014) has also reported that chemerin was positively correlated with LDL-cholesterol
levels in nondiabetic obese and nonobese subjects. Based on the abovementioned
studies, we suggest that plasma chemerin levels significantly correlated with LDL-
cholesterol in non-obese subjects. Thus our results indicate that by disturbing the lipid
metabolism, chemerin may lead to metabolic syndrome and consequent obesity.
The main limitation of this study were the contricted subject number. The
second limitation is that insulin level was not analyzed.
In conclusion, our results suggest that chemerin has association with BMI and
waist circumference in both obese and non-obese subjects. It does have significant
influences on lipid profiles. Based on the literature and our findings, chemerin appears
to play a role in generating lipid metabolism through unknown feedback mechanism
between insulin and hepatocytes functions. Further detailed studies based on greater
populations are needed to confirm these findings and improve our understanding of
metabolic changes and functions of chemerin in obesity.

47
REFERENCES
Adams L.A, Lindor K.D, Angulo P. (2004). The prevalence of autoantibodies and
autoimmune hepatitis in patients with nonalcoholic fatty liver disease. The American
Journal of Gastroenterology, 99:1316-20.
Albanesi C, Scarponi C, Pallotta S, Daniele R, Bosisio D, Madonna S, et al. (2009).
Chemerin expression marks early psoriatic skin lesions and correlates with
plasmacytoid dendritic cell recruitment. The Journal of Experimental Medicine,
206(1):249-58.
Alpert M.A, Terry B.E, Mulekar M, Cohen M.V, Massey C.V, Fan T.M, et al. (1997).
Cardiac morphology and left ventricular function in normotensive morbidly obese with
and without congestive heart failure, and effect of weight loss. The American Journal of
Cardiology, 80(6): 736-740.
Angulo P. (2002). Nonalcoholic fatty liver disease. The New England Journal of
Medicine , 346:1221-31.
Anderson E.K, Gutierrez D.A, Hasty A.H. (2010). Adipose tissue recruitment of
leukocytes. Current Opinion in Lipidology Journal, 21(3):172-7.
Arner P, Arner E, Hammarstedt A, Smith U. (2011). Genetic predisposition for Type 2
Diabetes, but not for overweight/obesity, is associated with a restricted adipogenesis.
PLoS One, 6(4):18284.
Barnea G, Strapps W, Herrada G, Berman Y, Ong J, Kloss B, et al. (2007). The genetic
design of signaling cascades to record receptor activation. Proceedings of the National
Academy of Sciences U S A, 105(1):64-9.
Bates S.H, Myers M.G. (2004). The role of leptin/STAT3 signaling in neuroendocrine
function: an integrative perspective. The Journal of Experimental Medicine, 82:12-20.

48
Becker M, Rabe K, Lebherz C, Zugwurst J, Göke B, Parhofer K.G, et al. (2010)
Expression of human chemerin induces insulin resistance in the skeletal muscle but
does not affect weight, lipid levels, and atherosclerosis in LDL receptor knockout mice
on high-fat diet. Diabetes, 59, 2898 2903.
Begum P, Richardson C.E, Carmichael A.R. (2009). Obesity in post-menopausal
women with a family history of breast cancer: prevalence and risk awareness.
International Seminars in Surgical Oncology, 6:1.
Bergstrom A, Hsieh C.C, Lindblad P, Lu, C.M, Cook, N.R., Wolk, A. (2001). Obesity
and renal cell cancer, a quantitative review. British Journal of Cancer, 85:984-90.
Berndt J.D, Clay M.R, Langenberg T, Halloran M.C. (2008). Rho-kinase and myosin II
affect dynamic neural crest cell behaviors during epithelial to mesenchymal transition in
vivo. Developmental Biology, 324(2):236-44.
Bjursell M, Lennerås M, Göransson M, Elmgren A, Bohlooly-Y M. (2007). GPR10
deficiency in mice results in altered energy expenditure and obesity. Biochemical and
Biophysical Research Communications, 363(3):633-8.
Bjornsdottir S, Stefansson H, Sigurdsson E, Steinthorsdottir V, Ghosh S, et al. (2002).
Neuregulin 1 and susceptibility to schizophrenia. The American Journal of Human
Genetics. 71 (4): 877-892.
Bozaoglu K, Curran J.E, Stocker C.J, Zaibi M.S, Segal D, Konstantopoulos N, et al.
(2010). Chemerin, a novel adipokine in the regulation of angiogenesis. The Journal of
Clinical Endocrinology & Metabolism, 95(5):2476-85.
Bozaoglu K, Bolton K, McMillan J, Zimmet P, Jowett J, Collier G, et al. (2007).
Chemerin is a novel adipokine associated with obesity and metabolic syndrome.
Endocrinology, 148(10):4687-94.

49
Calle E.E, Rodriguez C, Walker-thurmond K, Thun M.J. (2003). Overweight, obesity
and cancer. The New England Journal of Medicine, 348:1625-38.
Calle E.E, Kaaks R. (2004). Overweight, obesity and cancer: epidemiological evidence
and proposed mechanisms, Nature Reviews Cancer, 4(8):579-591.
Candiotti K, Sharma S, Shankar R. (2009). Obesity, obstructive sleep apnea , and
diabetes mellitus: anaesthetic implications. British Journal of Anaesthesia , 103:23-30.
Caldwell S.H, Crespo D.M, Al-Osaimi A.M. (2004). Obesity and hepatocellular
carcinoma. Gastroenterology, 127:97-103.
Cash J.L, Christian A.R, Greaves D.R. (2010). Chemerin peptides promote
phagocytosis in a ChemR23- and Syk-dependent manner. The Journal of Immunology,
184(9):5315-24.
Chan J.M, Rimm E.B, Colditz G.A, Stampfer M.J, Willett W.C. (1994). Obesity, fat
distribution, and weight gain as risk factors for clinical diabetes in men. Diabetes
Care, 17:961–969.
Chong K.S, Gardner R.S, Morton J.J, Ashley E.A, McDonagh T.A (2006). Plasma
concentrations of the novel peptide apelin are decreased in patients with chronic heart
failure. European Journal of Heart Failure, 8(4):355-60.
Chobanian A.V, Bakris G.L, Black H.R, Cushman W.C, Green L,A, Izzo J.L Jr, et al.
(2003). The seventh report of the Joint National Committee on Prevention, Detection,
Evaluation, and Treatment of High Blood Pressure: the JNC 7 Report, 289: 2560–2572.
Comuzzie A.G, Allison D.B. (1998). The search for human obesity genes. Science,
280:1374-1377

50
Colditz G.A, Willett W.C, Rotnitzky A, Manson J.E. (1995). Weight gain as a risk
factor for clinical diabetes mellitus in women. Annals of Internal Medicine, 122(7):481-
486.
Curzio M, Esterbauer H, Di Mauro C, Cecchini G, Dianzani M.U. (1986).Chemotactic
activity of the lipid peroxidation product 4-hydroxynonenal and homologous
hydroxyalkenals. The Journal of Biological Chemistry, 367:321–329.
Dawson S. I. (2004). Long-term risk of malignant neoplasm associated with gestational
glucose intolerance. American Cancer Society,100:149–155.
De Godoy J.M, de Godoy M, de F. (2010). Godoy & Godoy technique in the treatment
of lymphedema for under-privileged populations. International Journal of Medical
Sciences, 7:68-71.
De Pergola G, Ciccone M, Pannacciulli N, Modugno M, Sciaraffia M, Minenna A. et
al. (2000). Lower insulin sensitivity as an independent risk factor for carotid wall
thickening in normotensive, non-diabetic, non-smoking normal weight and obese
premenopausal women. International journal of obesity and related metabolic
disorders, 24:825–829.
De Souza C.M, Braosi A.P, Luczyszyn S.M, Avila A.R, de Brito R.B Jr, Ignácio S.A. et
al. (2007). Association between vitamin D receptor gene polymorphisms and
susceptibility to chronic kidney disease and periodontitis. Blood Purification Journal ,
25:411-9.
Debrunner M, Schuiki E, Minder E, Straumann E, Naegeli B, Mury R, et al. (2008).
Proinflammatory cytokines in acute myocardial infarction with and without cardiogenic
shock. Journal of Cardiology & Clinical Research, 97(5):298-305.
Denzer C, Thiere D, Muche R, Koenig W, Mayer H, Kratzer W, et al. (2009). Gender-
specific prevalences of fatty liver in obese children and adolescents: roles of body fat

51
distribution, sex steroids, and insulin resistance. The Journal of Clinical Endocrinology
& Metabolism
, 94:3872–81.
Donohoe C.L, Pidgeon G.P, Lysaght J, Reynolds J.V. (2010). Obesity and
gastrointestinal cancer. British Journal of Surgery, 97:628-642.
Du X.Y, Leung L.L. (2009). Proteolytic regulatory mechanism of chemerin bioactivity.
Acta Biochimica et Biophysica Sinica, 41(12):973-9.
El-Serag H.B, Rudolph K.L. (2007). Hepatocellular carcinoma: epidemiology and
molecular carcinogenesis. Gastroenterology, 132: 2557–2576.
Ernst M.C, Sinal C.J. (2010). Chemerin: at the crossroads of inflammation and obesity.
Trends in Endocrinology & Metabolism, 21(11):660-7.
Farrell G.C, Larter C.Z. (2006). Nonalcoholic fatty liver disease: from steatosis to
cirrhosis. Hepatology, 43:99-112.
Farhat T, Iannotti R.J, Simons-Morton B.G. (2010). Overweight, obesity, youth, and
health-risk behaviors. American Journal of Preventive Medicine, 38:258–267.
Farooqi, I.S. (2002). Leptin and the onset of puberty: insights from rodent and human
genetics. Seminars in Reproductive Medicine Journal, 20(2):139-44.
Ferlay J, Autier P, Bonio l.M, Heanue M., Colombet M., Boyle P. (2006). Cancer
incidence and mortality in Europe, 2006. Annals of Oncology, 16(3):481–8.
Fernandez-Ranvier G.G, Weng J, Yeh R.F, Khanafshar E, Suh I, Barker C. et al.
(2008). Identification of biomarkers of adrenocortical carcinoma using genomewide
gene expression profiling. Archives of Surgery Journal, 143(9):841-6.
52
Forsythe L.K, Wallace J.M. (2008). Obesity and inflammation: the effects of weight
loss. Nutrition Research Reviews, 21(2):117-133.
Flegal K.M, Carroll M.D, Ogden C.L, Curtin L.R. (2010). Prevalence and trends in
obesity among US adults. The Journal of the American Medical Association,
303(3):235–41.
Flier J.S, Elmquist J.K. (2004). A good night's sleep: future antidote to the obesity
epidemic. Annals of Internal Medicine, 141(11):885-6.
Friedman J.M, Alwan S, Reefhuis J, Rasmussen S.A. (2011). National Birth Defects
Prevention Study.J Clin Pharmacol, 51(2):264-70.
Frasca F, Pandini G, Sciacca L, Pezzino V, Squatrito S, Belfiore A, et al. (2008). The
role of insulin receptors and IGF-I receptors in cancer and other diseases. Archives of
Physiology and Biochemistry Journal, 114:23–37.
Fujita K, Matsuyama A, Kobayashi Y, Iwahashi H. (2004). Comprehensive gene
expression analysis of the response to straight-chain alcohols
in Saccharomycescerevisiae using cDNA microarray. Journal of Applied
Microbiology, 97: 57–67.
Fukuhara A, Shimomura I. (2005). Impaired glucose-uptake in adipocytes. Nihon
Rinsho Geka Gakkai Zasshi, 63:141-6.
Gade W, Gade J, Collins M, Schmit J, Schupp N. (2010). Failures of feedback: rush
hour along the highway to obesity. Clinical laboratory science, 23(1):39-50.
Gálvez-Prieto B, Bolbrinker J, Stucchi P, de Las Heras A.I, Merino B, Arribas S, et al.
(2008). Comparative expression analysis of the renin-angiotensin system components
between white and brown perivascular adipose tissue. Journal of Endocrinology,
197(1):55-64.

53
Gelber R..P, Gaziano J.M, Orav E.J, Manson J.E, Buring J.E, Kurth T. (2008).
Measures of obesity and cardiovascular risk among men and women. American College
of Cardiology , 52:605–15.
Gesta S, Tseng Y.H, Kahn C.R (2007). Developmental origin of fat: tracking obesity to
its source. Cell, 131(2):242-56.
Ginsberg H.N, Fisher E.A. (2009). The ever-expanding role of degradation in the
regulation of apolipoprotein B metabolism. Journal of Lipid Research, 162-166.
Giovannucci E, Ascherio A, Rimm E.B, Stampfer M.J, Colditz G.A, Willett W.C.
(1995). Intake of carotenoids and retinol in relation to risk of prostate cancer. Journal of
the National Cancer Institute, 87:1767-76.
Gray D.S, Fujioka K. (1991). Use of relative weight and Body Mass Index for the
determination of adiposity. Journal of Clinical Epidemiology, 44:545–550.
Graham K.L, Zabel B.A, Loghavi S, Zuniga L.A, Ho P.P, Sobel R.A. et al. (2009).
Chemokine-like receptor-1 expression by central nervous system-infiltrating leukocytes
and involvement in a model of autoimmune demyelinating disease. The Journal of
Immunology; 183(10):6717-23.
Gomaa A.I, Khan S.A, Toledano M.B, Waked I, Taylor-Robinson S.D. (2008).
Hepatocellular carcinoma: epidemiology risk factors and pathogenesis. World Journal
of Gastroenterology, 14:4300–4308.
Goodyear L.J, Giorgino F, Sherman L.A, Carey J, Smith R..J, Dohm G.L. (1995).
Insulin receptor phosphorylation, insulin receptor substrate-1 phosphorylation, and
phosphatidylinositol 3-kinase activity are decreased in intact skeletal muscle strips from
obese subjects. Journal of Clinical Investigation , 95(5):2195-204.

54
Goralski K.B, McCarthy T.C, Hanniman E.A, Zabel B.A, Butcher E.C, Parlee S.D, et
al. (2007). Chemerin, a novel adipokine that regulates adipogenesis and adipocyte
metabolism. The Journal of Biological Chemistry; 282(38):28175-88.
Gualillo O, Eiras S, Lago F, Diéguez C, Casanueva F.F. (2000). Elevated serum leptin
concentrations induced by experimental acute inflammation. Life Sciences,
67(20):2433-41.
Haemmerle G, Zimmermann R, Hayn M, Theussl C, Waeg G, Wagner E. et al. (2002).
Hormone-sensitive lipase deficiency in mice causes diglyceride accumulation in adipose
tissue, muscle, and testis. The Journal of Biological Chemistry, 277(7):4806-15.
Hamdy O, Porramatikul S, Al-Ozairi E. (2006). Metabolic obesity: the paradox between
visceral and subcutaneous fat. Current Diabetes Reviews, 2(4):367-73.
Hansson G.K. (2005). Inflammation, atherosclerosis, and coronary artery disease. The
New England Journal of Medicine, 352(16):1685-95.
Hausman D.B, DiGirolamo M, Bartness T.J, Hausman G.J, Martin R.J. (2001). The
biology of white adipocyte proliferation. Obesity Reviews, 239–254.
Hector J, Schwarzloh B, Goehring, Strate T.G, Hess U.F, Deuretzbacher G. et al.
(2007). TNF-alpha alters visfatin and adiponectin levels in human fat. Hormone and
Metabolic Research Journal , 39(4):250-5.
Higuchi K, Tanabe S, Saigenji K. (2007). Drug-induced gastrointestinal disorder. Nihon
Rinsho. Supplement, 8:126-30.
Huxley R, Kengne A.P, Czernichow S, Ninomiya T, Batty G.D, Grobbee D.E, et al
(2010). Impact of blood pressure lowering on cardiovascular outcomes in normal
weight, over weight and obese individuals: the Perindopril Protection Against
Recurrent Stroke Study trial. Hypertension. 55(5):1193-8.

55
Irving A.J, Wallace L, Durakoglugil D, Harvey J. (2006). Leptin enhances NR2B-
mediated N-methyl-D-aspartate responses via a mitogen-activated protein kinase-
dependent process in cerebellar granule cells. Neuroscience, 138(4):113748.
Jialal I, Devaraj S, Kaur H, Adams-Huet B, Bremer A.A. (2013). Increased chemerin
anddecreased omentin-1 in both adipose tissue and plasma in nascent
metabolicsyndrome. The Journal of Clinical Endocrinology & Metabolism, 98: 514-
517.
Jocken J.W, Langin D, Smit E, Saris W.H, Valle C, Hul G.B. et al. (2007). Adipose
triglyceride lipase and hormone-sensitive lipase protein expression is decreased in the
obese insulin-resistant state. Journal of Clinical Endocrinology & Metabolism ,
92(6):2292-9.
John H, Whallett A, Quinlan M. (2007). Successful biologic treatment of ocular mucous
membrane pemphigoid with anti-TNF-alpha. Eye, 21(11):1434-5.
Juge-Aubry C.E, Henrichot E, Meier C.A. (2005). Adipose tissue: a regulator of
inflammation. Best Practice & Research Clinical Endocrinology & Metabolism,
19(4):547-66.
Jung U.J, Choi M.S. (2014). Obesity and Its Metabolic Complications: The Role of
Adipokines and the Relationship between Obesity, Inflammation, Insulin Resistance,
Dyslipidemia and Nonalcoholic Fatty Liver Disease. International Journal of Molecular
Sciences, 15:6184-6223.
Kaaks R, Lukanova A, Kurzer M. (2002). Obesity, endogenous hormones, and
endometrial cancer risk: a synthetic review. Cancer Epidemiology, Biomarkers &
Prevention, 11:1531-1543.
Karppelin M, Siljander T, Vuopio-Varkila J, Kere J, Huhtala H, Vuento R, et al. (2010).
Factors predisposing to Acute and Recurrent Bacteria Non-necrotizing Cellulitis in

56
Hospitalized Pateints: A Prospective Case-Control Study. Clinical Microbiology and
Infection , 16:16729-734.
Keaney J.F, Gokce N, Hunter L.M, Menzoian J.O, Vita J.A, et al. (2003) Predictive
value of non-invasively-determined endothelial dysfunction for long-term
cardiovascular events in patients with peripheral vascular disease. Journal of the
American College of Cardiology : 1769-1775.
Käser S.A, Willi N, Maurer C.A. (2014) Mandatory resection of strangulation marks in
sall bowel obstruction. World Journal of Surgery, 38(1):11-5.
Kaur J, Srinivasan R, Arora S.K, Rajwanshi A, Saikia U.N, Dutta P. et al. (2012). Fine-
needle aspiration in the evaluation of thyroid lesions in children. Diagnostic
Cytopathology, 40:33-7.
Kenchaiah S, Evans J.C, Levy D, Wilson P.W, Benjamin E.J, Larson M.G, et al. (2002).
Obesity and the risk of heart of heart failure. The New England Journal of Medicine
, 347(5):305-313.
Kershaw E.E, Flier J.S. (2004) Adipose tissue as an endocrine organ. The Journal of
Clinical Endocrinology & Metabolism, 89:2548-56.
Klaman L.D, Kim J.Y, van de Wall E, Kim J.K, Martino J.L, Zabolotny J.M. et al.
(2007). Obesity-associated improvements in metabolic profile through expansion of
adipose tissue. Journal of Clinical Investigation , 117:2621–2637.
Kralisch S, Sommer G, Deckert C.M, Linke A, Bluher M, Stumvoll M, et al. (2007).
Adipokines in diabetes and cardiovascular diseases. Minerva endocrinologica Journal ,
32(3):161-71.
Kurukulasuriya L.R., Stas S, Lastra G, Manrique C, Sowers J.R. (2008). Hypertension
in obesity. Endocrinology Metabolism Clinics of North America, 37:647-662.

57
Kurth T, Gaziano J.M, Berger K, Kase C.S, Rexrode K.M, Cook N.R, et al. (2002). Body
mass index and the risk of stroke in men. Archives of Internal Medicine Journal ,
162:2557-2562.
Kusminski C.M, McTernan P.G, Kumar S. (2005). Role of resistin in obesity, insulin
resistance and Type II diabetes. Clinical Science Journal , 109(3):243-56
Lloyd-Jones D.M, Liu K, Tian L, Greenland P. (2006). Narrative review: assessment of
C- reactive protein in risk prediction for cardiovascular disease. Annals of Internal
Medicine , 145: 35–42.
Lavie C.J, Milani R.V. (2003). Obesity and cardiovascular disease: the Hippocrates
paradox? Journal of the American College of Cardiology, 42:677–9.
Lee D.K, Yoo H.I. (2006). Electron-ion interference and Onsager reciprocity in mixed
ionic-electronic transport in TiO2. Physical Review Letters, 97(25):255901.
Lehrke M, Becker A, Greif M, Stark R., Laubender R..P, von Ziegler F. et al. (2009).
Chemerin is associated with markers of inflammation and components of the metabolic
syndrome but does not predict coronary atherosclerosis. European Journal of
Endocrinology, 161(2):339-44.
Lorincz H., Katko M., Harangi M, Somodi S, Gaál K, Fülöp P, et al. (2014). Strong
correlations between circulating chemerin levels and lipoprotein subfractions in
nondiabetic obese and nonobese subjects. Clinical Endocrinology, 81:370-377.
Luangsay S, Wittamer V, Bondue B, De Henau O, Rouger L, Brait M. et al. (2009).
Mouse ChemR23 is expressed in dendritic cell subsets and macrophages, and mediates
an anti-inflammatory activity of chemerin in a lung disease model. Journal of
Immunology; 183(10):6489-99.

58
Moreno-Aliaga M.J, Santos J.L, Marti A, Martinez J.A. (2005). Does weight loss
prognosis depend on genetic make-up? Obesity Reviews. 6:155-168.
Mathieu P, Lemieux I, Despres J. (2010). Obesity, inflammation and cardiovascular
risk. Clinical Pharmacology & Therapeutics, 87: 407–416
Mathieu P, Poirier P, Pibarot P, Lemieux I, Després J.P. (2009). Visceral obesity: the
link among inflammation, hypertension, and cardiovascular disease. Hypertension,
53:577–584.
Manigrasso M.R, Ferroni P, Santilli F, Taraborelli T, Guagnano M.T, Michetti N, et al.
(2005). Association between circulating adiponectin and interleukin-10 levels in
android obesity: effects of weight loss. The Journal of Clinical Endocrinology &
Metabolism, 90: 5876–5879.
MacInnis R.J, Severi G, Morris H.A, English D.R, Tilley W.D, Hopper J.L, et al.
(2006). Circulating insulin-like growth factor-1 and binding protein-3 and risk of
prostate cancer. Cancer Epidemiology, Biomarkers & Prevention, 15:1137-1141.
Moon O.R, Kim N, Jang S, Yoon T, Kim S. (2002). The relationship between body
mass index and the prevalence of obesity-related diseases based on the 1995 National
Health Interview Survey in Korea. Obesity Reviews, 3:191–196.
Mohamed-Ali V, Goodrick S, Bulmer K, Holly J.M, Yudkin J.S, Coppack S.W. (1999).
Production of soluble tumor necrosis factor receptors by human subcutaneous adipose
tissue in vivo. American Journal of physiology, 277:971-5.
Maghsoudi Z, Kelishadi R., Hosseinzadeh-Attar M..J. (2015) Association of chemerin
levels with anthropometric indexes and C-reactive protein in obese and non-obese
adolescents. ARYA Atherosclerosis Journal , 11:102-108.
59
Mehra M.R, Uber P.A, Park M.H, Scott R.L, Ventura H.O, Harris B.C, et al. (2004).
Obesity and suppressed B-type natriuretic peptide levels in heart failure. Journal of the
American College of Cardiology, 43:1590-1595.
Madala M.C, Franklin B.A, Chen A.Y, Berman A.D, Roe M.T, Peterson E.D, et al.
(2008). Obesity and age of first non-ST segment elevation myocadiac infarction.
Journal of the American College of Cardiology, 52:979-985.
Matsuzawa Y, Funahashi T, Nakamura T. (2011). The concept of metabolic syndrome:
contribution of visceral fat accumulation and its molecular mechanism. Journal of
Atherosclerosis and Thrombosis , 18:629–39.
Matarese G, Mantzoros C, La Cava A. (2007). Leptin and adipocytokines: bridging the
gap between immunity and atherosclerosis. Current Pharmaceutical Design,
13(36):3676-80
Mandard S, Zandbergen F, van Straten E, Wahli W, Kuipers F, Müller M., et al. (2005).
The fasting-induced adipose factor/angiopoietin-like protein 4 is physically associated
with lipoproteins and governs plasma lipid levels and adiposity. Journal of Biological
Chemistry, 281(2):934-44.
Maruyoshi H, Kojima S, Funahashi T, Miyamoto S, Hokamaki J, Soejima H. et al.
(2004). Adiponectin is inversely related to plasminogen activator inhibitor type 1 in
patients with stable exertional angina. Journal of Thrombosis and Haemostasis ,
91(5):1026-30.
Montani J.P, Carroll J.F, Dwyer T.M, Antic V, Yang Z, Dulloo A.G. et al. (2004).
Ectopic fat storage in heart, blood vessels and kidneys in the pathogenesis of
cardiovascular diseases. International Journal of Obesity, 4:58-65.
60
Meder W, Wendland M, Busmann A, Kutzleb C, Spodsberg N, John H. et al. (2003).
Characterization of human circulating TIG2 as a ligand for the orphan receptor
ChemR23. FEBS Letters Journal, 555(3):495-9.
Muruganandan S, Roman A.A, Sinal C.J. (2010). Role of chemerin/CMKLR1 signaling
in adipogenesis and osteoblastogenesis of bone marrow stem cells. Journal of Bone and
Mineral Research, 25(2):222-34.
Muoio D.M, Newgard C.B. (2006). Obesity-related derangements in metabolic
regulation. Annual Review of Biochemistry, 75:367-401.
Müssig K, Mörike K, Klein R, Sträter J, Georges G, Häring H.U. et al. (2009).
Hypothyroidism due to pseudo-malabsorption of levothyroxine. Deutsche Medizinische
Wochenschrift , 134(49):2514.
Nair S, Brockman A, Paiphun L, Nosten F, Anderson T.J. (2002). Rapid genotyping of
loci involved in antifolate drug resistance in plasmodium falciparum by primer
extension. International Journal for Parasitology, 32:852–858.
Ong J.P, Pitts A, Younossi Z.M. (2008). Increased overall mortality and liver-related
mortality in non-alcoholic fatty liver disease. Journal of Hepatology, 49: 608–612.
Oreopoulos A, Padwal R, Kanlantar-Zadeh K, Fonarow G.C, Norris C.M, McAlister
F.A. et al. (2008). Body mass index and mortality in heart failure: a meta-analysis.
American Heart Journal, 156:13–22.
Ouedraogo R. (2013). AIDS and the transition to adulthood of young seropositive
women in Ouagadougou Global Health Promotion, 20:20-5.

61
Ottaviani C, Nasorri F, Bedini C, de Pità O, Girolomoni G, Cavani A. et al. (2006).
CD56 bright CD16(-) NK cells accumulate in psoriatic skin in response to CXCL10 and
CCL5 and exacerbate skin inflammation. European Journal of Immunology, 36(1):118-
28.
Olshansky S.J, Passaro D.J, Hershow R.C, Layden J, Carnes B.A, Brody J. Et al.
(2005). A potential decline in life expectancy in the United States in the 21st century.
New England Journal of Medicine, 352: 1138–1145.
Patton H.M. (2008). Clinical correlates of histopathology in pediatric nonalcoholic
steatohepatitis. Gastroenterology, 135(6):1961-71.
Pischon T, Lahmann P.H, Friedenreich C, Norat T, Tjønneland A, et al. (2008). Body
size and risk of colon and rectal cancer in the European Prospective Investigation Into
Cancer and Nutrition (EPIC). Journal of the National Cancer Institute, 98(13):920-31.
Partinen M, Guilleminault C, Quera-Salva M.A, Jamieson A. (1988). Women and the
obstructive sleep apnea syndrome. Chest, 93:104-109.
Patel S.D, Rajala M.W, Rossetti L, Scherer P.E, Shapiro L. (2004). Disulfide-dependent
multimeric assembly of resistin family. Hormone Science, 304(5674):1154-8.
Parlee S.D, Ernst M.C, Muruganandan S, Sinal C.J, Goralski K.B. (2009). Serum
chemerin levels vary with time of day and are modified by obesity and tumor necrosis
factor-{alpha}. Endocrinology, 151(6):2590-602.
Romero-Corral A, Somers V.K, Sierra-Johnson J, Korinek J, Thomas R.J, Allison T.G,
et al. (2008). Accuracy of body mass index in diagnosing obesity in the adult general
population. International Journal of Obesity, 32(6):959– 966.
Romeo-Corral A, Montori V.M, Somers V.K, Korinek J, Thomas R.J, Allison T.G. et
al. (2006). Association of bodyweight with total mortality and with cardiovascular

62
events in coronary artery disease: A systematic review of cohort studies. Lancet;
368:666-678.
Rupnick M.A, Panigrahy D, Zhang C.Y, Dallabrida S.M, Lowell B.B, Langer R. et al.
(2002). Adipose tissue mass can be regulated through the vasculature. Proceedings of
the National Academy of Sciences of the United States, 99(16):10730-5.
Sweeting H.N. (2007). Gendered dimensions of obesity in childhood and
adolescence. Nutrition Journal 7:1.
Kroke A. (2004). Application of new statistical method to derive dietary pattern in
nutritional epidemiology. American Journal of Epidemiology, 159:935-944.
Shin HY, Lee DC, Chu SH, Jeon J.Y, Lee M.K, Im J.A. et al. (2012) Chemerin levels
are positively correlated with abdominal visceral fat accumulation. Clinical
Endocrinology, 77(1): 47-50.
Sreeramoju P, Porbandarwalla N.S, Arango J, Latham K, Dent D.L, Stewart R.M, et al.
(2011). Recurrent skin and soft tissue infections due to methicillin-resistant
Staphylococcus aureus requiring operative debridement. The American Journal of
Surgery, 201: 216–220.
Stamler R, Baba S, Pan W.H, Ueshima H, Ozawa H, Komachi Y. et al. (1991). Blood
pressure levels, related factors and hypertension control status of Japanese and
Americans. Journal of Human Hypertension, 5, 317-32.
Sugarman H.J. (2001). Effect of increased intra-abdominal pressure in severe obesity.
Surgical Clinics of North America, 81:1063-1075.
Suganami T, Mukoyama M, Mor K, Yokoi H, Koshikawa M, Sawai K, et al.(2005).
Prevention and reserval of renal injury by leptin in a new mouse model of diabetic
nephropathy. Federation of American Societies for Experimental Biology, 19:127-129.

63
Savage D.B, Sewter C.P, Klenk E.S, Segal D.G, Vidal-Puig A, Considine R.V. et al.
(2001). Resistin / Fizz3 expression in relation to obesity and peroxisome proliferator-
activated receptor-gamma action in humans.Diabetes, 50(10):2199-202.
Saito K, Takahashi M, Fukuta K, Tachibana E, Yoshida J. (1999). Recovery of
olfactory function after an anterior craniofacial approach. Skull Base Surgery, 9(3):201-
206.
Skrzeczyńska-Moncznik J, Stefańska A, Zabel B.A, Kapińska-Mrowiecka M, Butcher
E.C, Cichy J. (2009) Chemerin and the recruitment of NK cells to diseased skin. Acta
Biochimica Polonica, 56(2):355-60.
Spiroglou S.G, Kostopoulos C.G, Varakis J.N, Papadaki H.H. (2010). Adipokines in
periaortic and epicardial adipose tissue: differential expression and relation to
atherosclerosis. Journal of Atherosclerosis and Thrombosis, 17(2):115-30.
Sell H, Divoux A, Poitou C, Basdevant A, Bouillot J.L, Bedossa P. et al. (2010).
Chemerin correlates with markers for fatty liver in morbidly obese patients and strongly
decreases after weight loss induced by bariatric surgery. The Journal of Clinical
Endocrinology & Metabolism, 95(6):2892-6.
Stejskal D, Karpisek M, Hanulova Z, Svestak M. (2008). Chemerin is an independent
marker of the metabolic syndrome in a Caucasian population--a pilot study. Biomedical
papers of the Medical Faculty of the University Palacky Czech Republic; 152(2):217-
21.
Tan BK, Chen J, Farhatullah S, Adya R, Kaur J, Heutling D, et al (2009). Insulin and
metformin regulate circulating and adipose tissue chemerin. Diabetes, 58(9):1971-7.
Tasali E, Mokhlesi B, Van cauter E. (2008). Obstructive sleep apnea and type 2
diabetes:interacting epidemics. Chest, 133:496-506.

64
Talukdar S, Hillgartner F.B. (2006). The mechanism mediating the activation of
acetylcoenzyme A carboxylase–alpha gene transcription by the liver X receptor agonist
T0- 901317. The Journal of Lipid Research, 47:2451–2461.
Torres D.M, Harrison S.A. (2008). Diagnosis and therapy of nonalcoholic
steatohepatitis. Gastroenterology, 134:1682-1698.
Trujillo M.E, Pajvani U.B, Scherer P.E. (2005). Apoptosis through targeted activation
of caspase 8 ("ATTAC-mice"): novel mouse models of inducible and reversible tissue
ablation. Cell Cycle, 4(9):1141-5.
Trentham-dietz A, Shoff S.M, Newcomb P.A, Remington P.L, Mittendorf
R, Greenberg E.R, et al. (2000). Early-life physical activity and postmenopausal breast
cancer: effect of body size and weight change. Cancer Epidemiology, Biomarkers &
Prevention, 9:591-595.
Trollo P.J Jr, Rogers R.M. (1996). Obstructive sleep apnea. The New England Journal
of Medicine, 334:99 –104.
Uretsky S, Messerli F, Bangalore S, Champion A, Cooper-Dehoff R.M, Zhou Q, et al
(2007). Obesity paradox in hypertension and coronary artery disease. American Journal
of Medicine, 120:863–870.
Vermi W, Riboldi E, Wittamer V, Gentili F, Luini W, Marrelli S. et al. (2005). Role of
ChemR23 in directing the migration of myeloid and plasmacytoid dendritic cells to
lymphoid organs and inflamed skin. The Journal of Experimental Medicine,
201(4):509-15.
Wassertheil-Smoller S, Anderson G, Psaty B.M, Ueshima H, Ozawa H, Komachi Y. et
al. (2000). Hypertension and its treatment in postmenopausal women: baseline data
from the Women’s Health Initiative. Hypertension, 36: 780–789.
65
Wanahita N, Messerli F.H, Bangalore S, Gami A.S, Somers V.K, Steinberg J.S. et al.
(2008). Atrial fibrillation and obesity–results of a meta-analysis. American Heart
Journal, 155: 310– 315.
Weigert J, Neumeier M, Wanninger J, Bauer S, Farkas S, Scherer M.N, et al. (2010).
Serum galectin-3 is elevated in obesity and negatively correlates with glycosylated
hemoglobin in type 2 diabetes. The Journal of Clinical Endocrinology & Metabolism,
95(3):1404-11.
White R.T, Damm D, Hancock N, Rosen B.S, Lowell B.B, Usher P. et al. (1992).
Human adipsin is identical to complement factor D and is expressed at high levels in
adipose tissue. The Journal of Biological Chemistry, 267(13): 9210-3.
Wing R.R, Guare J.C, Marcus M.D, Epstein L.H, Burton L.R, Gooding W.E et al.
(1989). Analysis of changes in eating behavior and weight loss in type II diabetic
patient which behaviors to change. Diabetes Care, 12(7):500-503.
Widlansky M.E, Price D.T, Gokce N, Eberhardt R.T, Duffy S.J, Holbrook M, et al.
(2003). Short- and long-term COX-2 inhibition reverses endothelial dysfunction in
patients with hypertension. Hypertension. 2003b;42:310–315.
Wittamer V, Grégoire F, Robberecht P, Vassart G, Communi D, Parmentier M. et al.
(2003). The C-terminal nonapeptide of mature chemerin activates the chemerin receptor
with low nanomolar potency. The Journal of Biological Chemistry; 279(11):9956-62.
Xu H, Hirosumi J, Uysal K.T, Guler A.D, Hotamisligil G.S. (2002). Exclusive action of
transmembrane TNF alpha in adipose tissue leads to reduced adipose mass and local but
not systemic insulin resistance. Endocrinology, 143:1502–1511.

66
Yamamoto T, Katayama Y, Kobayashi K, Oshima H, Fukaya C, Tsubokawa T. (2010).
Deep brain stimulation for the treatment of vegetative state. European Journal of
Neuroscience . 32, 1145–1151.
Yang Q, Cui J, Chazaro I, Cupples L.A, Demissie S.B. et al. (2005). Power and type I
error rate of false discovery rate approaches in genome-wide association studies. MC
Genet, 6:134.
Yoshimura T. (2008). Molecular mechanism regulating seasonal time measurement in
vertebrates. Tanpakushitsu Kakusan Koso, 53(14):1865-72.
Yosipovitch G, Patel T, Ishiuji Y. (2007). A refreshing look at this ancient
compound. Journal of the American Academy of Dermatology, 57:873–8,
Youn B.S, Klöting N, Kratzsch J, Lee N, Park J.W, Song E.S. et al. (2008). Serum
vaspin concentrations in human obesity and type 2 diabetes. Diabetes, 57(2):372-7.
Zabel B.A, Zuniga L, Ohyama T, Allen S.J, Cichy J, Handel T.M et al. (2006).
Chemoattractants, extracellular proteases, and the integrated host defense response.
Experimental Hematology, 34(8):1021-32.
Zhang Y, Proenca R, Maffei M, Barone M, Leopold L, Friedman J.M. (1994).
Positional cloning of the mouse obese gene and its human homologue. Nature, 372:425-
432.
Zheng Y, Zhao X.G, Liang J.M, Chan QC, Yang XF, Li G, (2008). In vivo tumor
detection on rabbit with biopsy needle as MRE driver. Engineering in Medicine and
Biology Society : 121-4


