In accordance with US SEC Regulation AC, important US regulatory disclosures and analyst certification can be found at http://www.troika.ru/eng/research/disclosure.wbp. [email protected], www.troika.kz KAZAKHSTAN | STRATEGY JANUARY 2010 Kazakh forward P/E vs global peers 0 5 10 15 20 25 2006 2007 2008 2009 2010 Kazakhstan Russia Emerging markets MSCI EM Asia Source: Thomson, Troika estimates Natural resource assets per capita, $ ’000 0 200 400 600 800 Saudi Arabia Kazakhstan Australia Russia South Africa Canada Chile US Ukraine Brazil Indonesia China Source: Kazakhmys, USGS, BP, NWA, World Bank, Uranium One, ENRC, IMF, Troika estimates Kazakh crude production, mln bpd 0 1 2 3 4 1990 1992 1994 1996 1998 2000 2002 2004 2006 2008 2010E 2012E 2014E 2016E 2018E 2020E Actual CERA, high CERA, mid CERA, low Government Source: CERA, Kazakh government Performance of key groups in Kazakhstan 0% 30% 60% 90% 120% 150% 180% Jan ’08 Jul ’08 Jan ’09 Jul ’09 Jan ’10 Liquid exporters Banks Midcap exporters Other domestics Source: Bloomberg, Troika estimates Kingsmill Bond +44 (207) 822 0771 [email protected]Askar Yelemessov +7 (727) 244 2333 [email protected]Andrey Kuznetsov +7 (495) 933 9844 Zaurbek Zhunisov +7 (727) 244 2333 Ainur Medeubayeva +7 (727) 244 2333 Kazakh Strategy The Pure Play on China █ A commodity cornucopia. Kazakhstan has some 3% of the world’s raw materials, and only 0.2% of its population. Its natural resource base of over $300,000 per capita is therefore among the highest in the world, twice the level of Russia, and higher than Australia. █ Planned doubling of production. These raw materials have only been thinly exploited over the years, and the country plans to double production over the next decade of many of its resources, but above all of oil. █ Increasing links to China. Kazakhstan is building major new oil, gas, rail, and road links to China, and has a pipeline in place that will be capable of sending a quarter of its oil exports to China. During the crisis, China provided the capital necessary to stabilize the country, and has been rewarded with an increasing share of its resources. During 2010, Kazakh companies may seek listings in Hong Kong and could be seen as part of the China story. █ Reformminded elite. Kazakhstan is moving up the global rankings for ease of doing business, transparency and reforms, as its elite seeks to balance huge wealth with the threat of its geographical location. For example, they were able to facilitate some GDP growth in 2009. █ Debt is high but under control. The debt and property excesses of 200307 will hold back growth, and corporate debt levels are high for an emerging market. However, forex reserves are significant, most of the forex debt is for the development of raw material extraction, government debt is minimal, and a group of good banks has emerged; provided oil stays over $60/bbl, the macroeconomic framework should be stable. █ Cheap market. Kazakhstan trades at a 2010E EV/EBITDA of 5.6 and P/E of 10.4, implying a 25% discount to GEM. Among liquid stocks, Kazakhmys and Uranium One trade at discounts of 4050% to global peers. █ Cheap currency. The tenge is down 12% in REER terms against the ruble since the crisis started, Kazakhstan is running a current account surplus, and the local currency’s implied fair value at $80/bbl oil is below KZT140/$1. █ Not widely held. Outside the top five names, Kazakh stocks are little held by foreign investors. Oil prices sustained near current levels, Chinese listings and a good domestic story are likely to spark wider interest. █ Investment opportunities in junior miners and illiquid domestics. We like the junior miners, such as Sunkar Resources and BMB Munai, which have tremendous growth potential, as well as overlooked domestic plays, such as Kazakh Telecom, Steppe Cement, Chagala and CenterCredit Bank. Among the liquid stocks, we recommend Kazakhmys above all. █ Risks. The greatest risk remains the oil price, and the market at present, like Russia, is highly dependent on oil. Otherwise, Kazakhstan faces singleman risk from its president, the longterm pressure of its geopolitical location, and the threat of instability from the south.
Transcript
In accordance with US SEC Regulation AC, important US regulatory disclosures and analyst certification can be found at http://www.troika.ru/eng/research/disclosure.wbp.
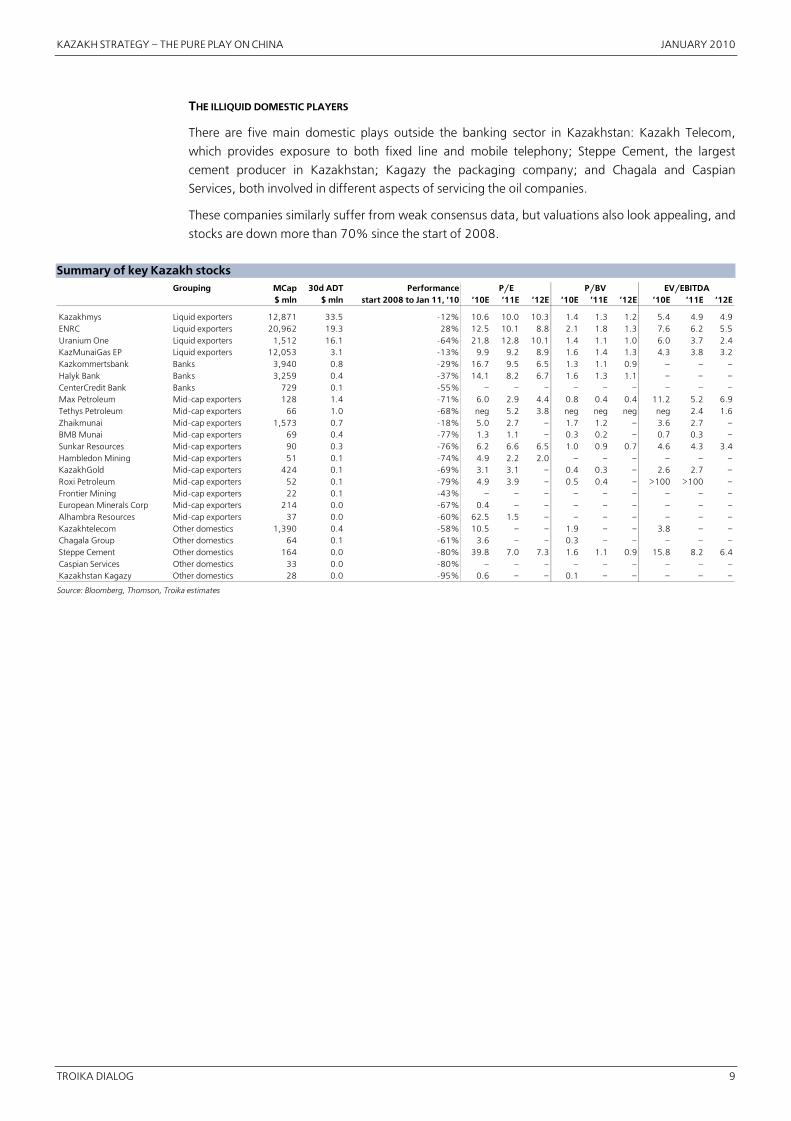
Performance has varied significantly across the four groupings that we identified. In a nutshell, the
more liquid, well�known names have recovered, but the illiquid, less�traded stocks that are little
held by foreigners have not. We believe that this has opened up an opportunity.
█ The major Kazakh exporters have moved more or less in line with their global peers, albeit
with more extreme troughs, as investors fretted about the country’s macroeconomic
position. However, by the start of 2010, they had nearly returned to the levels at the start
of 2008, having seen a huge rally during the course of 2009.
█ The banks that have avoided bankruptcy are down nearly 40% since the start of 2008, and
average daily trading here has reduced to a spectacular degree.
█ The junior miners are down 60% from start�2008 levels.
█ The other domestics have been nearly forgotten by the market and are down 70% since the
start of 2008.
KAZAKH STRATEGY – THE PURE PLAY ON CHINA JANUARY 2010
TROIKA DIALOG 11
Performance of key groups in Kazakhstan
0%
30%
60%
90%
120%
150%
180%
Jan ’08 Jul ’08 Jan ’09 Jul ’09 Jan ’10
Liquid exporters BanksMid�cap exporters Other domestics
Source: Bloomberg, Troika estimates
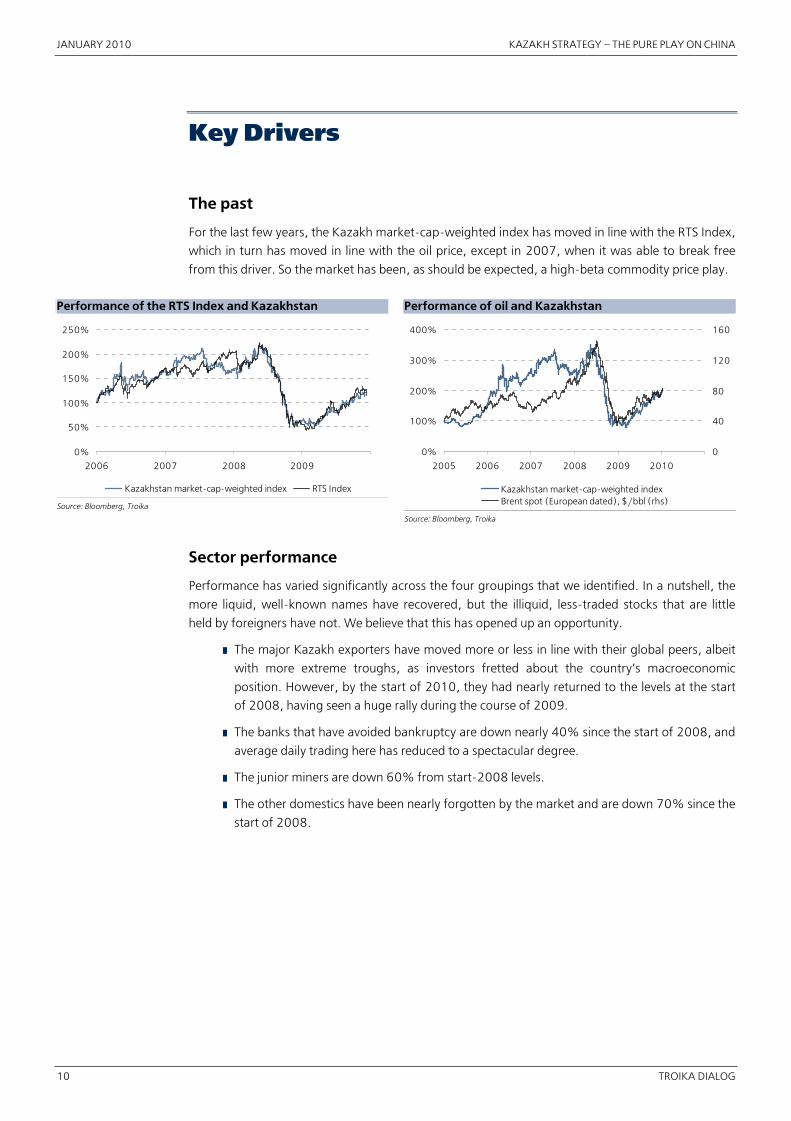
The future
While Kazakhstan will no doubt continue to track the RTS Index and the oil price in the short term,
we believe that there are some significant drivers that should enable it to move independently in the
coming years.
█ Volume growth. Kazakhstan is set to double oil production over the next decade, and
increase it significantly for a series of other commodities. This should provide strong
macroeconomic underpinning and a foundation for growth.
█ China. Kazakhstan is very clearly linked to China, and we see the opportunity for cooperation
to increase significantly over the next few years. On the one hand, this means more cheap
Chinese capital, more Chinese off�take agreements, outright purchases of listed companies by
Chinese investors, and greater volume growth. On the other hand, it may also mean listings of
Kazakh stocks in Hong Kong, and an identification of Kazakhstan as part of the Asian growth
story. This would encourage a re�rating of the market, as Asia is the most expensive part of
global markets at present.
█ Investor focus of the elite. Kazakhstan has a relatively investor�friendly environment (for
a commodity producer) and is slowly moving up the various global ranking tables for ease
of doing business, transparency and so on.
█ Discovery of the mid�tier. The Kazakh junior miners and domestics, as we have seen
above, are little owned or covered, illiquid, apparently cheap and down 70% since the start
of 2008. Greater foreign interest in the sector is likely to drive up prices.
We expect significant positive news flow in 2010 to reinforce these themes. Oil and gas pipelines to
China will start to pump significant volumes for the first time in 2010, additional deals with China
are likely to be concluded, we may see the first listing of stocks in Hong Kong, and we expect the
bad news flow resulting from the banking and property bubble to increasingly fade.
Top Picks
SECTORS
Of the four groups of sectors we identify above, we prefer the less liquid companies, as these have
suffered the most, have attractive valuations, and are likely to benefit from greater liquidity as new
funds find their way back to the market. While we do not yet cover all of these companies, we see
interesting opportunities from a top�down perspective in the following.
JANUARY 2010 KAZAKH STRATEGY – THE PURE PLAY ON CHINA
12 TROIKA DIALOG
█ Junior miners, such as Sunkar Resources, BMB Munai and Max Petroleum. Valuations
are down some 60% on 2008 levels, and some companies are trading at below book value
and less than 10 times earnings. Moreover, minimal value is currently ascribed to their
growth potential, and their capacity to purchase and develop relatively cheap resources in
one of the world’s great growth environments. Many companies also have the potential to
sell out to strategic investors in Russia or China (or indeed a number of other countries, like
India or Canada), or to obtain development financing from Chinese buyers of raw materials.
█ Illiquid domestics like Kazakh Telecom, Chagala Group, CenterCredit Bank and Steppe Cement. As a group, these companies are down 70% from their start�2008 levels
and also trade at low valuations. Moreover, they are likely to benefit from the mild currency
appreciation we expect to accompany the recent rise in the oil price, and they should also
benefit from the return of GDP growth and the normalization of the banking sector.
STOCKS
Among the liquid stocks that we cover, we prefer the following.
█ Kazakhmys. At 5.4 times 2010E EBITDA, Kazakhmys is trading at a significant discount to
global mining peers. Moreover, we posit that the company not only represents a play on
copper prices, but is also due for a re�rate, as the management is conducting a
much�awaited streamlining of its convoluted asset base. Kazakhmys has already agreed to
sell on 50% of its power assets to the state, and is signing an agreement to borrow up to
$2.7 bln from China to fund its major growth projects. Looking forward, we believe that the
market ascribes little value to the development of the Boschekul and Aktogay copper mines,
which is now possible thanks to the Chinese money. In the future, we consider it likely that
the company will sell its 26% stake in ENRC, continuing its reinvention as a much more
focused player on the copper market.
█ Halyk bank. At 1.6 times 2010E P/BV, Halyk Bank is trading at around a 20% discount to its
GEM peers, which is a relatively high price for a company operating in a country where banking
sector NPLs are running at over 35%, so our recommendation is not very strident. However, the
bank has always been the exception in this industry, with NPLs of 20% today that we believe
will peak at 24�25%. Moreover, the bank was and is well funded from domestic sources, with a
loan/deposit ratio of only 101% at present, the best among the major banks. As the economy
starts to grow again, and new, high�quality businesses return to expansion, we believe that
investors should focus on the fact that there is still potential growth when the net loans/GDP of
the banks is only 34%. Halyk Bank is in a good position to pick up some of this growth, and we
forecast loan growth of 13% in 2010, above the market average.
█ Uranium One. While Uranium One is not under our coverage at present, it is the cheapest
of the liquid Kazakh companies relative to global peers, trading at a more than 50%
discount to Canadian comparable Cameco at a consensus 2011E EV/EBITDA of 3.7. The
stock remains the best way to get exposure to Kazakhstan’s large uranium assets, and one
of the few ways to play the story globally. While international assets are mediocre at best,
the core Kazakh assets are arguably among the best in the world, with a solid growth
pipeline in the medium term. We believe that the investment in the company by the Russian
state in the form of ARMZ should negate any perceived political risks of its Kazakh asset,
leading to a gradual re�rate of the stock.
Among the illiquid stocks, we favor two in particular.
█ Steppe Cement. At a normalized 2012E�13E EV/EBITDA of 6.0, Steppe Cement is trading
at a roughly 15% discount to its EM peers. The company is the most cost efficient in
Kazakhstan, with a domestic cement market share of some 30%. Production capacity is
KAZAKH STRATEGY – THE PURE PLAY ON CHINA JANUARY 2010
TROIKA DIALOG 13
expected to double from current levels of 1.6 mln tpy to 3 mln tpy, which makes it an
exciting growth story. Although bank lending to the real estate sector is still weak,
residential construction makes up only 25% of cement demand, and we see sustained
demand for cement from major infrastructure projects and the expansion of raw material
production capacity. With population concentration increasing in the main cities, housing
and infrastructure needs are still very significant. That said, we expect the fast uptick in
demand for cement to resume in the medium term rather than in 2010.
█ Sunkar Resources. A pure developer of the third largest phosphate deposit in the FSU,
Sunkar Resources has yet to generate any cash. Located in proximity to feedstock,
infrastructure and Russia, the project is set to become a low�cost producer of diammonium
phosphate (DAP) – the generic fertilizer widely used in agriculture. The company requires
$500�700 mln to build a processing plant, which would have the capacity to produce
1.7 mln tonnes of DAP. At current prices, Sunkar Resources believes that this would
generate a profit of $100�200/tonne, implying a very rapid payback period and a very
significant NPV for the project, many times the size of their current market cap. The
company is using its IPO proceeds to conduct a bankable feasibility study; the results, when
released later in 2010, will take the project to the next level, which could range from raising
capex for the project on the market, forming a JV with Russian or Chinese companies, or a
sale to a strategic investor.
JANUARY 2010 KAZAKH STRATEGY – THE PURE PLAY ON CHINA
14 TROIKA DIALOG
The Tenge
At end 2009, the government altered the range in which the Kazakh currency is allowed to move
against the greenback from KZT145�154/$1 to KZT127�165/$1.
We look at the valuation of the tenge from a number of different angles. While PPP relative to other
EM currencies implies that it is not that cheap, other indicators imply that it is. In REER terms, the
tenge is down 12% against the ruble since the start of the crisis, and we estimate that the
breakeven level for the current account and fiscal balances is in the $60�70/bbl range.
Our conclusion is that the valuation of the tenge, like the ruble, is a function of the oil price. An oil
price of $80/bbl implies a tenge rate of under KZT140/$1; as the current rate is closer to
KZT150/$1, we believe that there will be appreciation pressures at this oil price.
Relative to the oil price
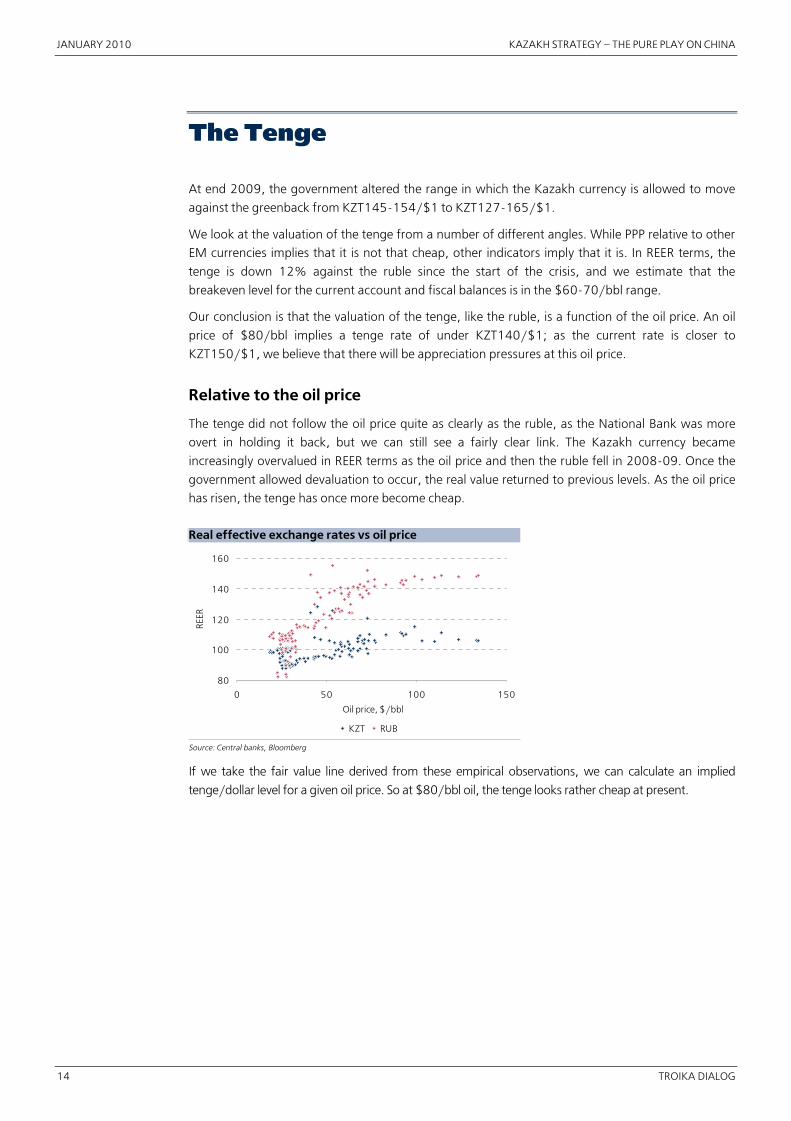
The tenge did not follow the oil price quite as clearly as the ruble, as the National Bank was more
overt in holding it back, but we can still see a fairly clear link. The Kazakh currency became
increasingly overvalued in REER terms as the oil price and then the ruble fell in 2008�09. Once the
government allowed devaluation to occur, the real value returned to previous levels. As the oil price
has risen, the tenge has once more become cheap.
Real effective exchange rates vs oil price
80
100
120
140
160
0 50 100 150
Oil price, $/bbl
REE
R
KZT RUB
Source: Central banks, Bloomberg
If we take the fair value line derived from these empirical observations, we can calculate an implied
tenge/dollar level for a given oil price. So at $80/bbl oil, the tenge looks rather cheap at present.
KAZAKH STRATEGY – THE PURE PLAY ON CHINA JANUARY 2010
TROIKA DIALOG 15
Implied fair value of tenge at given oil prices
130
135
140
145
150
155
160
40 50 60 70 80 90 100
Oil price, $/bbl
KZT
/USD
Source: Troika estimates
Real effective exchange rate
The tenge tracked up the ruble and the oil price in the period after 2002 in terms of REER, and
briefly traded expensive to the ruble when that currency fell with the oil price and the tenge did not.
However, when the tenge devaluation took place in early 2009, the currency once more started to
look cheap, and this impression has been reinforced, as its level has been held back even when the
oil price bounced and the ruble started to follow it. The Kazakh currency’s REER is therefore now at
the same level as it was in 2005, and we believe that it is likely to trade higher now that the
government has widened the trading band.
Real effective exchange rates
90%
100%
110%
120%
130%
140%
150%
2003 2004 2005 2006 2007 2008 2009
KZT RUB
Source: Central banks
Current account breakeven
Kazakhstan runs a large trade surplus (mainly raw material exports), which is balanced by a services
deficit (mainly oil transportation costs) and relatively high interest payments on foreign debt. For
example, the country ran a small current account surplus in 3Q09 when the oil price averaged $71/bbl.
JANUARY 2010 KAZAKH STRATEGY – THE PURE PLAY ON CHINA
16 TROIKA DIALOG
Current account decomposition, $ bln
�6
�4
�2
0
2
4
6
1Q09 2Q09 3Q09
Trade balance goods Trade balance services Interest payments Other
Source: National Bank
The country exports around 1.3 mln bpd of oil, which implies an increase in the current account
balance of around $5 bln, or 4% of GDP for every $10/bbl increase in the oil price. Given that a
higher oil price also leads to greater imports, we assume that the relationship between the oil price
and the current account is around 3% of GDP for every $10/bbl. The government expects a current
account deficit in 2010 of 2.8% of GDP, along with an oil price of $50/bbl. This implies that the
current account would be breakeven in 2010 at around $60/bbl.
Valuation versus PPP relative
Relative to other EM currencies, the tenge does not look especially attractive. It trades at 60% of its
PPP fair value, a little expensive to the fair value line for the asset class as a whole, and actually a
little more expensive than Russia given its lower level of GDP per capita.
KAZAKH STRATEGY – THE PURE PLAY ON CHINA JANUARY 2010
TROIKA DIALOG 17
Natural Resources
Kazakhstan is among the world’s most resource�rich countries, with significant reserves of oil, coal,
iron ore, uranium, chrome and zinc, as well as a host of other minerals. If we apply fairly
conservative pricing ($70/bbl of oil, $50/tonne of coal and $200 per 1,000 m3 of gas, for
example) to these raw materials, Kazakhstan has a natural resources endowment of over $5 trln,
and around 3% of the world’s minerals.
Kazakh natural resources
Unit Reserves Share of globalreserves
Global rankingfor reserves
Oil bln bbl 40 3.2% 9Coal mln tonnes 34,000 3.4% 8Gas bln m3 1,800 1.0% 10Iron ore mln tonnes 7,000 4.0% 13Uranium mln tonnes 1 15.0% 2Copper mln tonnes 20 2.0% 12Chrome ore mln tonnes 320 4.0% 2Zinc mln tonnes 35 8.0% 4Gold tonnes 1,800 2.0% 15Manganese mln tonnes 360 7.0% 3Bauxite mln tonnes 660 2.0% 10
Source: Kazakhmys, USGS, BP, NWA, World Bank, Uranium One, ENRC
Moreover, Kazakhstan has a relatively small population, with its 16 mln people making up just
0.2% of the global total. This makes Kazakhstan one of the world’s most wealthy countries in terms
of its natural resources endowment, which is worth over $300,000 per capita. This is twice the level
of Russia, more than Australia, and half the level of Saudi Arabia.
Natural resource assets per capita, $ ’000
0
200
400
600
800
Sau
diA
rabi
a
Kaz
akhs
tan
Au
stra
lia
Rus
sia
Sou
thA
fric
a
Can
ada
Ch
ile US
Ukr
ain
e
Bra
zil
Indo
nesi
a
Ch
ina
Source: Kazakhmys, USGS, BP, NWA, World Bank, Uranium One, ENRC, IMF, Troika estimates
Oil
ASSETS
According to BP, Kazakhstan has oil reserves of 40 bln bbl, though the government believes that
this number is likely to be revised upward, since Kazakhstan is at a fairly early stage of its oil
exploitation. Reserves are half the amount of Russia, but Kazakhstan’s population is one tenth the
size. Oil reserves per capita are therefore five times as high as in Russia, and higher than in Iran.
JANUARY 2010 KAZAKH STRATEGY – THE PURE PLAY ON CHINA
18 TROIKA DIALOG
Oil reserves per capita, ’000 bbl
0
2
4
6
8
10
12
Sau
diA
rabi
a
Iraq
Kaz
akhs
tan
Iran
Aze
rbai
jan
Rus
sia
Mal
aysi
a
Source: BP, IMF
Moreover, the oil is fairly underexploited, given limited oil exploitation under the Soviet Union; in
1990, Kazakhstan produced 0.5 mln bpd at a time when Russia was producing 9.0 mln bpd. While
Russia’s oil production is now only a little above its 1990 level, that of Kazakhstan has tripled. And yet,
the reserves/production ratio of Kazakhstan now stands at 73 years, versus 22 years for Russia.
Reserves are concentrated in three main deposits near the Caspian Sea: Kashagan (located in the
Caspian, and which has around half the total reserves), Tengiz (beside the Caspian) and
Karachaganak (near the Russian border). Exploitation of the reserves is notoriously difficult, as they
are both deep and sour.
PRODUCTION
Most oil at present comes from Tengiz and Karachaganak, with major contributions coming from a
series of smaller areas.
Kazakhstan intends to double oil production over the next decade. Forecasts vary somewhat
between CERA and the Kazakh government, but even the lowest estimate would still imply a huge
increase in production.
Kazakh crude production, mln bpd
0
1
2
3
4
19
90
19
92
19
94
19
96
19
98
20
00
20
02
20
04
20
06
20
08
20
10
E
20
12
E
20
14
E
20
16
E
20
18
E
20
20
E
Actual CERA, high CERA, midCERA, low Government
Source: CERA, Kazakh government
The main drivers of oil production growth will be Tengiz and Karachaganak until 2014, when
Kashagan takes over as the growth driver.
KAZAKH STRATEGY – THE PURE PLAY ON CHINA JANUARY 2010
TROIKA DIALOG 19
Kazakh oil production by region, mln bpd
0
1
2
3
4
19
90
19
92
19
94
19
96
19
98
20
00
20
02
20
04
20
06
20
08
20
10
E
20
12
E
20
14
E
20
16
E
20
18
E
20
20
E
West Kazakhstan Aktobe TurgayOther Tengiz KarachaganakKashagan New offshore
Source: CERA
This growth again makes Kazakhstan very unusual in global terms. According to Wood Mackenzie, the country is likely to be the world’s second largest non�OPEC contributor to oil production over the course of the next decade.
Kazakhstan will therefore rank among the world’s highest oil production per capita by 2020, producing three times as much as Russia.
Annual oil production, bbl per capita
0
30
60
90
120
150
180
Sau
diA
rabi
a
Kaz
akh
stan
20
20
E
Aze
rbai
jan
Kaz
akh
stan
20
10
E
Rus
sia
Iraq
Iran
Source: BP, CERA, IMF, Troika estimates
Production is carried out by a bewildering array of JVs, which in turn are owned by a network of holding companies, such as KazMunaiGas EP and PetroKazakhstan. While Chinese companies have a stake in a large number of the smaller JVs and an 11% stake in KazMunaiGas EP, the largest production assets are under the ownership of KazMunaiGas Holding and mainly Western partners. But this is changing, as the need for capital allows Chinese companies to take ever larger stakes and obliges KazMunaiGas Holding to sell down its assets to KazMunaiGas EP.
EXPORTS
Since Kazakhstan uses only around 0.2 mln bpd of oil, the vast majority of its oil will be available for export. It will thus rise to join the ranks of the world’s top 10 oil exporters over the next few years.
TRANSPORT
At present, 80% of Kazakh oil goes north and west through Russia, mainly through the Caspian Pipeline Consortium (CPC) but also by rail and pipeline to Samara. However, Kazakhstan is expanding export routes to China and the West, which are helping reduce its dependency on Russia
JANUARY 2010 KAZAKH STRATEGY – THE PURE PLAY ON CHINA
20 TROIKA DIALOG
and should thus enable the country to increase its leverage in price negotiations. The key areas of export capacity expansion are as follows.
█ The pipeline to China – the Kazakhstan�China Pipeline (KCP). The link from Central Kazakhstan to China was completed in 2007, and Kazakhstan has been sending Kazakh and Russian oil to Alashankou in China from Central Kazakhstan since then. In 2009, the country completed the final section of this pipeline, linking Western Kazakhstan and the Caspian (at Atyrau) to the rest of the pipeline (at Kumkol) and thus to China. Export capacity is 0.2 mln bpd at present, but it is slated to increase to 0.4 mln bpd during 2010, and then to 0.6 mln bpd by the end of the decade. Given the speed with which China constructs pipelines, the decision to expand thereafter appears to be more of a political issue than a logistical one.
█ The pipeline to the West – the Kazakh�Caspian Transportation System (KCTS). Oil is currently being sent across the Caspian to join the Baku�Tblisi�Ceyhan (BTC) pipeline to Turkey’s Mediterranean coast, but the amounts are limited at around 0.2 mln bpd. The plan is to construct a pipeline from Kashagan to a new port near Aktau on the Caspian coast opposite Azerbaijan, as well as a dedicated tanker terminal and a fleet of tankers to take the oil across to Baku to be put into the BTC pipeline. Capacity is likely to be constrained by the ability of the BTC to take Kazakh oil.
█ The pipeline to Russia. The CPC runs from Kazakhstan to the northwest through Russia to the Novorossiisk port. Its current capacity is 0.5 mln bpd, and the intention is to increase this to 1 mln bpd by the end of the decade.
Kazakh export capacity, mln bpd
0
1
2
3
4
19
90
19
92
19
94
19
96
19
98
20
00
20
02
20
04
20
06
20
08
20
10
E
20
12
E
20
14
E
20
16
E
20
18
E
20
20
E
Samara pipeline Orenburg pipeline Rail to RussiaCPC China pipeline Rail to ChinaCaspian ports
Source: CERA, Troika estimates
As a result of these pipelines, the percentage of Kazakh oil going through Russia could fall to as little as half, with a quarter each going to the West and to China. Geopolitics will clearly influence the evolution of the various pipelines, but it is certainly in the interest of Kazakhstan to diversify.
KAZAKH STRATEGY – THE PURE PLAY ON CHINA JANUARY 2010
TROIKA DIALOG 21
Export capacity of Kazakh crude by destination, mln bpd
0
1
2
3
4
19
90
19
92
19
94
19
96
19
98
20
00
20
02
20
04
20
06
20
08
20
10
E
20
12
E
20
14
E
20
16
E
20
18
E
20
20
E
Russia China West
Source: CERA, Troika estimates
JAN
UA
RY
20
10
K
AZA
KH
STRA
TEGY
� THE
PUR
E PLA
Y O
N C
HIN
A
22
TR
OIK
A D
IALO
G
Kazakh pipelines and hydrocarbon reserves
RUSSIARUSSIA
CHINAUZBEKISTAN
TAJIKISTAN
KYRGYZSTAN
TURMENISTAN
Aktobe
Uralsk
Atyrau
Qostanay
Arqalyk
Petropavlovsk
Pavlodar
Karaghanda
Shymkent
Kyzylorda
Zhambyl
Almaty
Oskemen
Aktau
ASTANA
Tengiz
Karachaganak
Kashagan Kumkol
To Samara
CPC (to Novorossiisk)
Kazakhstan China Pipeline
Central Asia Gas Pipeline
Baku�Tblisi�Ceyhan
Bishkek
Baku
Tbilisi
Atasu
Omsk
Orsk
Uzen
Kenkiyak
Karachaganakgas field
Alashankou
Oil fields
Oil pipelines
Gas pipelines
Rail roads
Source: CERA, Wikipedia, Troika
KAZAKH STRATEGY – THE PURE PLAY ON CHINA JANUARY 2010
TROIKA DIALOG 23
Uranium
RESERVES
Kazakhstan has around 15% of the world’s uranium reserves, the second largest after Australia.
Split of global uranium reserves
0%
5%
10%
15%
20%
25%
Au
stra
lia
Kaz
akhs
tan
Rus
sia
Can
ada
Sou
thA
fric
a
Bra
zil
Nam
ibia
Nig
er US
Ukr
ain
e
Uzb
ekis
tan
Source: IAEA
PRODUCTION
Production has been stepped up enormously over the last few years, and this once more indicates the
potential that Kazakhstan has to increase volumes given the injection of capital and incentives.
Uranium production in Kazakhstan, kt
0
3
6
9
12
15
2004 2005 2006 2007 2008 2009 2010E
Source: IAEA, Uranium One, Troika estimates
Kazakhstan mined only 9% of the world’s uranium in 2004, but Uranium One estimates that it
mined around 25% in 2009, making it the world’s largest producer.
Split of uranium production, 2009E
0%
5%
10%
15%
20%
25%
30%
Kaz
akhs
tan
Can
ada
Au
stra
lia
Nam
ibia
Rus
sia
Nig
er
Uzb
ekis
tan
Oth
er US
Ch
ina
Sou
thA
fric
a
Source: Uranium One, WNA, Ux Consulting
JANUARY 2010 KAZAKH STRATEGY – THE PURE PLAY ON CHINA
24 TROIKA DIALOG
As with oil, production is undertaken by a very wide range of JVs between foreign partners and
Kazatomprom. Foreign operators include Uranium One (just one of many, it should be noted), the
Russian nuclear energy company ARMZ, a Japanese consortium, Cameco, and Areva. In addition,
we believe it likely that the China’s CGNPH will shortly announce a JV in Kazakhstan.
Gas
RESERVES
Kazakhstan has 1,800 bln m3 of gas reserves, according to BP, which is 1% of global reserves and
the 10th largest reserves base in the world. We expect this number to increase as Kashagan and
Tengiz are exploited further and as the lucrative gas pipeline to China comes on stream. The Kazakh
government believes that reserves are 3,000 bln m3.
PRODUCTION
Production is growing fast from a low base, more than tripling from 12 bln m3 in 2000 to 39 bln m3
in 2009, according to the Energy Ministry. Much of this is used in Kazakhstan, but with the new gas
pipeline to China, we would expect more to find its way to the East.
█ GDP growth. Both forecast GDP growth in the region of 2�3%. Given our more positive
views on Russian growth, this seems rather conservative.
█ Inflation. Both expect inflation to continue to fall from 2009 levels to the 6�8% range.
█ Fiscal balance. While there seems to be a major gap here between the IMF forecast of 1%
and the Kazakh government of –4%, it is mainly the result of different oil price assumptions,
with the Kazakh government taking a relatively conservative $50/bbl estimate for 2010. If
we take our oil price assumption of $70/bbl, this would imply fiscal breakeven.
█ Current account balance. Again, the main issue here for the large gap in the forecasts is
differing commodity prices, and if we take our assumption of $70/bbl oil, we would be
highly likely to see the current account in positive territory in 2010.
KAZAKH STRATEGY – THE PURE PLAY ON CHINA JANUARY 2010
TROIKA DIALOG 33
Appendix 1: Kazakhstan Versus Russia
We briefly compare Kazakhstan with the Russian market on a number of interesting areas so as to
better shed light on the Kazakh story. We divide the points of comparison perhaps somewhat
arbitrarily into positive and negative.
Positives
ASSETS
As we have seen, the raw materials assets per capita of Kazakhstan are twice those of Russia.
GROWTH
Unlike Russian assets, which in many cases (oil and gas above all) have been heavily exploited,
those of Kazakhstan were not. This provides tremendous growth potential (we expect oil
production to double in Kazakhstan) and a cornucopia of attractive assets for those companies
fortunate enough to be on the ground.
PROXIMITY TO CHINA
At present, those parts of Russia that are closest to China (the Far East) are growing the most
rapidly. However, given its location, the whole of Kazakhstan is a play on the continuing rise of
China. From Chinese investment capital to oil, gas, road and rail infrastructure, the impact of China
on Kazakhstan is disproportionately larger than on Russia. As we assume that China will continue to
grow, this is likely to be a positive driver for the market.
MANAGEABLE SIZE
One complaint faced by rulers of Russia through the centuries has been that it is too large to run
effectively. While Kazakhstan, the size of Western Europe, is not small, it is at least more manageable,
with a population of only 16 mln and much less administrative complexity. This has arguably meant that
the reforms put into place during the crisis in Kazakhstan could be more responsive, targeted and
accurate, and have more of an impact. This may be one reason why the fall in GDP in Kazakhstan has
been much more restrained than that in Russia.
BETTER PR
Some commentators on Russia like to argue that all the country needs is a good PR team, which would
push its stock market dramatically higher. While we do not find this argument especially convincing,
except in the short term, at least Kazakhstan has adopted a more friendly approach to foreign investors.
LESS RIVALRY WITH THE WEST
While Russia retains imperial ambitions, and the market suffers from the occasional spats with the
West that this engenders, Kazakhstan needs the West to balance its overbearing neighbors. It is
thus likely to continue trying to attract foreign capital.
DEMOGRAPHY
While Russia’s population has only just stopped falling, that of Kazakhstan continues to grow steadily.
JANUARY 2010 KAZAKH STRATEGY – THE PURE PLAY ON CHINA
34 TROIKA DIALOG
PENSION SYSTEM
The pension system is better structured in Kazakhstan. Over time, this should provide an important
source of stability for the economy and the market. The Kazakh pension system controls $12 bln, or
11% of GDP, compared with $20 bln and only 2% of GDP in Russia.
FDI
According to EBRD data, Kazakhstan saw $50 bln of FDI over 1998�2008, more than the $43 bln
that was invested in Russia. The numbers on a per capita basis are especially stark: while per capita
FDI in Russia is only $300, it is 10 times higher at $3,200 in Kazakhstan, a level comparable with
Central Europe. This reflects the deeper issue that Kazakhstan is more open to foreign capital.
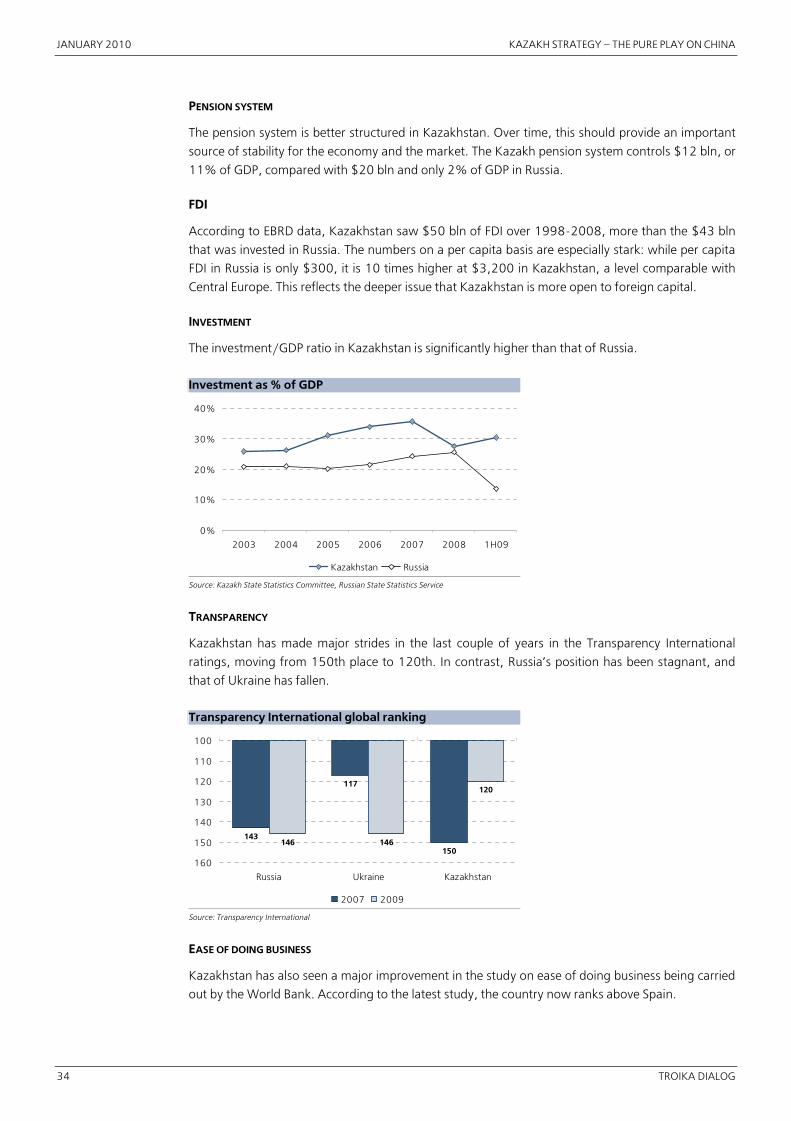
INVESTMENT
The investment/GDP ratio in Kazakhstan is significantly higher than that of Russia.
Investment as % of GDP
0%
10%
20%
30%
40%
2003 2004 2005 2006 2007 2008 1H09
Kazakhstan Russia
Source: Kazakh State Statistics Committee, Russian State Statistics Service
TRANSPARENCY
Kazakhstan has made major strides in the last couple of years in the Transparency International
ratings, moving from 150th place to 120th. In contrast, Russia’s position has been stagnant, and
that of Ukraine has fallen.
Transparency International global ranking
143
117
150146 146
120
100
110
120
130
140
150
160
Russia Ukraine Kazakhstan
2007 2009
Source: Transparency International
EASE OF DOING BUSINESS
Kazakhstan has also seen a major improvement in the study on ease of doing business being carried
out by the World Bank. According to the latest study, the country now ranks above Spain.
KAZAKH STRATEGY – THE PURE PLAY ON CHINA JANUARY 2010
TROIKA DIALOG 35
Ranking for ease of doing business, 2010
0
50
100
150
200
Ove
rall
Star
ting
abu
sine
ss
Dea
ling
wit
hco
nst
ruct
ion
per
mits
Emp
loyi
ng
wo
rker
s
Regi
ster
ing
pro
per
ty
Get
ting
cred
it
Pro
tect
ing
inve
sto
rs
Payi
ng
taxe
s
Trad
ing
acro
ssbo
rder
s
Enfo
rcin
gco
ntr
acts
Clo
sing
abu
sin
ess
Kazakhstan Russia
Source: World Bank
SUBSOIL LEGISLATION
Legislation on subsoil assets in Kazakhstan has been more investor�friendly than in Russia. It is possible
for investors to own assets, and Kazakhstan does not have the same punitive environment for strategic
(large) assets as Russia. As a result of this, Kazakhstan has been able to attract massive amounts of
FDI, significant foreign JVs, and build up a series of mid�cap companies that are likely to be able to find
additional resources and exploit them more rapidly, as experience in the US has shown.
Negatives
DEBT
Relative to GDP, foreign debt, banking sector loans and corporate debt levels in Kazakhstan are
significantly higher than in Russia. This is likely to impede future growth for some years.
GDP PER CAPITA
Kazakhstan is a little behind Russia, with 2009 GDP per capita at $6,900 (versus $9,400). But it
should be pointed out that Kazakhstan has been a tremendous success story when compared with
the rest of Central Asia or Ukraine, with per capita wealth levels a multiple of its neighbors.
URBANIZATION
At only 53%, urbanization is low compared with Russia at 80%. Moreover, some 30% of the
Kazakh population works in agriculture.
LIQUIDITY
Despite building up a pension system, Kazakhstan has not been successful at building up a domestic
stock market, and liquidity is low outside of the top few stocks. During the boom times, speculative
money was channeled into housing, and daily trading domestically is still under $10 mln, while in
Russia it is over $1 bln. We see two main reasons for this. The first is that Russia has the necessary
critical size to establish itself as a center in its own right. The second is that Kazakhstan has listed its
principal stocks abroad. Moreover, the country has not been successful at building up significant
foreign interest in stocks outside of the top few. Foreigners were first enticed to the market at a rather
unfortunate time, just as the banking sector was spinning out of control and shortly before the global
crisis, and the market has not had time to build up a deeper investor base. Given the attractions of the
story and the increasing investor interest in it, we believe that this might be about to change.
JANUARY 2010 KAZAKH STRATEGY – THE PURE PLAY ON CHINA
36 TROIKA DIALOG
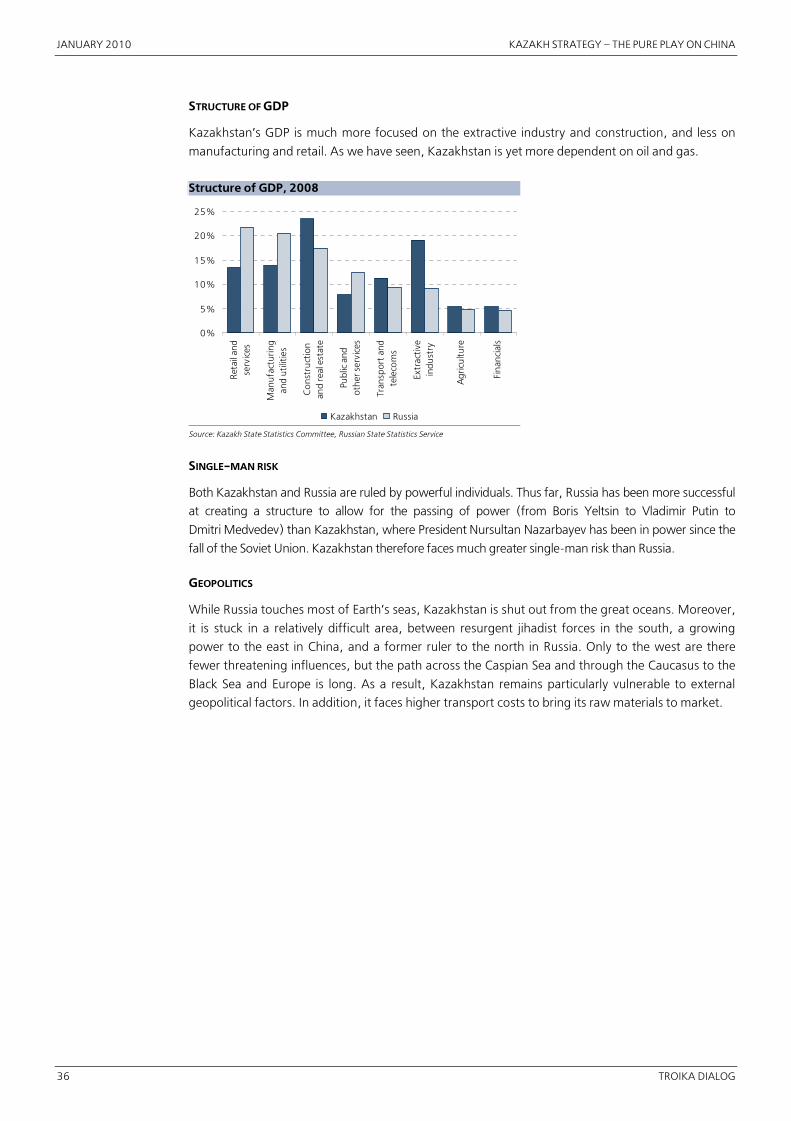
STRUCTURE OF GDP
Kazakhstan’s GDP is much more focused on the extractive industry and construction, and less on
manufacturing and retail. As we have seen, Kazakhstan is yet more dependent on oil and gas.
Structure of GDP, 2008
0%
5%
10%
15%
20%
25%
Ret
ail a
ndse
rvic
es
Man
ufa
ctur
ing
and
uti
litie
s
Co
nstr
uct
ion
and
real
est
ate
Publ
ic a
ndot
her
ser
vice
s
Tran
spor
t an
dte
leco
ms
Extr
activ
ein
dust
ry
Ag
ricu
lture
Fin
anci
als
Kazakhstan Russia
Source: Kazakh State Statistics Committee, Russian State Statistics Service
SINGLE�MAN RISK
Both Kazakhstan and Russia are ruled by powerful individuals. Thus far, Russia has been more successful
at creating a structure to allow for the passing of power (from Boris Yeltsin to Vladimir Putin to
Dmitri Medvedev) than Kazakhstan, where President Nursultan Nazarbayev has been in power since the
fall of the Soviet Union. Kazakhstan therefore faces much greater single�man risk than Russia.
GEOPOLITICS
While Russia touches most of Earth’s seas, Kazakhstan is shut out from the great oceans. Moreover,
it is stuck in a relatively difficult area, between resurgent jihadist forces in the south, a growing
power to the east in China, and a former ruler to the north in Russia. Only to the west are there
fewer threatening influences, but the path across the Caspian Sea and through the Caucasus to the
Black Sea and Europe is long. As a result, Kazakhstan remains particularly vulnerable to external
geopolitical factors. In addition, it faces higher transport costs to bring its raw materials to market.
KAZAKH STRATEGY – THE PURE PLAY ON CHINA JANUARY 2010
TROIKA DIALOG 37
Appendix 2: Links to China
Links between China and Kazakhstan have been building for some time, but it was the financial
crisis that gave China its opportunity to expand dramatically into Kazakhstan, as it was able to
rapidly replace Western capital and take control over key assets. Meanwhile, the relentless build�out
of infrastructure between the two countries continues apace.
Oil
In 2007, Kazakhstan completed the eastern half of its pipeline to China and started to send oil
across the border, sourced mainly from Southern Russia. However, it was only in 2009 that the
pipeline to the Caspian side of Kazakhstan was completed. This will lead to a dramatic increase in oil
exports to China, rising to at least 0.4 mln bpd and probably beyond this level.
Gas
The Turkmenistan�China gas pipeline, passing through Uzbekistan and Kazakhstan, was opened in
December 2009 by President Hu and will transport 13 bln m3 of gas in 2010, with the capacity to
rise to 30�40 bln m3 per year. Although Kazakhstan produces gas mainly for its own purposes, it
has the reserves and the potential to export to China now that the pipeline is in place. The speed at
which the pipeline was built gives some idea of the potential for China to transform the region’s
dynamics. The agreement to build it was signed in 2007, ground was broken that same month, and
fewer than three years later, a massive pipeline had been commissioned.
Rail
There is a new railroad being built to link Almaty with China, which will result in an increase of cargo
from the south.
Road
One of Kazakhstan’s most important projects at present is the construction of a road from
Western China to Western Europe. This will stretch for 3,000 km through Kazakhstan, and it has
secured $3 bln in funding from the World Bank and other international investors.
Trade
Kazakhstan exports raw materials to China and imports machinery. China is now Kazakhstan’s largest
export destination (13.5% of exports in 2008) and second largest import provider (24.0%).
Deals
While many deals have been made over the last few years, China was the power that came to the
aid of Kazakhstan during the crisis with some very significant financing.
JANUARY 2010 KAZAKH STRATEGY – THE PURE PLAY ON CHINA
38 TROIKA DIALOG
Significant agreements between China and Kazakhstan
Area Summary
1992 Politics China and Kazakhstan sign a treaty to agree border issues.Feb ’97 KCP China signs framework agreement for pipeline and long�term oil supply. Pipeline built by
KazMunaiGas and CNPC1997 Uzen China buys controlling stake in Uzen oil field.2005 Politics China and Kazakhstan sign a strategic partnership.Oct ’05 Petrokazakhstan China takes control of PetroKazakhstan.Apr ’06 Central Asia Gas Pipeline China signs framework agreement for pipeline and long�term gas supply.Dec ’06 Nations Energy CITIC buys Nations Energy, developer of Karazhanbas field.Jun ’05 Transport Plan for new railroad to China announced.Jun ’05 Transport Funds allocated for construction of the China�Europe road.Apr ’10 Capital China gives $5 bln loan to Samruk�Kazyna.Apr ’10 MangistauMunaiGas $5 bln allocated by KazMunaiGas and CNPC for purchase of MangistauMunaiGas.3Q09 Oil Completion of the pipeline from the Caspian to Central Kazakhstan and thus to China.Oct ’09 KazMunaiGas China Investment Corp (CIC) announces it has taken an 11% stake in KazMunaiGas.Dec ’09 Central Asia Gas Pipeline Pipeline starts to pump gas from Turkmenistan through Kazakhstan to China and is formally opened on
December 12.Dec ’10 Kazakhmys China Development Bank agrees to provide $2.7 bln in financing; $2 bln for Boschekul.Dec ’10 Kazakh Telecom China Development Bank agrees to provide $0.3 bln in financing.Dec ’10 Petrochemicals China Exim Bank agrees to provide financing for part of a $6 bln petrochemical complex.
Source: Bloomberg, Reuters, Kazakh government
Potential new deals include the following.
█ China Guangdong nuclear power is in negotiations for a uranium production JV, we believe.
█ ENRC is in negotiations to purchase assets with Chinese money.
█ Sunkar Resources is a potential recipient of Chinese capital for construction of a processing
plant, with an associated off�take agreement.
KAZAKH STRATEGY – THE PURE PLAY ON CHINA JANUARY 2010
TROIKA DIALOG 39
Appendix 3: Risks
The following are the key risks faced by investors in Kazakhstan.
█ Oil price. Kazakhstan still depends heavily on the oil price and the risk trade that this has
become.
█ Debt. Debt levels are still very high and will continue to put pressure on the story.
█ Single�man risk. As a country that has been governed by a single ruler since the end of the
Soviet Union, Kazakhstan is clearly subject to single�man risk.
█ Geopolitics. The country’s position is a delicate balancing act between resurgent China and
Russia seeking to re�impose its influence on the region. Should this balance get out of hand,
investors could be troubled.
█ Fundamentalism. The centers of al�Qaeda in Afghanistan and Pakistan are not far to the
south, and Kazakhstan faces the threat of spreading fundamentalism as a result.
Senior Management
Chairman of Board of Directors and CEO, Troika Dialog Group Ruben Vardanian
Chief Business Officer Jacques Der Megreditchian
Chief Economist, Managing Director Evgeny Gavrilenkov
Research Department +7 (495) 258 0511
Head of Research Paolo Zaniboni +7 (495) 787 2381
Strategy
Chief Strategist Kingsmill Bond, CFA +44 (207) 583 3257
Strategist Andrey Kuznetsov +7 (495) 933 9844
Oil and Gas
Senior Analyst Oleg Maximov +7 (495) 933 9830
Analyst Valery Nesterov +7 (495) 933 9832
Analyst Alex Fak +7 (495) 933 9829
Utilities
Senior Analyst Alexander Kotikov +7 (495) 933 9841
Analyst Igor Vasilyev +7 (495) 933 9842
Junior Analyst Andrey Trufanov +7 (495) 258 0511
Telecoms, Media and IT
Senior Analyst Evgeny Golossnoy +7 (495) 933 9834
Analyst Anna Lepetukhina +7 (495) 933 9835
Metals and Mining
Senior Analyst Sergey Donskoy, CFA +7 (495) 933 9840
Senior Analyst Mikhail Stiskin +7 (495) 933 9839
Analyst Irina Lapshina +7 (495) 933 9852
Manufacturing
Analyst Mikhail Ganelin +7 (495) 933 9851
Financials
Senior Analyst Andrew Keeley +7 (495) 933 9845
Analyst Olga Veselova +7 (495) 933 9846
Consumer
Senior Analyst Victoria Sokolova +7 (495) 933 9836
This research report is prepared by TROIKA DIALOG or its affiliate named herein and provides general information only. Neither the information nor any opinion expressed constitutes arecommendation, an offer or an invitation to make an offer, to buy or sell any securities or other investment or any options, futures or derivatives related to such securities or investments. It is notintended to provide personal investment advice and it does not take into account the specific investment objectives, financial situation and the particular needs of any specific person who may receive this report. Investors should seek financial advice regarding the appropriateness of investing in any securities, other investment or investment strategies discussed or recommended in this report and should understand that statements regarding future prospects may not be realized.
Investors should note that income from such securities or other investments, if any, may fluctuate and that price or value of such securities and investments may rise or fall. Accordingly, investors may receive back less than originally invested. Past performance is not necessarily a guide to future performance.
Any information relating to the tax status of financial instruments discussed herein is not intended to provide tax advice or to be used by anyone to provide tax advice. Investors are urged to seek taxadvice based on their particular circumstances from an independent tax professional.
Foreign currency rates of exchange may adversely affect the value, price or income of any security or related investment mentioned in this report. In addition, investors in securities such as ADRs orGDRs, whose values are influenced by the currency of the underlying security, effectively assume currency risk.
The information contained herein has been obtained from, and any opinions herein are based upon, sources believed to be reliable, but no representation is made that it is accurate or complete and itshould not be relied upon as such. All such information and opinions are subject to change without notice.
From time to time, TROIKA DIALOG or its affiliates or the principals or employees of its affiliates may have or have had positions or derivative positions in the securities or other instruments referred toherein or make or have made a market or otherwise act or have acted as principal in transactions in any of these securities or instruments or may provide or have provided investment banking orconsulting services to or serve or have served as a director or a supervisory board member of a company being reported on herein.
TROIKA DIALOG maintains strict internal policies, which are designed to manage any actual or potential conflicts of interest from harming the interests of investors.
Further information on the securities referred to herein may be obtained from TROIKA DIALOG upon request.
This report may not be reproduced, copied nor extracts taken from it, without the express written consent of TROIKA DIALOG.
For residents of the United States: This research report is being distributed in the United States by TROIKA DIALOG USA, INC., which accepts responsibility for the contents hereof. Any U.S. personreceiving this report who wishes to effect transactions in any securities referred to herein should contact TROIKA DIALOG USA, INC., not its affiliate. Further information on the securities referred to herein may be obtained from TROIKA DIALOG USA, INC. upon request.
For residents of the United Kingdom and rest of Europe: Except as may be otherwise specified herein, this research report is communicated to persons who are qualified as eligible counterparties or professional clients (as defined in the FSA Rules) and is made available to such persons only. The information contained herein is not intended for, and should not be relied upon by, retail clients (as defined in the FSA Rules).