TOWARDS A SEMANTIC PERCEPTUAL IMAGE METRIC Troy Chinen, Johannes Ballé, Chunhui Gu, Sung Jin Hwang, Sergey Ioffe, Nick Johnston, Thomas Leung, David Minnen, Sean O’Malley, Charles Rosenberg * , George Toderici Google AI Perception Mountain View, CA 94043, USA ABSTRACT We present a full reference, perceptual image metric based on VGG-16, an artificial neural network trained on object classification. We fit the metric to a new database based on 140k unique images annotated with ground truth by human raters who received minimal instruction. The resulting met- ric shows competitive performance on TID 2013, a database widely used to assess image quality assessments methods. More interestingly, it shows strong responses to objects po- tentially carrying semantic relevance such as faces and text, which we demonstrate using a visualization technique and ab- lation experiments. In effect, the metric appears to model a higher influence of semantic context on judgments, which we observe particularly in untrained raters. As the vast major- ity of users of image processing systems are unfamiliar with Image Quality Assessment (IQA) tasks, these findings may have significant impact on real-world applications of percep- tual metrics. Index Terms— image quality, full reference, machine learning 1. INTRODUCTION IQA is a difficult task even for human raters, as it requires mapping an extremely large space of possible images and dis- tortions onto a single number. Raters tend to show signifi- cant variability in their responses, in particular to IQA tasks where the distortions are well above the human discrimination threshold. For instance, raters may differ in how they weight the severity of different types of distortions (such as distor- tions in the luminance vs. chrominance channels), or in how they spatially integrate the presence of several distorted re- gions in an image. Instruction and training is commonly used to control variability. For instance, raters may be discouraged from letting image semantics influence their decisions, or the first N ratings may be discarded to allow them to adapt to the task. Trained raters typically develop a stable integration scheme for the types of distortions they are presented with, * Work done while at Google; now at Pinterest, Inc., San Francisco, CA 94107, USA Fig. 1. Perceptual metrics can be trained to respect high-level semantic information such as faces. (a) the distorted image, (b) its perceived distortion under a contrast-based metric and, (c) the same for the proposed perceptual metric, indicating that distortions to a face are more objectionable than distor- tions to edges. Higher green intensity means higher predicted distortion. and may even adapt to individual distortions or test images – they “know where to look”. Although this may help to reduce variability, it may not help to accurately represent perceptual judgments made by users of image processing systems “in the wild”. We have observed that minimally instructed or trained raters tend to focus on semantically relevant objects in the scene. This implies that the performance of IQA models in real- world scenarios could be enhanced by giving them access to higher-order image features. Many existing image metrics such as SSIM [1], MS-SSIM [2], PSNR-HVS [3], PSNR- HVS-M [4], FSIM [5], Butteraugli [6], HaarPSI [7] are de- signed to model specific documented aspects of the human visual system (HVS), such as contrast or color sensitivity, but are unable to access features that would be able to dis- cern object classes, for instance. One avenue for exploring this idea is to use artificial neural networks (ANNs) that have been trained for object classification tasks. It has been shown that their feature spaces can rival that of the inferior temporal cortex in primates [8], and researchers have used them suc- cessfully for image processing applications like texture syn- thesis [9] and super resolution [10]. In this paper, we present preliminary results exploring the use of pre-trained ANNs for modeling quality judgments. We c 2018 IEEE 1 ICIP 2018 arXiv:1808.00447v1 [cs.CV] 1 Aug 2018
Transcript
TOWARDS A SEMANTIC PERCEPTUAL IMAGE METRIC
Troy Chinen, Johannes Ballé, Chunhui Gu, Sung Jin Hwang, Sergey Ioffe, Nick Johnston,Thomas Leung, David Minnen, Sean O’Malley, Charles Rosenberg∗, George Toderici
Google AI PerceptionMountain View, CA 94043, USA
ABSTRACT
We present a full reference, perceptual image metric basedon VGG-16, an artificial neural network trained on objectclassification. We fit the metric to a new database based on140k unique images annotated with ground truth by humanraters who received minimal instruction. The resulting met-ric shows competitive performance on TID 2013, a databasewidely used to assess image quality assessments methods.More interestingly, it shows strong responses to objects po-tentially carrying semantic relevance such as faces and text,which we demonstrate using a visualization technique and ab-lation experiments. In effect, the metric appears to model ahigher influence of semantic context on judgments, which weobserve particularly in untrained raters. As the vast major-ity of users of image processing systems are unfamiliar withImage Quality Assessment (IQA) tasks, these findings mayhave significant impact on real-world applications of percep-tual metrics.
Index Terms— image quality, full reference, machinelearning
1. INTRODUCTION
IQA is a difficult task even for human raters, as it requiresmapping an extremely large space of possible images and dis-tortions onto a single number. Raters tend to show signifi-cant variability in their responses, in particular to IQA taskswhere the distortions are well above the human discriminationthreshold. For instance, raters may differ in how they weightthe severity of different types of distortions (such as distor-tions in the luminance vs. chrominance channels), or in howthey spatially integrate the presence of several distorted re-gions in an image. Instruction and training is commonly usedto control variability. For instance, raters may be discouragedfrom letting image semantics influence their decisions, or thefirst N ratings may be discarded to allow them to adapt tothe task. Trained raters typically develop a stable integrationscheme for the types of distortions they are presented with,
∗Work done while at Google; now at Pinterest, Inc., San Francisco, CA94107, USA
Fig. 1. Perceptual metrics can be trained to respect high-levelsemantic information such as faces. (a) the distorted image,(b) its perceived distortion under a contrast-based metric and,(c) the same for the proposed perceptual metric, indicatingthat distortions to a face are more objectionable than distor-tions to edges. Higher green intensity means higher predicteddistortion.
and may even adapt to individual distortions or test images –they “know where to look”. Although this may help to reducevariability, it may not help to accurately represent perceptualjudgments made by users of image processing systems “in thewild”. We have observed that minimally instructed or trainedraters tend to focus on semantically relevant objects in thescene.
This implies that the performance of IQA models in real-world scenarios could be enhanced by giving them access tohigher-order image features. Many existing image metricssuch as SSIM [1], MS-SSIM [2], PSNR-HVS [3], PSNR-HVS-M [4], FSIM [5], Butteraugli [6], HaarPSI [7] are de-signed to model specific documented aspects of the humanvisual system (HVS), such as contrast or color sensitivity,but are unable to access features that would be able to dis-cern object classes, for instance. One avenue for exploringthis idea is to use artificial neural networks (ANNs) that havebeen trained for object classification tasks. It has been shownthat their feature spaces can rival that of the inferior temporalcortex in primates [8], and researchers have used them suc-cessfully for image processing applications like texture syn-thesis [9] and super resolution [10].
In this paper, we present preliminary results exploring theuse of pre-trained ANNs for modeling quality judgments. We
collected a dataset of ground truth data for an IQA task fromuntrained raters. We then designed an image quality indexwith 10 parameters based on VGG-16, a pre-trained ANN,and fit it to the data. While our metric performs competitivelyon an existing IQA database, it outperforms all other metricson another distinct dataset we collected from untrained raters.It appears to do so by utilizing higher-order image featuresinherent to VGG-16.
2. COLLECTION OF GROUND TRUTH
Reference images were generated from 10MP JPEG imageswhich were downsampled by a factor of 4 to reduce compres-sion artifacts. For each of these 140k reference images, twodistorted images were created independently by applying arandom sequence of distortions (of random length), sampledwith replacement from 8 distortion types: compression arti-facts from JPEG and a variant of an ANN-based compressionmethod [11], two types of Gaussian noise, blur, posterization,gamma correction, and contrast rescaling. For example, animage could be distorted by blur(σ = 4.5), then JPEG(Q=60),and finally gamma(γ = 1.9). Subsequently, each image wascropped to a single random patch of 224×224 pixels to reducethe variability of rater responses by limiting the influence ofdifferent spatial integration strategies.
Inspired by [12]–[14], a protocol similar to two-alternativeforced choice (2AFC) was employed, except that raters hadthe additional option to declare UNSURE. 2AFC is bettersuited for uninformed raters than mean opinion score (MOS),because it avoids the need for calibration. Raters were pre-sented image triplets: a reference image O, and 2 distortedimages A and B. The task was to decide which of A or B ismost similar to the reference. The full-size reference imagewas presented along with the cropped versions for context.
We took care to minimize raters’ familiarity with imageprocessing, distortion types, etc. We avoided any training ses-sions or materials which might bias raters in terms of adapt-ing to or recognizing particular distortions, or which mightdiscourage them from applying their own rationale for dis-crimination. Raters were instructed to maintain a distance of0.5m to the 92dpi 24” monitor in the remote facility. Aspectssuch as lighting and session duration were uncontrolled for,as in real world conditions. We employed 200 raters in an at-tempt to sample the space of preferences; each triplet received5 ratings from this pool. The final collection of patches con-tained 700k ratings with an average rating time of 3.49s pertriplet.
3. PROPOSED METRIC AND MODEL FITTING
We define our full reference perceptual image metric as
f(x, y) =∑i
wi‖φi(x)− φi(y)‖1 = WΦ(x, y), (1)
Fig. 2. The proposed metric’s performance on TID2013 vs. asample of other methods. Other data reproduced from [12].
where x and y are images, wi ∈ R are model parameters,and φi is a vector containing the responses of the ith layer ofVGG-16 (directly after the rectified linear units). The layersare the 5 conv and 5 pool layers of VGG-16. Other choices,such as using only lower or only higher layers, did not per-form as well as the full set of convolutional layers. The pa-rameters of the VGG-16 model were used as pre-trained onImageNet [15] using 224 × 224 images over 1000 classes.During training, the W are optimized while the Φ, which aredetermined by the pre-trained VGG-16 weights, remain fixed.
The goal is for f to respect a distance-like property, i.e.,larger values correspond to larger images differences:
f(o, a) < f(o, b) ⇐⇒ a . b, (2)
where o, a, b are original image, and two distorted versions,respectively, and a . b means “a is judged by humans to becloser to the original than b”. Using (1), the above conditionabove can be rewritten as WXo,a,b < 0 where Xo,a,b is de-fined as Φ(o, a)−Φ(o, b). We omit the dependence of Xo,a,b
on the images o, a, b going forward.Now consider a binary classification problem where a fea-
ture vector X has target 1 if b . a and 0 otherwise. We uselogistic regression to train such a classifier. The output of thelogistic regression is the decision function F (X) = g(WX)where g(x) = (1 + e−x)−1, which we train to represent theprobability that b . a. This is accomplished by maximizingEa,b:b.a[log g(WX)] with L2 regularization on W . We donot include a bias term inside the decision function since wewish to have F (X) = 1 − F (−X). The desired weights areW .
4. EXPERIMENTAL RESULTS
The proposed metric was evaluated on TID2013 [12] whereit achieves SROCC and KROCC of 0.798 and 0.615 respec-tively, placing it in the top 5 of 16 performers on both mea-sures. Fig. 2 shows SROCC with a representative selectionof metrics. Note that the TID2013 images are disjoint fromthose in the training set.
We also constructed a compression dataset using the 24Kodak [16] images distorted by 8 lossy compression algo-rithms at compression rates from 0.125 to 1 bits per pixel.Ground truth was established as with the training data, except
2
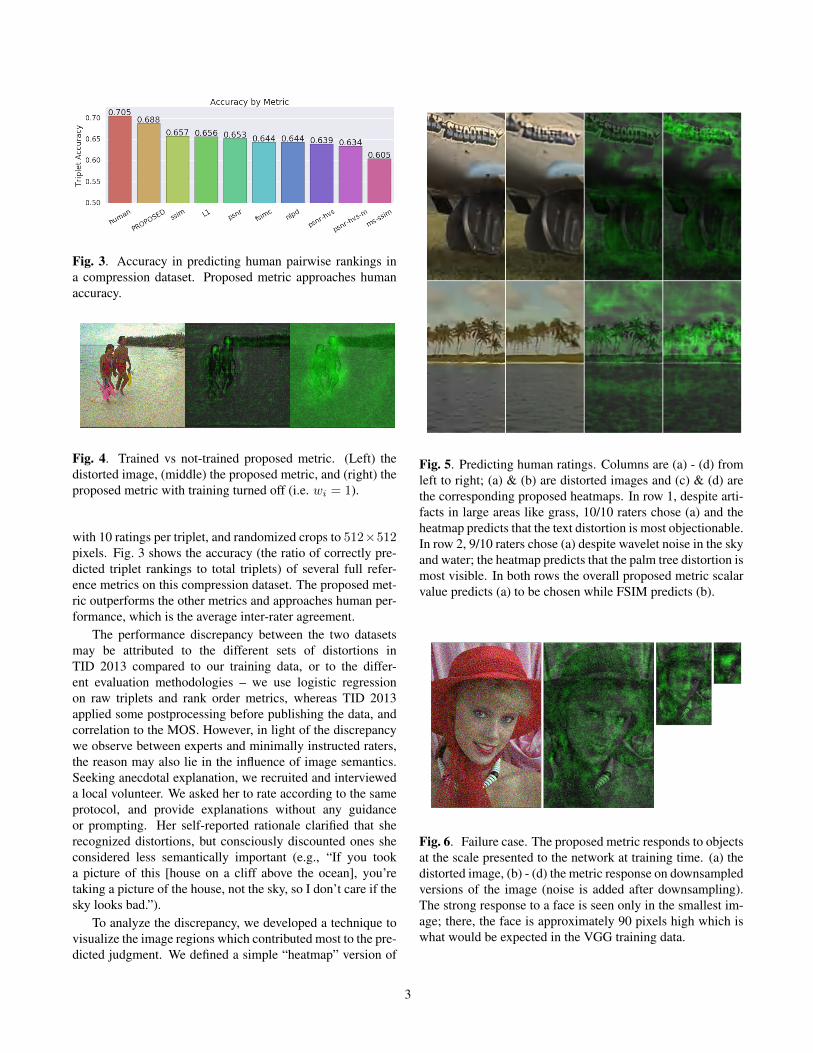
Fig. 3. Accuracy in predicting human pairwise rankings ina compression dataset. Proposed metric approaches humanaccuracy.
Fig. 4. Trained vs not-trained proposed metric. (Left) thedistorted image, (middle) the proposed metric, and (right) theproposed metric with training turned off (i.e. wi = 1).
with 10 ratings per triplet, and randomized crops to 512×512pixels. Fig. 3 shows the accuracy (the ratio of correctly pre-dicted triplet rankings to total triplets) of several full refer-ence metrics on this compression dataset. The proposed met-ric outperforms the other metrics and approaches human per-formance, which is the average inter-rater agreement.
The performance discrepancy between the two datasetsmay be attributed to the different sets of distortions inTID 2013 compared to our training data, or to the differ-ent evaluation methodologies – we use logistic regressionon raw triplets and rank order metrics, whereas TID 2013applied some postprocessing before publishing the data, andcorrelation to the MOS. However, in light of the discrepancywe observe between experts and minimally instructed raters,the reason may also lie in the influence of image semantics.Seeking anecdotal explanation, we recruited and intervieweda local volunteer. We asked her to rate according to the sameprotocol, and provide explanations without any guidanceor prompting. Her self-reported rationale clarified that sherecognized distortions, but consciously discounted ones sheconsidered less semantically important (e.g., “If you tooka picture of this [house on a cliff above the ocean], you’retaking a picture of the house, not the sky, so I don’t care if thesky looks bad.”).
To analyze the discrepancy, we developed a technique tovisualize the image regions which contributed most to the pre-dicted judgment. We defined a simple “heatmap” version of
Fig. 5. Predicting human ratings. Columns are (a) - (d) fromleft to right; (a) & (b) are distorted images and (c) & (d) arethe corresponding proposed heatmaps. In row 1, despite arti-facts in large areas like grass, 10/10 raters chose (a) and theheatmap predicts that the text distortion is most objectionable.In row 2, 9/10 raters chose (a) despite wavelet noise in the skyand water; the heatmap predicts that the palm tree distortion ismost visible. In both rows the overall proposed metric scalarvalue predicts (a) to be chosen while FSIM predicts (b).
Fig. 6. Failure case. The proposed metric responds to objectsat the scale presented to the network at training time. (a) thedistorted image, (b) - (d) the metric response on downsampledversions of the image (noise is added after downsampling).The strong response to a face is seen only in the smallest im-age; there, the face is approximately 90 pixels high which iswhat would be expected in the VGG training data.
3
Fig. 7. The proposed metric responds to object level features.Columns: reference, reference + Gaussian noise (fixed ran-dom seed), metric response. In row 2 the face in the referenceimage is destroyed. Despite the face pixel values being sim-ilar, the metric responds much weaker to the same noise dis-tortion, indicating that some objects are treated preferentially.
the proposed metric by omitting the spatial summation in (1),producing a value at each pixel. We constructed a similarheatmap visualization for HaarPSI as an example of an exist-ing metric modeling contrast sensitivity. In the figures, higherintensity of green indicates more predicted distortion. We ob-serve that the heatmaps generated by our metric are qualita-tively different from the ones generated by HaarPSI in thatthey tend to respond much less predictably to simple featuressuch as edges (figure 1). In particular, we find that there areoften strong responses to faces and other objects that couldhave semantic relevance, such as text (figures 4, 5, 6). This isa surprising result, given that there are only 10 model parame-ters and that the training data consists of random patches, thusprobably containing relatively few faces.
The pronounced response to faces is remarkably robust:when we only apply pseudo-random Gaussian noise (σ = 30,identical seeds) to rule out any interactions caused by com-plex signal-dependent distortions such as compression arti-facts, and compare identical images with and without pixelscrambling (figure 7), scrambled faces elicit a much weakerresponse. Put simply, a noisy face is predicted to be more ob-jectionable than a noisy non-face. Similarly, if we don’t fit themodel parameters to ground truth data and simply set wi = 1,the responses are much less specific (figure 4).
To further assess differences between our metric and ex-isting work, we selected image triplets from the compres-sion database where predictions differed between our metric
and FSIM. Fig. 5 shows examples where the proposed met-ric agreed with human raters. In instances where our metricfailed to predict human responses correctly, we observed thatit often appears to be particularly sensitive to smaller back-ground objects, discounting large foreground objects. Thismay be caused by a scale dependence in VGG-16: it wastrained on images of 224 × 224 pixels, and hence the fea-ture detectors it provides are small in scale compared to theKodak image. Fig. 6 illustrates such a failure case.
5. CONCLUSION
We collected a ground truth dataset consisting of 700k hu-man judgments and used it to fit a full reference image qual-ity model based on VGG-16, an ANN pre-trained for objectclassification. It performs competitively on TID 2013, andoutperforms existing metrics on a dataset with compressionartifacts collected from minimally instructed raters, approach-ing human performance. Our analysis seems to indicate that itrelies on higher-order image features generated by VGG-16,such as object detectors, to predict the human judgments.
Our work is related to existing work in using ANNs forfull-reference IQA, such as [17], [18]. However, we are un-aware of other publications that do this in the context of min-imizing rater instruction and training. Our work is also con-ceptually related to saliency maps, which are designed to cap-ture bottom-up processes of attention in the human visualsystem. In the context of region-of-interest video compres-sion, for instance, researchers have used measures of saliencyto modulate image quality metrics, or the compression algo-rithm directly, in order to introduce a semantic weighting ofthe content (e.g., [19]). A compelling aspect of our results isthat the proposed metric seems to use an internal measure ofsaliency that was inferred from the ground truth data, imply-ing that an explicit model of saliency may be unnecessary.
Many questions remain as to how perceptual metrics witha better model of image semantics can be designed, and whatother factors contribute to the discrepancy we observed be-tween the datasets. Collecting ground truth data with min-imal instruction and training is more challenging than fromraters who are familiar with IQA tasks, because it generallyincreases variability in their responses. However, our resultssuggest that a large part of this variability may in fact besystematic, and could be explained by models that have ac-cess to higher-order image features, such as ANNs. A futuredirection of research may be to develop improved protocolsfor collecting ground truth that maximize the raters’ freedomto apply semantic judgments, yet minimize inter- and intra-subject variability. Depending on the application, it may alsobe desirable to design metrics with varying levels of semanticmodeling, which should be reflected in the protocol.
4
6. REFERENCES
[1] Z. Wang, A. C. Bovik, H. R. Sheikh, and E. P. Simon-celli, “Image quality assessment: From error visibilityto structural similarity,” Trans. Img. Proc., vol. 13, no.4, pp. 600–612, Apr. 2004, ISSN: 1057-7149. DOI: 10.1109/TIP.2003.819861.
[2] Z. Wang, E. P. Simoncelli, and A. C. Bovik, “Multi-scale structural similarity for image quality assess-ment,” in In Proc. IEEE Asilomar Conf. on Signals,Systems, and Computers, (Asilomar, 2003, pp. 1398–1402.
[3] K. O. Egiazarian, J. Astola, N. N. Ponomarenko, V. V.Lukin, F. Battisti, and M. Carli, “A new full-referencequality metrics based on hvs,” 2006.
[4] N. Ponomarenko, F. Silvestri, K. Egiazarian, M. Carli,J. Astola, and V. Lukin, “On between-coefficient con-trast masking of dct basis functions,” Jan. 2007.
[5] L. Zhang, L. Zhang, X. Mou, and D. Zhang, “Fsim: Afeature similarity index for image quality assessment,”IEEE Transactions on Image Processing, vol. 20, no.8, pp. 2378–2386, Aug. 2011, ISSN: 1057-7149. DOI:10.1109/TIP.2011.2109730.
[6] J. Alakuijala, Github - google/butteraugli: Butter-augli estimates the psychovisual difference betweentwo images, https://github.com/google/butteraugli, (Accessed on 02/06/2018), Feb.2016.
[7] R. Reisenhofer, S. Bosse, G. Kutyniok, and T. Wie-gand, “A haar wavelet-based perceptual similarity in-dex for image quality assessment,” Signal Processing:Image Communication, vol. 61, pp. 33–43, 2018, ISSN:0923-5965. DOI: https://doi.org/10.1016/j.image.2017.11.001.
[8] C. F. Cadieu, H. Hong, D. L. K. Yamins, N. Pinto,D. Ardila, E. A. Solomon, N. J. Majaj, and J. J. Di-Carlo, “Deep neural networks rival the representationof primate IT cortex for core visual object recognition,”PLOS Computational Biology, 2014. DOI: 10.1371/journal.pcbi.1003963.
[9] J. Johnson, A. Alahi, and F. Li, “Perceptual losses forreal-time style transfer and super-resolution,” CoRR,vol. abs/1603.08155, 2016. arXiv: 1603.08155.
[10] C. Ledig, L. Theis, F. Huszar, J. Caballero, A. P.Aitken, A. Tejani, J. Totz, Z. Wang, and W. Shi,“Photo-realistic single image super-resolution us-ing a generative adversarial network,” CoRR, vol.abs/1609.04802, 2016. arXiv: 1609.04802.
[11] G. Toderici, D. Vincent, N. Johnston, S. J. Hwang, D.Minnen, J. Shor, and M. Covell, “Full resolution imagecompression with recurrent neural networks,” in 2017IEEE Conf. on Computer Vision and Pattern Recogni-tion (CVPR), 2017. DOI: 10.1109/CVPR.2017.577. arXiv: 1608.05148.
[12] N. Ponomarenko, L. Jin, O. Ieremeiev, V. Lukin,K. Egiazarian, J. Astola, B. Vozel, K. Chehdi, M.Carli, F. Battisti, and C.-C. Jay Kuo, “Image databaseTID2013,” Image Commun., vol. 30, no. C, pp. 57–77,Jan. 2015, ISSN: 0923-5965. DOI: 10 . 1016 / j .image.2014.10.009.
[13] R. K. Mantiuk, A. Tomaszewska, and R. Mantiuk,“Comparison of four subjective methods for imagequality assessment,” Computer Graphics Forum, vol.31, no. 8, pp. 2478–2491, 2012, ISSN: 1467-8659. DOI:10.1111/j.1467-8659.2012.03188.x.
[14] F. Schroff, D. Kalenichenko, and J. Philbin, “Facenet:A unified embedding for face recognition and cluster-ing,” CoRR, vol. abs/1503.03832, 2015. arXiv: 1503.03832.
[15] O. Russakovsky, J. Deng, H. Su, J. Krause, S. Satheesh,S. Ma, Z. Huang, A. Karpathy, A. Khosla, M. Bern-stein, A. C. Berg, and L. Fei-Fei, “ImageNet LargeScale Visual Recognition Challenge,” InternationalJournal of Computer Vision (IJCV), vol. 115, no. 3,pp. 211–252, 2015. DOI: 10.1007/s11263-015-0816-y.
[16] Kodak. (1991). True color kodak images, [Online].Available: http://r0k.us/graphics/kodak/(visited on 02/02/2018).
[17] S. Bosse, D. Maniry, K. R. Müller, T. Wiegand, andW. Samek, “Neural network-based full-reference im-age quality assessment,” in 2016 Picture Coding Sym-posium (PCS), 2016. DOI: 10.1109/PCS.2016.7906376.
[18] J. Kim and S. Lee, “Deep learning of human visualsensitivity in image quality assessment framework,”in 2017 IEEE Conference on Computer Vision andPattern Recognition (CVPR), 2017. DOI: 10.1109/CVPR.2017.213.
[19] L. Itti, “Automatic foveation for video compressionusing a neurobiological model of visual attention,”IEEE Transactions on Image Processing, vol. 13, no.10, 2004. DOI: 10.1109/TIP.2004.834657.


![Abstract. arXiv:1702.03970v1 [cs.CV] 13 Feb 2017frays,chunhui,dsl,clarahu,ranjith,julianibarz,sacha,sophig@google.com Abstract. We introduce the French Street Name Signs (FSNS) Dataset](https://static.documents.pub/doc/80x56/601c21c9dc480a39a57d98ea/abstract-arxiv170203970v1-cscv-13-feb-2017-frayschunhuidslclarahuranjithjulianibarzsachasophiggooglecom.jpg)


