Trump versus Clinton – the economic and financial implications of the 2016 US presidential election Follow us on Twitter @Danske_Research Important disclosures and certifications are contained from page 49 of this report. 7 October 2016 Investment Research www.danskebank.com/CI Mikael Olai Milhøj Senior Analyst [email protected]Thomas Harr Global Head of FICC Research [email protected]Arne Lohmann Rasmussen Chief Analyst [email protected]Christian Tegllund Blaabjerg Senior Strategist [email protected]Jakob Ekholdt Christensen Chief Analyst [email protected]Vladimir Miklashevsky Senior Analyst [email protected]Aila Mihr First Year Analyst [email protected]Las Olsen Chief Economist, Denmark [email protected]
Transcript
Trump versus Clinton – the economic and financial
implications of the 2016 US presidential election
Follow us on Twitter @Danske_Research
Important disclosures and certifications are contained from page 49 of this report.
TTIPPreviously called it an "economic NATO", no comments recently
No comments on TTIP but given his protectionist stance does not bode well
China Status quoMore aggressive against China as China breaks trade policy rules
OverallLikely she will abandon protectionist stance when elected, may face resistance from Congress
Aggressive protectionist trade policy, risking a global trade war
Stance Status quoAgainst low rate policy, Fed to become more hawkish to offset more expansionary fiscal policy
Fed chair Reappointment of Fed chair Yellen in 2018To replace Fed chair Yellen, uncertainty over independence
Foreign policy Status quoSubstantially more hawkish against free trade, significant regime shift
Immigration Status quo Substantially more hawkish vs immigrants
Fiscal policy
Trade policy
Monetary
policy
22
Ahead of Election Day, markets could move with opinion polls and the odds on the outcome being offered by
bookmakers. This will especially be the case if Trump gains momentum and takes the lead in the polls.
Key takeaways – market implications
Source: Danske Bank Markets estimates
3
Clinton ahead and gap is widening again
44
Hillary Clinton ahead in most polls and gap has widened again
Clinton leading but gap has closed significantly… … Clinton still seems to be the most likely winner
Note: the probability of winning the next presidential election is calculated by FiveThirtyEight in
their polls-only model based on state and national polls.
Source: fivethirtyeight.com
Source: realclearpolitics.com
55
538 electoral votes – 270 to win
Current US electoral map - green states indicate a close race in recent state polls
• Number of electoral voters in a given state is equal to the total number of seats in Congress => Populated states are hence most important
• Florida, Ohio, Virginia, Pennsylvania and Wisconsin (all toss-up states currently) hold 90 electoral votes.
• Since 1964, Ohio and Florida have voted for the winning candidate every time except in 1992 when Florida had a Republican majority and Bill Clinton won.
Note: Number indicates electoral votes. Hawaii and D.C. are solid Democratic and Alaska is solid Republican
Source: realclearpolitics.com
Division of electoral votes – Clinton
still missing 65 electoral votes
66Source: Bloomberg, Wikipedia
US election – timetable
08 November: Election Day
26 September: firstpresidential debate
04 October: vicepresidential debate
09 October: secondpresidential debate
19 October: third and final presidential debate
20 January 2017:
inauguration of the new president and vice president
In the meantime, markets are set to focus on opinion polls and odds on the
outcome being offered by bookmakers
(but be careful, they may send a false signal)
7
Check-and-balance system limits presidential
powers
88
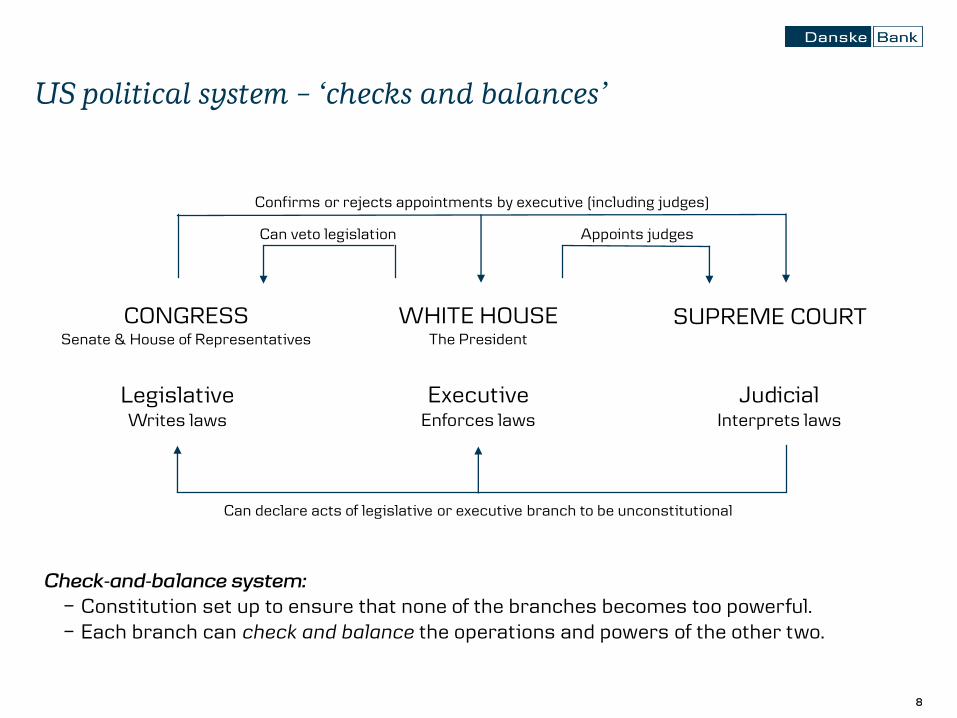
US political system – ‘checks and balances’
LegislativeWrites laws
ExecutiveEnforces laws
JudicialInterprets laws
Can veto legislation Appoints judges
Confirms or rejects appointments by executive (including judges)
Can declare acts of legislative or executive branch to be unconstitutional
Check-and-balance system: − Constitution set up to ensure that none of the branches becomes too powerful.− Each branch can check and balance the operations and powers of the other two.
CONGRESSSenate & House of Representatives
WHITE HOUSEThe President
SUPREME COURT
99
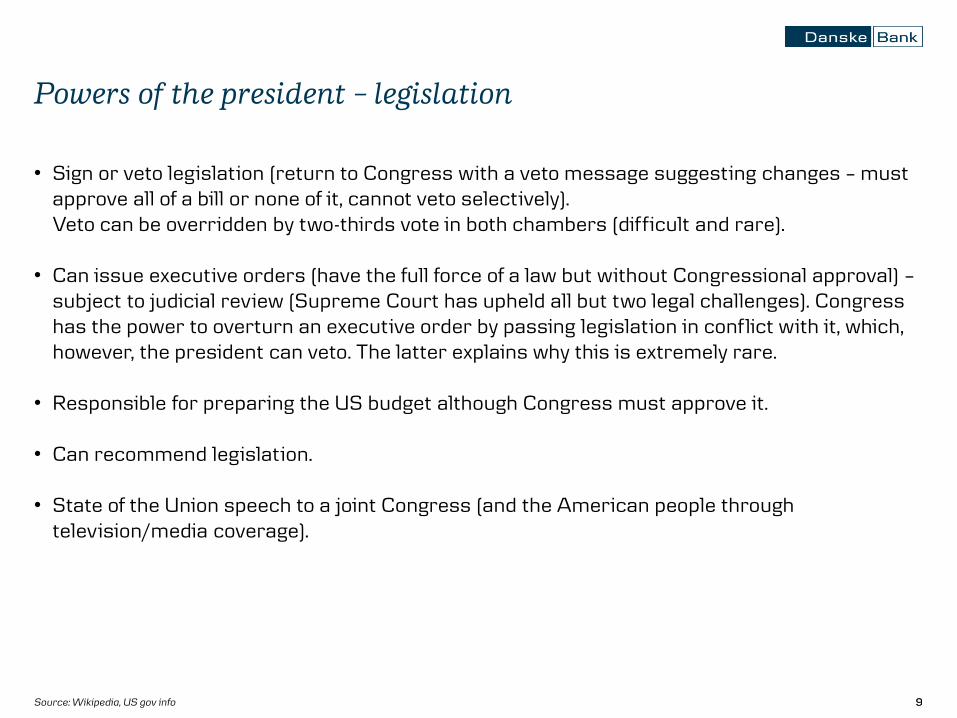
• Sign or veto legislation (return to Congress with a veto message suggesting changes – must approve all of a bill or none of it, cannot veto selectively).Veto can be overridden by two-thirds vote in both chambers (difficult and rare).
• Can issue executive orders (have the full force of a law but without Congressional approval) –subject to judicial review (Supreme Court has upheld all but two legal challenges). Congress has the power to overturn an executive order by passing legislation in conflict with it, which, however, the president can veto. The latter explains why this is extremely rare.
• Responsible for preparing the US budget although Congress must approve it.
• Can recommend legislation.
• State of the Union speech to a joint Congress (and the American people through television/media coverage).
Source: Wikipedia, US gov info
Powers of the president – legislation
1010
• Commander in Chief of the armed forces (defence budget set by Congress).
• Congress holds the power to declare war but as Commander in Chief the president can send troops without declaration (or make an executive order).
• The President holds summits with other world leaders.
• The President negotiates treaties with other countries, which need to be ratified by two-thirds of the Senate.
Source: Wikipedia, US gov info
Powers of the president – foreign affairs
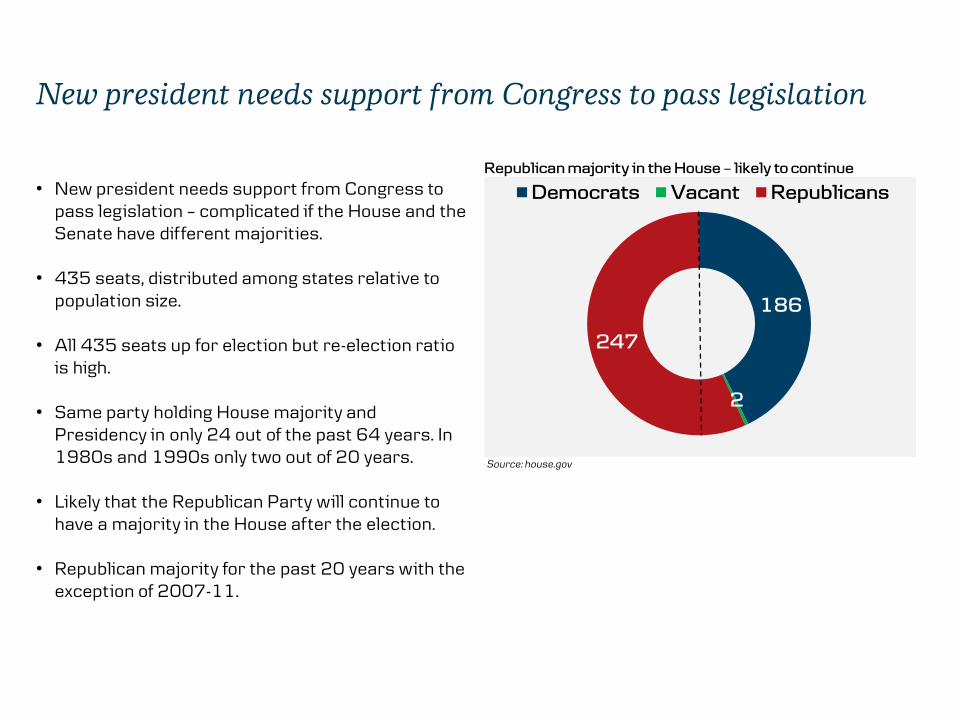
New president needs support from Congress to pass legislation
• New president needs support from Congress to pass legislation – complicated if the House and the Senate have different majorities.
• 435 seats, distributed among states relative to population size.
• All 435 seats up for election but re-election ratio is high.
• Same party holding House majority and Presidency in only 24 out of the past 64 years. In 1980s and 1990s only two out of 20 years.
• Likely that the Republican Party will continue to have a majority in the House after the election.
• Republican majority for the past 20 years with the exception of 2007-11.
Republican majority in the House – likely to continue
186
2
247
Democrats Vacant Republicans
Source: house.gov
1212
• 100 seats, two from each state. Republican majority currently. 34 seats up for election.
• 24 out of the 34 seats up for election are held by Republicans, 10 by Democrats.
• Still a long way to the so-called super majority of 60 seats, which makes the legislation process easier (prevents filibustering).
Majority in the Senate could shift to the Democrats
Republicans hold 24 of the 34 seats up for election
• Six out of seven toss-up states are currently held by Republicans.
• Democrats need to win 15 seats out of 34 to get majority, Republicans need 21 => likely that the majority could shift to the Democrats.
• Increases the likelihood of a divided Congress, which complicates legislation.
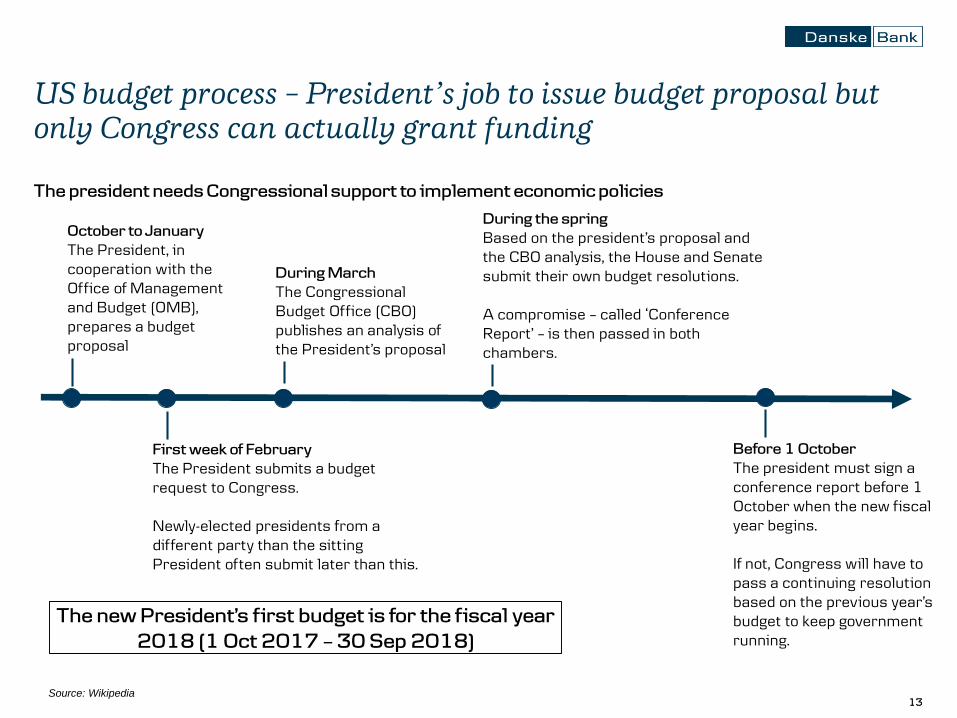
US budget process – President’s job to issue budget proposal but
only Congress can actually grant funding
First week of February
The President submits a budget request to Congress.
Newly-elected presidents from a different party than the sitting President often submit later than this.
During March
The Congressional Budget Office (CBO) publishes an analysis of the President’s proposal
During the spring
Based on the president’s proposal and the CBO analysis, the House and Senate submit their own budget resolutions.
A compromise – called ‘Conference Report’ – is then passed in both chambers.
Before 1 October
The president must sign a conference report before 1 October when the new fiscal year begins.
If not, Congress will have to pass a continuing resolution based on the previous year’s budget to keep government running.
October to January
The President, in cooperation with the Office of Management and Budget (OMB), prepares a budget proposal
The president needs Congressional support to implement economic policies
The new President’s first budget is for the fiscal year
2018 (1 Oct 2017 – 30 Sep 2018)
14
Trump vs Clinton – their power is limited by the
‘check and balances’ system
1515
• Hillary Clinton most likely faces either a Republican or a divided Congress.
• Would need to seek compromises to get her policy through.
• Not a new thing - same has been true for both Barack Obama and Bill Clinton.
• Do not expect significant changes to US politics, neither domestically nor globally.
Clinton vs Trump
Hillary Clinton - status quo candidate
• Hawkish views on immigration, fiscal policy, tradepolicy and foreign policy.
• His political views/statements differ from traditionalRepublican views.
• No political experience – we do not know what to expect if elected. Increases uncertainty.
• In reality, he may be more modest than currentretorics suggest.
Donald Trump - more hawkish views
1616
• Trump will need Republican support to pass legislation in Congress due to the check-and-balance system (unlikely he can pass all his policies as Executive Orders).
• Many Republican Congress members do not share his political views.
• Trump may be forced to be more pragmatic and seek more compromises as President on domestic affairs, especially if Congress is divided.
• Still more likely that Trump can get more of his policies through if the Republican Party wins both chambers.
• With respect to foreign policy, Donald Trump would have more power. Here lies the biggest uncertainty in case of a Trump win, in our view.
Trump may be forced to be more pragmatic if elected
Trump does not enjoy significant support in the Senate…
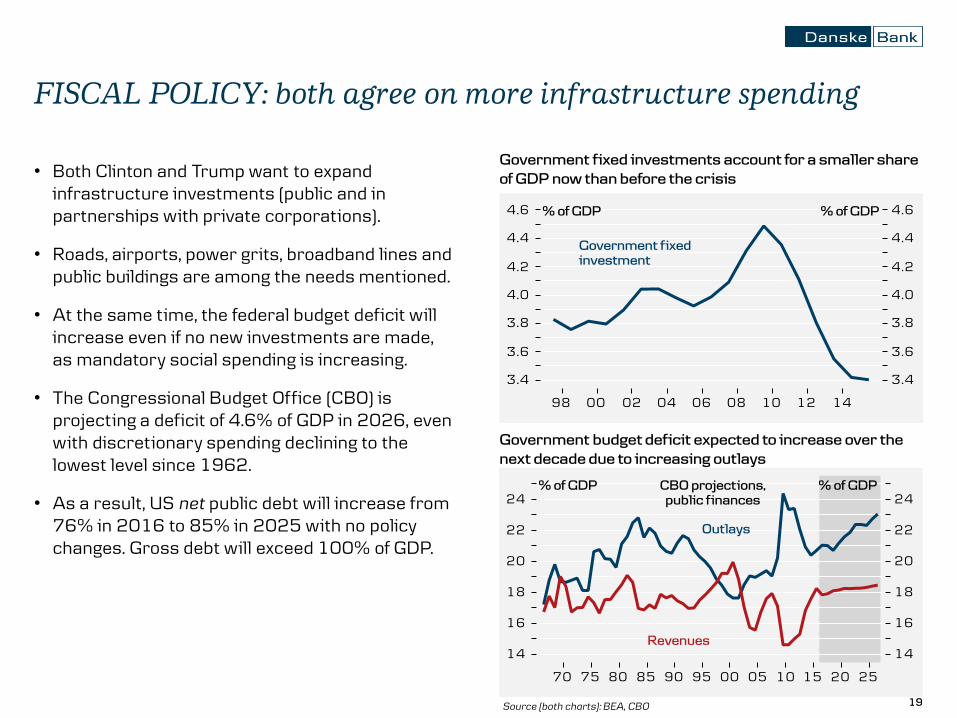
• Both Clinton and Trump want to expand infrastructure investments (public and in partnerships with private corporations).
• Roads, airports, power grits, broadband lines and public buildings are among the needs mentioned.
• At the same time, the federal budget deficit will increase even if no new investments are made, as mandatory social spending is increasing.
• The Congressional Budget Office (CBO) is projecting a deficit of 4.6% of GDP in 2026, even with discretionary spending declining to the lowest level since 1962.
• As a result, US net public debt will increase from 76% in 2016 to 85% in 2025 with no policy changes. Gross debt will exceed 100% of GDP.
FISCAL POLICY: both agree on more infrastructure spending
Government fixed investments account for a smaller share
of GDP now than before the crisis
Government budget deficit expected to increase over the
• Infrastructure programme of USD275bn over five years : approximately 0.3% of GDP each year.
• Many other expenditures, including:Broadband access, parental leave, better access to pre-school and childcare, more community colleges.
• Tax hikes on high incomes, lower threshold for inheritance tax, fewer deductions in corporate income and other hikes – estimated at USD1,100bn over 10 years, or approximately 0.6% of GDP each year.
• Expenditures could be advanced and income
measures postponed if the administration wants a
more expansionary policy in the first years – as some of its advisers are advocating.
• But over a longer horizon: more or less neutral.
FISCAL POLICY: widely different fiscal stance and tax policies
Clinton: expenses but also higher taxes
• Has promised to ‘at least double’ Clinton’s infrastructure spending, implying at least 0.6% of GDP. Has talked about ‘trillion-dollar rebuilding programme’, so potentially higher spending.
• Trump’s original tax proposal was estimated to cost USD10trn over 10 years.
• New proposal is more modest – perhaps USD3trn, or 1.6% of annual GDP.
In sum, fiscal easing of at least 2.2% of annual GDP.
• Trump has also talked about a balanced budget within eight years. According to his economic plan, it is possible due to dynamic effects – in reality, it is doubtful.
• Very difficult to estimate the actual effect of a Trump
victory but according to his economic plan, we should
Source (both charts): CBO, www.donaldjtrump.com, Danske Bank Markets
• Clinton’s economic plan is more or less neutral – in line with the CBO’s baseline projection.
• Using a simple debt model and assuming Trump gets all his policy proposals through (an unrealistic scenario), the US public net debt could increase to above 95% of GDP from about 75% today.
• As a result, we think that the US would lose the last two of its ‘AAA’ ratings (has already lost one).
• Less rosy assumptions imply that debt increasesmore (slower growth, lower fiscal multiplier, higherrates).
• US public sector needs to reform as projected fiscalpath is unsustainable in the long run.
FISCAL POLICY: implications of fiscal plans for US public debt
US government debt set to increase in case of a Trump win
US public debt to increase significantly in coming decades
• Fiscal policy is mainly a tool to increase employment – but unemployment gap nearly closed.
• Fiscal policy lag: more expansionary fiscal policy will not get through before late 2017 at the earliest (more likely in 2018).
• Remember the new President’s first budget is for the 2018 fiscal year (1 Oct 2017 – 30 Sep2018).
• More expansionary fiscal policy may be fullyoffset by a more hawkish Fed (higher Fed funds rate) if it thinks the economy risks overheating.
• In our view, focus should be on structuralreforms as the US struggles with very weakproductivity growth.
FISCAL POLICY: likely to be too late in the recovery to justify
more expansionary fiscal policyCould be too late in the recovery to justify more
expanionsary fiscal policy
Very weak productivity is a bigger problem in the medium
term for the US economy
Source (both charts: BLS, BEA
2323Source: www.donaldjtrump.com,
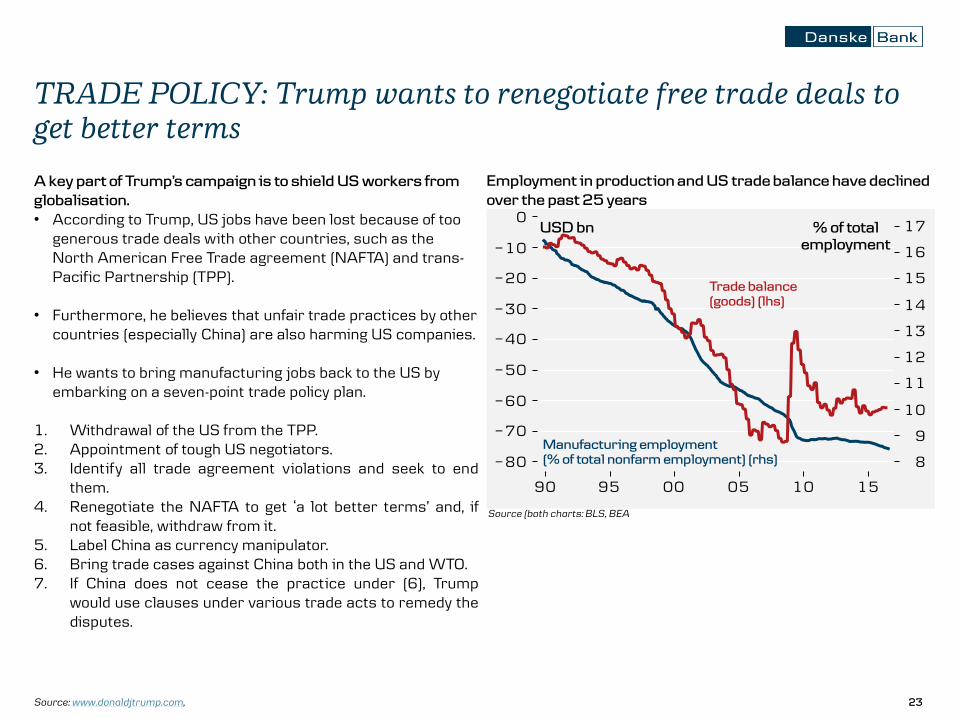
• According to Trump, US jobs have been lost because of too generous trade deals with other countries, such as the North American Free Trade agreement (NAFTA) and trans-Pacific Partnership (TPP).
• Furthermore, he believes that unfair trade practices by other countries (especially China) are also harming US companies.
• He wants to bring manufacturing jobs back to the US by embarking on a seven-point trade policy plan.
1. Withdrawal of the US from the TPP.2. Appointment of tough US negotiators.3. Identify all trade agreement violations and seek to end
them.4. Renegotiate the NAFTA to get ‘a lot better terms’ and, if
not feasible, withdraw from it.5. Label China as currency manipulator.6. Bring trade cases against China both in the US and WTO.7. If China does not cease the practice under (6), Trump
would use clauses under various trade acts to remedy thedisputes.
TRADE POLICY: Trump wants to renegotiate free trade deals to
get better terms
Employment in production and US trade balance have declined
over the past 25 years
A key part of Trump’s campaign is to shield US workers from
• Echoing concerns of the Sanders supporters of the Democratic party, Clinton has stressed that she will ‘stop any trade deal that kills jobs or holds down wages’.
• Clinton will say no to trade deals such as the TPP, which does not ‘meet her high standard of
raising wages, creating good-paying jobs, and enhancing our national security’.
• She has also expressed scepticism about NAFTA (her husband’s old trade agreement).
• Remains an open question whether she would pursue a more protectionist policy if elected, as she has previously been an advocator for free trade deals.
• Also, the Republicans Congress members are more pro free trade than Donald Trump – may try to prevent more protectionist policy.
TRADE POLICY: Clinton is also advocating more protectionism
• There is a significant risk that affected countries may take retaliatory trade measures, which could set inmotion a global trade war.
• This would hurt global trade, which has already been sluggish since 2014 and ultimately global economicgrowth.
• Neither Clinton nor Trump have said much explicitly on the Transatlantic Trade and Investment Partnership (TTIP – EU/US trade deal) but free trade reservations by both Clinton and Trump do not bode well for a deal.
• Given that both candidates call for more protectionism, most likely some protectionist measures will be taken on the back of the US election.
TRADE POLICY: aggressive protectionist US trade policy could
lead to global protectionism
-5
0
5
10
15
20
% of GDP Net exports to the US
1990 2015
TPP
NAFTA
Unilateral
2626
• The President nominates chairmanship and Governors (subject to Senate confirmation).
• Janet Yellen and Stanley Fischer’s chairmanships are due to end in 2018 – new President to appoint new chairs or reappoint the current.
• New chairmanship may be chosen by the President from among the sitting Governors for four-year terms.
• Daniel Tarullo and Stanley Fischer’s terms as Governors expire in 2020 – new President to appoint new Governors (14-year terms).
• Long terms to ensure independency but political views play a role when a president appoints new members.
• Currently, there are two vacant seats in the Board of Governors – not a given that the current nominees (Allan Landon and Kathryn Dominguez) will be approved before the inauguration of the new President.
Stanley Fischer (Vice-Chair) 20142018 (as Vice-Chair)2020 (as Governor)
Daniel Tarullo 2009 2020
Jerome H. Powell 2012 2028
Lael Brainard 2014 2026
Vacant
Vacant
Source: Federal Reserve, WIkipedia
2727Source: Federal Reserve, WIkipedia
• It is unusual to replace a sitting chair.
• Barack Obama (Democrat) reappointed Ben Bernanke (a Republican first nominated by George W. Bush) for a second term in 2009.
• Democrat Bill Clinton reappointed Alan Greenspan (a Republican) twice.
• Republican Ronald Reagan kept Paul Volcker (a Democrat).
• If Hillary Clinton wins, she is most likely to stick with Janet Yellen (assuming she wants a second term).
MONETARY POLICY: unusual to replace Fed chair – Clinton
would be likely to stick with Janet Yellen
2828
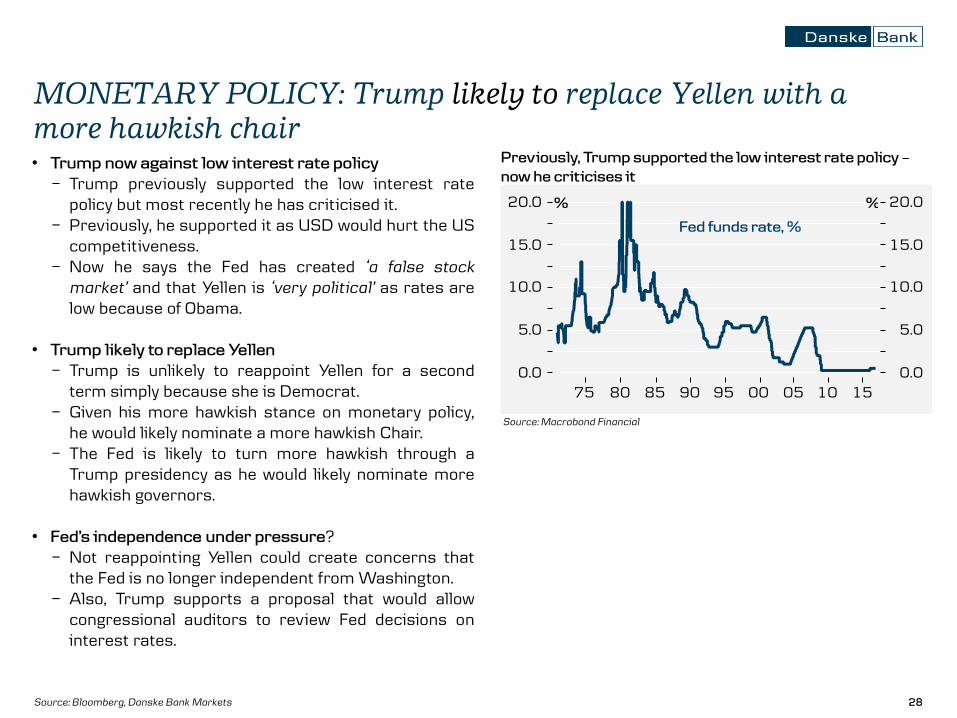
• Trump now against low interest rate policy
− Trump previously supported the low interest ratepolicy but most recently he has criticised it.
− Previously, he supported it as USD would hurt the UScompetitiveness.
− Now he says the Fed has created ‘a false stock
market’ and that Yellen is ‘very political’ as rates arelow because of Obama.
• Trump likely to replace Yellen
− Trump is unlikely to reappoint Yellen for a secondterm simply because she is Democrat.
− Given his more hawkish stance on monetary policy,he would likely nominate a more hawkish Chair.
− The Fed is likely to turn more hawkish through aTrump presidency as he would likely nominate morehawkish governors.
• Fed’s independence under pressure?− Not reappointing Yellen could create concerns that
the Fed is no longer independent from Washington.− Also, Trump supports a proposal that would allow
congressional auditors to review Fed decisions oninterest rates.
Source: Bloomberg, Danske Bank Markets
MONETARY POLICY: Trump likely to replace Yellen with a
more hawkish chair Previously, Trump supported the low interest rate policy –
now he criticises it
Source: Macrobond Financial
2929
0
0.5
1
1.5
2
2.5
3
3.5
4
2016E
NATO Guideline 2%
According to Trump’s statements, US foreign policy could see a significant shift – here lies the biggest uncertainty
1. Escalation of rhetoric towards China’s increasinggeopolitical presence and growing pressure on NorthKorea.
2. China is the main enemy, not Russia.3. NATO members will be asked to contribute more to
NATO if their contributions are below the 2% of GDPthreshold (see figure below). This could create possiblefrictions within NATO.
4. Improving dialogue with Russia – Trump says ‘Putin
has absolutely no respect for President Obama’.
5. Improving economic ties with Cuba.6. Being the key negotiator for an Israeli-
Palestinian deal while avoiding taking sides.7. Retreat from active rebels training, act as a
negotiator in the Syrian conflict and let Russiado the ground job.
8. More sanctions on Iran versus more support ofIsrael.
Defence expenditures as a share of GDP
(based on 2010 prices and exchange rates)
Trump will put pressure on NATO members to contribute 2% in line with NATO guidelines.
Source: Nato
FOREIGN POLICY: Clinton status quo – the US could see a
regime shift in US foreign policy under Trump
3030
0102030405060708090
2008 2012 2016
Importance of immigration issue (% of respondents saying immigration is 'very
important' to their vote)
Importance of "immigration, all"
Among republicans
Among democrats
Source (Both charts): Pew Research Center, Survey conducted June 15-26, 2016
IMMIGRATION: immigration is a key issue to voters
40
45
52
57
63
65
66
67
70
72
74
75
80
84
0 25 50 75 100
Treatment of sexualminorities
Abortion
Environment
Trade policy
Treatment of racial, ethnicminorities
Supreme court appointments
Education
Social security
Immigration
Gun policy
Health care
Foreign policy
Terrorism
Economy
Top voting issues in 2016 election (% of respondents saying the topic is
'very important')
Immigration is the sixthmost important issue for
voters
Trump oftenconnects
immigrationissues to terrorism
Both Republican and Democrat voters think immigration
is a more important issue than at previous elections
3131
Source (both charts): Migration Policy Institute. 2014 statistics
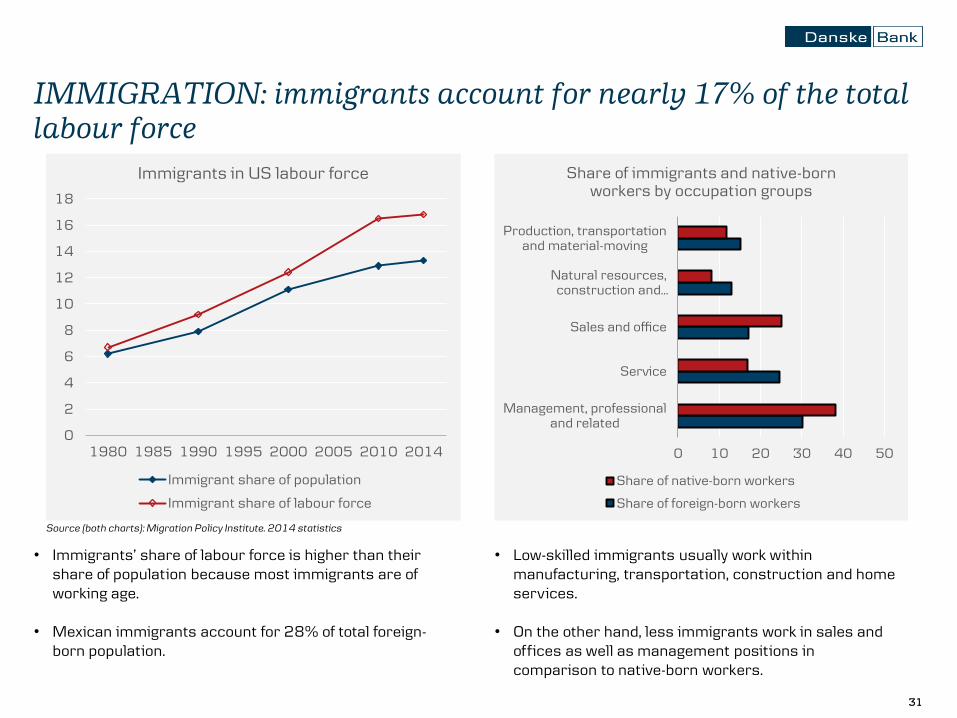
• Immigrants’ share of labour force is higher than their share of population because most immigrants are of working age.
• Mexican immigrants account for 28% of total foreign-born population.
IMMIGRATION: immigrants account for nearly 17% of the total
labour force
0 10 20 30 40 50
Management, professionaland related
Service
Sales and office
Natural resources,construction and…
Production, transportationand material-moving
Share of immigrants and native-born workers by occupation groups
Share of native-born workers
Share of foreign-born workers
• Low-skilled immigrants usually work withinmanufacturing, transportation, construction and home services.
• On the other hand, less immigrants work in sales and offices as well as management positions in comparison to native-born workers.
0
2
4
6
8
10
12
14
16
18
1980 1985 1990 1995 2000 2005 2010 2014
Immigrants in US labour force
Immigrant share of population
Immigrant share of labour force
3232
IMMIGRATION: candidates’ immigration policies are worlds
apart
Hillary Clinton – comprehensive immigration reform Donald Trump – against illegal immigration
Key points:
• A comprehensive reform with a pathway to full and equalcitizenship within the first 100 days in office.
• Immigration enforcement must be humane, targeted and effective, focus resources on detaining and deportingindividuals that pose threat to public safety.
• Expansion of access to affordable healthcare.
• Creation of national Office of Immigrant Affairs, supportfor immigrant integration at community level.
Key points:
• Plans to build a wall to Mexico border to prevent illegalimmigrants from entering the country, legal immigrantsare welcome and will receive fair treatment.
• Immigration security = national security => carefulscreening of each individual entering the country and extreme vetting for immigrants from troubled parts of theworld.
• Temporary suspension of immigration entirely fromregions where safe and adequate screening cannot occur.
Source: Official campaign websites
3333Source: FRBSF Economic Letter: The Effect of Immigrants on U.S. Employment and Productivity (Peri, 2010), Penn Wharton University Of Pennsylvania Background Brief: The Effects of
Immigration on the Unites States’ Economy
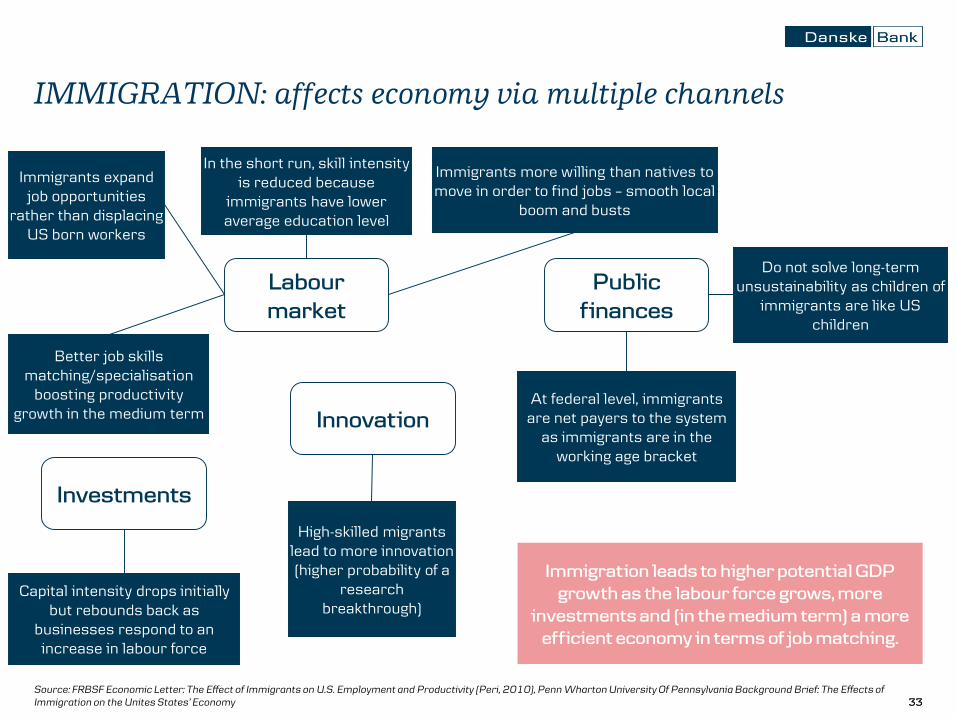
IMMIGRATION: affects economy via multiple channels
Labour
market
Public
finances
Investments
High-skilled migrantslead to more innovation(higher probability of a
researchbreakthrough)
In the short run, skill intensityis reduced because
immigrants have loweraverage education level
Immigrants expandjob opportunities
rather than displacingUS born workers
Capital intensity drops initiallybut rebounds back as
businesses respond to an increase in labour force
At federal level, immigrantsare net payers to the system
as immigrants are in theworking age bracket
Do not solve long-termunsustainability as children of
immigrants are like US children
Immigration leads to higher potential GDP
growth as the labour force grows, more
investments and (in the medium term) a more
efficient economy in terms of job matching.
Immigrants more willing than natives to move in order to find jobs – smooth local
boom and busts
Better job skillsmatching/specialisation
boosting productivitygrowth in the medium term
Innovation
3434
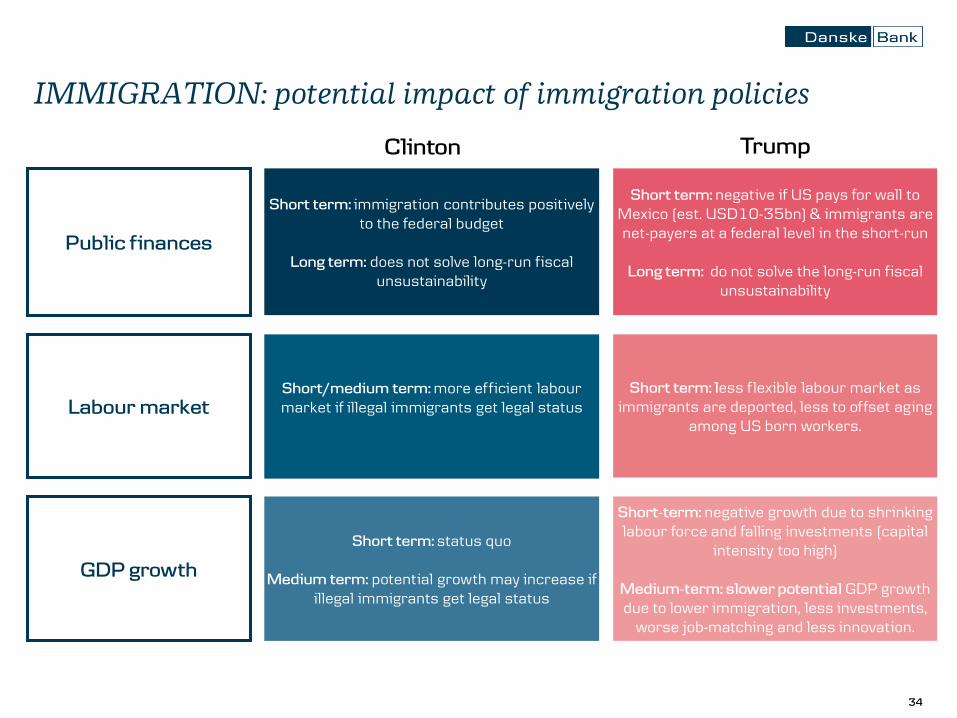
IMMIGRATION: potential impact of immigration policies
Short term: immigration contributes positivelyto the federal budget
Long term: does not solve long-run fiscalunsustainability
Short term: negative if US pays for wall to Mexico (est. USD10-35bn) & immigrants arenet-payers at a federal level in the short-run
Long term: do not solve the long-run fiscalunsustainability
Short/medium term: more efficient labour market if illegal immigrants get legal status
Short term: status quo
Medium term: potential growth may increase ifillegal immigrants get legal status
Short term: less flexible labour market as immigrants are deported, less to offset aging
among US born workers.
Short-term: negative growth due to shrinkinglabour force and falling investments (capital
intensity too high)
Medium-term: slower potential GDP growthdue to lower immigration, less investments,
worse job-matching and less innovation.
Public finances
Labour market
GDP growth
Clinton Trump
35
Market implications
3636
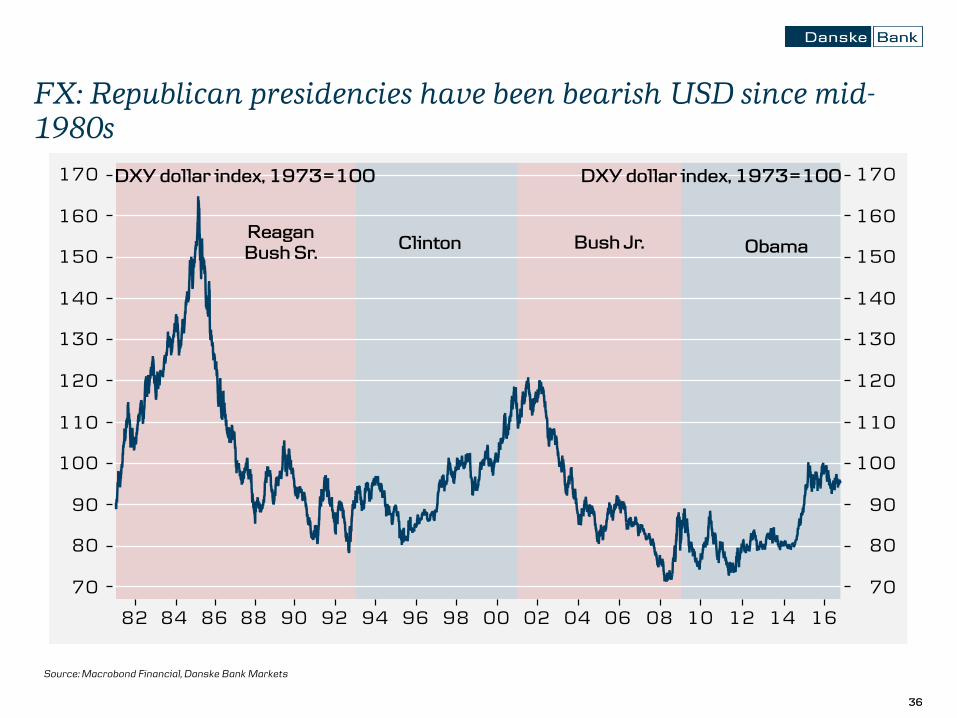
FX: Republican presidencies have been bearish USD since mid-
1980s
Source: Macrobond Financial, Danske Bank Markets
3737
FX: higher growth under Democratic presidencies may provide
part of the reason why the USD has been stronger
Source: BEA, Danske Bank Markets
3838
• Larger fiscal expansions have tended to drive USD weakness with the exception of Reagan’s first term in1981-84.
• During Reagan’s first term, the newly appointed Paul Volcker raised policy rates sharply whichsupported the dollar.
Source (both charts): Macrobond Financial, Danske Bank Markets
But higher real interest rates tend to drive USD strengthFiscal expansion has tended to drive USD weakness
FX: fiscal expansions drive USD weakness if they are not
accompanied by higher real interest rates
3939
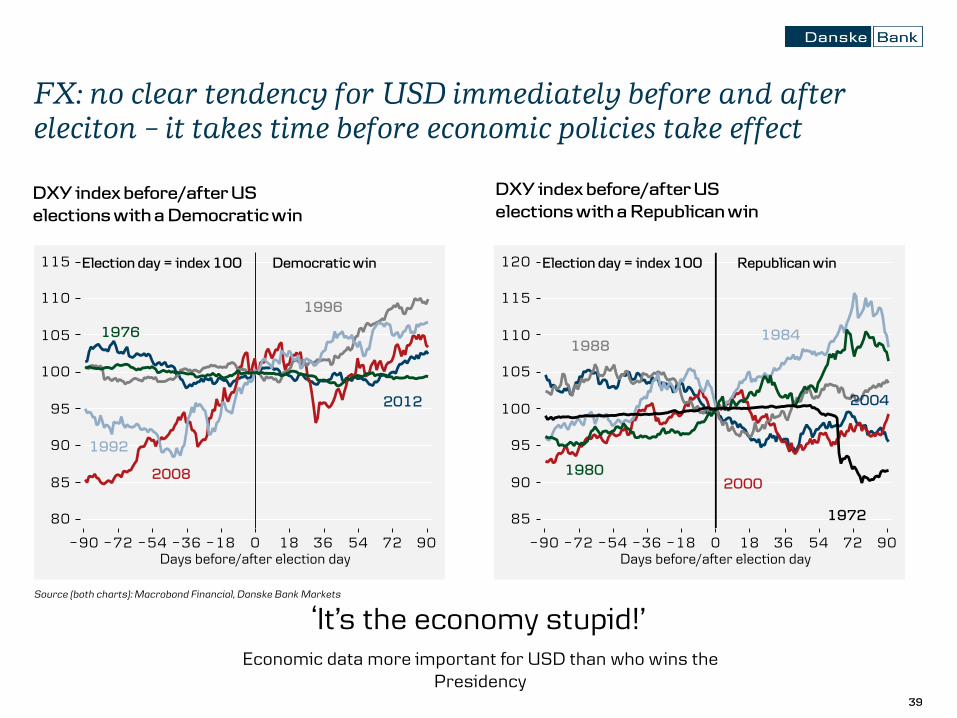
FX: no clear tendency for USD immediately before and after
eleciton – it takes time before economic policies take effect
DXY index before/after US
elections with a Democratic win
‘It’s the economy stupid!’
DXY index before/after US
elections with a Republican win
Economic data more important for USD than who wins the Presidency
Source (both charts): Macrobond Financial, Danske Bank Markets
4040
FX: USD is fundamentally overvalued vs the EUR, which will
drive the cross higher over the medium term
Eurozone-US current account differential at
Q4-2004 levels
Danske Bank’s G10 medium-term valuation (MEVA) model
indicates EUR/USD at 1.27 in the medium term
Source (both charts): Macrobond Financial, Bloomberg, Danske Bank Markets
4141
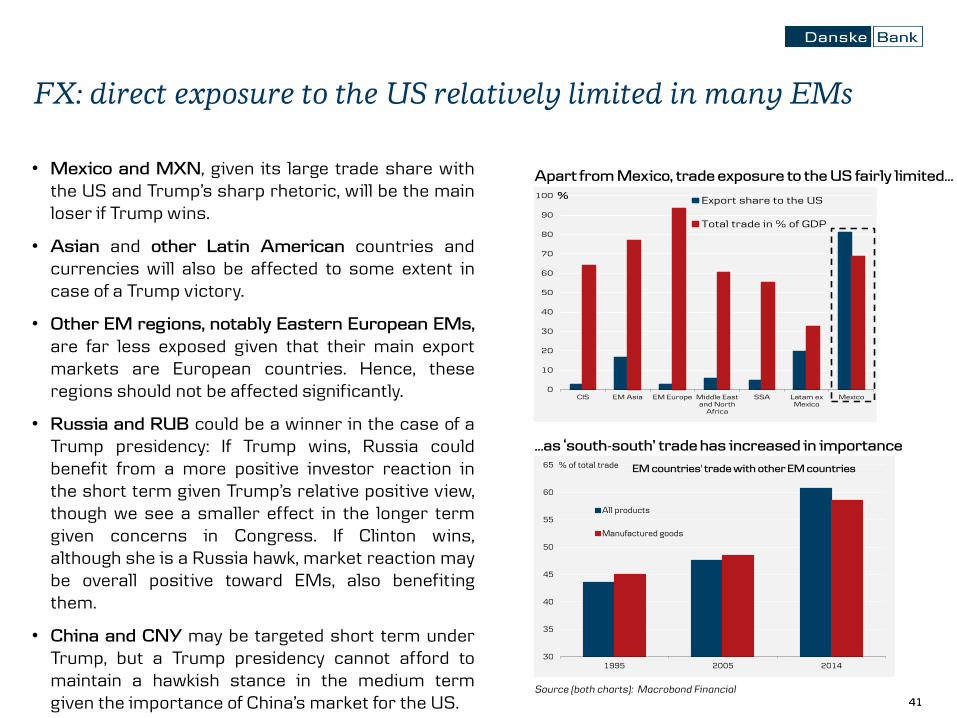
• Mexico and MXN, given its large trade share withthe US and Trump’s sharp rhetoric, will be the mainloser if Trump wins.
• Asian and other Latin American countries andcurrencies will also be affected to some extent incase of a Trump victory.
• Other EM regions, notably Eastern European EMs,
are far less exposed given that their main exportmarkets are European countries. Hence, theseregions should not be affected significantly.
• Russia and RUB could be a winner in the case of aTrump presidency: If Trump wins, Russia couldbenefit from a more positive investor reaction inthe short term given Trump’s relative positive view,though we see a smaller effect in the longer termgiven concerns in Congress. If Clinton wins,although she is a Russia hawk, market reaction maybe overall positive toward EMs, also benefitingthem.
• China and CNY may be targeted short term underTrump, but a Trump presidency cannot afford tomaintain a hawkish stance in the medium termgiven the importance of China’s market for the US.
Apart from Mexico, trade exposure to the US fairly limited…
FX: direct exposure to the US relatively limited in many EMs
…as ‘south-south’ trade has increased in importance
Source (both charts): Macrobond Financial
0
10
20
30
40
50
60
70
80
90
100
CIS EM Asia EM Europe Middle Eastand North
Africa
SSA Latam exMexico
Mexico
% Export share to the US
Total trade in % of GDP
30
35
40
45
50
55
60
65
1995 2005 2014
% of total trade
All products
Manufactured goods
EM countries' trade with other EM countries
4242Source: Macrobond Financial
• Emerging markets, notably Asian merchandise exporters, will be among the biggest losers from increased protectionism given their sizable foreign trade.
• Larger and more closed economies, such as the US, China, Russia and Canada, are more immune to global protectionism due to bigger home market and less export focus.
FX: EM biggest losers from possible global trade war
4343
• Donald Trump would be medium-term negative for the USD vs DM, positive for USD vs EM
− Positive for the USD versus MXN, CAD, VND, MYR, CNY and KRW given a likely withdrawal of the US from TPP and renegotiation of NAFTA. Negative for the USD vs RUB.
− Marginal short-term implications for the USD vs G10 currencies (ex CAD) as it will take time for changes in economic policies to take effect.
− Medium-term, a Trump win will be USD negative vs G10 (ex. CAD) as fiscal expansion and risks of slower growth will dominate the support for the USD from higher yields
• Hillary Clinton would be neutral vs DM, negative for USD vs EM
− Marginally negative for the USD versus MXN, CAD, VND, MYR, CNY and KRW as Clinton will be less against free trade than Trump. Also marginally negative for the USD vs RUB.
− Marginal short- and medium-term implications for the USD vs G10 currencies (ex CAD) as fiscal and monetary policies will remain broadly unchanged.
FX: Trump – medium-term negative for USD/DM, positive for
USD/EM
4444
Source: Macrobond Financial, Danske Bank Markets
EQUITIES: US markets react to economy, ignore geopolitics
4545Source: Danske Bank Markets
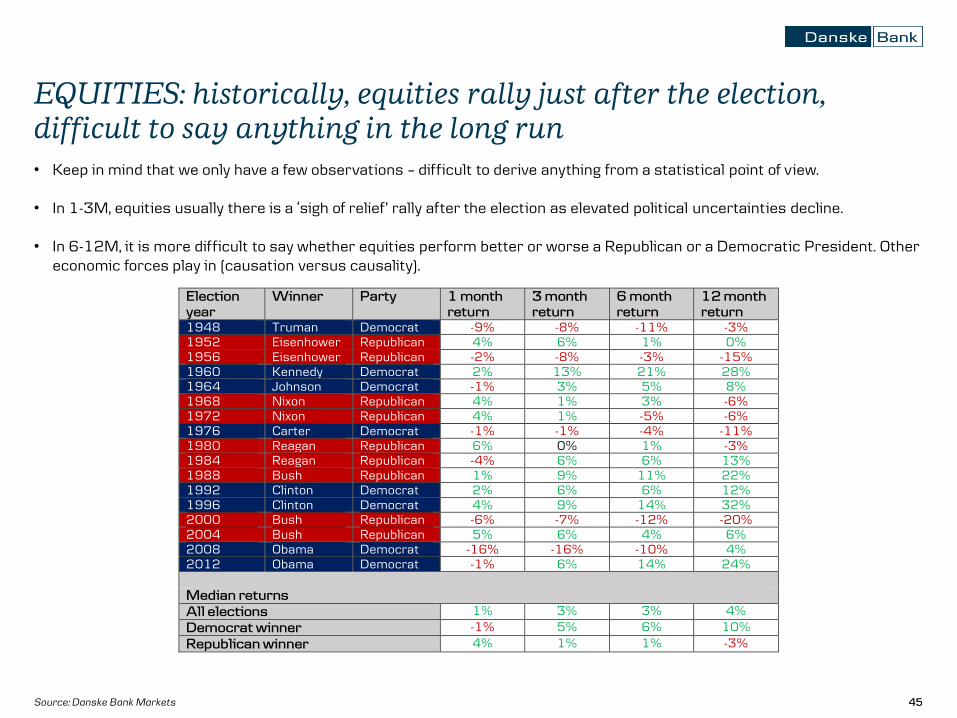
• Keep in mind that we only have a few observations – difficult to derive anything from a statistical point of view.
• In 1-3M, equities usually there is a ‘sigh of relief’ rally after the election as elevated political uncertainties decline.
• In 6-12M, it is more difficult to say whether equities perform better or worse a Republican or a Democratic President. Other economic forces play in (causation versus causality).
EQUITIES: historically, equities rally just after the election,
• In our view, the outcome of the upcoming US election is by no means trivial when it comes to global regional allocation and US sector allocation. Overall, we see a Clinton win as positive for global equities; Trump as negative for global equities.
• As prior US presidential elections have shown, uncertainty typically rises sharply ahead of the election and this time around we expect this pattern to be repeated. Hence, uncertainty will prevail until election day.
• If Hillary Clinton wins the upcoming US election, we would continue with our current position: long eurozone equities versus short US equities.
• Clinton has turned more protectionist but as explained previously, it is not a given how protectionist she would actually be if elected.
• In terms of US domestic sector exposure, we think the impact of fiscal easing would be negligible as she has proposed to increase taxes as well; hence, no particular emphasis on domestic sectors.
• We expect financials to underperform as they would face further regulation. Healthcare, on the other hand, is likely to outperform as we do not think Clinton will be able to get a price control mechanism passed through Congress.
EQUITIES: election outcome will be decisive for exposure
4747
• Under the assumption that Donald Trump wins, we would suggest entering a long US versusa short eurozone position. We will also be bullish on US equities relative to EM equities incase of a Trump win.
• Our view is largely driven by the protectionist policies advocated by Donald Trump that onrelative basis will benefit the US corporates more than their euro zone peers, as a largershare of their revenue stem from domestic sales.
• In terms of US sector exposure, we think that the expansionary fiscal policy should benefitsectors such as industrials and basic materials.
• The suggested regulation from Clinton on energy could lead to a sell-off in this sector.
EQUITIES: election outcome will be decisive for exposure
4848
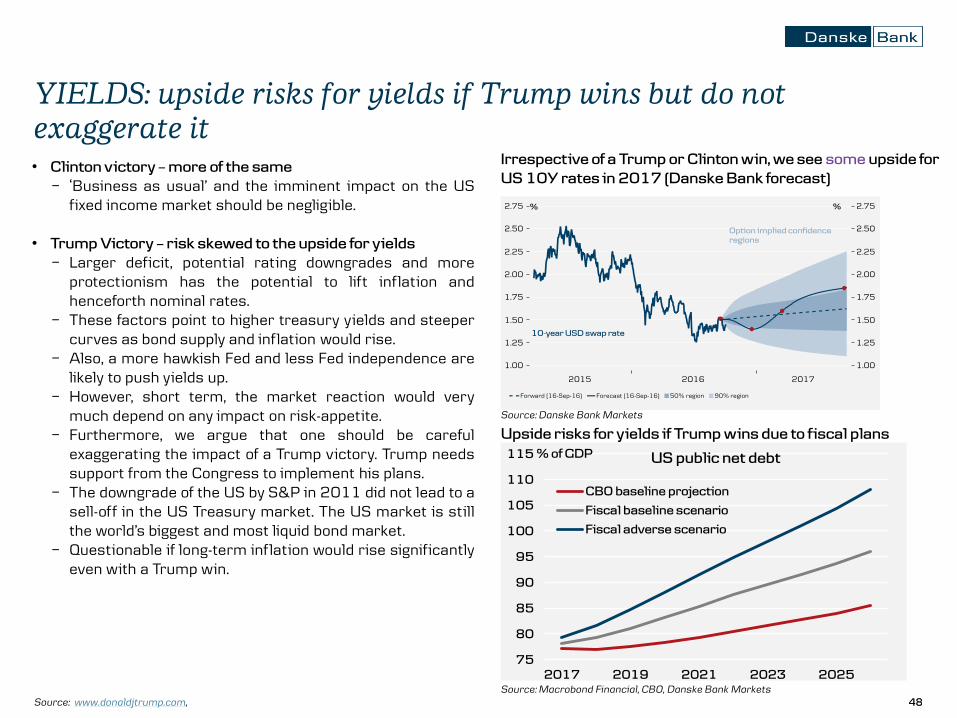
• Clinton victory – more of the same
− ‘Business as usual’ and the imminent impact on the USfixed income market should be negligible.
• Trump Victory – risk skewed to the upside for yields
− Larger deficit, potential rating downgrades and moreprotectionism has the potential to lift inflation andhenceforth nominal rates.
− These factors point to higher treasury yields and steepercurves as bond supply and inflation would rise.
− Also, a more hawkish Fed and less Fed independence arelikely to push yields up.
− However, short term, the market reaction would verymuch depend on any impact on risk-appetite.
− Furthermore, we argue that one should be carefulexaggerating the impact of a Trump victory. Trump needssupport from the Congress to implement his plans.
− The downgrade of the US by S&P in 2011 did not lead to asell-off in the US Treasury market. The US market is stillthe world’s biggest and most liquid bond market.
− Questionable if long-term inflation would rise significantlyeven with a Trump win.
Irrespective of a Trump or Clinton win, we see some upside for
US 10Y rates in 2017 (Danske Bank forecast)
YIELDS: upside risks for yields if Trump wins but do not
exaggerate it
Upside risks for yields if Trump wins due to fiscal plans
75
80
85
90
95
100
105
110
115
2017 2019 2021 2023 2025
% of GDP
CBO baseline projection
Fiscal baseline scenario
Fiscal adverse scenario
US public net debt
Source: www.donaldjtrump.com,
Source: Macrobond Financial, CBO, Danske Bank Markets
This research report has been prepared by Danske Bank Markets, a division of Danske Bank A/S (‘Danske Bank’). The authors of this presentation are listed on the first page.
Each research analyst responsible for the content of this research report certifies that the views expressed in this research report accurately reflect the research analyst’s personal view about the financial instruments and issuers covered by the research report. Each responsible research analyst further certifies that no part of the compensation of the research analyst was, is or will be, directly or indirectly, related to the specific recommendations expressed in the research report.
Regulation
Danske Bank is authorised and subject to regulation by the Danish Financial Supervisory Authority and is subject to the rules and regulation of the relevant regulators in all other jurisdictions where it conducts business. Danske Bank is subject to limited regulation by the Financial Conduct Authority and the Prudential Regulation Authority (UK). Details on the extent of the regulation by the Financial Conduct Authority and the Prudential Regulation Authority are available from Danske Bank on request.
The research reports of Danske Bank are prepared in accordance with the Danish Finance Society’s rules of ethics and the recommendations of the Danish Securities Dealers Association.
Conflicts of interest
Danske Bank has established procedures to prevent conflicts of interest and to ensure the provision of high-quality research based on research objectivity and independence. These procedures are documented in Danske Bank’s research policies. Employees within Danske Bank’s Research Departments have been instructed that any request that might impair the objectivity and independence of research shall be referred to Research Management and the Compliance Department. Danske Bank’s Research Departments are organised independently from and do not report to other business areas within Danske Bank.
Research analysts are remunerated in part based on the overall profitability of Danske Bank, which includes investment banking revenues, but do not receive bonuses or other remuneration linked to specific corporate finance or debt capital transactions.
Financial models and/or methodology used in this research report
Calculations and presentations in this research report are based on standard econometric tools and methodology as well as publicly available statistics for each individual security, issuer and/or country. Documentation can be obtained from the authors on request.
Risk warning
Major risks connected with recommendations or opinions in this research report, including a sensitivity analysis of relevant assumptions, are stated throughout the text.
Date of first publication
See the front page of this research report for the date of first publication.
General disclaimerThis research has been prepared by Danske Bank Markets (a division of Danske Bank A/S). It is provided for informational purposes only. It does not constitute or form part of, and shall under no circumstances be considered as, an offer to sell or a solicitation of an offer to purchase or sell any relevant
financial instruments (i.e. financial instruments mentioned herein or other financial instruments of any issuer mentioned herein and/or options, warrants,
rights or other interests with respect to any such financial instruments) (‘Relevant Financial Instruments’).
The research report has been prepared independently and solely on the basis of publicly available information that Danske Bank considers to be reliable.
While reasonable care has been taken to ensure that its contents are not untrue or misleading, no representation is made as to its accuracy or
completeness and Danske Bank, its affiliates and subsidiaries accept no liability whatsoever for any direct or consequential loss, including without limitation any loss of profits, arising from reliance on this research report.
The opinions expressed herein are the opinions of the research analysts responsible for the research report and reflect their judgement as of the date
hereof. These opinions are subject to change and Danske Bank does not undertake to notify any recipient of this research report of any such change nor of any other changes related to the information provided in this research report.
This research report is not intended for, and may not be redistributed to, retail customers in the United Kingdom or the United States.
This research report is protected by copyright and is intended solely for the designated addressee. It may not be reproduced or distributed, in whole or in part, by any recipient for any purpose without Danske Bank’s prior written consent.
Disclaimer related to distribution in the United StatesThis research report was created by Danske Bank A/S and is distributed in the United States by Danske Markets Inc., a U.S. registered broker-dealer and
subsidiary of Danske Bank A/S, pursuant to SEC Rule 15a-6 and related interpretations issued by the U.S. Securities and Exchange Commission. The
research report is intended for distribution in the United States solely to ‘U.S. institutional investors’ as defined in SEC Rule 15a-6. Danske Markets Inc. accepts responsibility for this research report in connection with distribution in the United States solely to ‘U.S. institutional investors’.
Danske Bank is not subject to U.S. rules with regard to the preparation of research reports and the independence of research analysts. In addition, the
research analysts of Danske Bank who have prepared this research report are not registered or qualified as research analysts with the NYSE or FINRA but satisfy the applicable requirements of a non-U.S. jurisdiction.
Any U.S. investor recipient of this research report who wishes to purchase or sell any Relevant Financial Instrument may do so only by contacting Danske
Markets Inc. directly and should be aware that investing in non-U.S. financial instruments may entail certain risks. Financial instruments of non-U.S. issuers may not be registered with the U.S. Securities and Exchange Commission and may not be subject to the reporting and auditing standards of the U.S.