Trust, Cooperation, and Implementation of Sustainability Programs: The Case of Local Agenda 21 Ann L. Owen* [email protected]Julio Videras [email protected]September 2007 Abstract This paper provides evidence of the role of trust in ensuring desirable economic outcomes. We examine the implementation of Local Agenda 21, a regional sustainability initiative that requires the coordination of diverse decision-makers, in a sample of approximately 66 developing and industrialized countries. We use a game theoretic framework to motivate our empirical study of the number of Local Agenda 21 programs implemented across countries. We find that higher levels of aggregate trust are associated with more communities adopting a program that requires coordination of multiple stakeholders. We also find that more programs are adopted when the country’s institutional structure may reduce the cost of coordination and when the benefits of the program, measured by environmental quality, would be expected to be greater.
Transcript
Trust, Cooperation, and Implementation of Sustainability Programs:
This paper provides evidence of the role of trust in ensuring desirable economic outcomes. We examine the implementation of Local Agenda 21, a regional sustainability initiative that requires the coordination of diverse decision-makers, in a sample of approximately 66 developing and industrialized countries. We use a game theoretic framework to motivate our empirical study of the number of Local Agenda 21 programs implemented across countries. We find that higher levels of aggregate trust are associated with more communities adopting a program that requires coordination of multiple stakeholders. We also find that more programs are adopted when the country’s institutional structure may reduce the cost of coordination and when the benefits of the program, measured by environmental quality, would be expected to be greater.
1 Introduction
Recent contributions to the economics literature have emphasized the influence of culture
on economic outcomes. (See for example, Guiso, Sapienza and Zingales, 2006; Fernandez and
Fogli, 2005; or Stulz and Williamson, 2003.) Trust is one aspect of culture that has received
particular attention. In a seminal paper, Knack and Keefer (1997) found evidence that countries
with higher levels of trust have higher levels of investment, possibly due to the reduced need for
costly contracts and regulations. Following on this work, several other researchers have
examined trust as a substitute for formal institutions. See, for example, Knack and Zak (2001);
Glaeser, Laibson, Sheinkman and Soutter (2000); or La Porta, Lopez-de-Silanes, Schleifer, and
Vishny (1997).
In this paper, we provide empirical evidence of the importance of trust in ensuring
desirable economic outcomes. We present a stylized one-shot coordination game and develop
hypotheses that we test in a sample of approximately 60 developing and industrialized countries.
In particular, we examine the implementation of Local Agenda 21, an initiative that focuses on
regional sustainable development projects and requires the coordination of diverse decision-
makers. We estimate count data models and find that a country’s level of trust is an important
determinant of the number of communities that implement such sustainability efforts. We also
find that greater potential benefits of sustainability programs are correlated with more programs
and that the benefits necessary to implement the programs are smaller when there is more trust.
Our work contributes to three areas of research. First, it relates to the literature
examining how social capital influences economic outcomes in general and environmental
outcomes in particular. Pretty and Ward (2001) discuss case studies that show how collective
action can help improve environmental quality. Owen and Videras (2006) find that in low-
income countries civic-minded behavior is particularly important in generating pro-environment
attitudes. Grafton and Knowles (2004) focus on environmental quality outcomes and find little
evidence that national measures of social capital influence a country’s environmental
performance. A related literature explores the role of social capital in natural resources
management. Hodler (2006) provides empirical evidence that ethnic fractionalization is a cause
of the resource curse because fractionalization leads to increased fighting between rival groups,
less productive activity, and weaker property rights. Torvik (2002) considers how abundance of
We contribute to the literature on culture and the environment by examining the
determinants of cross-country adoption of sustainable development policies. We expect the link
between social capital and policy adoption to be stronger than the link between environmental
outcomes and social capital, as in Grafton and Knowles (2004), because environmental quality is
the result of complex interactions between policies and technological and structural factors. In
addition, social capital is particularly relevant for sustainable development policies that involve a
diversity of policy goals (economic, ecological, and social) and require the coordination of
multiple decision-makers with diverse preferences (Boulanger and Bréchet, 2005). Indeed, we
find strong and robust empirical evidence that a country’s level of trust is a determinant of how
many communities implement Local Agenda 21, an initiative that requires local authorities to
engage and consult with multiple community constituencies.
Our work also contributes to the literature on endogenous policy formation. Fredriksson,
Neumayer, Damania, and Gates (2005) examine lead content in gasoline for 104 developing and
industrialized countries. Damania, Fredriksson, and List (2003) also study the determination of
lead content per gallon of gasoline in a panel of 48 developing and developed countries.
Fredriksson, Mani, and Wollscheid (2006) present results from cross-country analyses of 90
developing countries using a policy assessment index from the World Bank. The authors
examine how the level of centralization of decision making influences “environmental capacity”
and find that federalism has a negative effect on environmental capacity but this effect is reduced
as trade intensity/openness increases.
Our work departs from these studies in that we examine the determination of policies that
are implemented at the municipal level and, thus, are likely driven by additional factors than
those influencing federal environmental stringency. To the extent that the practice of
environmental policy shifts from federal to local authorities, our analysis is a first step in
understanding whether appeals to local communities to set their own policy goals are likely to be
successful.
Finally, this paper provides additional empirical evidence on the role of trust in
coordination games. For example, Cabon-Dhersin and Ramani (2004) show how trust influences
the probability of R&D cooperation, while Van Huyck, Battalio, and Beil (1990) use
experimental evidence to show that coordination failure can result from players attributing too
2
much risk to the payoff-dominant equilibrium because of uncertainty regarding the other players’
actions.
In what follows, we provide more detail on the Local Agenda 21 program, we develop a
simple theoretical framework that guides the empirical analysis of the adoption of the Local
Agenda 21 programs, present our empirical results, and conclude.
2 Local Agenda 21
The United Nations Conference on Environment and Development (UNCED) that took
place in Rio de Janeiro in 1992 called for international cooperation to reverse the trend in global
climate change. The 1992 UNCED, also known as the Earth Summit, approved four treaties: the
Rio Declaration, the Forest Principles, the Biodiversity Treaty, and Agenda 21. Agenda 21 is a
global plan to help countries design and implement strategies to reduce emissions of greenhouse
gases. Chapter 28 of Agenda 21 proposes Local Agenda 21 (LA21).
LA21 is a decentralized initiative that focuses on the role of local governments in the
implementation of sustainability programs. The overall goal of LA21 is to engage multiple
stakeholders within a community in sustainability decision-making through participatory target
setting and assessment. As determined by the International Council for Local Environmental
Initiatives (ICLEI), LA21 municipalities must fulfill several criteria: (1) the process must include
the participation of multiple constituencies in the community, (2) stakeholders need to reach a
consensus regarding social, environmental, and economic objectives, (3) the process must
provide a forum for discussion and overseeing, (4) the process must include a long-term action
plan, and (5) the process must establish a framework for reporting and monitoring (ICLEI,
2002).
LA21 programs address water resource management, transportation, air quality, energy
management, and solid waste reduction, among others. Community development and the
alleviation of poverty are additional goals that some communities integrate into their plans.
Although local governments (cities, towns, or counties) generally lead the efforts toward the
implementation of LA21, community groups, NGOs, businesses, universities, or even
individuals, have also acted as the driving force (ICLEI, 2002). Independent of who acts as the
leader, LA21 initiatives require participatory assessment and decision-making. This emphasis on
encouraging and enabling participation by multiple stakeholders is a manifestation of the
3
diversity of policy goals that sustainable development entails and of the interest for procedural
justice as a criterion in decision-making at the local, national, and international level (Paavola
and Adger, 2006).
Although there are case studies that examine the performance of some LA21 programs
(Southey, 2001; Evans and Theobald, 2003; and Moser, 2001), the literature has not explored the
reasons for adoption. Thus, our paper makes a contribution by evaluating the implementation of
programs that require coordination among multiple stakeholders generally, as well as the
adoption of LA21 programs specifically. Rather than using case studies, our methods rely on
aggregate data and examine country-level characteristics that are associated with more
communities within a country adopting these programs. Ideally, we would also want to
complement this analysis with more disaggregated data that allowed an analysis of the
characteristics of the specific communities within each country in which LA21 programs take
place. However, such data do not exist. Although we cannot draw sharp conclusions from the
aggregate analysis about the determinants of adoption by localities, our analysis provides
empirical evidence that is consistent with our simple theoretical framework and can help explain
how economic, structural, and social factors affect the success of sustainability initiatives.
3 The Conceptual Framework
An important aspect of Local Agenda 21 is the coordination and engagement of multiple
stakeholders. Although coordination benefits the community at large, it is costly. In addition,
coordination is risky when defection is a rationalizable strategy. The incentives and likelihood of
coordination can be modeled using the one-shot game known as the Stag Hunt game (also known
as the Assurance Game). There are two symmetric Nash equilibria in this game: all parties
coordinate or all parties defect. In this situation, trust of others’ commitments is necessary to
achieve the Pareto-dominant equilibrium. Below, we provide a simple one-shot model in which
trust is exogenous. Although the level of trust that individuals have is the result of previous
interactions with others, in the context of this novel decision, agents enter the game with a pre-
determined level of trust.
4
We consider two identical agents.1 For each player, the cost of committing to the
program is denoted c. The direct benefits of the program are a public good that accrue only
when the two parties coordinate. Let b be the direct benefits that occur when the program is
implemented. If cooperation does not occur and the program is not implemented, these benefits
do not accrue. In addition, individuals who cooperate may also receive additional benefits from
cooperating. These benefits may be thought of as a “warm glow” and we denote them with a g.
We assume that b, g, and c are positive, c>b, c> g, and c<b+g. These assumptions imply that
the net benefits are positive only when there is coordination and when individuals receive a
warm glow. The payoff matrix for this situation is as follows.
Figure 1
Coordinate Defect b+g-c 0
Coordinate
b+g-c g-c
g-c 0 Defect
0 0
Let p be the probability that one agent assigns to the event that the promise to invest
efforts in the program by the second player will be fulfilled. This probability is exogenous to the
game and is determined by the amount of trust that individuals have that others will fulfill
promises. In this case, coordination takes place in equilibrium if:
.0))(1()(b
gcpcgpcgbp −>⇒>−−+−+ (1)
Thus, coordination occurs if levels of trust are high enough to compensate for higher costs and
lower benefits. Alternatively, higher benefits and lower costs require less trust to exist in order
for coordination to be the equilibrium behavior.
A natural extension of the game above is to allow for the presence of opportunists in the
population. Consider a modification to the game in which one of the players is an opportunist
and does not receive a warm glow from cooperating. Specifically, let Player 1 be a free-rider
that does not receive a warm glow from cooperating. Then, the payoff matrix becomes:
1 For illustrative purposes, we model two player games. Extending the game to allow for more players should not affect the qualitative conclusions for which we seek empirical evidence.
5
Figure 2
Player 1 (free-rider)
Coordinate Defect b-c 0
Coordinate
b+g-c g-c
-c 0
Player 2
Defect
0 0
Note that because b < c, the dominant strategy for free-riders is always to defect.
From Player 2’s perspective, however, the optimal strategy depends on both trust that
people will do what they say, p, and the likelihood that they are playing against an opportunistic
player. Let s be the fraction of opportunistic players in the population. Then the non-
opportunist will coordinate if
[ ]bs
gcpcgscgpcgbps)1(
or0)())(1()()1(−−
>>−+−−+−+− (2)
Comparing Equation 2 to Equation 1, we see that the presence of free-riders has the effect
of lowering the expected benefit from coordination. Thus, for a given level of trust, p, if the
proportion of free-riders, s, is too high, the dominant strategy for Player 2 is to defect as well.
Conversely, if there are more free-riders, a higher level of trust is required in order for
cooperation to occur.
This simple model motivates our methodological approach. Since our dependent variable
is the number of Local Agenda 21 programs countries adopt, we estimate models for count
outcomes. In addition, the conceptual framework indicates that trust, the presence of free riders,
and the costs and benefits of implementing the program matter. These observations motivate the
following hypotheses:
1. For a given expected cost-benefit ratio, higher levels of trust promote more
coordination.
2. For a given expected cost-benefit ratio and trust, higher levels of social
responsibility (fewer free riders) should be associated with more LA21 programs.
6
3. The model implies that higher levels of social responsibility require less trust in
order to coordinate and vice versa. Therefore, we expect the coefficient on an
interaction of trust and social responsibility to be negative.
4. Country-level characteristics that influence the benefits and costs of coordination
will affect the number of Local Agenda 21 programs that are implemented. In our
empirical framework, we include variables that control for a country’s capacity to
implement sustainability efforts such as per capita GDP and the extent to which
the existing policy framework emphasizes local or national control. In addition,
we include indicators of environmental quality that control for the potential
benefits of the program, on the idea that worse current environmental quality
would be associated with greater future benefit of the program.
5. The model also implies that as environmental quality deteriorates and the benefit
of implementing a successful Local Agenda 21 program increases, the level of
trust necessary for successful coordination declines. To test this hypothesis, we
include interaction terms between trust and the indicators of environmental
quality. We expect the coefficients of the interaction terms to be negative.
4 Empirical Evidence
4.1 The Empirical Model
Our measure of sustainability policy is the number of Local Agenda 21 (LA21) programs
in a country. Because these are count data, we estimate a negative binomial model. While a
Poisson regression might have also been appropriate, given the divergence between the mean and
the variance of the count variable, we present and discuss results from negative-binomial models
that account for overdispersion in the dependent variable.2 (See Table 1 for descriptive statistics
and the Appendix for a list of countries and key variables of interest by country.)
In addition, our small sample size requires an approach that addresses the issue of
potential outliers and influential observations. We take several steps to do so. First, we compute
jackknife standard errors. Second, we replicate our models excluding countries in the 90th
2 The Poisson regression model assumes that the mean of the distribution equals the variance. The negative binomial regression model accounts for overdispersion by adding a parameter that captures unobserved heteregoneity among observations. Both models have the same mean structure but the standard errors of the Poisson model are biased downwards. Likelihood-ratio tests suggest there is significant evidence of overdispersion in our models.
7
percentile of the distribution of programs. We also show that our results are robust to including
several different sets of control variables.
The data for our dependent variable are compiled by the International Council for Local
Environmental Initiatives and are available at the World Resources Institute’s EarthTrends
website. We observe the number of LA21 communities for 1996 and 2001. Availability of the
measure of trust limits our sample to 41 countries in 1996. In this sample, the average number of
programs is 39.9 and the standard deviation is 91.72 programs. For 2001, our sample consists of
66 countries with a sample mean of 54.3 and a standard deviation of 99.3 programs.
The predictions of our theoretical model suggest the independent variables in our
estimation. An important variable explaining coordination is the aggregate level of trust. To
measure trust, we use responses to a question from the World Values Survey (WVS) that asks if
“most people can be trusted.” We use these responses to calculate the proportion of the people in
each country that answer this question affirmatively.3 On average, only about 30 percent of
individuals in each country indicate that they believe that most people can be trusted. As the
table in the Appendix shows, there is considerable variation by country. Sweden and Denmark
have the most trusting people at 64 percent. Tanzania, Uganda, and the Philippines have the
least trusting people at 8 percent. Simple correlation coefficients between aggregate trust and
number of programs show a positive and strong relationship in 1996, the coefficient is .61 and is
statistically significant at the 1 percent level, while the relationship is weaker but still significant
at the 1 percent level in 2001 when the correlation coefficient equals .41. This positive
association is not driven by those countries with many programs and high level of trust such as
Sweden and Norway. When we drop countries in the 90 percentile of the distribution of LA21
programs in 1996, the correlation coefficient between trust and the number of programs is .56
and significant at the 1 percent level. For 2001, when we drop countries in the 90th percentile of
the distribution of LA21 programs, the correlation coefficient between trust and the number of
programs is .23 and significant at the 8 percent level.
In addition to the impact of trust, the model also indicates that the presence of free-riders
can hinder the extent of coordination. We use the answers to four questions about justifiable
3 We use the sampling weights provided by the WVS to calculate this proportion and all other aggregate statistics from the WVS. The WVS has been conducted during four separate time periods. We use wave 2 values as predictors of LA21 activity in 1996 and wave 4 values as predictors of LA21 communities in 2001. Wave 2 of the WVS was conducted over the time period 1990-1993 and wave 4 was conducted during 1999-2001.
8
behavior in the WVS to calculate an index of civic behavior.4 These questions ask if it is ever
justifiable to 1) cheat on taxes, 2) ride public transportation without paying the fare, 3) take a
bribe in the course of official duties, or 4) claim government benefits to which you are not
entitled. For each behavior that an individual says is “never justifiable,” we assign a value of
one and add the responses to each question to obtain an index of civic behavior which we call
CIVIC. At the individual level, the responses vary from 0 to 4, with 0 being associated with the
most opportunistic behavior and 4 the least. We then average the individual responses within
each country, using the sampling weights provided by the WVS, to obtain a country level
measure of social responsibility. Although higher levels of CIVIC means that free-riding may be
less frequent, this variable is just a proxy for the fraction of the population that will receive a
warm glow from cooperating. The empirical model also includes an interaction term between
CIVIC and TRUST. We expect the coefficient on this term to be negative since according to our
conceptual framework a lower level of trust is required for cooperation where civic behavior is
more prevalent.
Our model also highlights the importance of the implementation cost in the LA21
decision and we include the logarithm of per capita GDP as a proxy for a country’s quality of
institutions and opportunity costs of implementing sustainable development policies.5 We expect
per capita GDP will be positively correlated with the implementation of LA21 programs.
Population density may also be related to implementation cost if people living in densely
populated areas may be less likely to feel connected to their neighbors and less likely to
coordinate behavior.6 However, higher population density may also be related to benefits if
sustainable policies are more beneficial in urban settings. Therefore, although density could
increase implementation costs, its effect is a priori ambiguous. A related variable included in all
estimations is the population of the country (in logs) to control for scale effects. Everything else
equal, we should expect more programs as a country’s population increases.
Local governments usually lead LA21 efforts and having an institutional framework that
relies on local governments may reduce the cost of implementation of LA21. To control whether
a country’s institutional framework emphasizes local or national control, we follow Fredriksson,
4 A similar index was first used by Knack and Keefer (1997). 5 The link between GDP and institutional quality is the subject of a vast literature. See Acemoglu, Johnson and Robinson (2001) as an example of this work. 6 We also used urban population as an alternative independent variable with no change in the main results.
9
Mani, and Wollscheid (2006) and include a dummy variable for federalism. We are again
cautious in making a prediction, however, because communities in countries with a federal
structure might have less need to implement these types of programs, making the effect of
federalism difficult to anticipate.
Finally, our model highlights the importance of the benefits of these programs and we
hypothesize that countries with more environmental degradation will invest more local efforts
into sustainability because the benefits of the programs would be greater. We use three main
(SO2), and energy use (ENERGY) from the World Bank’s World Development Indicators data
base and the World Resources Institute’s EarthTrends website. CO2 measures kilograms of
carbon dioxide emissions per dollar of GDP. ENERGY measures average kilograms of oil-
equivalent energy intensity per dollar of GDP. SO2 measures thousand metric tons of sulfur
dioxide per current million $US. These variables are measured for 1996 and 2001.7 Based on
the results of the theoretical model, we also include interaction terms between the measures of
environmental quality and trust and expect negative coefficients because the larger the potential
benefits from the program the lower the level of trust required to coordinate agents is.
Summary statistics for all the variables used in our analysis are reported in Table 1. Key
variables in our analysis that are derived from the World Values Survey limit our sample
substantially. The small sample requires parsimonious specifications and motivates robustness
checks which we report later in the paper. Additional variables that were added in our sensitivity
analysis are related to institutional capacity, environmental preferences, and trade. Specifically,
we also estimated models adding a measure of civil liberties and political rights (from the
Freedom House indices) and the number of international NGOs present in the country. We used
trade openness, (exports + imports)/GDP, as an explanatory variable following Damania,
Fredriksson, and List (2003) who find that trade increases environmental stringency in a sample
of developing and developed countries. We also added secondary school enrollment rates in
some specifications to allow for the fact that education may impact coordination by affecting
preferences for the environment and the cost of coordination, and it may be correlated with trust.
7 Due to data availability, we use 1995 and 2000 sulfur dioxide emissions to predict 1996 and 2001 LA21 programs.
10
4.2 Results
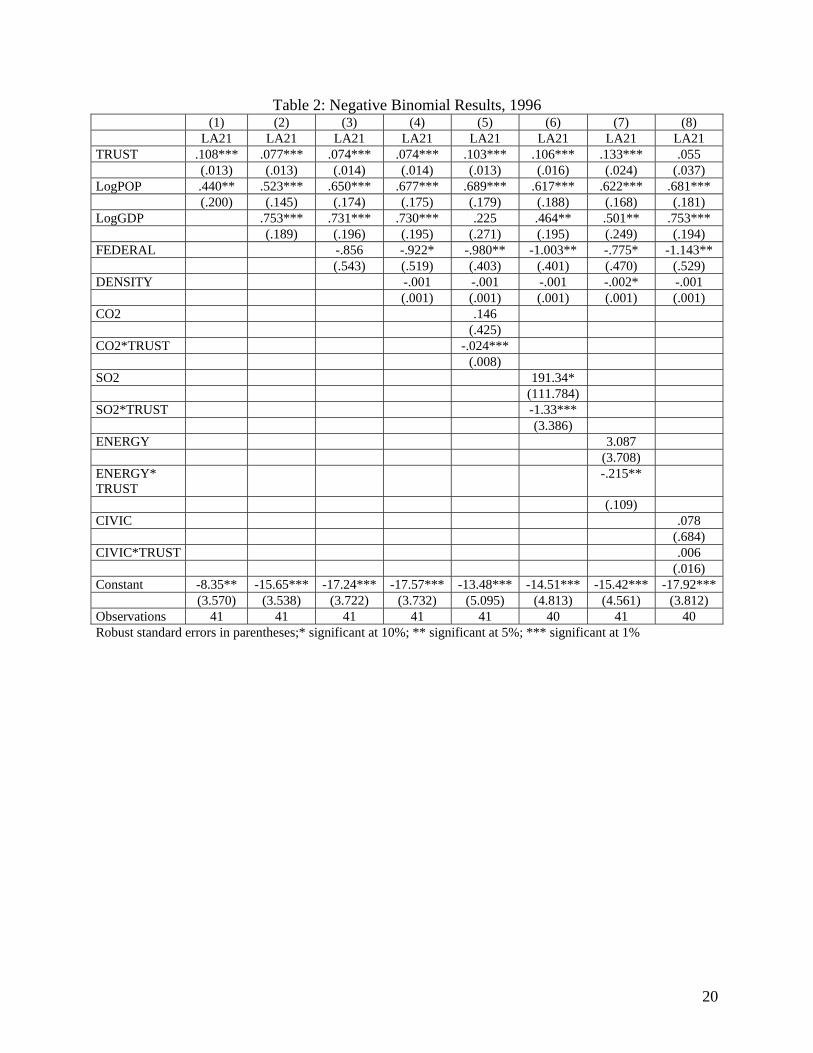
Table 2 presents results for the 1996 sample and Table 3 presents the results for 2001.
The first column of each table shows the coefficient estimates on TRUST and the logarithm of
population. The next columns add controls to check for the robustness of the positive impact of
aggregate trust on the expected number of LA21 programs by country. The 1996 sample has 41
countries while the 2001 sample has 66 countries (missing data for some independent variables
limit the sample to 60 countries in some specifications).
The effect of aggregate trust on sustainability efforts can be seen in the first row of each
table. The results in Table 2 show that for the sample of 41 countries, trust has a positive and
statistically significant impact of the number of LA21 programs. Using the results in column 4
of Table 2, we calculate that a 1 percent increase in TRUST increases the expected mean of the
dependent variable by almost 8 percent. For the larger sample of countries in 2001, the
estimated coefficients on TRUST are positive but smaller. They are insignificant in three
specifications but return to significance when the models include a more complete set of
controls, especially those measuring environmental quality. In addition, for the 2001 sample,
trust also impacts the expected number of LA21 programs through its interaction terms with the
measures of environmental quality. Although trust matters in both samples, there are some
differences in the way in which it enters the specification significantly across the two samples.
To get some insight into the reasons for this, we also estimated the models with 2001 data only
for those countries for which we also have information in 1996. (Results are available from the
authors upon request.) We find that the results are very similar in magnitude and significance to
those in Table 2. This leads us to suggest that the more diverse set of countries in the 2001
sample might make including the interaction between trust and environmental quality important
and may help us measure with more precision these interaction effects. 8
The level of development and institutional features of the economy also affects
sustainability efforts, with GDP per capita having a positive effect, indicating that more
developed countries are more likely to have more LA21 programs. This effect is highly 8 There are 38 countries that appear both in the 1996 sample and in the 2001 sample. For these countries we also estimated random-effects negative binomial models (Hausman tests indicated there were no evidence the random-effects models were misspecified). These models also included a year dummy for 2001. As expected, everything else equal, there were on average more programs in 2001 than in 1996. Qualitatively, these models produced the same results as the cross-section models for the 1996 sample but the coefficient estimates were lower. Nonetheless, the estimates of TRUST were statistically significant at the 5 or 10 percent level. Given that the countries in this panel are very similar to the countries in the 1996 cross-section, these results are to be expected.
11
significant both in a statistical and an economic sense. For example, using the results in column
4 of Table 2, we calculate that a 1 percent increase in the logarithm of GDP is estimated to
increase the expected mean of programs by 108 percent. Although this seems to be a large
effect, a 1 percent increase in the logarithm of GDP implies a significant change in per capita
GDP.9 In addition, to the extent that GDP is a proxy for the quality of institutions, this variable
captures more than just a country’s level of economic development. On average, countries with
federal systems implement fewer LA21 programs. The estimates of FEDERAL are consistently
negative and statistically significant in most specifications at the 10 and 5 percent levels. This
result suggests that when local governments are weaker, LA21 coordination is more likely to be
implemented, perhaps as a substitute for actions taken by local governments.
As expected, population is positively correlated with the number of LA21 programs.
Again, using the results in column 4 of Table 2, we calculate that a 1 percent increase in the
logarithm of population is estimated to increase the expected mean of the dependent variable by
almost 97 percent.10 The coefficient estimates on density are negative across all specifications
and are statistically significant in the larger sample. This finding might be explained by the fact
that coordination is more difficult in densely populated areas. Such a result is potentially
troubling because sustainability policies are possibly more necessary in urban settings.
The model predicts that a greater benefit from coordination would increase the likelihood
of implementation, holding all other things constant. Higher levels of carbon dioxide, sulfur
dioxide, and energy use would indicate a worse environmental quality in those countries and
greater future benefit from environmental protection. As predicted, the coefficient estimates on
these variables are positive for 1996 and 2001 but are significant at the 5 percent level or better
in the larger sample only. Consistent with the predictions of the model, both for 1996 and 2001
we find that the coefficients on the interaction terms between trust and the measures of
environmental quality are negative and statistically significant. In other words, lower trust
implies that the benefits of the program have to be larger in order for the program to be
implemented.
9 For example, in this sample of 41 countries a 1 percent increase in the logarithm of GDP implies approximately a 10 percent increase in per capita GDP from the median. 10 A 1 percent increase in the logarithm of population implies an increase of approximately 2,600,000 people using the median of the distribution of population as the reference point.
12
The results in Tables 2 and 3 do not provide evidence for the prediction that social
responsibility should matter for implementation of LA21. In the last column of Table 2 and
Table 3, we find that civic responsibility is not statistically associated with the number of LA21
programs. In Table 3, column 8, the interaction term between TRUST and CIVIC is negative as
the model predicts but significant at the 10 percent level only. The point estimates are measured
with substantial imprecision. It may be difficult to disentangle the effect of trust and social
responsibility and it is possible that in this specification we are confounding the interpretation of
our results for TRUST and CIVIC. Glaeser, Laibson, Sheinkman and Soutter (2000) provide
experimental evidence that survey questions about trust of others actually reflect the respondents
own trustworthiness. At the aggregate level, more trustworthy people would still have a positive
effect on the implementation of Local Agenda 21 programs, however, if our aggregate measures
of TRUST capture the level of social responsibility, we may have difficulty identifying separate
effects for TRUST and CIVIC.
In sum, we find that, consistent with the hypotheses outlined in Section 2, 1) greater trust
is associated with more LA21 programs, 2) country level characteristics that may influence the
cost of implementation such as per capita GDP and the strength of local governments affect the
number of LA21 programs, 3) greater potential benefits of LA21 programs as measured by
environmental quality are correlated with more programs, and 4) when there is more trust, the
benefits necessary to implement the programs are smaller. We find no evidence that social
responsibility on its own is associated with more programs or that more social responsibility
lowers the amount of trust required to facilitate the coordination.
4.3 Sensitivity Analysis
Although the empirical results corroborate many of the predictions of our conceptual
framework, we are concerned that the results are derived from a small sample. We estimate a
number of alternative models to verify that the results are robust to changes in specification and
sample. First, we compute jackknife standard errors to provide confidence that our results are
not driven by individual countries.11 Table 4 reports the results from selected models for 1996
(columns 1 to 4) and 2001 (columns 5 to 8). Although the standard errors computed with the
jackknife procedure are larger than those reported previously, the main inferences we can draw
11 The jackknife technique computes coefficient estimates leaving out one country at a time.
13
regarding the impact of trust are similar. For 1996, the coefficient on TRUST is statistically
significant at the 1 percent level, however, the interaction terms with SO2, CO2, and ENERGY
are now statistically insignificant. Also, the standard error of the logarithm of GDP is measured
with more uncertainty. Thus, it appears that in this small sample, inferences about income per
capita and environmental quality are sensitive to individual countries. In the larger 2001 sample,
however, the coefficients on sulfur dioxide emissions and its interaction with TRUST are still
significant at the 1 percent while carbon dioxide emissions and the interaction with TRUST are
significant at the 10 percent and 5 percent levels. It is also the case for this sample of countries
that our conclusion about the effect of per capita GDP is not sensitive to individual observations.
We continue exploring how individual countries might affect our results by dropping
from the sample countries in the 90th percentile of the distribution of LA21 programs. For 1996,
we exclude Denmark, the United Kingdom, the Netherlands, Norway, and Sweden. For 2001,
we drop Denmark, Spain, the United Kingdom, Italy, Korea, Finland, and Sweden. We present
the results in Table 5 (columns 1 to 4 for the 1996 sample and columns 5 to 8 for the 2001
sample). The coefficients on TRUST are lower but still statistically significant at the 1 percent
level in 1996. Using the results in column 1 of Table 5, we calculate that a 1 percent increase in
TRUST increases the expected mean of the dependent variable by a 4.5 percent. For the same
model and full sample in 1996, the effect was almost 8 percent. Thus, although dropping these
observations reduces the magnitude of the effect, trust still matters for these countries. The
magnitudes of GDP and population are also lower but economically significant (for example,
using the results in column 1 of Table 5, we calculate that a 1 percent increase in the logarithm of
GDP is estimated to increase the expected mean of programs by 73 percent). The models for the
2001 sample show that, even after excluding 7 countries, trust matters through its interaction
with SO2, CO2, and ENERGY.
Finally, we investigate whether the results we attribute to aggregate levels of trust are
robust to including additional controls. Some have argued that empirical measures of trust are
really just proxies for the quality of institutions. We demonstrate that our conclusions are robust
to including a measure of general institutional quality. A similar argument can be made about
the relationship between aggregate trust and levels of education and we experiment with this
measure as well. Finally, we also include two other controls that researchers have found to be
significant predictors of environmental policies: NGOs and trade openness. Table 1 presents
14
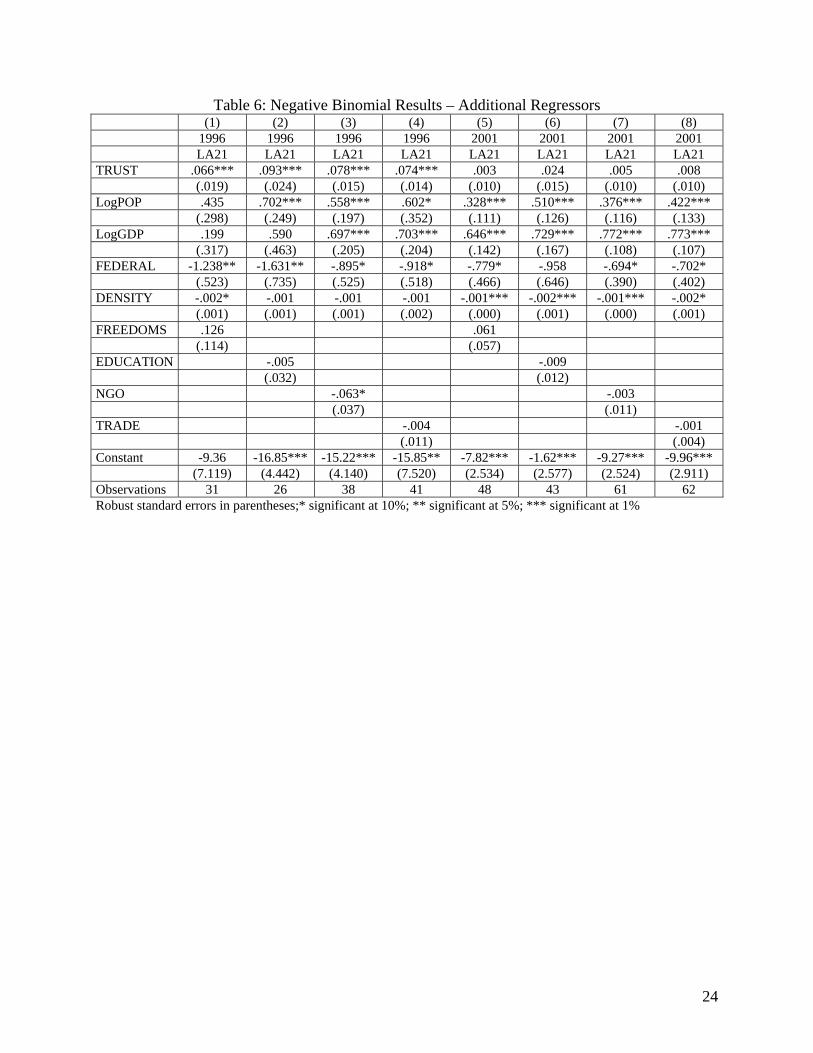
descriptive statistics for these variables and Table 6 presents the results. The Freedom House
indices are proxies of civil liberties and political rights as experienced by a country’s citizens and
should be related to overall institutional quality. We compute the variable FREEDOMS as the
sum of these two indices (re-scaled so that 14 represents the most free and 2 represents the least
free). The coefficient estimate on FREEDOMS is positive, as expected, but statistically
insignificant. In addition, there is evidence of collinearity as the standard error of the estimate
for GDP increases. Secondary school enrollment is negative but statistically insignificant. The
results for TRUST in the 1996 sample still hold, suggesting that quality of institutions and levels
of education are not omitted variables influencing the impact of TRUST in our original
regressions. (In results not reported in this table, we also find that the interaction terms between
trust and indicators of environmental quality are still statistically significant in the 2001 sample).
The number of international non-governmental organizations is negatively correlated with the
expected number of LA21 programs but the result is only statistically significant at the 10
percent level in the 1996 sample (columns 3 and 7). Trade openness is also statistically
insignificant (columns 4 and 8). While Damania, Fredriksson, and List (2003) found that trade
increased the stringency of lead content per gallon of gasoline in a panel of 48 developing and
developed countries, our measure of environmental policy refers to local sustainability efforts
rather than country-wide policies.
In summary, we find robust evidence that there is a positive relationship between levels
of trust and sustainability efforts at the country level. For the sample of countries in 1996, trust
influences LA21 programs directly while for the 2001 sample trust matters through its
interaction with measures of environmental quality. These main results are robust to including
additional controls, excluding potential outliers, and computing jackknife standard errors.
5 Conclusion
In this paper, we have examined the determinants of the implementation of policies
toward sustainable development. We have provided a simple theoretical framework to motivate
the empirical approach to estimating the adoption of Local Agenda 21 programs. As predicted
by the model, trust is critical to the implementation of the programs. The effect is economically
meaningful. For a sample of 41 countries in 1996, a 10 percent increase in aggregate levels of
trust implies almost a 80 percent increase in the expected number of programs and even when we
15
exclude potential outliers, a 10 percent increase in trust implies a 45 percent increase the
expected number of LA21 programs. For a sample of 63 countries in 2001, the effect of trust is
apparent when we control for the potential benefits of the programs: although when the benefits
are greater more municipalities undertake these sustainability efforts, negative interaction terms
suggest that higher levels of trust are necessary as the benefits decrease. We also find that the
level of GDP is positively related to the number of Local Agenda 21 programs, probably because
higher income levels lower the cost of implementation. These conclusions are robust to changes
in specification and sample size.
These results have implications for the design of policies and programs intended to
improve environmental quality. The findings suggest that culture can affect the success of
sustainability programs when policy adoption requires the coordination of multiple stakeholders.
In countries in which trust is low, voluntary cooperation may be less likely to occur, suggesting
that programs that depend on it will be ineffective. When low trust is an impediment, programs
should be designed to reduce the cost of coordination and implementation. Our findings also
provide evidence that an emphasis on participatory decision-making might be particularly
important when the actual or perceived benefits from sustainability efforts are low.
16
6 References Acemoglu, Daron, Simon Johnson, and James Robinson, 2001, “The colonial origins of comparative development: an empirical investigation,” American Economic Review 91(5): 1369-1401. Boulanger, Paul-Marie, and Thierry Bréchet, 2005, “Models for policy-making in sustainable development: The state of the art and perspectives for research,” Ecological Economics, 55: 337-350. Cabon-Dhersin, Marie-Laure and shyama V. Ramani, 2004, “Does trust matter for R&D cooperation? A game theoretic examination,” Theory and Decision 57: 143-180. Damania, Richard, Fredriksson, Per G., and John A. List, 2003, “Trade liberalization, corruption, and environmental policy formation: Theory and evidence,” Journal of Environmental Economics and Management, 46: 490-512. Evans, Bob, and Kate Theobald, 2003, “Policy and practice LASALA: Evaluating Local Agenda 21 in Europe,” Journal of Environmental Planning and Management, 46(5): 781-794. Fernandez, Raquel, and Alessandra Fogli, 2005, “Culture: an empirical investigation of beliefs, work, and fertility,” NBER Working Paper No 11268. Fredriksson, Per G., Neumayer, Eric, Damania, Richard, and Scott Gates, 2005, “Environmentalism, democracy, and pollution control,” Journal of Environmental Economics and Management, 49:343-365. Fredriksson, Per G., Mani, Muthukumara, and Jim R. Wollscheid, 2006, “Environmental federalism: A panacea or Pandora’s box for developing countries?” World Bank Policy Research Working Paper 3847. Glaeser, Edward, David Laibson, Jose A. Scheinkman, and Christine Soutter, 2000, “Measuring Trust,” Quarterly Journal of Economics 115(3): 811-46. Grafton, R. Quentin and Stephen Knowles, 2004, “Social capital and national environmental performance: a cross-sectional analysis,” Journal of Environment and Development 13(4): 336-270. Guiso, Luigi, Paola Sapienza and Luigi Zingales, 2006, “Does culture affect economic outcomes?” Journal of Economic Perspectives 20(2): 23-48. Hodler, Roland, 2006, “The curse of natural resources in fractionalized countries,” European Economic Review 50: 1367-1386. Huyck, John B., Raymond C. Battalio, and Richard O. Beil, 1990, “Tacit Coordination Games, Strategic Uncertainty, and Coordination Failure,” American Economic Review 80(1): 234-248.
17
International Council for Local Environmental Initiatives (ICLEI), 2002, “Second Local Agenda 21 Survey,” Background Paper No. 15, Department of Economic and Social Affairs, United Nations. Knack, S. and Keefer, P. ,1997, “Does social capital have an economic payoff? A cross-country investigation,” Quarterly Journal of Economics 112(4), 1251-1288. Knack, Stephen, and Paul Zak, 2001, “Trust and Growth,” Economic Journal 111(470): 295-321. La Porta, R., F. Lopez-de-Silanes, A. Shleifer, and R. Vishny, 1997, “Trust in Large Organizations,” American Economic Review 87: 333-338. Moser, Peter, 2001, “Glorification, Disillusionment or the Way into the Future? The significance of Local Agenda 21 processes for the needs of local sustainability”, Local Environment, 6(4): 453-467. Owen, Ann L. and Julio Videras, 2006, “Civic cooperation, proenvironment attitudes, and behavioral intentions,” Ecological Economics 58: 814-829. Paavola, Jouni, and W. Neil Adger, 2006, “Fair adaptation to climate change,” Ecological Economics, 56: 594-609. Pretty, Jules and Hugh Ward, 2001, “Social capital and the environment,” World Development 29(2): 209-227. Stulz, Rene M. and Williamson, Rohan, 2003, “Culture, openness, and finance,” Journal of Financial Economics 70(3): 313-49. Southey, Sean (2001): “Accelerating sustainability; from agenda to action,” Local Environment, 6(4): 483-489. Torvik, Ragnar, 2002, “Natural resources, rent seeking and welfare,” Journal of Development Economics 67: 455-470.
18
Table 1: Summary Statistics
Description Countries, 1996
Mean Std. Dev.,
1996
Countries, 2001
Mean Std.
Dev., 2001
LA21 Local Agenda 21 municipalities 41 39.90 (91.72)
65 54.31 (99.26)
TRUST Percent of population who says most people can be trusted
41 33 (14)
65 27 (14)
Log(GDP) Log of GDP per capita (constant 1995 US$)
41 8.90 (1.35)
65 8.37 (1.56)
Log(POP) Log of Population 41 16.72 (1.82)
65 16.70 (1.71)
FEDERAL = 1 if country is federal 41 .31 (.47)
65 .2 (.40)
DENSITY Population per square mile 41 140.56 (203.85)
63 254.58 (861.22)
CIVIC Index of civic responsibility ( = 0 if all 4 free-riding behaviors are justifiable)
40 2.44 (.57)
48 2.44 (.64)
CO2 CO2 emissions (kg per 1995 US$ of GDP)
41 1.37 (1.38)
65 1.34 (1.28)
ENERGY Energy use per GDP (kg of oil equivalent per constant 1995 PPP $)
41 .30 (.17)
62 .28 (.17)
SO2 Emissions of sulfur dioxide (thousand metric tons per million current US$)
40 .006 (.007)
64 .004 (.005)
FREEDOMS Sum of Freedom House indexes, 14 = the most free and 2 = the least free
31 11.06 (3.68)
49 9.12 (4.10)
EDUCATION % secondary school enrollment 26 82.51 (13.79)
45 78.07 (18.24)
NGOs International non-governmental organizations per 1 million population
38 3.67 (8.37)
63 4.42 (10.23)
TRADE (Exports + Imports) as % of GDP 41 75.28 (38.58)
64 86.54 (49.51)
Sources: Data on LA21 municipalities come from two separate surveys conducted by The International Council for Local Environmental Initiatives. The data are available at the World Resources Institute’s EarthTrends website. Data on NGOs and SO2 emissions are also available at the World Resources Institute’s EarthTrends website. Data on GDP, urban population, education, CO2 emissions, and energy use come from The World Bank Development Indicators. The Freedom House indexes are available on-line at http://www.freedomhouse.org/research/survey2004.htm), New York: Freedom House. Data on TAX, trust, and civic responsibility come from the World Values Survey (WVS), waves 2 and 4. TAX, TRUST, and CIVIC are calculated using sampling weights provided by the WVS.