Tube Investments of India Limited Copyright TI | All Rights Reserved www.tiindia.com Stock Codes: BSE: 504973 NSE: TUBEINVEST Bloomberg: TI IN / TI IB Reuters: TUBE.NS / TUBE.BO CIN: L35921TN1949PLC002905
Transcript
Tube Investments of India Limited
Copyright TI | All Rights Reserved www.tiindia.com
Stock Codes: BSE: 504973 NSE: TUBEINVEST Bloomberg: TI IN / TI IB Reuters: TUBE.NS / TUBE.BOCIN: L35921TN1949PLC002905
2
Safe Harbour
This presentation contains forward-looking statements which may be identified by their use of words
like “plans,” “expects,” “will,” “anticipates,” “believes,” “intends,” “projects,” “estimates” or other words
of similar meaning. All statements that address expectations or projections about the future, including,
but not limited to, statements about the strategy for growth, product development, market position,
expenditures, and financial results, are forward-looking statements.
Forward-looking statements are based on certain assumptions and expectations of future events. The
companies referred to in this presentation cannot guarantee that these assumptions and expectations
are accurate or will be realized. The actual results, performance or achievements, could thus differ
materially from those projected in any such forward-looking statements. These companies assume no
responsibility to publicly amend, modify or revise any forward looking statements, on the basis of any
subsequent developments, information or events, or otherwise.
Copyright TI | All Rights Reserved www.tiindia.com
3
Contents
Copyright TI | All Rights Reserved www.tiindia.com
Tube Investments of India Ltd.
About Murugappa Group
Company Financials
Business Divisions Performance
4
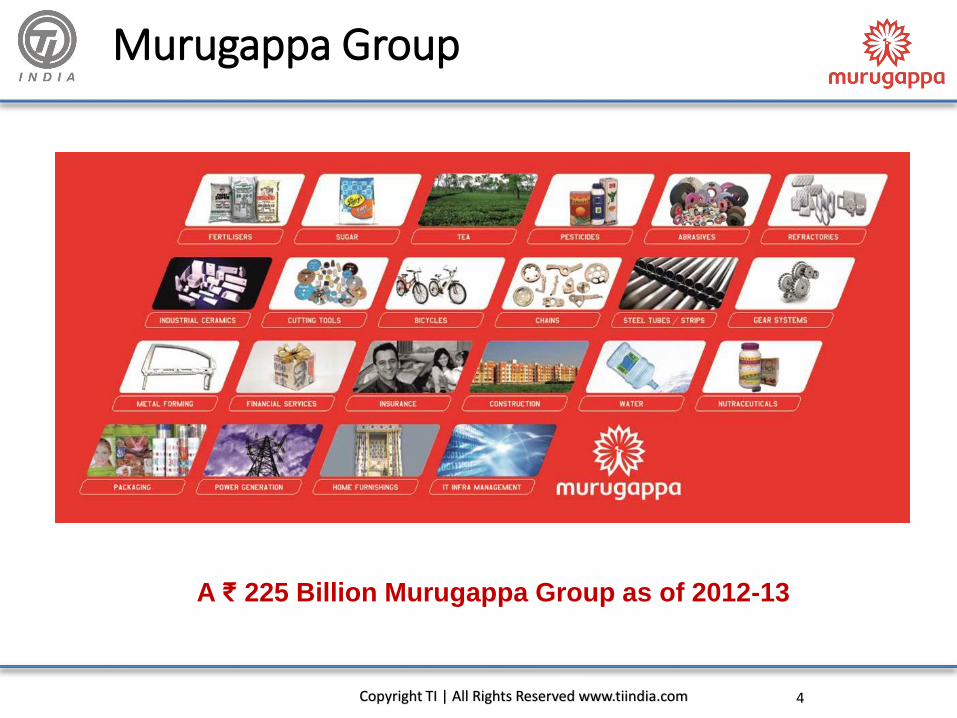
Murugappa Group
Copyright TI | All Rights Reserved www.tiindia.com
28 Businesses One Powerful Group
A ₹ 225 Billion Murugappa Group as of 2012-13
5
The Philosophy we cherish
Copyright TI | All Rights Reserved www.tiindia.com
“The fundamental principle of economic activity is that no man
you transact with will lose; then you shall not.”- Arthashastra
6
Group Composition as of 2012-13
Copyright TI | All Rights Reserved www.tiindia.com
Turnover ₹ 225 bn EBITDA ₹ 25 bn
Coromandel41%
EID Parry11%
TII18%
CUMI9%
Chola Finance
11%
Chola Insurance
7%
Others3%
Coromandel33%
EID Parry13%TII
15%
CUMI10%
Chola Finance
19%
Chola Insurance
5%Others
5%
TII (incl Chola) represented 36% of group’s revenues and 39% of profits
7
Spirit of Murugappa
Copyright TI | All Rights Reserved www.tiindia.com
8
Contents
Tube Investments of India Ltd.
About Murugappa Group
Company Financials
Business Divisions Performance
Copyright TI | All Rights Reserved www.tiindia.com
9
TII – A Conglomerate
1949 1955 1960 1965 1978 1985 2001 2010 2012
1949 – Set up TI Cycles (BSA & Hercules Brands)
1955 – Incorporated Tube Products
1985 – Indigenously manufactured 100 cc bike chain
Copyright TI | All Rights Reserved www.tiindia.com
56
Business Highlights
Recorded growth rates better than the industry by leveragingits broad-based product offerings and a deeper penetration ofthe existing customer base
Disbursements for 2013-14 stood at ₹ 13,114 Cr, as against ₹12,118 Cr in 2012-13, a growth of 8%Company registered PAT growth of 19% over 2012-13
Company has expanded its presence to 574 branches as on31st March 2014 compared to 518 branches as on 31st March2013. 90% of branches are in Tier II and Tier III towns acrossIndia.
Copyright TI | All Rights Reserved www.tiindia.com
Strong Geographical Presence
Performance Highlights of FY – 13 Vs FY - 14
8% 19% 17% 11%
-6%
Disbursements PAT ROTA(PBT) Book Value EPS^ ROE*
₹ 13,114 Cr ₹ 364 Cr 2.8% ₹ 160.3 ₹ 25.4 17.1%
₹ 12,118 Cr ₹ 307 Cr 3.0% ₹ 137.3 ₹ 22.9 18.1%
^ EPS is
annualized and
*ROE is
calculated on
Profit after Tax
-5%
57
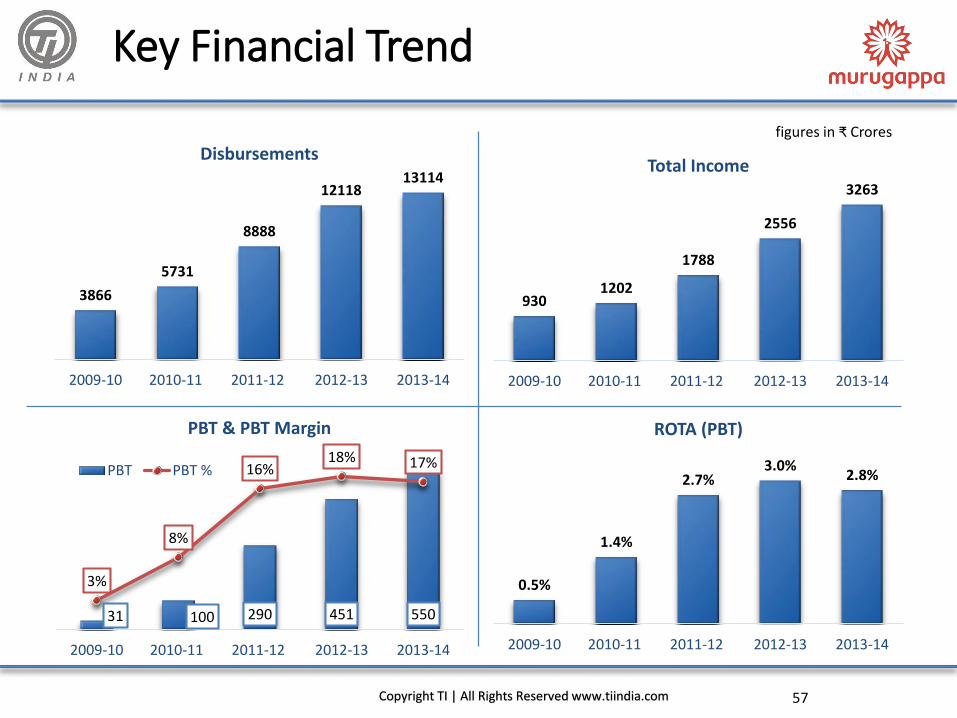
Key Financial Trend
3866
5731
8888
1211813114
2009-10 2010-11 2011-12 2012-13 2013-14
Disbursements
31 100 290 451 550
3%
8%
16%18% 17%
2009-10 2010-11 2011-12 2012-13 2013-14
PBT & PBT Margin
PBT PBT %
0.5%
1.4%
2.7%3.0%
2.8%
2009-10 2010-11 2011-12 2012-13 2013-14
ROTA (PBT)
9301202
1788
2556
3263
2009-10 2010-11 2011-12 2012-13 2013-14
Total Income
figures in ₹ Crores
Copyright TI | All Rights Reserved www.tiindia.com
Copyright TI | All Rights Reserved www.tiindia.com
figures in ₹ Crores
59
Insurance
Chola MS General Insurance
Copyright TI | All Rights Reserved www.tiindia.com
60Copyright TI | All Rights Reserved www.tiindia.com
Among the fastest growing general insurance companies in India
Market Presence: Over 101 offices, Over 9000 agents and 5 bancassurance channel partners
Business holds a market share of 2.62% as on March 31st, 2014 and is the top 7th private general insurance company in India
Product basket comprises accident, engineering, health, liability, marine, motor, property, travel and rural insurance for individuals, SMEs and corporates
Leading insurer for Japanese / Korean business interests in India
Business Overview
Shareholding
74%
26%
TII Mitsui Sumitomo
Key Financials
₹ Crore FY 12-13 FY 13-14
Revenue 1652 1872
PAT 60 70
61
Business Strengths
Strong Distribution PartnersRobust Underwriting
Capability and operating efficiencies
Tailor Made Products
Strong Chola Synergies High Rural Penetration State of the Art Technology
Copyright TI | All Rights Reserved www.tiindia.com
62
Business Highlights
Chola MS grew 14% as against the growth @ 11% by private
players.
GWP (Direct) Volumes of ₹ 1621 Cr in 2012-13 and ₹ 1855 Cr in
2013-14
Net Earned Premium Business growth of 34% over last year
(Industry Growth 15%)
Operating PBT @ ₹ 118 Cr in 2012-13, ₹ 156 Cr in 2013-14
Combined Ratio @ 101.3% for FY 2013-14
Motor Pool Losses absorption completed
Awards: Innovative Hero – CIO for Mobile strategy and implementation of various mobile initiatives (Dynamic CIO Forum, part of the international CIO Magazine)
Copyright TI | All Rights Reserved www.tiindia.com
63
Key Financials
Copyright TI | All Rights Reserved www.tiindia.com
figures in ₹ Crores
Particulars 2013-14 2012-13 % Growth
Gross Written Premium (Incl. RI Accept) 1872 1652 13%
Net Written Premium 1552 1350 15%
Operating PBT 156 118 33%
Net Impact from Motor, Declined & Terrorism Pool -55 -29
PBT 102 89 14%
PAT 70 60 16%
Total Investment 2328 1724 35%
Combined ratio (CoR%) - Excl IMTPIP 101.3% 99.5%
Investment Yield % 9.3% 9.0%
64
Contents
Tube Investments of India Ltd.
About Murugappa Group
Company Financials
Business Divisions Performance
Copyright TI | All Rights Reserved www.tiindia.com
65
Consolidated Performance Trends
3181
5068
6456
77528834
2009-10 2010-11 2011-12 2012-13 2013-14
Total Revenue
166
335
536
674789
2009-10 2010-11 2011-12 2012-13 2013-14
Profit Before Tax
6.08
10.58
14.4615.47
16.67
2009-10 2010-11 2011-12 2012-13 2013-14
Earnings Per Share (Basic) (₹)
1.50
3.00 3.00
2.00 2.00
2009-10 2010-11 2011-12 2012-13 2013-14
Dividend Per Share* (₹)
figures in ₹ Crores
*Standalone
Copyright TI | All Rights Reserved www.tiindia.com
#
# ₹ 1.50 Interim Dividend & ₹ 0.5 Proposed
66
Standalone Performance Trends
2346
2963
3464 3390 3352
2009-10 2010-11 2011-12 2012-13 2013-14
Sales
158
307 322
251 264
7%
10%9%
7% 8%
2009-10 2010-11 2011-12 2012-13 2013-14
PBIT & PBIT Margin
PBIT PBIT %
4.39
9.16 9.69
5.58 5.04
2009-10 2010-11 2011-12 2012-13 2013-14
EPS
11.5%
18.4%17.1%
11.1% 10.2%
2009-10 2010-11 2011-12 2012-13 2013-14
ROCE %
figures in ₹ Crores
Copyright TI | All Rights Reserved www.tiindia.com
67
Standalone Performance Trends
81
170180
10494
2009-10 2010-11 2011-12 2012-13 2013-14
PAT
96 87
165
217
169
2009-10 2010-11 2011-12 2012-13 2013-14
Capital Expenditure
128
198
115
298
217
2009-10 2010-11 2011-12 2012-13 2013-14
Free Cash Flow
262
345367
298 301
2009-10 2010-11 2011-12 2012-13 2013-14
EBITDA
figures in ₹ Crores
Copyright TI | All Rights Reserved www.tiindia.com
Free Cash Flow = PAT + Depreciation – ∆ Working Capital
68
Key Financials
Copyright TI | All Rights Reserved www.tiindia.com
Particulars Standalone Consolidated
2013-14 2012-13 2013-14 2012-13
Net Sales / Income from Operations 3,352 3,390 8,370 7,346
Growth % -1% -2% 14% 17%
Total Income from Operations (Net) 3,526 3,566 8,834 7,752
Growth % -1% -2% 14% 18%
EBITDA 301 298 1,044 889
% to Sales 9% 9% 12% 12%
PBIT 264 251 914 781
% to Sales 8% 7% 11% 11%
Profit Before Tax 141 147 789 674
% to Sales 4% 4% 9% 9%
Profit After Tax (before Minority Interest) 94 104 518 457
% to Sales 3% 3% 6% 6%
Net Profit 94 104 311 289
% to Sales 3% 3% 4% 4%
figures in ₹ Crores
69
Key Financials (Contd.)
Particulars
Standalone Consolidated
2013-14 2012-13 2013-14 2012-13
EQUITY AND LIABILITIES
Shareholders' Funds
(a) Share Capital 37 37 37 37
(b) Reserves and Surplus 1,201 1,144 1,914 1,622
1,239 1,181 1,951 1,659
Minority Interest 1,364 1,159
Non-Current Liabilities
(a) Long Term Borrowings 638 630 10,461 8,929
(b) Deferred Tax Liabilities (Net) 52 52 58 61
(c) Other Long Term Liabilities 1,258 1 ,007
(d) Long Term Provisions 114 92
690 683 11,891 10,090
Current Liabilities
(a) Short Term Borrowings 303 303 3,485 3,298
(b) Trade Payables 585 485 859 677
(c) Other Current Liabilities 517 441 7,537 6,024
(d) Short Term Provisions 42 44 272 254
1,446 1,274 12,153 10,253
TOTAL 3,375 3,138 27,359 23,162
Copyright TI | All Rights Reserved www.tiindia.com