17
Tuberculosis in England National quarterly report: Q3 2020 1 July to 30 September 2020 Provisional data
Tuberculosis in England
National quarterly report: Q3 2020
1 July to 30 September 2020
Provisional data
National Quarterly Report of Tuberculosis in England
2
About Public Health England
Public Health England exists to protect and improve the nation’s health and wellbeing,
and reduce health inequalities. We do this through world-leading science, knowledge
and intelligence, advocacy, partnerships and the delivery of specialist public health
services. We are an executive agency of the Department of Health and Social Care,
and a distinct delivery organisation with operational autonomy. We provide
government, local government, the NHS, Parliament, industry and the public with
evidence-based professional, scientific and delivery expertise and support.
Public Health England
Wellington House
133-155 Waterloo Road
London SE1 8UG
Tel: 020 7654 8000
www.gov.uk/phe
Twitter: @PHE_uk
Facebook: www.facebook.com/PublicHealthEngland
Prepared by: TB Unit, TARGET, National Infection Service, PHE
For queries relating to this document, please contact: [email protected]
© Crown copyright 2020
You may re-use this information (excluding logos) free of charge in any format or
medium, under the terms of the Open Government Licence v3.0. To view this licence,
visit OGL. Where we have identified any third party copyright information you will need
to obtain permission from the copyright holders concerned.
PHE supports the UN
Published October 2020
PHE publications
gateway number: GW-1665 Sustainable Development Goals
National Quarterly Report of Tuberculosis in England
3
Contents
Background 4
Overall numbers and geographical distribution 5
Demographic and clinical characteristics 9
Culture confirmation 9
Multi-drug resistant/rifampicin resistant (MDR/RR) TB 12
Treatment delays 13
Treatment outcomes 15
Social risk factors 16
National Quarterly Report of Tuberculosis in England
4
Background
This report presents quarterly data on tuberculosis (TB) case notifications in England.
Detailed results for 2019 will be published in the annual report ‘Tuberculosis in
England: 2019 report’ in 2020. The most recent annual report with data up to the end of
2018 is available.
Please note: data for 2019 and 2020 is provisional and subject to validation and should
be interpreted with caution.
This report aims to provide timely and up-to-date figures of key epidemiological
indicators to inform ongoing TB control efforts in England.

National Quarterly Report of Tuberculosis in England
5
Overall numbers and geographical distribution
Figure 1: Number of TB notifications in England, Q1 2018 to Q3 2020
In the third quarter of 2020 (Q3 2020, 1 July to 30 September), 1,007 people were notified with
TB in England. This is a 15.4% decrease compared to the same quarter in the previous year
(Q3 2019: 1,190). Exact numbers are shown in Table 1.
Please note: due to the seasonality of TB notifications the most recent quarter is being
compared to the same quarter in the previous year rather than to the previous quarter.
National Quarterly Report of Tuberculosis in England
6
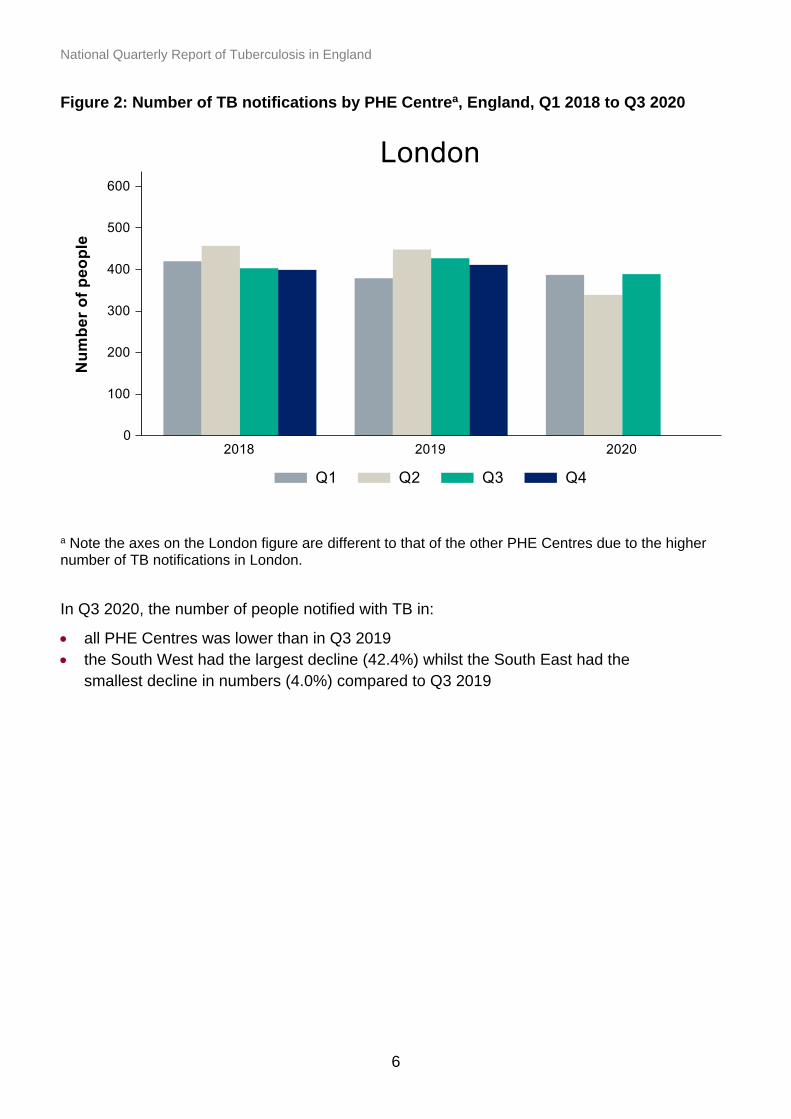
Figure 2: Number of TB notifications by PHE Centrea, England, Q1 2018 to Q3 2020
a Note the axes on the London figure are different to that of the other PHE Centres due to the higher number of TB notifications in London.
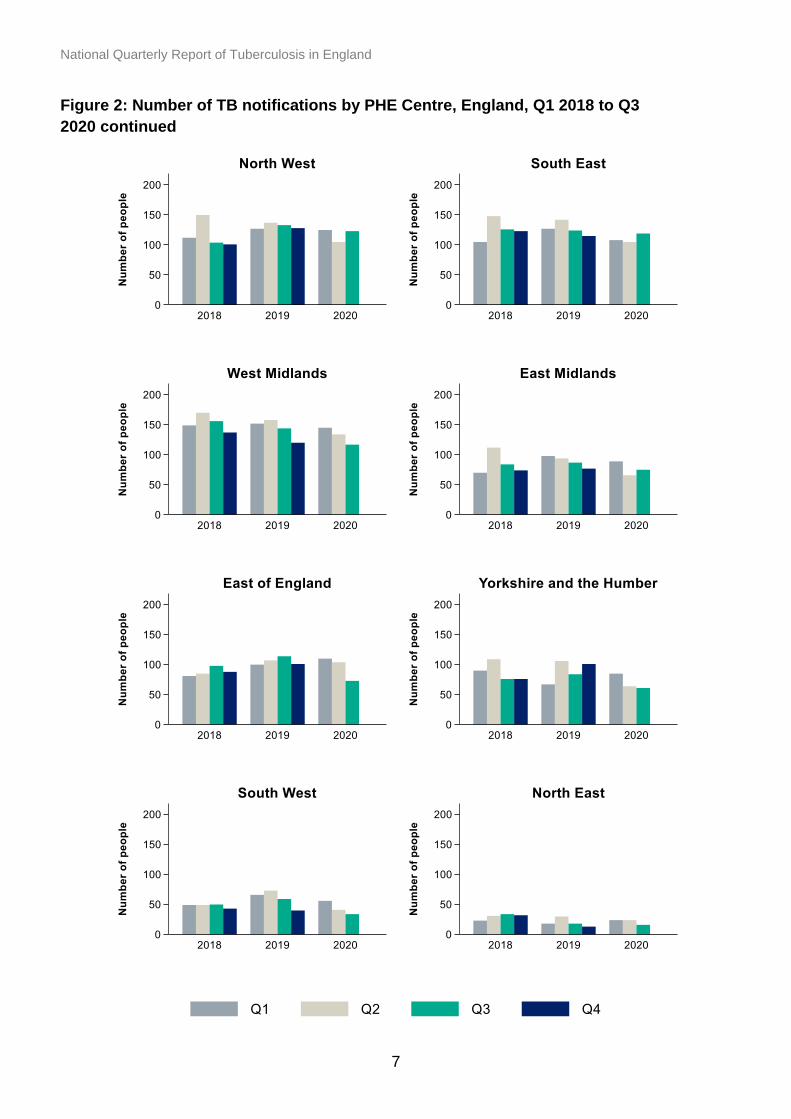
In Q3 2020, the number of people notified with TB in:
• all PHE Centres was lower than in Q3 2019
• the South West had the largest decline (42.4%) whilst the South East had the
smallest decline in numbers (4.0%) compared to Q3 2019
National Quarterly Report of Tuberculosis in England
7
Figure 2: Number of TB notifications by PHE Centre, England, Q1 2018 to Q3
2020 continued
National Quarterly Report of Tuberculosis in England
8
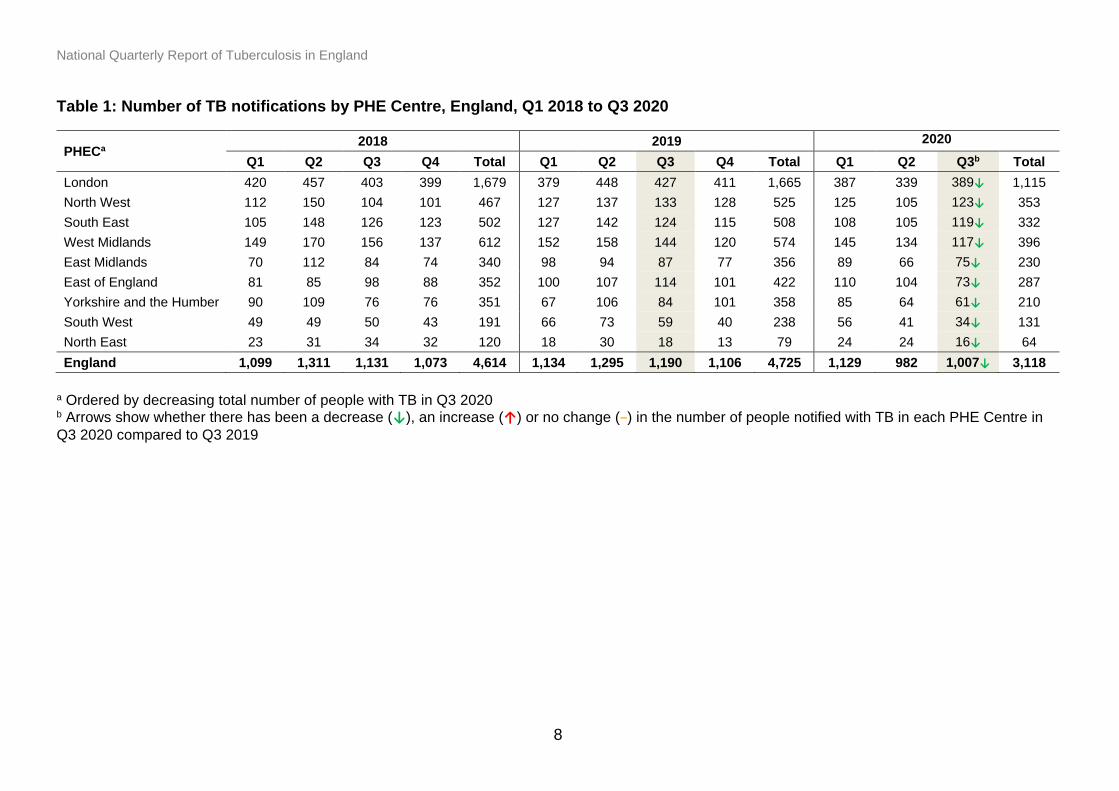
Table 1: Number of TB notifications by PHE Centre, England, Q1 2018 to Q3 2020
PHECa 2018 2019 2020
Q1 Q2 Q3 Q4 Total Q1 Q2 Q3 Q4 Total Q1 Q2 Q3b Total
London 420 457 403 399 1,679 379 448 427 411 1,665 387 339 389↓ 1,115
North West 112 150 104 101 467 127 137 133 128 525 125 105 123↓ 353
South East 105 148 126 123 502 127 142 124 115 508 108 105 119↓ 332
West Midlands 149 170 156 137 612 152 158 144 120 574 145 134 117↓ 396
East Midlands 70 112 84 74 340 98 94 87 77 356 89 66 75↓ 230
East of England 81 85 98 88 352 100 107 114 101 422 110 104 73↓ 287
Yorkshire and the Humber 90 109 76 76 351 67 106 84 101 358 85 64 61↓ 210
South West 49 49 50 43 191 66 73 59 40 238 56 41 34↓ 131
North East 23 31 34 32 120 18 30 18 13 79 24 24 16↓ 64
England 1,099 1,311 1,131 1,073 4,614 1,134 1,295 1,190 1,106 4,725 1,129 982 1,007↓ 3,118
a Ordered by decreasing total number of people with TB in Q3 2020 b Arrows show whether there has been a decrease (↓), an increase (↑) or no change (−) in the number of people notified with TB in each PHE Centre in
Q3 2020 compared to Q3 2019

National Quarterly Report of Tuberculosis in England
9
Demographic and clinical characteristics
Figure 3: Number of TB notifications by place of birth and site of disease, England, Q4 2018 to Q3 2020
Compared with Q3 2019 (853), in Q3 2020 (707) there was a 17.1% decrease in the number of people notified with TB who
were born outside the UK. Similarly, the number born in the UK decreased in the same time period (Q3 2019: 298, Q3 2020:
269, -9.7%).
In Q3 2020, the number of people with pulmonary TB accounted for 49.9% (487/976) of all people with TB, having decreased
from 53.4% in Q3 2019 (615/1,151). For those born outside the UK, this proportion was 44.3% (313/707), whilst the proportion
was much higher among people born in the UK (64.7%, 174/26).
Year/Quarter
National Quarterly Report of Tuberculosis in England
10
Culture confirmation
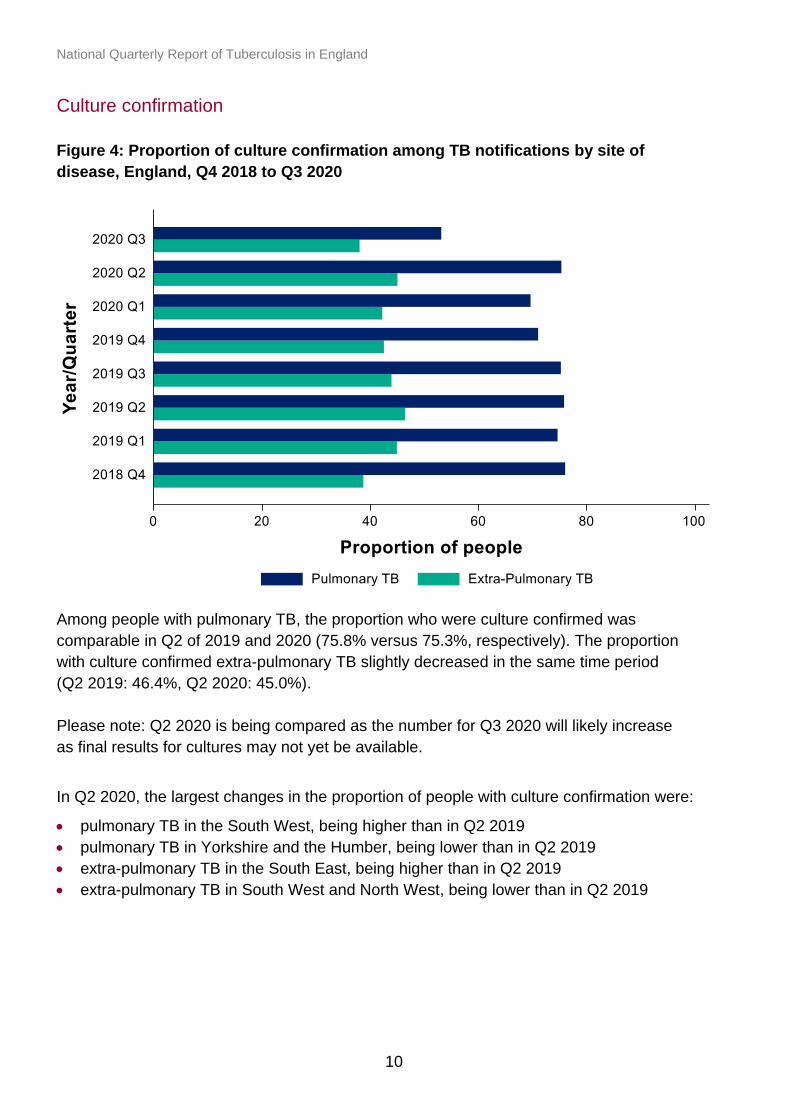
Figure 4: Proportion of culture confirmation among TB notifications by site of
disease, England, Q4 2018 to Q3 2020
Among people with pulmonary TB, the proportion who were culture confirmed was
comparable in Q2 of 2019 and 2020 (75.8% versus 75.3%, respectively). The proportion
with culture confirmed extra-pulmonary TB slightly decreased in the same time period
(Q2 2019: 46.4%, Q2 2020: 45.0%).
Please note: Q2 2020 is being compared as the number for Q3 2020 will likely increase
as final results for cultures may not yet be available.
In Q2 2020, the largest changes in the proportion of people with culture confirmation were:
• pulmonary TB in the South West, being higher than in Q2 2019
• pulmonary TB in Yorkshire and the Humber, being lower than in Q2 2019
• extra-pulmonary TB in the South East, being higher than in Q2 2019
• extra-pulmonary TB in South West and North West, being lower than in Q2 2019

National Quarterly Report of Tuberculosis in England
11
Figure 5: Proportion of culture confirmation among TB notifications by site of disease and PHE Centre, Q4 2018 to Q3 2020
National Quarterly Report of Tuberculosis in England
12
Multi-drug resistant/rifampicin resistant (MDR/RR) TB
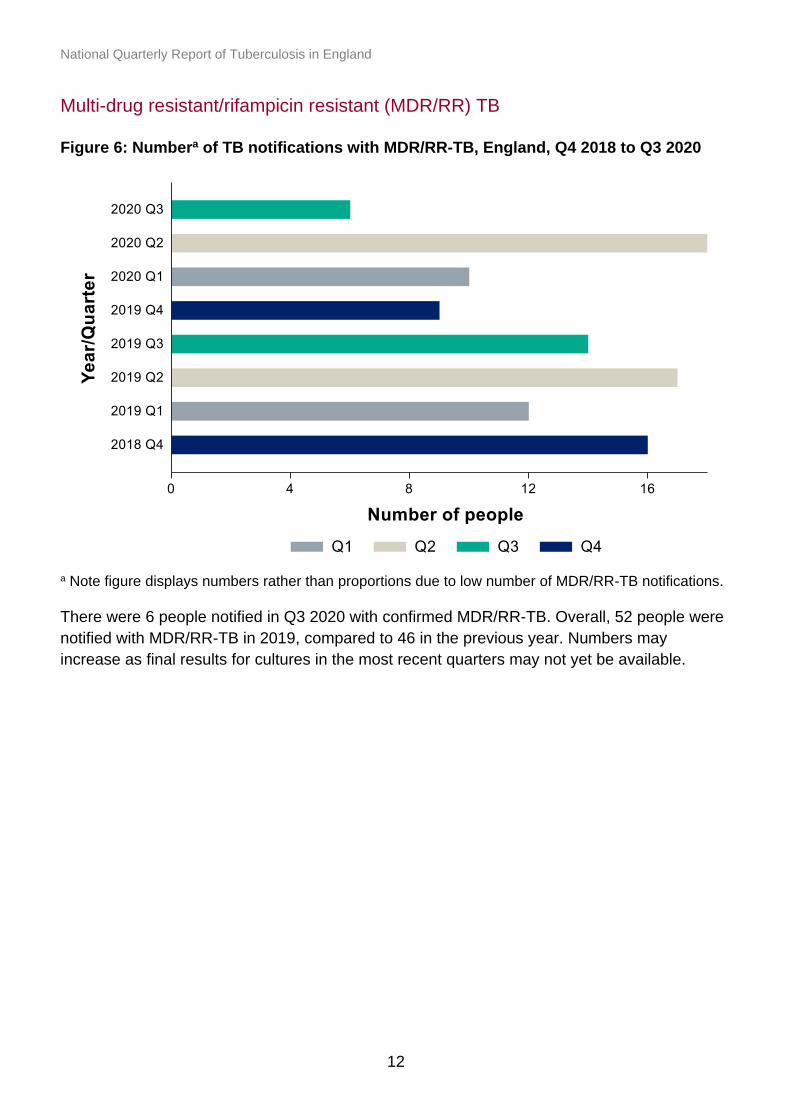
Figure 6: Numbera of TB notifications with MDR/RR-TB, England, Q4 2018 to Q3 2020
a Note figure displays numbers rather than proportions due to low number of MDR/RR-TB notifications.
There were 6 people notified in Q3 2020 with confirmed MDR/RR-TB. Overall, 52 people were
notified with MDR/RR-TB in 2019, compared to 46 in the previous year. Numbers may
increase as final results for cultures in the most recent quarters may not yet be available.

National Quarterly Report of Tuberculosis in England
13
Treatment delays
Figure 7: Proportiona of pulmonary TB notifications starting treatment within 4 months (symptom onset to treatment start), England, Q4 2018 to Q3 2020
a Note x-axis is not scaled to start at zero to improve data visualisation.
In Q3 2020, 61.6% of people with pulmonary TB started treatment within 4 months of symptom onset, compared to 68.7% in Q3 2019. This proportion will likely increase as some people in the most recent quarter are yet to begin treatment.
National Quarterly Report of Tuberculosis in England
14
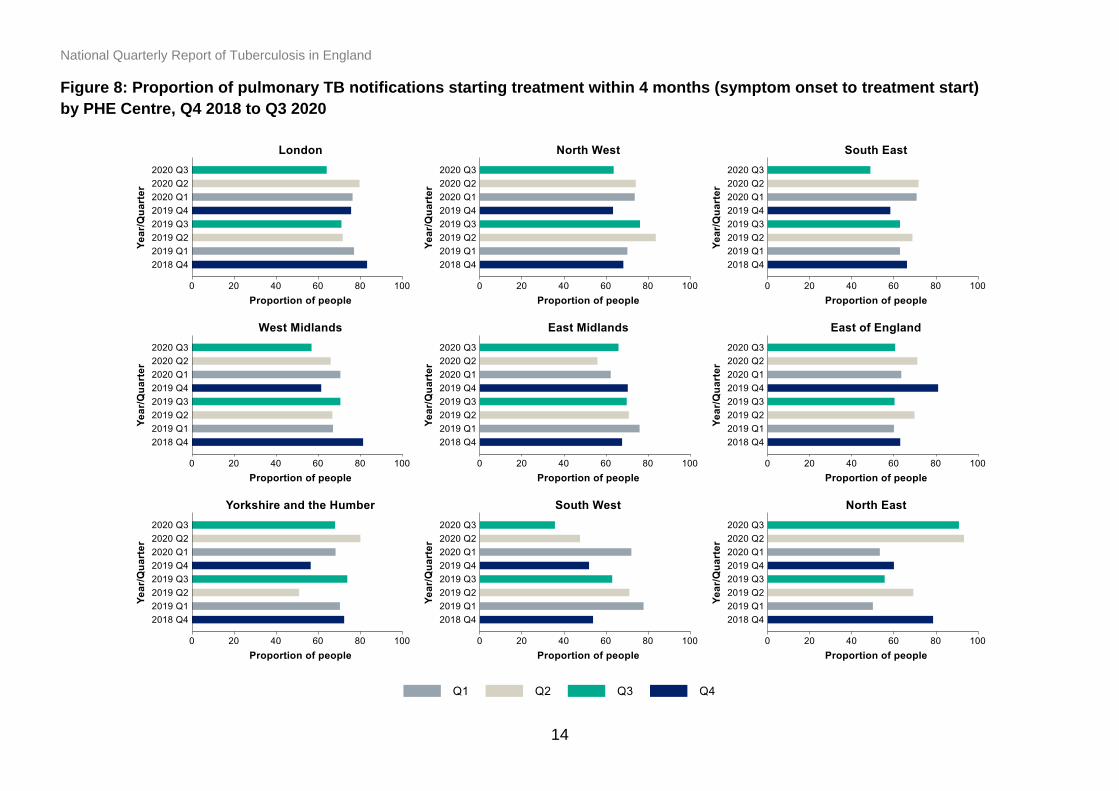
Figure 8: Proportion of pulmonary TB notifications starting treatment within 4 months (symptom onset to treatment start)
by PHE Centre, Q4 2018 to Q3 2020
National Quarterly Report of Tuberculosis in England
15
In Q3 2020, the proportion of people with TB who started treatment within 4 months of
symptom onset in:
• the North East was substantially higher than in Q3 2019
• South West, South East and West Midlands was substantially lower than in Q3
2019
Treatment outcomes
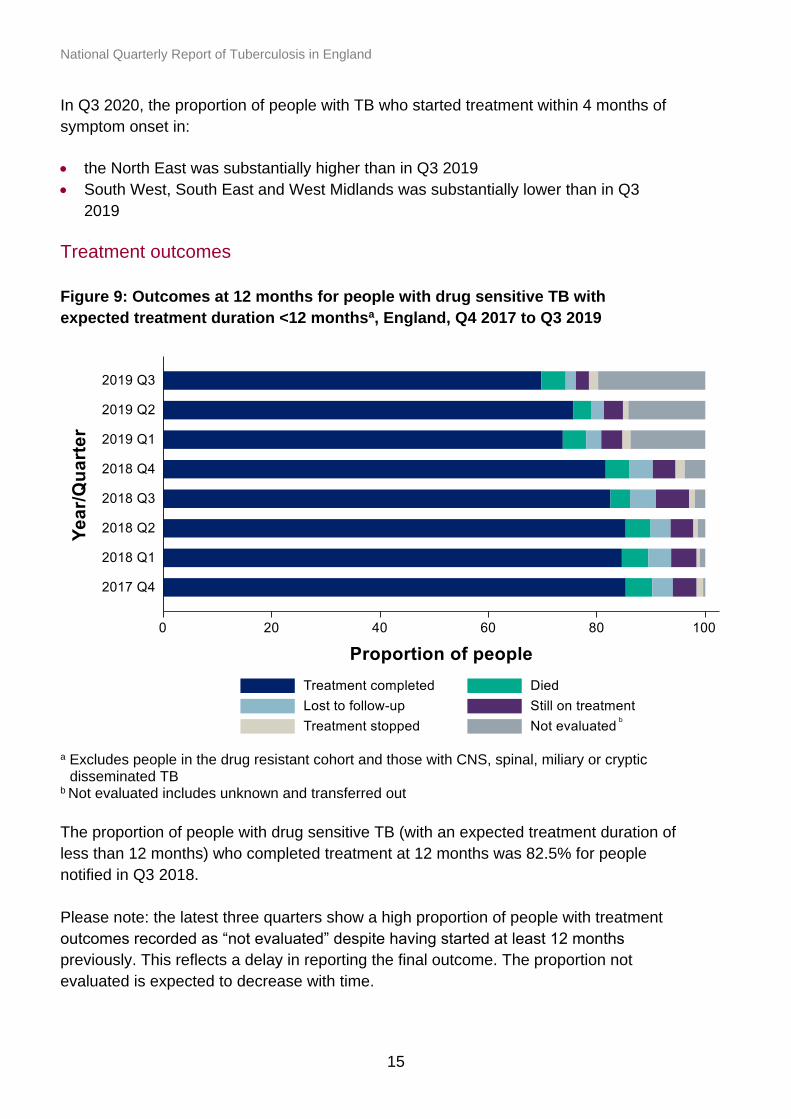
Figure 9: Outcomes at 12 months for people with drug sensitive TB with
expected treatment duration <12 monthsa, England, Q4 2017 to Q3 2019
a Excludes people in the drug resistant cohort and those with CNS, spinal, miliary or cryptic
disseminated TB b Not evaluated includes unknown and transferred out
The proportion of people with drug sensitive TB (with an expected treatment duration of
less than 12 months) who completed treatment at 12 months was 82.5% for people
notified in Q3 2018.
Please note: the latest three quarters show a high proportion of people with treatment
outcomes recorded as “not evaluated” despite having started at least 12 months
previously. This reflects a delay in reporting the final outcome. The proportion not
evaluated is expected to decrease with time.
National Quarterly Report of Tuberculosis in England
16
Social risk factors
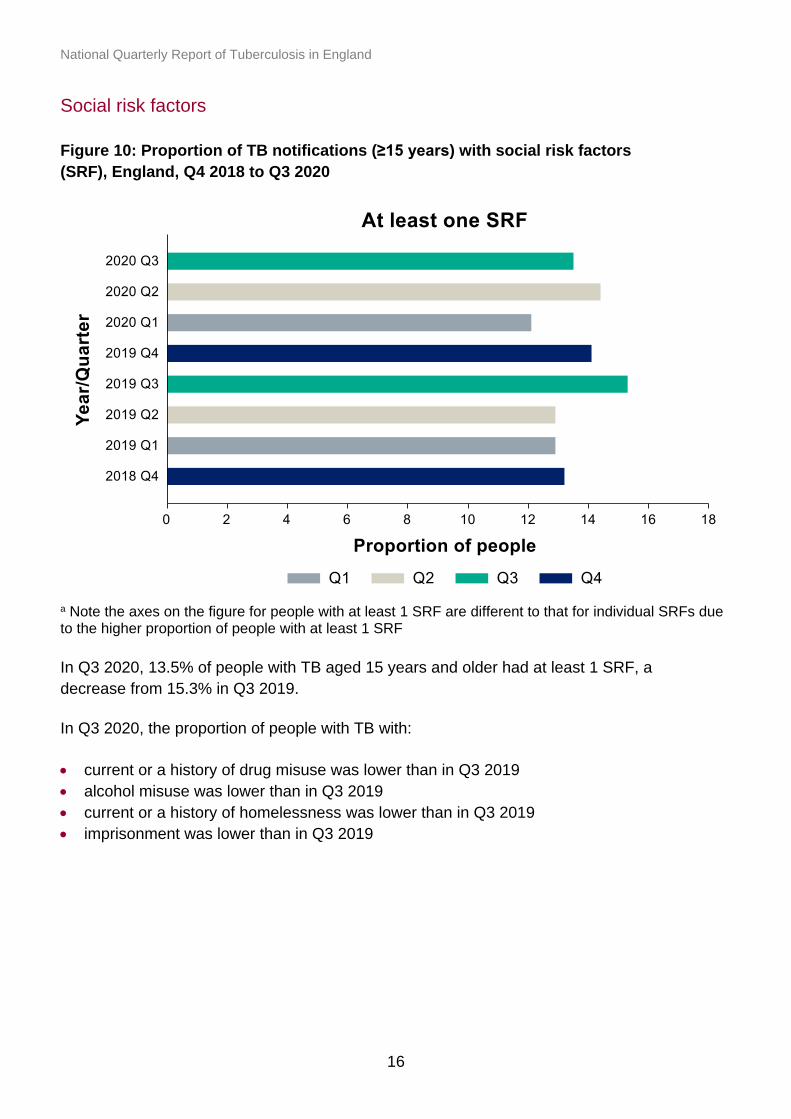
Figure 10: Proportion of TB notifications (≥15 years) with social risk factors
(SRF), England, Q4 2018 to Q3 2020
a Note the axes on the figure for people with at least 1 SRF are different to that for individual SRFs due to the higher proportion of people with at least 1 SRF
In Q3 2020, 13.5% of people with TB aged 15 years and older had at least 1 SRF, a
decrease from 15.3% in Q3 2019.
In Q3 2020, the proportion of people with TB with:
• current or a history of drug misuse was lower than in Q3 2019
• alcohol misuse was lower than in Q3 2019
• current or a history of homelessness was lower than in Q3 2019
• imprisonment was lower than in Q3 2019

National Quarterly Report of Tuberculosis in England
17
Figure 10: Proportion of TB notifications (≥15 years) with social risk factors,
England, Q4 2018 to Q3 2020 continued


