+ All Categories
Home > Documents > Tully Cogeneration Report July 2009 · PDF filefor TSL to select the best option and take this...

Tully Cogeneration Report July 2009 · PDF filefor TSL to select the best option and take this...

Date post: 07-Mar-2018
Category:
Upload: lephuc
View: 215 times
Download: 1 times
Share this document with a friend
31
1 TULLY SUGAR LTD Cogeneration Project Investigation July 2009 Background Tully Sugar Limited (TSL) has previously investigated Cogeneration project opportunities, including a proposal in 2003 to purchase and install an existing 21MW condensing steam turbine generator (STG). Reports were prepared by Alstom (“Steam Turbine Technical Performance Study”) and Sugar Research Institute (“Energy audit to achieve 45% process steam on cane”) to assess the viability of operating the STG on higher pressure steam available from the 106t/h #3 ABB Boiler. The project did not proceed further, and the Renewable Energy Certificate (REC) market created by the 2%MRET nose-dived in 2005/6. The announcement of the proposed 20%RET scheme by the new Labour Government in 2008 saw a revival of the REC market, and coupled with rising NEMMCO pool prices, offered promising returns for sugar mill Cogeneration projects. This has been tempered by the extraordinary increase in project construction costs over the past four years, requiring a detailed assessment of projects to minimize work scope without reducing project value. Mackay Sugar Ltd (MSL) has been investigating a large cogeneration project at Racecourse Mill and has developed sugar factory heat balance and financial models incorporating Cogeneration plant, and has gained experience with plant design and specifications. MSL personnel have conducted this broad investigation for TSL, to assess a number of possible Cogeneration projects, identify the most promising, and indicate likely project returns. A site visit to TSL in March 2009 was undertaken to update factory data and discuss staff preferences for the arrangement and operation of various Cogeneration options. The preference was to install a new HP boiler feeding steam to a new STG, however options to utilize the higher pressure capability of #3 Boiler would be investigated. Data from the earlier reports was reviewed and MSL heat balance models were modified to mimic the various project options within TSL’s plant and operating constraints. Scope of investigation and Methodology This investigation is not a detailed feasibility study, but rather a study to determine the likely viability of installing a new HP boiler and STG, or alternatively to upgrade #3 Boiler and install a smaller STG dedicated to that boiler. The following options were modelled: A. Upgrade #3 Boiler to 45 barg; New 22MW condensing/extraction STG; 49.5% SOC B. Upgrade #3 Boiler to 45 barg; New 22MW condensing/extraction STG; 45% SOC C. New 140t/h 45 barg boiler; shut #1 Boiler; New 33MW condensing/extraction STG; 49.5% SOC
Transcript

1

TULLY SUGAR LTD

Cogeneration Project Investigation

July 2009 Background Tully Sugar Limited (TSL) has previously investigated Cogeneration project opportunities, including a proposal in 2003 to purchase and install an existing 21MW condensing steam turbine generator (STG). Reports were prepared by Alstom (“Steam Turbine Technical Performance Study”) and Sugar Research Institute (“Energy audit to achieve 45% process steam on cane”) to assess the viability of operating the STG on higher pressure steam available from the 106t/h #3 ABB Boiler. The project did not proceed further, and the Renewable Energy Certificate (REC) market created by the 2%MRET nose-dived in 2005/6. The announcement of the proposed 20%RET scheme by the new Labour Government in 2008 saw a revival of the REC market, and coupled with rising NEMMCO pool prices, offered promising returns for sugar mill Cogeneration projects. This has been tempered by the extraordinary increase in project construction costs over the past four years, requiring a detailed assessment of projects to minimize work scope without reducing project value. Mackay Sugar Ltd (MSL) has been investigating a large cogeneration project at Racecourse Mill and has developed sugar factory heat balance and financial models incorporating Cogeneration plant, and has gained experience with plant design and specifications. MSL personnel have conducted this broad investigation for TSL, to assess a number of possible Cogeneration projects, identify the most promising, and indicate likely project returns. A site visit to TSL in March 2009 was undertaken to update factory data and discuss staff preferences for the arrangement and operation of various Cogeneration options. The preference was to install a new HP boiler feeding steam to a new STG, however options to utilize the higher pressure capability of #3 Boiler would be investigated. Data from the earlier reports was reviewed and MSL heat balance models were modified to mimic the various project options within TSL’s plant and operating constraints. Scope of investigation and Methodology This investigation is not a detailed feasibility study, but rather a study to determine the likely viability of installing a new HP boiler and STG, or alternatively to upgrade #3 Boiler and install a smaller STG dedicated to that boiler. The following options were modelled:

A. Upgrade #3 Boiler to 45 barg; New 22MW condensing/extraction STG; 49.5% SOC B. Upgrade #3 Boiler to 45 barg; New 22MW condensing/extraction STG; 45% SOC C. New 140t/h 45 barg boiler; shut #1 Boiler; New 33MW condensing/extraction STG;

49.5% SOC

2

D. New 140t/h 45 barg boiler; shut #1 Boiler; New 33MW condensing/extraction STG; 45% SOC

E. New 140t/h 80 barg boiler; shut #1 Boiler; New 36MW condensing/extraction STG; 49.5% SOC

F. New 140t/h 80 barg boiler; shut #1 Boiler; New 36MW condensing/extraction STG; 45% SOC

The following procedure was used to determine the economic viability of each option: � Modify the MSL heat balance models to TSL plant conditions for crushing and non-

crushing operations; � Using 2008 data, complete a matching run to test known operating outputs, specifically

total generation, export, eligible generation (RECs), total surplus bagasse, LP venting, boiler loads, HP/LP steam balance, etc.;

� Include the new Cogen plant items, and adjust the existing powerhouse STG loads to maintain a steam balance (i.e no IP/LP make-up and no LP steam venting);

� For new boiler options, adjust the boiler steam flow so that all bagasse is consumed during the crushing season, allowing for start-up bagasse for the following season;

� For #3 Boiler upgrade options, adjust the boiler steam load to maintain the same bagasse consumption rate as the existing boiler at MCR;

� Adjust the pass-out flow from the new STG such that existing boiler loads are maintained at or near MCR;

� Adjust site electrical loads to reflect the impact of new Cogen plant and LP steam efficiency modifications;

� Determine the extra export, REC and Avoided TUoS revenue, above existing revenue; � Estimate capital costs of new plant; � Estimate increases in operating and maintenance costs of new plant; � Predict forward black and REC pricing; and � Prepare a simple discounted cash flow (DCF) analysis, assuming a 30 year project life. The technical accuracy of the heat balance modeling should be reasonably good, however the capital estimates are only of first-order accuracy and are based on recent cost estimates prepared for the Racecourse project. Forward electricity and REC prices used in the modeling are based on recent indicative pricing received by MSL, but actual forward contract prices could vary significantly due to the current uncertainty of the 20%RET legislation and CPRS legislation. Until a detailed scope of work is established (with firm capital costs) and electricity and REC prices are set under a Power Purchase Agreement (PPA), the project returns should only be treated as indicative. However, the ranking of the options will be accurate enough for TSL to select the best option and take this forward to a detailed feasibility study, subject to the indicated project return meeting TSL’s hurdle rate. Matching Run Figure 1 shows the HP steam model for current factory operations. Major inputs into the model include: � Crush rate 713 TCH � Crop 2.00mt

3

Figure 1 Bagasse produced

221.5 t/h Bagasse Surplus tonne (for period)43.74 t/h -92.1 222.27 To condensor

0% MCR Stage 1 Stage 2 Stage 3 Generator 0.00 2,923.0

Bagasse 8,100.0 525.0 7,900.0 522.0 0 t/h 178.15 C S/heat

0.00 t/h 0.00 3,458.8 0.00 3,453.7 65.90% Eff. 80.14% Eff. 0.00% Eff.

0.00 MW 0.00 MW 0.00 MW

0.00 t/h 8,300.0 298.4 STG Gen.& G/Box efficiency 79.61 %0.00 1,336.3 0.0 163.6 100.0 226.05 0.00 MW

8,900.0 100.0 0.00 2,803.4 0.00 2,923.0

0.00 419.0 8,900.0 100.0 63.62 C S/heat 105.64 C S/heat

0.00 419.0 0.0 100.0 To 250kPa steam transformer0.0 100.0 8,900.0 100.0 0.00 2,675.5

From Deaerator 0.00 419.0 0.00 419.0 100.0 120.4 To STG Pre-evaporator & Ethanol8,900.0 100.0 Desuper. 0.00 2,706.5

0.00 419.0 Condensate 0.0 100.0 100.0 226.1 To Feedwater heaterTo Deaerator 0.00 2,675.5 0.00 2,923.0

0.0 163.6 0.0 163.6

0.00 0.0 0.00 2,803.4 1,711.9 303.5 To Refinery 1750 kPag#DIV/0! Check 97.2% MCR 0.00 3,037.5

Bagasse 1,750.0 298.0

131.79 t/h #2/3 302.29 3,023.7 FALSE FALSE FALSE Load: 10.000 MW 4.100 MW 4.900 MWCoal Boilers STG STG New STG

0.000 t/h #2/3 ID Fan #1 ID Fan F'water Pump 4 West Mills 10MW 4.5MW 5.3 MW 1,711.9 303.5

2,561.9 98.1 1,950.0 213.7 12.83 3,037.5

308.34 410.7 6.05 914.4 100.0 194.4 100.0 194.4 100.0 194.4 Electric 100.0 120.4 100.0 130.3 100.0 126.0

19.84 2,859.5 6.92 2,859.5 8.94 2,859.5 112.60 2,702.3 50.06 2,727.8 58.07 2,718.6

74.02 C S/heat 74.02 C S/heat 74.02 C S/heat 1.00 Dryness 9.88 C S/heat 5.60 C S/heat 100.0 133.2

97.10% MCR 35.7 220.7 256.43 2,732.9

Bagasse 1,800.0 324.0 Mills45.94 t/h #1 94.68 3,081.7 FALSE FALSE FALSE FALSE FALSE FALSE TRUE 1,711.9 303.5

Boiler 0.00 3,037.5

Shredder #1 Mill #2 Mill #3 Mill #4 Mill #5 Mill Make-up 100.0 120.4 Vent2,561.9 98.1 2,000.0 214.9 39.76 2,706.4

96.57 410.7 1.89 920.1 100.0 138.5 100.0 194.4 100.0 194.4 100.0 194.4 100.0 194.4 100.0 194.4 0.0 0.0

58.17 2,745.0 19.20 2,859.5 14.35 2,859.5 14.35 2,859.5 7.28 2,859.5 14.35 2,859.5 0.00 0.0

From F'water tank 18.06 C S/heat 74.02 C S/heat 74.02 C S/heat 74.02 C S/heat 74.02 C S/heat 74.02 C S/heat 100.0 169.3 To Process2,561.9 98.1 2,561.9 98.1 Desuper. 127.71 2,807.3 100.0 120.4

413.47 410.7 8.56 410.7 Condensate 127.71 69.54 352.94 2,706.4

Boiler data: Fuel data: FALSE STG data: General data:#4 #2/3 #1 Crush rate 713 TCH Miscell IP steam flow 1.8% Cane

Pressure 8,100 1,750 1,800 kPag Crop 2,000.7 kt 1 2 3 HP pipe pressure loss 200.0 kPagTemperature 525 298 324 oC Analysis period 19.220 weeks Design flow 150.0 150.0 76.0 t/h IP pipe pressure loss 50.0 kPagMCR 150 311 97.5 t/h Lost time 13.10% available Deaerator pressure 0.0 kPagEffic. -Bagasse 68.2% 67.0% 61.5% (50% moist.) Cane fibre 15.78% (15,15.78,16.5) Minimum Stage 3 flow 5% design flow Total generation 19.00 MW

-Coal 80% 70% Mud/Cane 6.05% Condensing pressure 9.17 kPaA Total site load 9.000 MWBlowdown 1.0% 2.0% 2.0% steam flow Fibre/Mud 7.08% Generator capacity 36.0 MW Export 10.000 MWSteam flow 0.0 t/h Bagasse: Moist. 49.50% wet basis Gearbox efficiency 98.0%#2 & #3 loads 76% 23.9% % IP load Pol 1.83% dry basis Legend: Pressure (kPag) Temperature (C)Fuel mix 100% 100% 100% Bagasse (by energy) Ash 4.0% dry basis Flow (t/h) Enthalpy (kJ/kg)FSL (ORER) (fossil fuel ratio) Corr.factor 0.0% extra consumptionAsh make 0.00 6.66 2.32 t/h (@60% m.) Coal: GCV 24,537 kJ/kg

Ash 7.77% as fired 2

B'down

B'down

Stage

HP Boiler

Flash

B'down

HP Steam Flows

Drains/Miscell.

Losses

#4

79,393

0.00%

Coal

Elec Elec Elec

Elec Elec Elec Elec Elec Elec

4

Figure 2

Season length 19.22 weeks 97.0% Plant availability Ethanol Plant N (Y or N) Fibre A (H,A or L) Scheme M (M or Q)Crop 2,000,654 tonne Description:

Parameter1 2 Total Total

Crushing rate TCH 713 713 713 713 713 713LP steam/cane % 49.5% 49.5% 49.5% 49.5% 49.5% 49.5%Period wks 1.43 1.71 5.89 7.25 1.34 1.60 19.22Lost time % 13.1% 13.1% 13.1% 13.1% 13.1% 13.1%Crushing time hrs 208.6 250.2 860.3 1,058.4 195.5 232.9Peak (P), Off-peak (O), Flat (F)Export price $/MWh 8,760.0Boiler No. #4 #2/#3 #4 #2/#3 #4 #2/#3 #4 #2/#3 #4 #2/#3 #4 #2/#3Boiler load t/h 0.00 396.97 0.00 396.97 0.00 396.97 0.00 396.97 0.00 396.97 0.00 396.97STG condensor flow t/h 0.00 0.00 0.00 0.00 0.00 0.00 0.00 0.00 0.00 0.00 0.00 0.00Site electrical loads: kW

Base Factory Load kW 9,000.0 9,000.0 9,000.0 9,000.0 9,000.0 9,000.0Reduce LP SOC to 45% kW 0.0 0.0 0.0 0.0 0.0 0.0

Upgrade #3 boiler to 45bar kW 0.0 0.0 0.0 0.0 0.0 0.0Shut #1 Boiler kW 0.0 0.0 0.0 0.0 0.0 0.0

New 150t/h Boiler kW 0.0 0.0 0.0 0.0 0.0 0.0New STG kW 0.0 0.0 0.0 0.0 0.0 0.0

Demin Plant kW 0.0 0.0 0.0 0.0 0.0 0.0Bagasse handling increase kW 0.0 0.0 0.0 0.0 0.0 0.0

Total MW 0.000 9.000 0.000 9.000 0.000 9.000 0.000 9.000 0.000 9.000 0.000 9.000

Total MW 9.000 9.000 9.000 9.000 9.000 9.000Generation - while crushing MW 0.000 19.000 0.000 19.000 0.000 19.000 0.000 19.000 0.000 19.000 0.000 19.000

- while not crushing MWh 416.4 476.0 1,716.8 2,122.0 363.0 464.9Export - while crushing MW 10.000 10.000 10.000 10.000 10.000 10.000

- while not crushing MWh 235.3 274.3 949.4 1,176.9 205.3 266.6Bagasse - surplus while crushing t/h 43.74 43.74 43.74 43.74 43.74 43.74

- used while not crushing tonne 3,234.4 3,695.6 13,378.7 16,523.9 2,837.7 3,606.5Coal t/h 0.0 0.0 0.0 0.0 0.0 0.0 0.0 0.0 0.0 0.0 0.0 0.0Boiler make-up water t/h 0.0 0.0 0.0 0.0 0.0 0.0 0.0 0.0 0.0 0.0 0.0 0.0Ash cartage t/h 0.00 8.98 0.00 8.98 0.00 8.98 0.00 8.98 0.00 8.98 0.00 8.98ORER: - Fossil fuel ratio (FSL) % 0.00% 0.00% 0.00% 0.00% 0.00% 0.00%

- Non eligible aux (AUX) MW 0.000 0.147 0.000 0.147 0.000 0.147 0.000 0.147 0.000 0.147 0.000 0.147Export - energy (adjusted) MWh 0 2,252 2,693 9,266 11,408 2,095 2,517 30,232

- revenue $ 0 141,934 90,335 592,291 355,831 200,503 78,515 1,459,407RECs - TLEG MWh 339 4,030 388 4,831 1,399 16,621 1,729 20,450 296 3,772 379 4,499

- AUX MWh 0 31 0 37 0 127 0 156 0 29 0 34- FSL MWh 0.0 0.0 0.0 0.0 0.0 0.0

- Eligible generation 0 4,338 5,181 17,892 22,022 4,039 4,843 58,315- revenue $ 0 216,900 259,050 894,600 1,101,100 201,950 242,150 2,915,750

Bagasse stockpiled tonne 0 6,173 7,588 25,417 31,205 5,977 6,894 83,255Coal consumed tonne 0.0 0.0 0.0 0.0 0.0 0.0 0.0 0.0 0.0 0.0 0.0 0.0 0.0 0.0Boiler treated make-up water tonne 0.0 0.0 0.0 0.0 0.0 0.0 0.0 0.0 0.0 0.0 0.0 0.0 0.0 0.0Ash cartage tonne 0 0.0 1,872.5 0.0 2,246.0 0.0 7,721.9 0.0 9,500.1 0.0 1,754.6 0.0 2,090.0 25,185

31.19O

6Current Mode

P O P O P95.69

Financial Summary (Crushing season)

713TCH (2008 current match)

Cogeneration Mode64 4 5 5

63.03 33.54 63.92 31.19

5

� Start date 9 June � Total lost time 13.1% � Season length 19.2 weeks � Cane fibre 15.78% � Bagasse moisture 49.50% � LP SOC 49.5% (353 t/h steam) � Generation 19.0MW � Site load 9.0MW Boiler conditions were set as:

Parameter #1 Boiler #2 Boiler #3 Boiler

MCR (t/h) 97.5 205 106

Steam flow (t/h) 94.7 199.3 103.3

Pressure (kPag) 1,800 1,780 1,750

Temperature (C) 324 302 295

Efficiency (%) 61.5 67.0 67.0

Blowdown (%) 2.0 2.0 2.0

Feedwater Temp (C) 98.1 98.1 98.1

Boilers #2 and #3 are shown combined in Figure 1. The model accounts for bagasse consumed during milling train stops, based on an assumed average duration of stops and a reducing LP steam consumption profile as stoppages progress. The model also assumes that powerhouse generation is controlled during stoppages to maintain a HP/LP steam balance. Figure 2 shows a summary of the crushing season outputs for separate time periods. Cogeneration mode 4 covers Quarter2, mode 5 covers Q3, and mode 6 covers Q4. Outputs are then subdivided into electricity peak and off-peak time periods to calculate the revenue available under a likely quarterly/peak/offpeak PPA pricing structure. The far right column shows crushing season totals. Predicted outputs from the model are compared with actual or observed outputs in the following table:

Parameter Model prediction Actual/observed (2008)

Total boiler load (t/h) 397 412

LP venting (t/h) 40 49

Make-up flow (t/h) 0 12

Total eligible generation (MWh) 58,300 58,800

Total export (MWh) 30,200 32,200

Total surplus bagasse (tonne) 83,000 ~10,000

The eligible generation (for RECs) and export predictions are quite accurate, and the model emulates the ORER calculator by accounting for non-eligible auxiliary loads. The difference in the total boiler load, LP venting and make-up steam flows is due to the model solving for a boiler load that gives no make-up flow. However, TSL typically

6

operates the boilers near MCR, producing a HP/LP make-up flow and heavier venting, as a means of controlling surplus bagasse. This would not occur under a Cogeneration project. The parameter which produced a poor match was the amount of surplus bagasse predicted (83,000 tonne predicted, vs about 10,000 tonne actual). The model uses the common SRI formula for bagasse production and calorific value, with an option to use the equations published by Wright (ASSCT, 2003). The latter was used as it accounts for dirt in bagasse and results in a lower calculation of both bagasse produced and bagasse calorific value. Even so, the poor match requires further investigation, and could be attributed to: � Higher dirt levels than used in the Wright model; � Higher average bagasse moistures than the figure used (49.5%); � Higher consumption during stoppages due to continued venting, rather than

maintaining a HP/LP steam balance; or � Lower boiler efficiencies than those supplied with the TSL data.

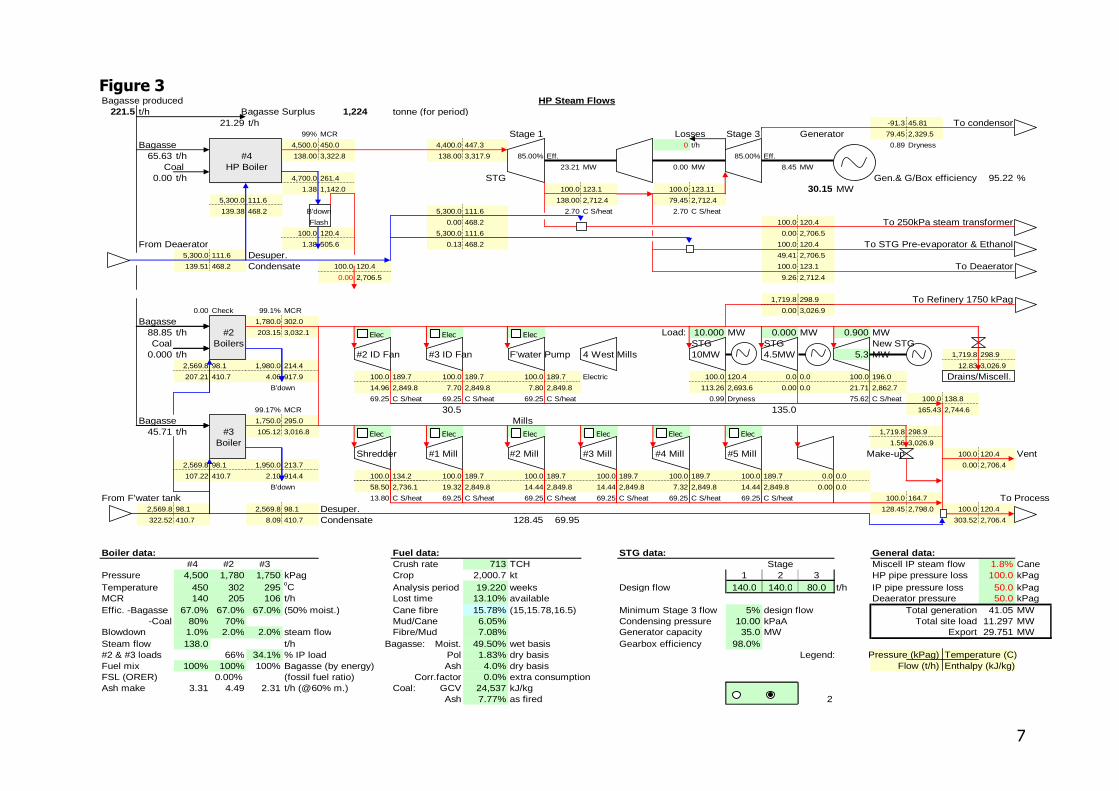
The model was not adjusted for subsequent Cogeneration modeling options with respect to bagasse availability, so the results may over-estimate the project outputs. It is recommended that a detailed feasibility study gives priority to determining the correct bagasse production and consumption figures, and should include an investigation by SRI into current boiler efficiencies. New Boiler Arrangement (Options C, D, E and F) Figure 3 shows the general schematic of the HP steam circuit with a 140 t/h 45 barg boiler, 33MW condensing/extraction STG and cooling tower, and no change to the process plant (Option C). The boiler would be located beside #3 boiler, a new turbine hall located beside the existing powerhouse, and the cooling tower located to the immediate north of the turbine hall. Boiler #1 would be decommissioned and the bagasse feed conveyor would be extended. This would be the same arrangement for all the new boiler options. Figure 4 shows the dedicated pre-evaporator (PE), the condensate return circuit from the PE and STG condenser to the deaerator, and the Demineralisation (demin) plant water circuit. The following features have been modelled for operations with a new Cogen boiler: � All auxiliary drives on the new boiler are electric (~1,700kW consumed); � #2 and #3 boilers are operated at MCR and supply IP steam (17 barg) to all existing

turbines; � The reduced availability of IP steam results in the 2 x 2.2MW TA’s being

decommissioned, and the 5.5MW TA load reduced to about 1 MW (an electric drive would need to installed on the shredder to reclaim the lost powerhouse load, and this would create extra RECs but little extra export);

� The IP powerhouse TA loads control the LP steam pressure, so there is no IP/LP make-up steam flow or LP steam venting (i.e. steam balance is maintained);

� HP steam from the new boiler only supplies the new STG;

7

Figure 3 Bagasse produced

221.5 t/h Bagasse Surplus tonne (for period)21.29 t/h -91.3 45.81 To condensor

99% MCR Stage 1 Stage 3 Generator 79.45 2,329.5

Bagasse 4,500.0 450.0 4,400.0 447.3 0 t/h 0.89 Dryness

65.63 t/h 138.00 3,322.8 138.00 3,317.9 85.00% Eff. 85.00% Eff.

23.21 MW 0.00 MW 8.45 MW

0.00 t/h 4,700.0 261.4 STG Gen.& G/Box efficiency 95.22 %1.38 1,142.0 100.0 123.1 100.0 123.11 30.15 MW

5,300.0 111.6 138.00 2,712.4 79.45 2,712.4

139.38 468.2 5,300.0 111.6 2.70 C S/heat 2.70 C S/heat

0.00 468.2 100.0 120.4 To 250kPa steam transformer100.0 120.4 5,300.0 111.6 0.00 2,706.5

From Deaerator 1.38 505.6 0.13 468.2 100.0 120.4 To STG Pre-evaporator & Ethanol5,300.0 111.6 Desuper. 49.41 2,706.5

139.51 468.2 Condensate 100.0 120.4 100.0 123.1 To Deaerator0.00 2,706.5 9.26 2,712.4

1,719.8 298.9 To Refinery 1750 kPag0.00 Check 99.1% MCR 0.00 3,026.9

Bagasse 1,780.0 302.0

88.85 t/h #2 203.15 3,032.1 FALSE FALSE FALSE Load: 10.000 MW 0.000 MW 0.900 MWCoal Boilers STG STG New STG

0.000 t/h #2 ID Fan #3 ID Fan F'water Pump 4 West Mills 10MW 4.5MW 5.3 MW 1,719.8 298.9

2,569.8 98.1 1,980.0 214.4 12.83 3,026.9

207.21 410.7 4.06 917.9 100.0 189.7 100.0 189.7 100.0 189.7 Electric 100.0 120.4 0.0 0.0 100.0 196.0

14.96 2,849.8 7.70 2,849.8 7.80 2,849.8 113.26 2,693.6 0.00 0.0 21.71 2,862.7

69.25 C S/heat 69.25 C S/heat 69.25 C S/heat 0.99 Dryness 75.62 C S/heat 100.0 138.8

99.17% MCR 30.5 135.0 165.43 2,744.6

Bagasse 1,750.0 295.0 Mills45.71 t/h #3 105.12 3,016.8 FALSE FALSE FALSE FALSE FALSE FALSE TRUE 1,719.8 298.9

Boiler 1.56 3,026.9

Shredder #1 Mill #2 Mill #3 Mill #4 Mill #5 Mill Make-up 100.0 120.4 Vent2,569.8 98.1 1,950.0 213.7 0.00 2,706.4

107.22 410.7 2.10 914.4 100.0 134.2 100.0 189.7 100.0 189.7 100.0 189.7 100.0 189.7 100.0 189.7 0.0 0.0

58.50 2,736.1 19.32 2,849.8 14.44 2,849.8 14.44 2,849.8 7.32 2,849.8 14.44 2,849.8 0.00 0.0

From F'water tank 13.80 C S/heat 69.25 C S/heat 69.25 C S/heat 69.25 C S/heat 69.25 C S/heat 69.25 C S/heat 100.0 164.7 To Process2,569.8 98.1 2,569.8 98.1 Desuper. 128.45 2,798.0 100.0 120.4

322.52 410.7 8.09 410.7 Condensate 128.45 69.95 303.52 2,706.4

Boiler data: Fuel data: FALSE STG data: General data:#4 #2 #3 Crush rate 713 TCH Miscell IP steam flow 1.8% Cane

Pressure 4,500 1,780 1,750 kPag Crop 2,000.7 kt 1 2 3 HP pipe pressure loss 100.0 kPagTemperature 450 302 295 oC Analysis period 19.220 weeks Design flow 140.0 140.0 80.0 t/h IP pipe pressure loss 50.0 kPagMCR 140 205 106 t/h Lost time 13.10% available Deaerator pressure 50.0 kPagEffic. -Bagasse 67.0% 67.0% 67.0% (50% moist.) Cane fibre 15.78% (15,15.78,16.5) Minimum Stage 3 flow 5% design flow Total generation 41.05 MW

-Coal 80% 70% Mud/Cane 6.05% Condensing pressure 10.00 kPaA Total site load 11.297 MWBlowdown 1.0% 2.0% 2.0% steam flow Fibre/Mud 7.08% Generator capacity 35.0 MW Export 29.751 MWSteam flow 138.0 t/h Bagasse: Moist. 49.50% wet basis Gearbox efficiency 98.0%#2 & #3 loads 66% 34.1% % IP load Pol 1.83% dry basis Legend: Pressure (kPag) Temperature (C)Fuel mix 100% 100% 100% Bagasse (by energy) Ash 4.0% dry basis Flow (t/h) Enthalpy (kJ/kg)FSL (ORER) (fossil fuel ratio) Corr.factor 0.0% extra consumptionAsh make 3.31 4.49 2.31 t/h (@60% m.) Coal: GCV 24,537 kJ/kg

Ash 7.77% as fired 2

B'down

B'down

Stage

HP Boiler

Flash

B'down

HP Steam Flows

Drains/Miscell.

Losses

#4

1,224

0.00%

Coal

Elec Elec Elec

Elec Elec Elec Elec Elec Elec

8

Figure 4

LP Steam/cane 49.5% Load share: 14.0% #4 boiler Legend: Pressure (kPag) Temperature (C)#2/#3 boiler Flow (t/h) Enthalpy (kJ/kg)

To steam transformer 100.0 120.4

0.00 2,706.5

400.0 100.0 Condensate 2Refinery 1750kPa 1,719.8 298.9 0.00 418.8 250 kPag Steam transform.

0.00 3,026.9

Make-up 62 kPa Main 250.0 139.0 250.0 139.0

Miscell. 0.00 2,731.7 0.00 2,731.7

200kPag 400.0 100.0

0.0 t/h 110.0 Cond- 0.00 418.8

t/h ensorFrom #2/3 Boiler

100.0 120.4 Pans Incon. gas 100.0 120.4

303.52 2,706.4 1.0 t/h 0.00 505.2

Ethanol 300.0 120.4

Plant 302.5 505.3 0.0 100.0 Flash100.0 120.4 Flash 300.0 96.0 11.32 2,675.8

0.00 2,706.4 31.3 402.0

Thermal loss2.0%

From #1 Boiler100.0 120.4 Incon. gas Direct Inj. Pressurised49.41 2,706.4 0.5 t/h Temper. 96.0 C 2

To process100.0 120.4 To #2 and #3 Boilers

From #1 Boiler 0.0 2,706.4 2,569.8 98.1

322.52 410.7

300.0 120.4

Demin 300.0 32.0 48.91 505.3

Plant 1.88 134.0 600.0 90.0 2 100.0 123.1

Conden. STG 0.00 376.7 9.26 2,712.4 0.00-91.3 45.8 600.0 45.8 500.0 45.8 500.0 45.8 5,300.0 111.7 To #1 Boiler79.45 2,329.5 81.33 191.6 81.33 191.6 81.33 191.6 Press. 50.0 kPag 139.51 468.1

STG Condensor Waste condensate reheater500.0 90.0 Appr. Temper. 100.0 120.4 Ethanol condensate

0.0 376.7 4.0 C 0.00 505.3

To effluentCooling water

#1 Evaporators#2 to #5

Evaporators

NewPre-Evaporator Feedwater

Deaerator

LP Steam and Condensate Diagram

Boiler reserve

86.0%

Heaters

PansEthanol

Molecular Sieve

BoilerfeedwaterHot Water

Y

N

Y N

Y N

Refinery

9

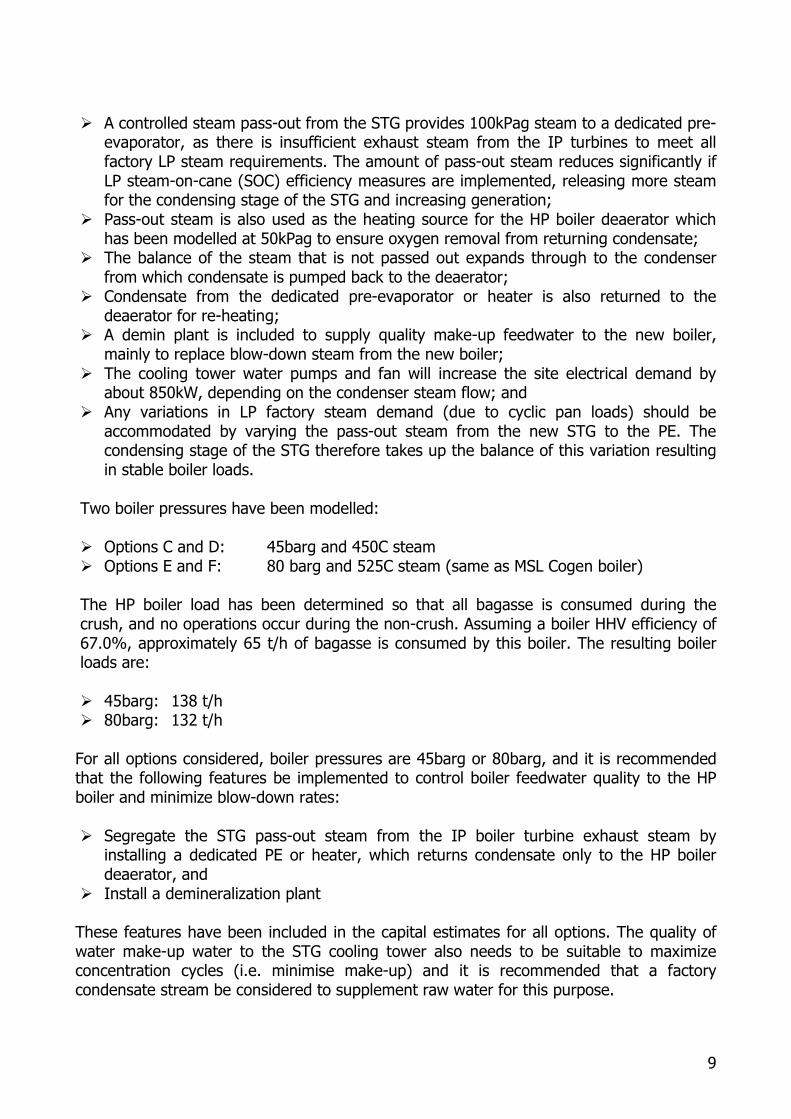
� A controlled steam pass-out from the STG provides 100kPag steam to a dedicated pre-

evaporator, as there is insufficient exhaust steam from the IP turbines to meet all factory LP steam requirements. The amount of pass-out steam reduces significantly if LP steam-on-cane (SOC) efficiency measures are implemented, releasing more steam for the condensing stage of the STG and increasing generation;

� Pass-out steam is also used as the heating source for the HP boiler deaerator which has been modelled at 50kPag to ensure oxygen removal from returning condensate;

� The balance of the steam that is not passed out expands through to the condenser from which condensate is pumped back to the deaerator;

� Condensate from the dedicated pre-evaporator or heater is also returned to the deaerator for re-heating;

� A demin plant is included to supply quality make-up feedwater to the new boiler, mainly to replace blow-down steam from the new boiler;

� The cooling tower water pumps and fan will increase the site electrical demand by about 850kW, depending on the condenser steam flow; and

� Any variations in LP factory steam demand (due to cyclic pan loads) should be accommodated by varying the pass-out steam from the new STG to the PE. The condensing stage of the STG therefore takes up the balance of this variation resulting in stable boiler loads.

Two boiler pressures have been modelled: � Options C and D: 45barg and 450C steam � Options E and F: 80 barg and 525C steam (same as MSL Cogen boiler) The HP boiler load has been determined so that all bagasse is consumed during the crush, and no operations occur during the non-crush. Assuming a boiler HHV efficiency of 67.0%, approximately 65 t/h of bagasse is consumed by this boiler. The resulting boiler loads are: � 45barg: 138 t/h � 80barg: 132 t/h For all options considered, boiler pressures are 45barg or 80barg, and it is recommended that the following features be implemented to control boiler feedwater quality to the HP boiler and minimize blow-down rates: � Segregate the STG pass-out steam from the IP boiler turbine exhaust steam by

installing a dedicated PE or heater, which returns condensate only to the HP boiler deaerator, and

� Install a demineralization plant These features have been included in the capital estimates for all options. The quality of water make-up water to the STG cooling tower also needs to be suitable to maximize concentration cycles (i.e. minimise make-up) and it is recommended that a factory condensate stream be considered to supplement raw water for this purpose.

10

Another option that has not been modelled, but will increase the generation output, is to install a STG condensate reheater using either #2 effet vapour, or a factory waste hot water stream. The condensate returning from the STG will be around 45C and this needs to be heated by pass-out steam in the dearator, so any heating by a factory stream will reduce the pass-out needed. SRI report number 3215 for TSL recommends #2 vapour as this is also consistent with reducing the LP SOC. For all options, the bagasse firing rate is very similar to current operations, so the capacity of bagasse conveyors and the ash plant is of no concern. Upgrade #3 Boiler (Options A and B) Instead of installing a new boiler, TSL has the opportunity to increase the pressure and temperature of the existing #3 ABB Boiler to 45 barg and 450C respectively, and install a matching STG. This has some obvious logistical advantages over installing a new HP boiler, including: � No site preparation or space restrictions; � No extension required for the bagasse feed conveyor; � No change to the bagasse feed distribution to all boilers; � No requirement to partition #3 chimney for dual boiler operation; and � Much lower cost and commissioning risk. The statements made in the 2003 Alstom report regarding the boiler capacity have been assumed correct and have been incorporated in the design modelling for an upgraded #3 boiler. These include: � Steam conditions of 45 barg and 450C; � Minimal work required to maintain the boiler at it’s current nominated efficiency of

67%; � Assumption that the heat-to-steam rate remains constant (i.e. steam output will fall

marginally at the higher steam conditions to maintain a constant bagasse firing rate); � A new, larger superheater needs to be installed; � Steam outlet pipework, and isolation and relief valves need replacing; � A new dedicated feedwater pump is required to supply water at the higher pressure; � All other boiler components remain unchanged. Figure 5 shows the HP and IP steam circuits for Option A, while Figure 6 shows the LP pass-out steam flows and condensate return to the deaerator. The IP steam circuit for #1 and #2 boiler under this arrangement is very similar to the operation of #2 and #3 under the new boiler options, although the lower capacity of #1 boiler means that the IP powerhouse load needs to reduce further. The pass-out from the STG also needs to increase by about 8 t/h to compensate for the lower exhaust steam from the IP turbines.

11

Figure 5 Bagasse produced

221.5 t/h Bagasse Surplus tonne (for period)39.27 t/h -91.3 45.81 To condensor

98% MCR Stage 1 Stage 3 Generator 37.73 2,329.5

Bagasse 4,500.0 450.0 4,400.0 447.3 0 t/h 0.89 Dryness

46.61 t/h 98.00 3,322.8 98.00 3,317.9 85.00% Eff. 85.00% Eff.

16.48 MW 0.00 MW 4.01 MW

0.00 t/h 4,700.0 261.4 STG Gen.& G/Box efficiency 93.49 %0.98 1,142.0 100.0 123.1 100.0 123.11 19.16 MW

5,300.0 111.6 98.00 2,712.4 37.73 2,712.4

98.98 468.2 5,300.0 111.6 2.70 C S/heat 2.70 C S/heat

0.00 468.2 100.0 120.4 To 250kPa steam transformer100.0 120.4 5,300.0 111.6 0.00 2,706.5

From Deaerator 0.98 505.6 0.15 468.2 100.0 120.4 To STG Pre-evaporator & Ethanol5,300.0 111.6 Desuper. 56.47 2,706.5

99.13 468.2 Condensate 100.0 120.4 100.0 123.1 To Deaerator0.00 2,706.5 3.94 2,712.4

1,736.4 308.4 To Refinery 1750 kPag0.00 Check 99.0% MCR 0.00 3,048.1

Bagasse 1,780.0 302.0

88.81 t/h #2 203.04 3,032.1 FALSE FALSE FALSE Load: 10.000 MW 0.000 MW 0.700 MWCoal Boilers STG STG New STG

0.000 t/h #2 ID Fan #1 ID Fan F'water Pump 4 West Mills 10MW 4.5MW 5.3 MW 1,736.4 308.4

2,586.4 98.1 1,980.0 214.4 12.83 3,048.1

207.11 410.7 4.06 917.9 100.0 198.5 100.0 198.5 100.0 198.5 Electric 100.0 121.3 0.0 0.0 100.0 213.3

14.77 2,867.7 7.78 2,867.7 7.54 2,867.7 111.17 2,708.5 0.00 0.0 18.59 2,897.5

78.11 C S/heat 78.11 C S/heat 78.11 C S/heat 0.92 C S/heat 92.92 C S/heat 100.0 146.5

98.90% MCR 30.1 129.8 159.85 2,760.5

Bagasse 1,800.0 324.0 Mills46.80 t/h #1 96.43 3,081.7 FALSE FALSE FALSE FALSE FALSE FALSE TRUE 1,736.4 308.4

Boiler 0.71 3,048.1

Shredder #1 Mill #2 Mill #3 Mill #4 Mill #5 Mill Make-up 100.0 120.4 Vent2,586.4 98.1 2,000.0 214.9 0.00 2,706.4

98.36 410.7 1.93 920.1 100.0 141.7 100.0 198.5 100.0 198.5 100.0 198.5 100.0 198.5 100.0 198.5 0.0 0.0

57.43 2,751.8 18.96 2,867.7 14.17 2,867.7 14.17 2,867.7 7.18 2,867.7 14.17 2,867.7 0.00 0.0

From F'water tank 21.30 C S/heat 78.11 C S/heat 78.11 C S/heat 78.11 C S/heat 78.11 C S/heat 78.11 C S/heat 100.0 173.0 To Process2,586.4 98.1 2,586.4 98.1 Desuper. 126.08 2,814.9 100.0 120.4

315.29 410.7 9.82 410.7 Condensate 126.08 68.66 296.47 2,706.4

Boiler data: Fuel data: FALSE STG data: General data:#3 #2 #1 Crush rate 713 TCH Miscell IP steam flow 1.8% Cane

Pressure 4,500 1,780 1,800 kPag Crop 2,000.7 kt 1 2 3 HP pipe pressure loss 100.0 kPagTemperature 450 302 324 oC Analysis period 19.220 weeks Design flow 98.0 98.0 50.0 t/h IP pipe pressure loss 50.0 kPagMCR 100 205 97.5 t/h Lost time 13.10% available Deaerator pressure 50.0 kPagEffic. -Bagasse 67.0% 67.0% 61.5% (50% moist.) Cane fibre 15.78% (15,15.78,16.5) Minimum Stage 3 flow 5% design flow Total generation 29.86 MW

-Coal 80% 70% Mud/Cane 6.05% Condensing pressure 10.00 kPaA Total site load 10.607 MWBlowdown 1.0% 2.0% 2.0% steam flow Fibre/Mud 7.08% Generator capacity 22.0 MW Export 19.255 MWSteam flow 98.0 t/h Bagasse: Moist. 49.50% wet basis Gearbox efficiency 98.0%#2 & #3 loads 68% 32.2% % IP load Pol 1.83% dry basis Legend: Pressure (kPag) Temperature (C)Fuel mix 100% 100% 100% Bagasse (by energy) Ash 4.0% dry basis Flow (t/h) Enthalpy (kJ/kg)FSL (ORER) (fossil fuel ratio) Corr.factor 0.0% extra consumptionAsh make 2.35 4.48 2.36 t/h (@60% m.) Coal: GCV 24,537 kJ/kg

Ash 7.77% as fired 2

HP Steam Flows

Drains/Miscell.

Losses

#3

58,490

0.00%

Coal

B'down

B'down

Stage

HP Boiler

Flash

B'down

Elec Elec Elec

Elec Elec Elec Elec Elec Elec

12

Figure 6

LP Steam/cane 49.5% Load share: 16.0% #4 boiler Legend: Pressure (kPag) Temperature (C)#2/#3 boiler Flow (t/h) Enthalpy (kJ/kg)

To steam transformer 100.0 120.4

0.00 2,706.5

400.0 100.0 Condensate 2Refinery 1750kPa 1,736.4 308.4 0.00 418.8 250 kPag Steam transform.

0.00 3,048.1

Make-up 62 kPa Main 250.0 139.0 250.0 139.0

Miscell. 0.00 2,731.7 0.00 2,731.7

200kPag 400.0 100.0

0.0 t/h 110.0 Cond- 0.00 418.8

t/h ensorFrom #2/3 Boiler

100.0 120.4 Pans Incon. gas 100.0 120.4

296.47 2,706.4 1.0 t/h 0.00 505.2

Ethanol 300.0 120.4

Plant 295.5 505.3 0.0 100.0 Flash100.0 120.4 Flash 300.0 96.0 11.06 2,675.8

0.00 2,706.4 30.9 402.0

Thermal loss2.0%

From #1 Boiler100.0 120.4 Incon. gas Direct Inj. Pressurised56.47 2,706.4 0.5 t/h Temper. 96.0 C 2

To process100.0 120.4 To #2 and #3 Boilers

From #1 Boiler 0.0 2,706.4 2,586.4 98.1

315.29 410.7

300.0 120.4

Demin 300.0 32.0 55.97 505.3

Plant 1.48 134.0 600.0 90.0 2 100.0 123.1

Conden. STG 0.00 376.7 3.94 2,712.4 0.00-91.3 45.8 600.0 45.8 500.0 45.8 500.0 45.8 5,300.0 111.7 To #1 Boiler37.73 2,329.5 39.21 191.6 39.21 191.6 39.21 191.6 Press. 50.0 kPag 99.13 468.1

STG Condensor Waste condensate reheater500.0 90.0 Appr. Temper. 100.0 120.4 Ethanol condensate

0.0 376.7 4.0 C 0.00 505.3

To effluent

Feedwater

Deaerator

LP Steam and Condensate Diagram

Boiler reserve

84.0%

Cooling water

#1 Evaporators#2 to #5

Evaporators

NewPre-Evaporator

Heaters

PansEthanol

Molecular Sieve

BoilerfeedwaterHot Water

Y

N

Y N

Y N

Refinery

13

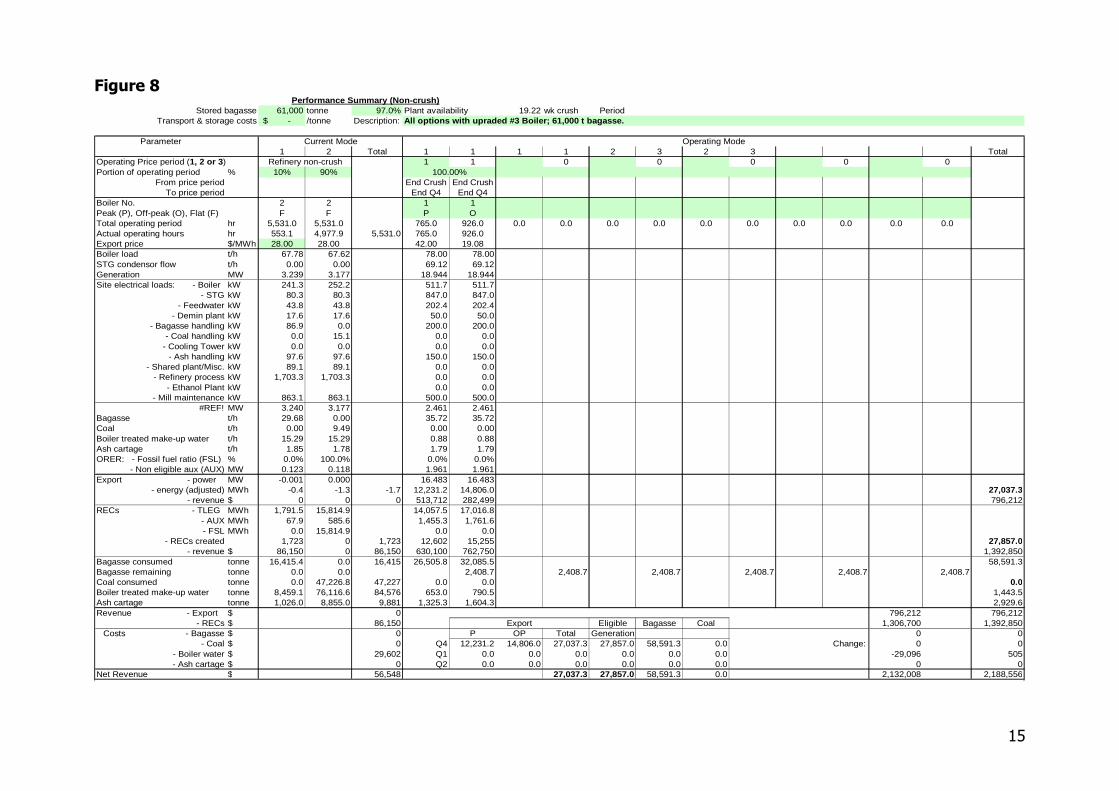
The HP steam circuit from the upgraded #3 boiler is identical to the new boiler options, with HP steam feeding a 22MW STG, pass-out steam feeding a dedicated PE and a new deaerator, a condenser with condensate return pumps, and a cooling tower. The condenser and cooling tower are only about half the capacity of the new boiler options, because the HP steam flow from #3 boiler is 98 t/h compared to 132 / 138 t/h from the new boiler. A further requirement is the electrification of #3 boiler ID fan and the new #3 feedwater pump. This is needed for the IP steam balance so that the IP powerhouse loads can be maintained, and RECs are effectively created. The model predicts that this mode of operation (i.e. both upgraded #3 Boiler options) will result in about 60,000 tonne of surplus bagasse by the end of the season. This is subject to the earlier comments regarding bagasse quantities predicted by the matching run. Compared to the new boiler options which result in no surplus bagasse, this option offers the opportunity to operate into the non-crush and obtain a better capacity factor for the new installed plant. It also gives access to higher pool prices in Quarter 4, compared to Quarters 2 and 3. The issue for TSL is managing the wet weather risk of storing and reclaiming bagasse during November and December. Non-Crush Cogen Operations (Options A and B only) Figure 7 shows how the upgraded #3 boiler and 22MW STG would operate during the non-crush in fully condensing mode. The only STG pass-out steam at 100 kPa would be to supply 9 t/h steam to the deaerator for condensate reheating. The boiler load of 78 t/h has been chosen so that the steam flow to the condenser is similar to that in the crushing season. This provides maximum capacity utilization of the condenser. There is obviously an option to install a larger condenser and increase the boiler load to MCR (98 t/h) and effectively reduce the non-crush operations by about 20%. Figure 8 summarises the operation and outputs during this period. 60,000 tonne of bagasse would be consumed within 10 weeks, or 8 weeks with a full capacity condenser and cooling tower. Assuming an early June start to crush and a 19-20 week season, this operation would be completed by Christmas. Understandably, this would create some challenges with bagasse reclamation during Tully’s wet weather periods, but the rewards are significant. The model predicts a generation load of 18.9 MW, a site load of 2.4 MW (allowing 0.5 MW for general mill maintenance that doesn’t need to be imported) and export of 16.5 MW. An extra 27,800 RECs would be produced in this period, allowing for the much higher proportion of non-eligible auxiliary load during this period. Since the #3 boiler HP steam and condensate system is effectively segregated from the #1 and #2 boiler steam circuit, the transition to non-crush generation would be continuous and seamless, and maintenance could be undertaken safely on all milling and process plant. There may be a need for one block-and-bleed isolation valve on the pass-out pipe to the dedicated PE.

14

Figure 7

Stage 1 Stage 2 Stage 3 GeneratorBagasse 4,500.0 450.0 4,400.0 447.3 0.1 t/h

35.72 t/h 78.00 3,322.8 78.00 3,317.9 85.00% Eff. 85.00% Eff.

Coal 13.99 MW 6.28 MW Generator and G/Box efficency 93.43 %0.00 t/h 4,700.0 261.4 STG

0.78 1,142.0 50.0 111.6 50.0 111.6 18.94 MW -91.3 45.81

78.00 2,672.0 69.22 2,672.0 69.12 2,345.3

0.99 Dryness 0.99 Dryness 0.90 Dryness

5,300.0 111.6

78.78 468.2 5,300.0 111.6 To Pre-evaporator0.00 468.2 50.0 111.6

50.0 111.6 Desuperheat 0.00 2,693.5

0.78 468.2 Condensate

50.0 111.6

8.78 2,672.0

5,300.0 111.6 278.78 468.22 50.0 111.6 Cooling water 300.0 30.0 Demin

0.0 0.00 2,672.0 0.88 125.7 Plant500.0 45.9 600.0 45.8 Condensor70.00 191.8 70.00 191.8

Legend: ReheaterSteam 500.0 111.6

Condensate 0.00 468.2

Press.(kPag) Temperature (C)Flow (t/h) Enthalpy (kJ/kg) 0.0 0.0 Condensate from Pre-evap

0.00 0.0

Boiler data: Fuel data: STG data: General data:Pressure 4,500 kPag Fuel mix 100% Bagasse (by energy) HP pipe pressure loss 100.0 kPagTemperature 450.0 oC Bagasse: 1 2 3 Deaerator pressure 50.0 kPagSteam flow 78.0 t/h Moisture 50.0% Design flow 98.0 98.0 70.0 t/hMCR 100.0 t/h Pol 1.83% dry basisEffic. -Bagasse 67.0% (50% moist.) Ash 4.0% dry basis Minimum Stage 3 flow 5% design flow

-Coal 70.0% Correct.factor 0.0% extra consumption Condensing pressure 10.00 kPaABlowdown 1.0% steam flow Coal: Generator capacity 22.0 MWFSL (ORER) 0% (fossil fuel ratio) GCV 24,537 kJ/kg Gearbox efficiency 98.0%Ash make 1.79 t/h (@60% m.) Ash 7.77% as fired

Stage

Losses

HP Boiler

HP Steam Diagram (Period 1)

Deaerator

B'downFlash

O C

15

Figure 8

Stored bagasse 61,000 tonne 97.0% Plant availability 19.22 wk crush Period 1 1Transport & storage costs -$ /tonne Description:

Parameter1 2 Total 1 1 1 1 2 3 2 3 Total

Operating Price period (1, 2 or 3) 1 1 0 0 0 0 0Portion of operating period % 10% 90%

From price period End Crush End CrushTo price period End Q4 End Q4

Boiler No. 2 2 1 1Peak (P), Off-peak (O), Flat (F) F F P OTotal operating period hr 5,531.0 5,531.0 765.0 926.0 0.0 0.0 0.0 0.0 0.0 0.0 0.0 0.0 0.0 0.0 5,531.0Actual operating hours hr 553.1 4,977.9 5,531.0 765.0 926.0Export price $/MWh 28.00 28.00 42.00 19.08Boiler load t/h 67.78 67.62 78.00 78.00STG condensor flow t/h 0.00 0.00 69.12 69.12Generation MW 3.239 3.177 18.944 18.944Site electrical loads: - Boiler kW 241.3 252.2 511.7 511.7

- STG kW 80.3 80.3 847.0 847.0- Feedwater kW 43.8 43.8 202.4 202.4

- Demin plant kW 17.6 17.6 50.0 50.0- Bagasse handling kW 86.9 0.0 200.0 200.0

- Coal handling kW 0.0 15.1 0.0 0.0- Cooling Tower kW 0.0 0.0 0.0 0.0

- Ash handling kW 97.6 97.6 150.0 150.0- Shared plant/Misc. kW 89.1 89.1 0.0 0.0

- Refinery process kW 1,703.3 1,703.3 0.0 0.0- Ethanol Plant kW 0.0 0.0

- Mill maintenance kW 863.1 863.1 500.0 500.0#REF! MW 3.240 3.177 2.461 2.461

Bagasse t/h 29.68 0.00 35.72 35.72Coal t/h 0.00 9.49 0.00 0.00Boiler treated make-up water t/h 15.29 15.29 0.88 0.88Ash cartage t/h 1.85 1.78 1.79 1.79ORER: - Fossil fuel ratio (FSL) % 0.0% 100.0% 0.0% 0.0%

- Non eligible aux (AUX) MW 0.123 0.118 1.961 1.961Export - power MW -0.001 0.000 16.483 16.483

- energy (adjusted) MWh -0.4 -1.3 -1.7 12,231.2 14,806.0 27,037.3- revenue $ 0 0 0 513,712 282,499 796,212

RECs - TLEG MWh 1,791.5 15,814.9 14,057.5 17,016.8- AUX MWh 67.9 585.6 1,455.3 1,761.6- FSL MWh 0.0 15,814.9 0.0 0.0

- RECs created 1,723 0 1,723 12,602 15,255 27,857.0- revenue $ 86,150 0 86,150 630,100 762,750 1,392,850

Bagasse consumed tonne 16,415.4 0.0 16,415 26,505.8 32,085.5 58,591.3Bagasse remaining tonne 0.0 0.0 2,408.7 2,408.7 2,408.7 2,408.7 2,408.7 2,408.7Coal consumed tonne 0.0 47,226.8 47,227 0.0 0.0 0.0Boiler treated make-up water tonne 8,459.1 76,116.6 84,576 653.0 790.5 1,443.5Ash cartage tonne 1,026.0 8,855.0 9,881 1,325.3 1,604.3 2,929.6Revenue - Export $ 0 796,212 796,212

- RECs $ 86,150 Eligible Bagasse Coal 1,306,700 1,392,850Costs - Bagasse $ 0 P OP Total Generation 0 0

- Coal $ 0 Q4 12,231.2 14,806.0 27,037.3 27,857.0 58,591.3 0.0 Change: 0 0- Boiler water $ 29,602 Q1 0.0 0.0 0.0 0.0 0.0 0.0 -29,096 505- Ash cartage $ 0 Q2 0.0 0.0 0.0 0.0 0.0 0.0 0 0

Net Revenue $ 56,548 27,037.3 27,857.0 58,591.3 0.0 2,132,008 2,188,556

Performance Summary (Non-crush)

Current Mode

100.00%Refinery non-crush

All options with upraded #3 Boiler; 61,000 t bagasse.

Operating Mode

Export

16

LP SOC Efficiency Options SRI Report 3215 (Hodgson, Lavarack and Broadfoot) was completed in 2003 and identifies a number of process plant modifications that would reduce TSL’s LP steam consumption from 49.5% to 45% cane. Plant modifications recommended include: � Substituting ESJ for flocculant dilution water � Substituting ESJ for A molasses dilution water � New 514m2 pre-primary heater using #4 effet vapour � Changing primary heaters from #1 effet vapour to #2 vapour � Changing the A continuous pan from LP steam to #1 effet vapour � Upgrade the ESJ heater with a new plate heater � Use the displaced ESJ heater as an STG condensate reheater, using #2 effet vapour � Pressurize the condensate system for the IP boilers The last item doesn’t reduce LP steam usage, but does conserve bagasse and water, and adds value to the cogeneration project (it is being incorporated in the Racecourse Cogeneration project). This report has not been revisited, but it has been assumed that these modifications would be included in the three options where 45% LP SOC has been modeled. However, the original capital estimates have been significantly upgraded to reflect recent pricing increases obtained for the Racecourse project. The revenue benefit of reducing LP SOC to 45% can be seen in the following sections, but in summary, it adds about 3 MW of output to each option. This would equate to approximately $1.0m extra revenue per annum for a capital outlay of around $2.5m.

17

Project Outputs Project outputs for all options are given in the following table:

CurrentUnits Operations 49.5% 45% 49.5% 45% 49.5% 45%

Generator LoadsNew STG MW 19.16 22.13 30.15 33.05 33.64 36.5810 MW STG MW 10.00 10.00 10.00 10.00 10.00 10.00 10.002 x 2.2MW STGs MW 4.10 0.00 0.00 0.00 0.00 0.00 0.005.3MW STG MW 4.90 0.70 0.70 0.90 0.90 0.90 0.90

Total MW 19.00 29.86 32.83 41.05 43.95 44.54 47.48Site LoadsCurrent 9.00 9.00 9.00 9.00 9.00 9.00 9.00Change: MW

- Reduce LP SOC MW 0.00 -0.14 0.00 -0.14 0.00 -0.14- #3 Boiler electric load MW 0.71 0.71 0.00 0.00 0.00 0.00

- Shut #1 Boiler MW 0.00 0.00 -0.35 -0.35 -0.35 -0.35- New 150t/h boiler MW 0.00 0.00 1.70 1.70 1.70 1.70

- New STG MW 0.85 0.85 0.85 0.85 0.85 0.85- Demin plant MW 0.05 0.05 0.05 0.05 0.05 0.05

- Bagasse Handling MW 0.00 0.00 0.05 0.05 0.05 0.05Total MW 9.00 10.61 10.47 11.30 11.16 11.30 11.16

ExportExport to Grid MW 10.00 19.25 22.36 29.75 32.79 33.24 36.32Non-CrushGeneration MW 18.94 18.94Site Loads MW 2.46 2.46Export MW 16.48 16.48ExportQ1 - Peak MWh 0 0 0 0 0 0 0

- Offpeak MWh 0 0 0 0 0 0 0Q2 - Peak MWh 2,252 4,471 5,223 6,918 7,653 7,730 8,473

- Offpeak MWh 2,693 5,323 6,213 8,231 9,100 9,196 10,075Q3 - Peak MWh 9,266 18,451 21,573 28,578 31,627 31,936 35,018

- Offpeak MWh 11,408 22,712 26,554 35,174 38,925 39,306 43,098Q4 - Peak MWh 2,095 16,377 17,074 6,418 7,098 7,171 7,859

- Offpeak MWh 2,517 19,792 20,627 7,711 8,527 8,615 9,440Total MWh 30,231 87,126 97,264 93,030 102,930 103,954 113,963Eligible Generation (RECs)Full year eligible generation MWh 58,315 117,016 126,251 122,054 130,725 132,981 141,763ORER Baseline MWh 15,931 15,931 15,931 15,931 15,931 15,931 15,931RECs 42,384 101,085 110,320 106,123 114,794 117,050 125,832

#3 Boiler Upgrade 150t/h 45bar Boiler 150t/h 80bar Boiler

The total annual electricity export and RECs produced under current operations have been included as the Base Case. Points to note: � The #3 Boiler upgrade option, at 45% LP SOC, generates more annual export power

and RECs than the new boiler option at 49.5% SOC; � The #3 Boiler upgrade options generate a much higher level of output in Quarter 4

(when pool prices are higher), than the new boiler options; and � On TSL’s advice, TLF and DLF have been assumed to be unity.

18

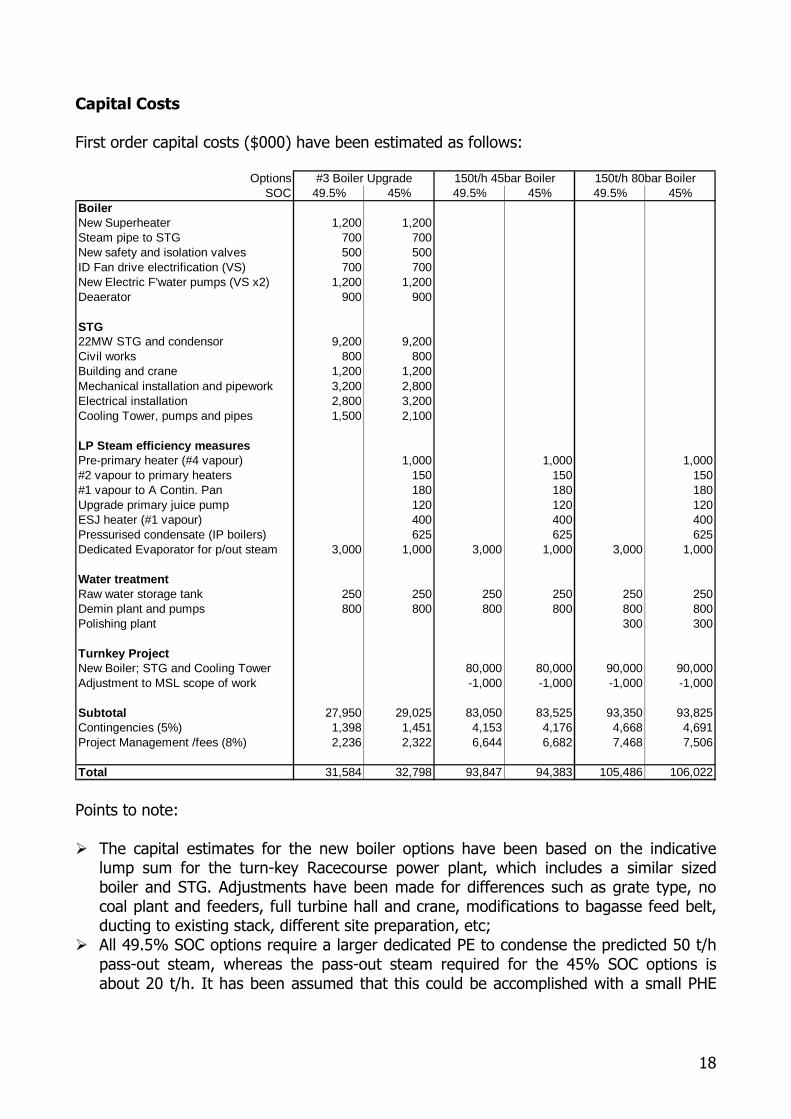
Capital Costs First order capital costs ($000) have been estimated as follows:

OptionsSOC 49.5% 45% 49.5% 45% 49.5% 45%

BoilerNew Superheater 1,200 1,200Steam pipe to STG 700 700New safety and isolation valves 500 500ID Fan drive electrification (VS) 700 700New Electric F'water pumps (VS x2) 1,200 1,200Deaerator 900 900

STG22MW STG and condensor 9,200 9,200Civil works 800 800Building and crane 1,200 1,200Mechanical installation and pipework 3,200 2,800Electrical installation 2,800 3,200Cooling Tower, pumps and pipes 1,500 2,100

LP Steam efficiency measuresPre-primary heater (#4 vapour) 1,000 1,000 1,000#2 vapour to primary heaters 150 150 150#1 vapour to A Contin. Pan 180 180 180Upgrade primary juice pump 120 120 120ESJ heater (#1 vapour) 400 400 400Pressurised condensate (IP boilers) 625 625 625Dedicated Evaporator for p/out steam 3,000 1,000 3,000 1,000 3,000 1,000

Water treatmentRaw water storage tank 250 250 250 250 250 250Demin plant and pumps 800 800 800 800 800 800Polishing plant 300 300

Turnkey ProjectNew Boiler; STG and Cooling Tower 80,000 80,000 90,000 90,000Adjustment to MSL scope of work -1,000 -1,000 -1,000 -1,000

Subtotal 27,950 29,025 83,050 83,525 93,350 93,825Contingencies (5%) 1,398 1,451 4,153 4,176 4,668 4,691Project Management /fees (8%) 2,236 2,322 6,644 6,682 7,468 7,506

Total 31,584 32,798 93,847 94,383 105,486 106,022

#3 Boiler Upgrade 150t/h 45bar Boiler 150t/h 80bar Boiler

Points to note: � The capital estimates for the new boiler options have been based on the indicative

lump sum for the turn-key Racecourse power plant, which includes a similar sized boiler and STG. Adjustments have been made for differences such as grate type, no coal plant and feeders, full turbine hall and crane, modifications to bagasse feed belt, ducting to existing stack, different site preparation, etc;

� All 49.5% SOC options require a larger dedicated PE to condense the predicted 50 t/h pass-out steam, whereas the pass-out steam required for the 45% SOC options is about 20 t/h. It has been assumed that this could be accomplished with a small PHE

19

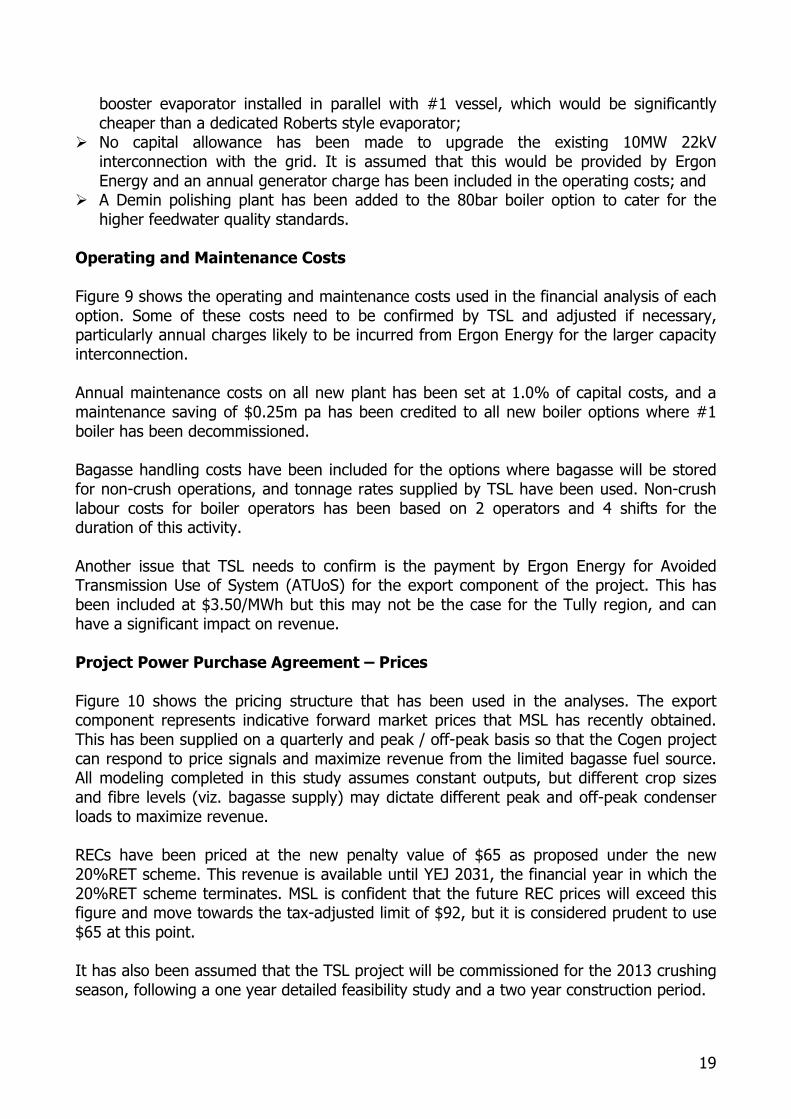
booster evaporator installed in parallel with #1 vessel, which would be significantly cheaper than a dedicated Roberts style evaporator;

� No capital allowance has been made to upgrade the existing 10MW 22kV interconnection with the grid. It is assumed that this would be provided by Ergon Energy and an annual generator charge has been included in the operating costs; and

� A Demin polishing plant has been added to the 80bar boiler option to cater for the higher feedwater quality standards.

Operating and Maintenance Costs Figure 9 shows the operating and maintenance costs used in the financial analysis of each option. Some of these costs need to be confirmed by TSL and adjusted if necessary, particularly annual charges likely to be incurred from Ergon Energy for the larger capacity interconnection. Annual maintenance costs on all new plant has been set at 1.0% of capital costs, and a maintenance saving of $0.25m pa has been credited to all new boiler options where #1 boiler has been decommissioned. Bagasse handling costs have been included for the options where bagasse will be stored for non-crush operations, and tonnage rates supplied by TSL have been used. Non-crush labour costs for boiler operators has been based on 2 operators and 4 shifts for the duration of this activity. Another issue that TSL needs to confirm is the payment by Ergon Energy for Avoided Transmission Use of System (ATUoS) for the export component of the project. This has been included at $3.50/MWh but this may not be the case for the Tully region, and can have a significant impact on revenue. Project Power Purchase Agreement – Prices Figure 10 shows the pricing structure that has been used in the analyses. The export component represents indicative forward market prices that MSL has recently obtained. This has been supplied on a quarterly and peak / off-peak basis so that the Cogen project can respond to price signals and maximize revenue from the limited bagasse fuel source. All modeling completed in this study assumes constant outputs, but different crop sizes and fibre levels (viz. bagasse supply) may dictate different peak and off-peak condenser loads to maximize revenue. RECs have been priced at the new penalty value of $65 as proposed under the new 20%RET scheme. This revenue is available until YEJ 2031, the financial year in which the 20%RET scheme terminates. MSL is confident that the future REC prices will exceed this figure and move towards the tax-adjusted limit of $92, but it is considered prudent to use $65 at this point. It has also been assumed that the TSL project will be commissioned for the 2013 crushing season, following a one year detailed feasibility study and a two year construction period.

20

Figure 9

HP boiler/demin plant chem/cons. 50,000$ pa (Nalco estimate)Administration 60,000$ pa (Half-time Cogen manager, incl on-costs)Ergon Generator charge 420$ per dayErgon Load charge -$ pa (needs to be checked with Ergon if it will change)Ergon Avoided TUoS p'ment -project 3.50$ /MWh (needs to be checked with Ergon)

- current -$ /MWh (currently paid??)#1 Boiler maintenance savings 250,000$ pa (only for new boiler options)Maintenance costs on new plant 1.0% CapitalBagasse (non-crush):

Currently used at end-of-crush 10,000 tonne ]Cogen end-of crush 61,000 tonne ] predicted

Cart to pad 1.21$ /tonne ]Return from pad 2.90$ /tonne ]

Truck maintenance 10,000$ pa ] Only applies to current operations and Upgrade #3 boiler optionPad maintenance 15,000$ pa ]Tarp replacement 5,000$ pa ]

Labour (non-crush):Current end-of-crush period 1.0 wks

Cogen end-of crush 10.0 wks (predicted)Operators per shift 2

Shifts 4Annual wages 85,000$ (includes on-costs)

Operating CostsCurrent

Units Operations 49.5% 45% 49.5% 45% 49.5% 45%

HP boiler/demin plant chem/cons. ($000) 0.0 50.0 50.0 50.0 50.0 50.0 50.0Administration ($000) 0.0 60.0 60.0 60.0 60.0 60.0 60.0Ergon Generator charge ($000) 0.0 153.3 153.3 153.3 153.3 153.3 153.3Ergon Load charge ($000) 0.0 0.0 0.0 0.0 0.0 0.0 0.0Ergon Avoided TUoS payment ($000) In DCF worksheet#1 Boiler maintenance savings ($000) 0.0 0.0 0.0 -250.0 -250.0 -250.0 -250.0Maintenance costs on new plant ($000) 0.0 293.5 304.8 872.0 877.0 980.2 985.2Bagasse (non-crush): ($000) 66.1 280.7 280.7 0.0 0.0 0.0 0.0Labour (non-crush): ($000) 13.1 130.8 130.8 0.0 0.0 0.0 0.0

Total ($000) 79.2 968.3 979.5 885.3 890.3 993.5 998.5

General Operating and Maintenance Costs

#3 Boiler Upgrade 150t/h 45bar Boiler 150t/h 80bar Boiler

21

Figure 10

Final year of 20%RET 2030 (Calender year)Contract Prices

Price Adjustment 100% 100% 100% 100% 100% 100% 100% 100% 100% 100%Calendar Year 2012 2013 2014 2015 2016 2017 2018 2019 2020 2021 2013 2014 2015 2016 2017 2018 2019 2020 2021

Electricity Q1 Peak 111.26 111.26 114.05 116.89 119.81 122.82 0.0% 2.5% 2.5% 2.5% 2.5%Off-Peak 30.04 30.04 30.79 31.56 32.35 33.16 0.0% 2.5% 2.5% 2.5% 2.5%

Q2 Peak 55.64 55.64 57.02 58.45 59.91 61.40 0.0% 2.5% 2.5% 2.5% 2.5%Off-Peak 30.04 30.04 30.79 31.56 32.35 33.16 0.0% 2.5% 2.5% 2.5% 2.5%

Q3 Peak 68.99 68.99 70.70 72.47 74.28 76.14 0.0% 2.5% 2.5% 2.5% 2.5%Off-Peak 30.04 30.04 30.79 31.56 32.35 33.16 0.0% 2.5% 2.5% 2.5% 2.5%

Q4 Peak 86.79 86.79 88.95 91.18 93.46 95.79 0.0% 2.5% 2.5% 2.5% 2.5%Off-Peak 26.16 26.16 26.16 26.16 26.16 26.16 0.0% 0.0% 0.0% 0.0% 0.0%

RECs 65.00 65.00 65.00 65.00 65.00 #DIV/0! 0.0% 0.0% 0.0% 0.0%Model Inputs

2012 2013 2014 2015 2016 2017 2018 2019 2020 2021 2022 2023 2024 2025 2026 2027 2028 2029 2030 2031ElectricityPrice Indexation - change % 2.50%

- actual % 0.00% 0.00% 0.00% 0.00% 0.00% 0.00% 2.50% 2.50% 2.50% 2.50% 2.50% 2.50% 2.50% 2.50% 2.50% 2.50% 2.50% 2.50% 2.50% 2.50%Q1 Peak 111.26 111.26 114.05 116.89 119.81 122.82 125.89 129.04 132.26 135.57 138.96 142.43 145.99 149.64 153.39 157.22 161.15 165.18 169.31 173.54

Off-Peak 30.04 30.04 30.79 31.56 32.35 33.16 33.99 34.84 35.71 36.60 37.52 38.46 39.42 40.40 41.41 42.45 43.51 44.60 45.71 46.85Q2 Peak 55.64 55.64 57.02 58.45 59.91 61.40 62.94 64.51 66.12 67.77 69.47 71.21 72.99 74.81 76.68 78.60 80.56 82.58 84.64 86.76

Off-Peak 30.04 30.04 30.79 31.56 32.35 33.16 33.99 34.84 35.71 36.60 37.52 38.46 39.42 40.40 41.41 42.45 43.51 44.60 45.71 46.85Q3 Peak 68.99 68.99 70.70 72.47 74.28 76.14 78.04 79.99 81.99 84.04 86.15 88.30 90.51 92.77 95.09 97.47 99.90 102.40 104.96

Off-Peak 30.04 30.04 30.79 31.56 32.35 33.16 33.99 34.84 35.71 36.60 37.52 38.46 39.42 40.40 41.41 42.45 43.51 44.60 45.71Q4 Peak 86.79 86.79 88.95 91.18 93.46 95.79 98.18 100.64 103.16 105.73 108.38 111.09 113.86 116.71 119.63 122.62 125.68 128.83 132.05

Off-Peak 26.16 26.16 26.16 26.16 26.16 26.16 26.81 27.48 28.17 28.88 29.60 30.34 31.10 31.87 32.67 33.49 34.32 35.18 36.06Time-weighted Annual Price 52.10 52.78 54.00 55.26 56.56 57.88 59.33 60.81 62.33 63.89 65.48 67.12 68.80 70.52 72.28 74.09 75.94 77.84 79.79RECsPrice Indexation - change %

- actual % 0.00% 0.00% 0.00% 0.00% 0.00% 0.00% 0.00% 0.00% 0.00% 0.00% 0.00% 0.00% 0.00% 0.00% 0.00% 0.00% 0.00% 0.00% 0.00% 0.00%Q1 0.00 65.00 65.00 65.00 65.00 65.00 65.00 65.00 65.00 65.00 65.00 65.00 65.00 65.00 65.00 65.00 65.00 65.00 65.00 0.00Q2 0.00 65.00 65.00 65.00 65.00 65.00 65.00 65.00 65.00 65.00 65.00 65.00 65.00 65.00 65.00 65.00 65.00 65.00 65.00 0.00Q3 0.00 65.00 65.00 65.00 65.00 65.00 65.00 65.00 65.00 65.00 65.00 65.00 65.00 65.00 65.00 65.00 65.00 65.00 65.00Q4 0.00 65.00 65.00 65.00 65.00 65.00 65.00 65.00 65.00 65.00 65.00 65.00 65.00 65.00 65.00 65.00 65.00 65.00 65.00

Period Year (YEJ)

Electricity and REC Prices ($/MWh)

Annual Percentage Change

Model pricing

0.00

10.00

20.00

30.00

40.00

50.00

60.00

70.00

80.00

90.00

100.00

110.00

120.00

2009

2011

2013

2015

2017

2019

2021

2023

2025

2027

2029

2031

2033

2035

2037

2039

2041

2043

2045

2047

Year

An

nu

al A

ve. P

rice

($/

MW

h o

r R

EC

)

Electricity price (Annual)

REC price

ROAM Prediction with NETS

YEJ 2013 Electricity Price (by Quarter)

0.00

20.00

40.00

60.00

80.00

100.00

120.00

0 1 2 3 4

Quarter

Sal

e P

rice

($/

MW

h)

Peak priceOff-Peak priceAnnual Ave price

22

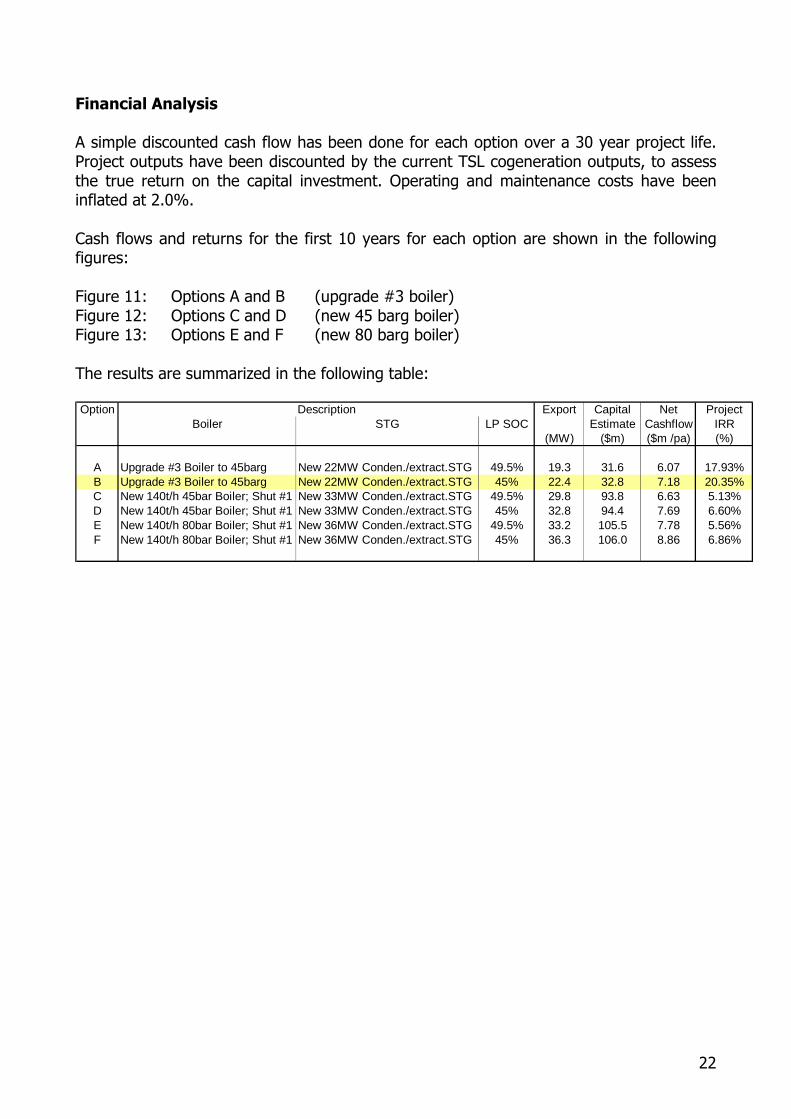
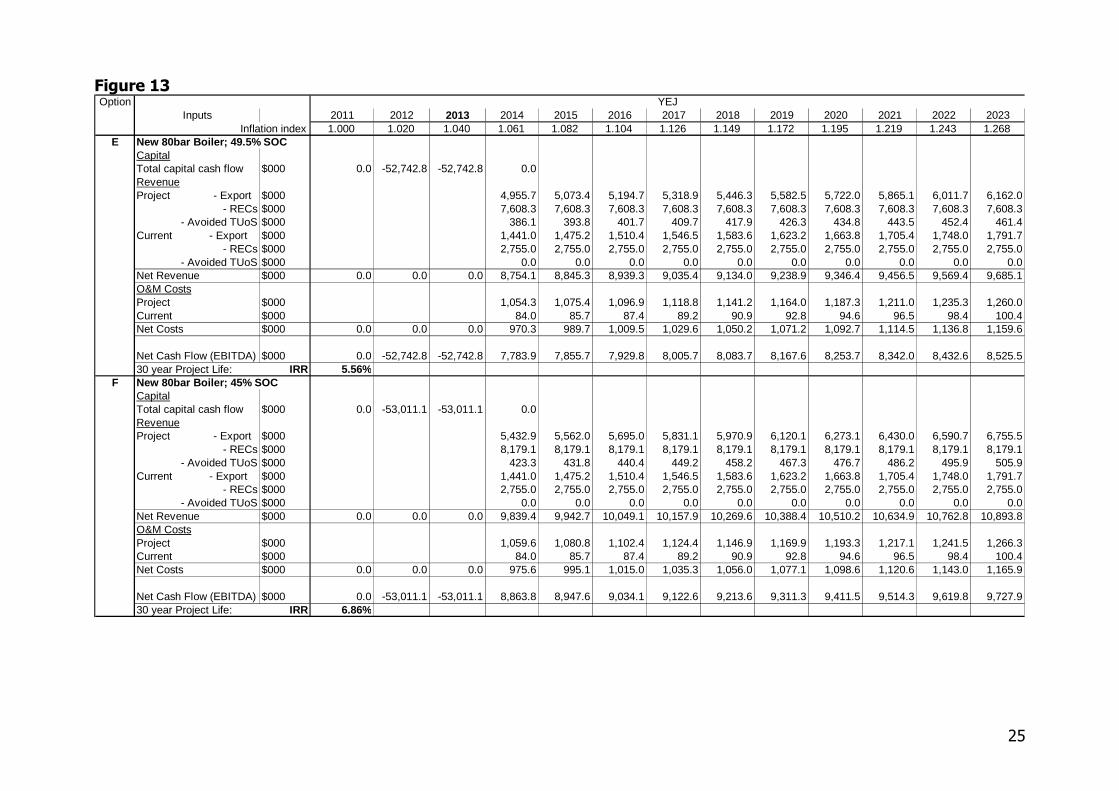
Financial Analysis A simple discounted cash flow has been done for each option over a 30 year project life. Project outputs have been discounted by the current TSL cogeneration outputs, to assess the true return on the capital investment. Operating and maintenance costs have been inflated at 2.0%. Cash flows and returns for the first 10 years for each option are shown in the following figures: Figure 11: Options A and B (upgrade #3 boiler) Figure 12: Options C and D (new 45 barg boiler) Figure 13: Options E and F (new 80 barg boiler) The results are summarized in the following table: Option Export Capital Net Project

Boiler STG LP SOC Estimate Cashflow IRR(MW) ($m) ($m /pa) (%)

A Upgrade #3 Boiler to 45barg New 22MW Conden./extract.STG 49.5% 19.3 31.6 6.07 17.93%B Upgrade #3 Boiler to 45barg New 22MW Conden./extract.STG 45% 22.4 32.8 7.18 20.35%C New 140t/h 45bar Boiler; Shut #1 New 33MW Conden./extract.STG 49.5% 29.8 93.8 6.63 5.13%D New 140t/h 45bar Boiler; Shut #1 New 33MW Conden./extract.STG 45% 32.8 94.4 7.69 6.60%E New 140t/h 80bar Boiler; Shut #1 New 36MW Conden./extract.STG 49.5% 33.2 105.5 7.78 5.56%F New 140t/h 80bar Boiler; Shut #1 New 36MW Conden./extract.STG 45% 36.3 106.0 8.86 6.86%

Description

23

Figure 11 Option

Inputs 2011 2012 2013 2014 2015 2016 2017 2018 2019 2020 2021 2022 2023Inflation index 1.000 1.020 1.040 1.061 1.082 1.104 1.126 1.149 1.172 1.195 1.219 1.243 1.268

A Upgrade #3 Boiler; 49.5% SOCCapitalTotal capital cash flow $000 0.0 -15,791.8 -15,791.8 0.0RevenueProject - Export $000 4,313.2 4,407.6 4,505.0 4,604.7 4,706.8 4,824.5 4,945.1 5,068.7 5,195.4 5,325.3

- RECs $000 6,570.5 6,570.5 6,570.5 6,570.5 6,570.5 6,570.5 6,570.5 6,570.5 6,570.5 6,570.5- Avoided TUoS $000 323.6 330.1 336.7 343.4 350.3 357.3 364.4 371.7 379.2 386.7

Current - Export $000 1,441.0 1,475.2 1,510.4 1,546.5 1,583.6 1,623.2 1,663.8 1,705.4 1,748.0 1,791.7- RECs $000 2,755.0 2,755.0 2,755.0 2,755.0 2,755.0 2,755.0 2,755.0 2,755.0 2,755.0 2,755.0

- Avoided TUoS $000 0.0 0.0 0.0 0.0 0.0 0.0 0.0 0.0 0.0 0.0Net Revenue $000 0.0 0.0 0.0 7,011.4 7,078.1 7,146.8 7,217.1 7,289.1 7,374.1 7,461.3 7,550.6 7,642.2 7,735.9O&M CostsProject $000 1,027.5 1,048.1 1,069.0 1,090.4 1,112.2 1,134.5 1,157.2 1,180.3 1,203.9 1,228.0Current $000 84.0 85.7 87.4 89.2 90.9 92.8 94.6 96.5 98.4 100.4Net Costs $000 0.0 0.0 0.0 943.5 962.4 981.6 1,001.2 1,021.3 1,041.7 1,062.5 1,083.8 1,105.5 1,127.6

Net Cash Flow (EBITDA) $000 0.0 -15,791.8 -15,791.8 6,067.9 6,115.7 6,165.2 6,215.8 6,267.8 6,332.5 6,398.8 6,466.9 6,536.7 6,608.430 year Project Life: IRR 17.93%

B Upgrade #3 Boiler; 45% SOCCapitalTotal capital cash flow $000 0.0 -16,399.1 -16,399.1 0.0RevenueProject - Export $000 4,796.6 4,902.5 5,011.7 5,123.5 5,238.1 5,369.1 5,503.3 5,640.9 5,781.9 5,926.4

- RECs $000 7,170.8 7,170.8 7,170.8 7,170.8 7,170.8 7,170.8 7,170.8 7,170.8 7,170.8 7,170.8- Avoided TUoS $000 361.3 368.5 375.9 383.4 391.0 398.9 406.8 415.0 423.3 431.7

Current - Export $000 1,441.0 1,475.2 1,510.4 1,546.5 1,583.6 1,623.2 1,663.8 1,705.4 1,748.0 1,791.7- RECs $000 2,755.0 2,755.0 2,755.0 2,755.0 2,755.0 2,755.0 2,755.0 2,755.0 2,755.0 2,755.0

- Avoided TUoS $000 0.0 0.0 0.0 0.0 0.0 0.0 0.0 0.0 0.0 0.0Net Revenue $000 0.0 0.0 0.0 8,132.7 8,211.7 8,293.0 8,376.2 8,461.4 8,560.6 8,662.2 8,766.3 8,873.0 8,982.3O&M CostsProject $000 1,039.5 1,060.3 1,081.5 1,103.1 1,125.2 1,147.7 1,170.6 1,194.1 1,217.9 1,242.3Current $000 84.0 85.7 87.4 89.2 90.9 92.8 94.6 96.5 98.4 100.4Net Costs $000 0.0 0.0 0.0 955.5 974.6 994.1 1,014.0 1,034.2 1,054.9 1,076.0 1,097.5 1,119.5 1,141.9

Net Cash Flow (EBITDA) $000 0.0 -16,399.1 -16,399.1 7,177.2 7,237.1 7,298.9 7,362.2 7,427.2 7,505.7 7,586.2 7,668.8 7,753.5 7,840.430 year Project Life: IRR 20.35%

YEJ

24

Figure 12 Option

Inputs 2011 2012 2013 2014 2015 2016 2017 2018 2019 2020 2021 2022 2023Inflation index 1.000 1.020 1.040 1.061 1.082 1.104 1.126 1.149 1.172 1.195 1.219 1.243 1.268

C New 45bar Boiler; 49.5% SOCCapitalTotal capital cash flow $000 0.0 -46,923.3 -46,923.3 0.0RevenueProject - Export $000 4,434.9 4,540.2 4,648.8 4,759.9 4,873.9 4,995.8 5,120.7 5,248.7 5,379.9 5,514.4

- RECs $000 6,898.0 6,898.0 6,898.0 6,898.0 6,898.0 6,898.0 6,898.0 6,898.0 6,898.0 6,898.0- Avoided TUoS $000 345.5 352.4 359.5 366.7 374.0 381.5 389.1 396.9 404.8 412.9

Current - Export $000 1,441.0 1,475.2 1,510.4 1,546.5 1,583.6 1,623.2 1,663.8 1,705.4 1,748.0 1,791.7- RECs $000 2,755.0 2,755.0 2,755.0 2,755.0 2,755.0 2,755.0 2,755.0 2,755.0 2,755.0 2,755.0

- Avoided TUoS $000 0.0 0.0 0.0 0.0 0.0 0.0 0.0 0.0 0.0 0.0Net Revenue $000 0.0 0.0 0.0 7,482.5 7,560.5 7,640.9 7,723.1 7,807.4 7,897.1 7,989.1 8,083.3 8,179.8 8,278.7O&M CostsProject $000 939.5 958.3 977.5 997.0 1,017.0 1,037.3 1,058.0 1,079.2 1,100.8 1,122.8Current $000 84.0 85.7 87.4 89.2 90.9 92.8 94.6 96.5 98.4 100.4Net Costs $000 0.0 0.0 0.0 855.5 872.6 890.1 907.9 926.0 944.5 963.4 982.7 1,002.3 1,022.4

Net Cash Flow (EBITDA) $000 0.0 -46,923.3 -46,923.3 6,627.0 6,687.9 6,750.8 6,815.2 6,881.4 6,952.6 7,025.7 7,100.6 7,177.5 7,256.330 year Project Life: IRR 5.13%

D New 45bar Boiler; 45% SOCCapitalTotal capital cash flow $000 0.0 -47,191.6 -47,191.6 0.0RevenueProject - Export $000 4,906.9 5,023.5 5,143.6 5,266.6 5,392.8 5,527.6 5,665.8 5,807.4 5,952.6 6,101.4

- RECs $000 7,461.6 7,461.6 7,461.6 7,461.6 7,461.6 7,461.6 7,461.6 7,461.6 7,461.6 7,461.6- Avoided TUoS $000 382.3 390.0 397.8 405.7 413.8 422.1 430.5 439.1 447.9 456.9

Current - Export $000 1,441.0 1,475.2 1,510.4 1,546.5 1,583.6 1,623.2 1,663.8 1,705.4 1,748.0 1,791.7- RECs $000 2,755.0 2,755.0 2,755.0 2,755.0 2,755.0 2,755.0 2,755.0 2,755.0 2,755.0 2,755.0

- Avoided TUoS $000 0.0 0.0 0.0 0.0 0.0 0.0 0.0 0.0 0.0 0.0Net Revenue $000 0.0 0.0 0.0 8,554.9 8,644.9 8,737.6 8,832.4 8,929.6 9,033.1 9,139.2 9,247.9 9,359.2 9,473.3O&M CostsProject $000 944.8 963.7 983.0 1,002.6 1,022.7 1,043.1 1,064.0 1,085.3 1,107.0 1,129.1Current $000 84.0 85.7 87.4 89.2 90.9 92.8 94.6 96.5 98.4 100.4Net Costs $000 0.0 0.0 0.0 860.8 878.0 895.6 913.5 931.7 950.4 969.4 988.8 1,008.5 1,028.7

Net Cash Flow (EBITDA) $000 0.0 -47,191.6 -47,191.6 7,694.1 7,766.9 7,842.0 7,918.9 7,997.9 8,082.8 8,169.8 8,259.1 8,350.6 8,444.530 year Project Life: IRR 6.60%

YEJ

25

Figure 13 Option

Inputs 2011 2012 2013 2014 2015 2016 2017 2018 2019 2020 2021 2022 2023Inflation index 1.000 1.020 1.040 1.061 1.082 1.104 1.126 1.149 1.172 1.195 1.219 1.243 1.268

E New 80bar Boiler; 49.5% SOCCapitalTotal capital cash flow $000 0.0 -52,742.8 -52,742.8 0.0RevenueProject - Export $000 4,955.7 5,073.4 5,194.7 5,318.9 5,446.3 5,582.5 5,722.0 5,865.1 6,011.7 6,162.0

- RECs $000 7,608.3 7,608.3 7,608.3 7,608.3 7,608.3 7,608.3 7,608.3 7,608.3 7,608.3 7,608.3- Avoided TUoS $000 386.1 393.8 401.7 409.7 417.9 426.3 434.8 443.5 452.4 461.4

Current - Export $000 1,441.0 1,475.2 1,510.4 1,546.5 1,583.6 1,623.2 1,663.8 1,705.4 1,748.0 1,791.7- RECs $000 2,755.0 2,755.0 2,755.0 2,755.0 2,755.0 2,755.0 2,755.0 2,755.0 2,755.0 2,755.0

- Avoided TUoS $000 0.0 0.0 0.0 0.0 0.0 0.0 0.0 0.0 0.0 0.0Net Revenue $000 0.0 0.0 0.0 8,754.1 8,845.3 8,939.3 9,035.4 9,134.0 9,238.9 9,346.4 9,456.5 9,569.4 9,685.1O&M CostsProject $000 1,054.3 1,075.4 1,096.9 1,118.8 1,141.2 1,164.0 1,187.3 1,211.0 1,235.3 1,260.0Current $000 84.0 85.7 87.4 89.2 90.9 92.8 94.6 96.5 98.4 100.4Net Costs $000 0.0 0.0 0.0 970.3 989.7 1,009.5 1,029.6 1,050.2 1,071.2 1,092.7 1,114.5 1,136.8 1,159.6

Net Cash Flow (EBITDA) $000 0.0 -52,742.8 -52,742.8 7,783.9 7,855.7 7,929.8 8,005.7 8,083.7 8,167.6 8,253.7 8,342.0 8,432.6 8,525.530 year Project Life: IRR 5.56%

F New 80bar Boiler; 45% SOCCapitalTotal capital cash flow $000 0.0 -53,011.1 -53,011.1 0.0RevenueProject - Export $000 5,432.9 5,562.0 5,695.0 5,831.1 5,970.9 6,120.1 6,273.1 6,430.0 6,590.7 6,755.5

- RECs $000 8,179.1 8,179.1 8,179.1 8,179.1 8,179.1 8,179.1 8,179.1 8,179.1 8,179.1 8,179.1- Avoided TUoS $000 423.3 431.8 440.4 449.2 458.2 467.3 476.7 486.2 495.9 505.9

Current - Export $000 1,441.0 1,475.2 1,510.4 1,546.5 1,583.6 1,623.2 1,663.8 1,705.4 1,748.0 1,791.7- RECs $000 2,755.0 2,755.0 2,755.0 2,755.0 2,755.0 2,755.0 2,755.0 2,755.0 2,755.0 2,755.0

- Avoided TUoS $000 0.0 0.0 0.0 0.0 0.0 0.0 0.0 0.0 0.0 0.0Net Revenue $000 0.0 0.0 0.0 9,839.4 9,942.7 10,049.1 10,157.9 10,269.6 10,388.4 10,510.2 10,634.9 10,762.8 10,893.8O&M CostsProject $000 1,059.6 1,080.8 1,102.4 1,124.4 1,146.9 1,169.9 1,193.3 1,217.1 1,241.5 1,266.3Current $000 84.0 85.7 87.4 89.2 90.9 92.8 94.6 96.5 98.4 100.4Net Costs $000 0.0 0.0 0.0 975.6 995.1 1,015.0 1,035.3 1,056.0 1,077.1 1,098.6 1,120.6 1,143.0 1,165.9

Net Cash Flow (EBITDA) $000 0.0 -53,011.1 -53,011.1 8,863.8 8,947.6 9,034.1 9,122.6 9,213.6 9,311.3 9,411.5 9,514.3 9,619.8 9,727.930 year Project Life: IRR 6.86%

YEJ

26

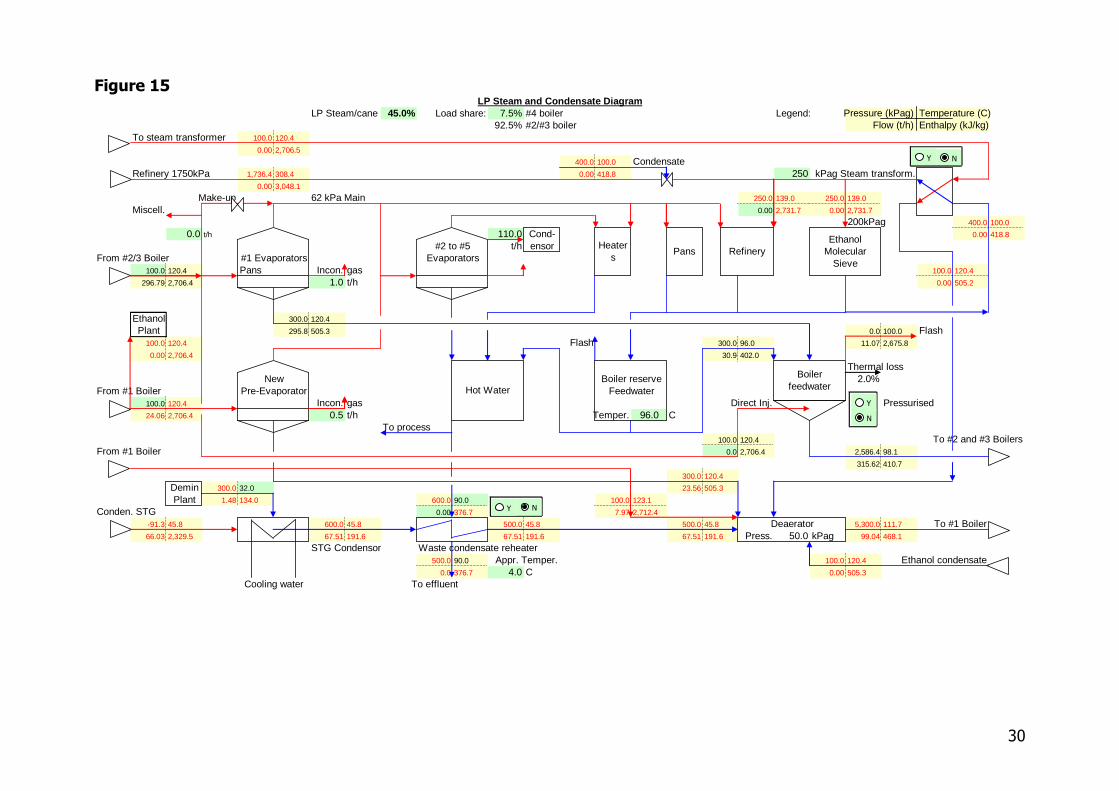
Discussion The results highlight the difficulty in justifying a new HP boiler for Cogeneration, unless it also operates for the bulk of the non-crush (to access the high Q1 pool prices), or it’s installation is needed for the sugar factory operation and capital costs can be partially supported by sugar revenue. This has been a common finding in bagasse cogeneration feasibility studies. The upgrade of #3 Boiler to 45 barg, installation of a 22MW condensing / extraction STG and the improvement of the factory LP steam efficiency to 45% SOC, appears to be an attractive project for TSL. It would certainly be the preferred Cogeneration project that offers best returns for TSL. Figures 14 and 15 show the crushing season HP steam and LP steam/condensate flowsheets for this project, while Figure 16 indicates the project outputs by quarter. Non-crush operations are depicted in Figures 7 and 8. Further enhancements to the project include a STG condensate reheater using vapour from #2 effets, and a pressurized feedwater system for #1 and #2 boiler return condensates. The condensate reheater reduces STG pass-out steam and will add about 0.5MW to the STG output during the crush, while the pressurized condensate system will save about 13,000 tonne of bagasse. The latter will extend the non-crush operations by about 2 weeks. Project Development If TSL wishes to pursue this project, it is recommended that a two stage development program be adopted: a pre-feasibility study to more accurately scope and cost the project, followed by a detailed feasibility study to prepare a Project Plan for Board approval. The project development (excluding finance) can be broken into six main components: 1. Power plant: #3 boiler upgrade, 22MW STG, export transformer, cooling

tower, auxiliary drive electrification, deaerator and demin plant, all interconnecting pipework, and electrical work.

2. Process plant: Modifications to effets/heaters to reach 45% SOC, dedicated PE for pass-out steam, pressurized condensate system.

3. Electrical: Connection of the STG to the factory HV distribution. 4. Interconnection: Upgrade interconnection to Ergon network, including NEM

compliance. 5. PPA: Contract for off-take of electricity and RECs 6. Statutory: Council, EPA, water, etc The following management strategy is suggested. Pre-feasibility study

27

A Project Manager needs to be dedicated to overseeing the various components of the study. TSL may undertake this role, or an experienced project manager from an engineering consultant such as WorleyParsons, Connell Hatch or SKM could be engaged. iPower would also be capable here. If a consultant is engaged, is it essential that their role is accurately defined and that they do not undertake full engineering of all components that could be more cost-effectively done by others listed below. To better define the work scope, capital estimates, project inputs and project outputs, it is suggested that the following contractors be engaged on a fee paying basis for each component of the project: Power plant: AE&E (old Alstom) would be the logical contractor as they were the original boiler manufacturer. AE&E would do preliminary engineering of the full power plant, including general layout drawings, heat balance modeling, steam process flowsheets, STG and cooling tower sizing, and second order capital estimating Process plant: SRI should review report #3215 and confirm the scope of the LP steam efficiency plant. This information can be transferred directly to WDT Engineers or Bundaberg Foundry for general layout drafting and second-order estimating, or alternatively, could be sent to Process Essentials (ex STG, Bris) to do this work. Process Essentials would add a layer of engineering over the project that could more effectively interface the Power Plant with the Process Plant Electrical: TSL would have the best knowledge of an Electrical consultant that could complete this work. MSL has been using Logicamms (ex Patterson Flood) who have excellent experience in this area. Interconnection: TSL may deal directly with Ergon, or use Hill Michael and Associates (HMA, Townsville) as MSL has done. PPA: TSL may control this directly, or could use HMA, Distributed Power, or others. There is merit in considering other counterparties besides electricity Retailers. Statutory: TSL could manage this, with the assistance of the Project Manager. An important issue to be resolved at this stage of the study is the bagasse balance. It is suggested that SRI be engaged to carry out boiler efficiency studies on each boiler this season, and random bagasse samples should be sent to SGS for ultimate analysis and determination of calorific value. A better understanding of the bagasse consumption during mill train stoppages would also be beneficial. An accurate assessment of surplus bagasse quantities will dictate the duration of non-crush operations and resulting revenue.

28

Feasibility Study Subject to a satisfactory result from the pre-feasibility study, the full feasibility study could be undertaken under the same project management structure. Power Plant: For this stage, it is suggested that an alliance be considered with AE&E and a detailed specification and contract document be prepared under an open-book arrangement. This would include a lump sum price for the turn-key power plant. If the project is approved, AE&E are guaranteed the contract, so they should be prepared to develop the specification/contract document at no cost. Process Plant: If a consultant like Process Essentials is used, they would prepare detailed specifications and call tenders for a lump sum contract (e.g. from WDT, Bundaberg Foundry, Bilfinger Berger, G&S, etc). Alternatively, an alliance could be struck with one of these construction companies to jointly undertake the engineering design, drafting, specification preparation and supply of a lump sum price. Electrical: The consultant would prepare a specification for all electrical work outside of the AE&E power plant contract termination points, and call tenders for a lump sum contract. Interconnection: An “Application to Connect” would be submitted to Ergon, who will respond with an “Offer to Connect”. This would detail annual Generator and Load charges, and security requirements. Confirmation is also needed that the generator complies with NEM standards. PPA: PPA negotiations would result in counter-party term sheets and a draft contract ready for acceptance.

29

Figure 14 Bagasse produced

221.5 t/h Bagasse Surplus tonne (for period)39.14 t/h -91.3 45.81 To condensor

98% MCR Stage 1 Stage 3 Generator 66.03 2,329.5

Bagasse 4,500.0 450.0 4,400.0 447.3 0 t/h 0.89 Dryness

46.61 t/h 98.00 3,322.8 98.00 3,317.9 85.00% Eff. 85.00% Eff.

16.48 MW 0.00 MW 7.02 MW

0.00 t/h 4,700.0 261.4 STG Gen.& G/Box efficiency 94.16 %0.98 1,142.0 100.0 123.1 100.0 123.11 22.13 MW

5,300.0 111.6 98.00 2,712.4 66.03 2,712.4

98.98 468.2 5,300.0 111.6 2.70 C S/heat 2.70 C S/heat

0.00 468.2 100.0 120.4 To 250kPa steam transformer100.0 120.4 5,300.0 111.6 0.00 2,706.5

From Deaerator 0.98 505.6 0.06 468.2 100.0 120.4 To STG Pre-evaporator & Ethanol5,300.0 111.6 Desuper. 24.06 2,706.5

99.04 468.2 Condensate 100.0 120.4 100.0 123.1 To Deaerator0.00 2,706.5 7.97 2,712.4

1,736.4 308.4 To Refinery 1750 kPag0.00 Check 99.1% MCR 0.00 3,048.1

Bagasse 1,780.0 302.0

88.89 t/h #2 203.24 3,032.1 FALSE FALSE FALSE Load: 10.000 MW 0.000 MW 0.700 MWCoal Boilers STG STG New STG

0.000 t/h #2 ID Fan #1 ID Fan F'water Pump 4 West Mills 10MW 4.5MW 5.3 MW 1,736.4 308.4

2,586.4 98.1 1,980.0 214.4 12.83 3,048.1

207.30 410.7 4.06 917.9 100.0 198.5 100.0 198.5 100.0 198.5 Electric 100.0 121.3 0.0 0.0 100.0 213.3

14.79 2,867.7 7.79 2,867.7 7.55 2,867.7 111.17 2,708.5 0.00 0.0 18.59 2,897.5

78.11 C S/heat 78.11 C S/heat 78.11 C S/heat 0.92 C S/heat 92.92 C S/heat 100.0 146.5

99.00% MCR 30.1 129.8 159.88 2,760.5

Bagasse 1,800.0 324.0 Mills46.84 t/h #1 96.52 3,081.7 FALSE FALSE FALSE FALSE FALSE FALSE TRUE 1,736.4 308.4

Boiler 0.96 3,048.1

Shredder #1 Mill #2 Mill #3 Mill #4 Mill #5 Mill Make-up 100.0 120.4 Vent2,586.4 98.1 2,000.0 214.9 0.00 2,706.4

98.45 410.7 1.93 920.1 100.0 141.7 100.0 198.5 100.0 198.5 100.0 198.5 100.0 198.5 100.0 198.5 0.0 0.0

57.43 2,751.8 18.96 2,867.7 14.17 2,867.7 14.17 2,867.7 7.18 2,867.7 14.17 2,867.7 0.00 0.0

From F'water tank 21.30 C S/heat 78.11 C S/heat 78.11 C S/heat 78.11 C S/heat 78.11 C S/heat 78.11 C S/heat 100.0 173.0 To Process2,586.4 98.1 2,586.4 98.1 Desuper. 126.08 2,814.9 100.0 120.4

315.62 410.7 9.86 410.7 Condensate 126.08 68.66 296.79 2,706.4

Boiler data: Fuel data: FALSE STG data: General data:#3 #2 #1 Crush rate 713 TCH Miscell IP steam flow 1.8% Cane

Pressure 4,500 1,780 1,800 kPag Crop 2,000.7 kt 1 2 3 HP pipe pressure loss 100.0 kPagTemperature 450 302 324 oC Analysis period 19.220 weeks Design flow 98.0 98.0 70.0 t/h IP pipe pressure loss 50.0 kPagMCR 100 205 97.5 t/h Lost time 13.10% available Deaerator pressure 50.0 kPagEffic. -Bagasse 67.0% 67.0% 61.5% (50% moist.) Cane fibre 15.78% (15,15.78,16.5) Minimum Stage 3 flow 5% design flow Total generation 32.83 MW

-Coal 80% 70% Mud/Cane 6.05% Condensing pressure 10.00 kPaA Total site load 10.472 MWBlowdown 1.0% 2.0% 2.0% steam flow Fibre/Mud 7.08% Generator capacity 22.0 MW Export 22.361 MWSteam flow 98.0 t/h Bagasse: Moist. 49.50% wet basis Gearbox efficiency 98.0%#2 & #3 loads 68% 32.2% % IP load Pol 1.83% dry basis Legend: Pressure (kPag) Temperature (C)Fuel mix 100% 100% 100% Bagasse (by energy) Ash 4.0% dry basis Flow (t/h) Enthalpy (kJ/kg)FSL (ORER) (fossil fuel ratio) Corr.factor 0.0% extra consumptionAsh make 2.35 4.49 2.37 t/h (@60% m.) Coal: GCV 24,537 kJ/kg

Ash 7.77% as fired 2

HP Steam Flows

Drains/Miscell.

Losses

#3

56,680

0.00%

Coal

B'down

B'down

Stage

HP Boiler

Flash

B'down

Elec Elec Elec

Elec Elec Elec Elec Elec Elec

30

Figure 15

LP Steam/cane 45.0% Load share: 7.5% #4 boiler Legend: Pressure (kPag) Temperature (C)#2/#3 boiler Flow (t/h) Enthalpy (kJ/kg)

To steam transformer 100.0 120.4

0.00 2,706.5

400.0 100.0 Condensate 2Refinery 1750kPa 1,736.4 308.4 0.00 418.8 250 kPag Steam transform.

0.00 3,048.1

Make-up 62 kPa Main 250.0 139.0 250.0 139.0

Miscell. 0.00 2,731.7 0.00 2,731.7

200kPag 400.0 100.0

0.0 t/h 110.0 Cond- 0.00 418.8

t/h ensorFrom #2/3 Boiler

100.0 120.4 Pans Incon. gas 100.0 120.4

296.79 2,706.4 1.0 t/h 0.00 505.2

Ethanol 300.0 120.4

Plant 295.8 505.3 0.0 100.0 Flash100.0 120.4 Flash 300.0 96.0 11.07 2,675.8

0.00 2,706.4 30.9 402.0

Thermal loss2.0%

From #1 Boiler100.0 120.4 Incon. gas Direct Inj. Pressurised24.06 2,706.4 0.5 t/h Temper. 96.0 C 2

To process100.0 120.4 To #2 and #3 Boilers

From #1 Boiler 0.0 2,706.4 2,586.4 98.1

315.62 410.7

300.0 120.4

Demin 300.0 32.0 23.56 505.3

Plant 1.48 134.0 600.0 90.0 2 100.0 123.1

Conden. STG 0.00 376.7 7.97 2,712.4 0.00-91.3 45.8 600.0 45.8 500.0 45.8 500.0 45.8 5,300.0 111.7 To #1 Boiler66.03 2,329.5 67.51 191.6 67.51 191.6 67.51 191.6 Press. 50.0 kPag 99.04 468.1

STG Condensor Waste condensate reheater500.0 90.0 Appr. Temper. 100.0 120.4 Ethanol condensate

0.0 376.7 4.0 C 0.00 505.3

To effluent

Feedwater

Deaerator

LP Steam and Condensate Diagram

Boiler reserve

92.5%

Cooling water

#1 Evaporators#2 to #5

Evaporators

NewPre-Evaporator

Heaters

PansEthanol

Molecular Sieve

BoilerfeedwaterHot Water

Y

N

Y N

Y N

Refinery

31

Figure 16

Season length 19.22 weeks 97.0% Plant availability Ethanol Plant N (Y or N) Fibre A (H,A or L) Scheme M (M or Q)Crop 2,000,654 tonne Description:

Parameter1 2 Total Total

Crushing rate TCH 713 713 713 713 713 713LP steam/cane % 45.0% 45.0% 45.0% 45.0% 45.0% 45.0%Period wks 1.43 1.71 5.89 7.25 1.34 1.60 19.22Lost time % 13.1% 13.1% 13.1% 13.1% 13.1% 13.1%Crushing time hrs 208.6 250.2 860.3 1,058.4 195.5 232.9Peak (P), Off-peak (O), Flat (F)Export price $/MWh 8,760.0Boiler No. #3 #1/#2 #3 #1/#2 #3 #1/#2 #3 #1/#2 #3 #1/#2 #3 #1/#2Boiler load t/h 98.00 299.76 98.00 299.76 98.00 299.76 98.00 299.76 98.00 299.76 98.00 299.76STG condensor flow t/h 66.03 0.00 66.03 0.00 66.03 0.00 66.03 0.00 66.03 0.00 66.03 0.00Site electrical loads: kW

Base Factory Load kW 9,000.0 9,000.0 9,000.0 9,000.0 9,000.0 9,000.0Reduce LP SOC to 45% kW -135.0 -135.0 -135.0 -135.0 -135.0 -135.0

Upgrade #3 boiler to 45bar kW 710.0 710.0 710.0 710.0 710.0 710.0Shut #1 Boiler kW 0.0 0.0 0.0 0.0 0.0 0.0

New 150t/h Boiler kW 0.0 0.0 0.0 0.0 0.0 0.0New STG kW 847.0 847.0 847.0 847.0 847.0 847.0

Demin Plant kW 50.0 50.0 50.0 50.0 50.0 50.0Bagasse handling increase kW 0.0 0.0 0.0 0.0 0.0 0.0

Total MW 0.897 9.575 0.897 9.575 0.897 9.575 0.897 9.575 0.897 9.575 0.897 9.575

Total MW 10.472 10.472 10.472 10.472 10.472 10.472Generation - while crushing MW 22.133 10.700 22.133 10.700 22.133 10.700 22.133 10.700 22.133 10.700 22.133 10.700

- while not crushing MWh 942.9 1,058.7 3,946.7 4,870.4 815.4 1,039.6Export - while crushing MW 22.361 22.361 22.361 22.361 22.361 22.361

- while not crushing MWh 719.4 809.5 3,003.0 3,707.4 621.4 794.5Bagasse - surplus while crushing t/h 39.14 39.14 39.14 39.14 39.14 39.14

- used while not crushing tonne 3,962.5 4,581.6 16,378.2 20,209.7 3,533.2 4,419.3Coal t/h 0.0 0.0 0.0 0.0 0.0 0.0 0.0 0.0 0.0 0.0 0.0 0.0Boiler make-up water t/h 1.5 0.0 1.5 0.0 1.5 0.0 1.5 0.0 1.5 0.0 1.5 0.0Ash cartage t/h 2.35 6.85 2.35 6.85 2.35 6.85 2.35 6.85 2.35 6.85 2.35 6.85ORER: - Fossil fuel ratio (FSL) % 0.00% 0.00% 0.00% 0.00% 0.00% 0.00%

- Non eligible aux (AUX) MW 1.414 0.133 1.414 0.133 1.414 0.133 1.414 0.133 1.414 0.133 1.414 0.133Export - energy (adjusted) MWh 0 5,223 6,213 21,573 26,554 4,843 5,821 70,226

- revenue $ 0 329,191 208,370 1,378,961 828,204 463,397 181,566 3,389,690RECs - TLEG MWh 5,247 2,383 6,235 2,847 21,686 9,837 26,692 12,105 4,861 2,222 5,846 2,658

- AUX MWh 286 28 343 33 1,180 114 1,452 141 268 26 319 31- FSL MWh 0.0 0.0 0.0 0.0 0.0 0.0

- Eligible generation 0 7,316 8,705 30,228 37,203 6,789 8,153 98,394- revenue $ 0 365,800 435,250 1,511,400 1,860,150 339,450 407,650 4,919,700

Bagasse stockpiled tonne 0 4,456 5,515 18,337 22,499 4,355 4,977 60,138Coal consumed tonne 0.0 0.0 0.0 0.0 0.0 0.0 0.0 0.0 0.0 0.0 0.0 0.0 0.0 0.0Boiler treated make-up water tonne 0.0 299.5 0.0 359.2 0.0 1,235.1 0.0 1,519.5 0.0 280.6 0.0 334.3 0.0 4,028.2Ash cartage tonne 0 476.3 1,430.0 571.3 1,715.2 1,964.1 5,897.0 2,416.4 7,254.9 446.3 1,339.9 531.6 1,596.1 25,639Revenue - Export $ 0 3,389,690 3,389,690

- RECs $ 0 4,919,700 4,919,700

63.03 33.54 63.92 31.19

Financial Summary (Crushing season)

713TCH; Upgrade #3 Boiler to 45bar; New 22MW Condensing extraction STG; 45% LP SOC

Cogeneration Mode64 4 5 5

31.19O

6Current Mode

P O P O P95.69


Recommended