Multimodal Brain Tumor Segmentation Using The “Tumor-cut” Method on The BraTS Dataset Andac Hamamci, Gozde Unal Faculty of Engineering and Natural Sciences, Sabanci University, Istanbul, Turkey [email protected]Abstract. In this paper, the tumor segmentation method used is described and the experimental results obtained are reported for the “BraTS 2012 - Mul- timodal Brain Tumor Segmentation Challenge” of MICCAI’12. “Tumor-cut” method, presented in [1] is adapted to multi-modal data to include edema seg- mentation. The method is semi-automatic, requiring the user to draw the max- imum diameter of the tumor, which takes about a minute user-interaction time per case. The typical run-time for each case is around 10-20 minutes depending on the size of the tumor. Overall Dice overlap with the expert segmentation is 0.36 ± 0.25 for the edema/infiltration and 0.69 ± 0.20 for the tumor region. 1 Introduction In our “Tumor-cut” paper, the semi-supervised tumor segmentation method is de- scribed, in detail [1]. This method, specifically targets gross tumor volume (GTV) of the brain tumors on the contrast enhanced T1-weighted MR images (T1C). Here, we extend our method to multi-modal MRI (T1C + FLAIR) to include edema segmen- tation, and also evaluated on low-grade non-enhanced tumors. Although, we segment the necrotic areas of the high-grade tumors, quantitative necrotic segmentation results are not reported in this paper due to the lack of the ground truth labels of necrotic regions. 2 Methods The main steps of the “Tumor-cut” method, presented in [1], is given in Fig. 1. The weight of the regularizer of the level-set is set to 0.2, which is determined in [1] by experiments on both real and synthetic data. The same algorithm is applied on FLAIR volumes to segment the clinical tumor volume (CTV = GT V + Edema). This time, the user is asked to draw the maximum diameter of the edema region visible on FLAIR images. The main differences observed between GTV (on T1C) and CTV (on FLAIR) is that the sphericity of the edema area is lower and there occurs more curvatures. For the FLAIR segmentation, to allow results with more curvatures, a four times lower regularizer weight is set arbitrarily, at 0.05. The user-input is gathered by two different maximum diameter lines, drawn separately, one for FLAIR and one for T1C volumes. The resulting maps are combined simply by assigning tumor labels using T1C segmentation and assigning edema label to the difference area of the FLAIR segmentation minus the T1C segmentation. V Edema = {x ∈ V FLAIR |x/ ∈ V T 1C } Proc MICCAI-BRATS 2012 19
Transcript
Multimodal Brain Tumor Segmentation Using The“Tumor-cut” Method on The BraTS Dataset
Andac Hamamci, Gozde Unal
Faculty of Engineering and Natural Sciences, Sabanci University, Istanbul, [email protected]
Abstract. In this paper, the tumor segmentation method used is describedand the experimental results obtained are reported for the “BraTS 2012 - Mul-timodal Brain Tumor Segmentation Challenge” of MICCAI’12. “Tumor-cut”method, presented in [1] is adapted to multi-modal data to include edema seg-mentation. The method is semi-automatic, requiring the user to draw the max-imum diameter of the tumor, which takes about a minute user-interaction timeper case. The typical run-time for each case is around 10-20 minutes dependingon the size of the tumor. Overall Dice overlap with the expert segmentation is0.36 ± 0.25 for the edema/infiltration and 0.69 ± 0.20 for the tumor region.
1 Introduction
In our “Tumor-cut” paper, the semi-supervised tumor segmentation method is de-scribed, in detail [1]. This method, specifically targets gross tumor volume (GTV) ofthe brain tumors on the contrast enhanced T1-weighted MR images (T1C). Here, weextend our method to multi-modal MRI (T1C + FLAIR) to include edema segmen-tation, and also evaluated on low-grade non-enhanced tumors. Although, we segmentthe necrotic areas of the high-grade tumors, quantitative necrotic segmentation resultsare not reported in this paper due to the lack of the ground truth labels of necroticregions.
2 Methods
The main steps of the “Tumor-cut” method, presented in [1], is given in Fig. 1. Theweight of the regularizer of the level-set is set to 0.2, which is determined in [1] byexperiments on both real and synthetic data. The same algorithm is applied on FLAIRvolumes to segment the clinical tumor volume (CTV = GTV + Edema). This time,the user is asked to draw the maximum diameter of the edema region visible on FLAIRimages. The main differences observed between GTV (on T1C) and CTV (on FLAIR)is that the sphericity of the edema area is lower and there occurs more curvatures.For the FLAIR segmentation, to allow results with more curvatures, a four timeslower regularizer weight is set arbitrarily, at 0.05. The user-input is gathered by twodifferent maximum diameter lines, drawn separately, one for FLAIR and one for T1Cvolumes. The resulting maps are combined simply by assigning tumor labels usingT1C segmentation and assigning edema label to the difference area of the FLAIRsegmentation minus the T1C segmentation.
VEdema = {x ∈ VFLAIR|x /∈ VT1C}
Proc MICCAI-BRATS 2012
19
Fig. 1: Flow diagram, which shows the main steps of the ”Tumor-cut” algorithm [1].
Table 1: Overall results obtained on the BraTS dataset.Dice Overlap Jaccard Score Specificity Sensitivity Cohen’s
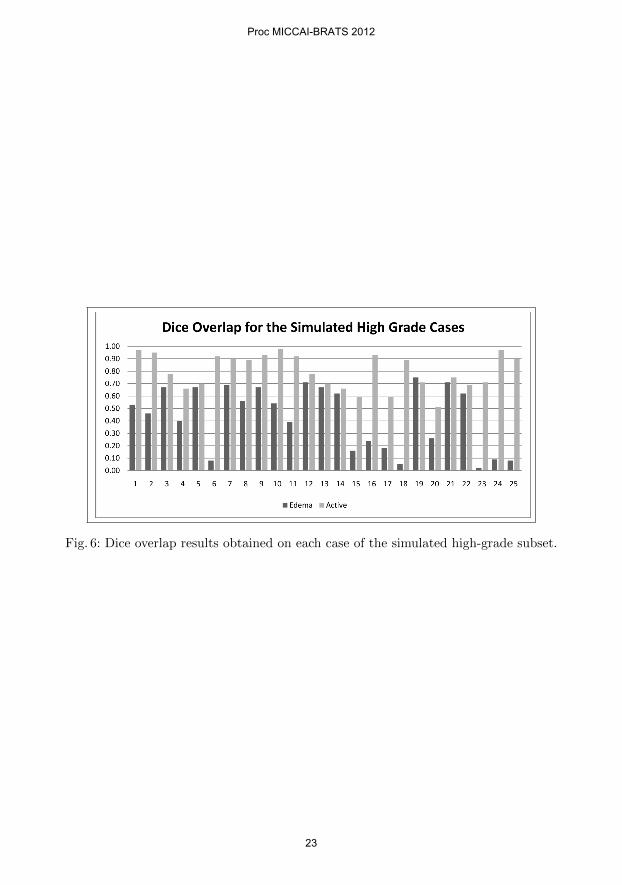
The method is implemented on Matlab environment, running on a windows 7 worksta-tion, using mex files for core algorithms. For each case, user interaction takes about aminute and typical run-time for each case is around 10-20 minutes, depending on thesize of the tumor. The dataset is downloaded from Kitware/Midas web site and theonline system provided by the “Virtual Skeleton Database” is used for the evaluation.The Dice overlap results of the runs on each case of the BraTS data set is tabulated inTable 2. For each subset, including high grade and low grade, simulated and patientdata, the Dice overlap scores obtained are given as bar charts in Figs 3-6. The overallDice overlap, Jaccard scores, Sensitivity/Specificity and Cohen’s Kappa results withthe standard deviations are reported in Table 1.
4 Discussion and Conclusions
Originally we limited the scope of the “Tumor-cut” algorithm to the contrast enhancedgross tumor volumes, which corresponds to the active parts of the high grade tumorsin Table 2. For the high-grade cases, the results obtained on the patient dataset (0.73)
Proc MICCAI-BRATS 2012
20
Fig. 2: Table of the Dice overlap results obtained on each case.
Fig. 3: Dice overlap results obtained on each case of the low-grade patient subset.
and the simulated dataset (0.80) are consistent with the results reported in [1] (0.80and 0.83). Because the edema region is calculated by substraction of the two maps,the overlap scores for edema is not independent of the scores for the tumor. For thelow-grade simulated data, low performance in some cases is mostly due to the lownumber of voxels labeled as edema -comparing to patient cases- in the ground truthsegmentation, which causes low overlap scores.
Acknowledgement. This work was partially supported by TUBA-GEBIP (TurkishAcademy of Sciences) and EU FP7 Grant No: PIRG03-GA-2008-231052.
Proc MICCAI-BRATS 2012
21
Fig. 4: Dice overlap results obtained on each case of the high-grade patient subset.
Fig. 5: Dice overlap results obtained on each case of the simulated low-grade subset.
References
1. Hamamci, A., Kucuk, N., Karaman, K., Engin, K., Unal, G.: Tumor-cut: Segmentationof brain tumors on contrast enhanced mr images for radiosurgery applications. MedicalImaging, IEEE Transactions on 31(3) (march 2012) 790 –804
Proc MICCAI-BRATS 2012
22
Fig. 6: Dice overlap results obtained on each case of the simulated high-grade subset.


![Uveitic macular edema: a stepladder treatment paradigm€¦ · of macular edema [1,3–4], this review will focus on uveitic macular edema specifically. Uveitic macular edema Macular](https://static.documents.pub/doc/80x56/5ed770e44d676a3f4a7efe51/uveitic-macular-edema-a-stepladder-treatment-paradigm-of-macular-edema-13a4.jpg)


