50
SCCD : G.G. AFRICAN DEVELOPMENT BANK PROJECT COMPLETION REPORT PHOSPHATE SECTOR REHABILITATION TUNISIA INFRASTRUCTURE DEPARTMENT ONIN NORTH, EAST AND SOUTH REGIONS JANUARY 2002

SCCD : G.G.
AFRICAN DEVELOPMENT BANK
PROJECT COMPLETION REPORT
PHOSPHATE SECTOR REHABILITATION
TUNISIA
INFRASTRUCTURE DEPARTMENT ONINNORTH, EAST AND SOUTH REGIONS JANUARY 2002

TABLE OF CONTENTSPages
BASIC PROJECT DATA – EXECUTIVE SUMMARY – PROJECT MATRIX. i - ix
1 INTRODUCTION 1
2 PROJECT OBJECTIVES AND FORMULATION 12.1 Project Objectives 12.2 Project Description 22.3 Project Formulation 22.4 Preparation, Appraisal, Negotiation and Approval 3
3 PROJECT IMPLEMENTATION 33.1 Loan Effectiveness and Project Start-up 33.2 Procurement of Goods and Services 33.3 Modifications 43.4 Implementation Schedule 43.5 Reports 43.6 Project Outputs 53.7 Project Cost and Sources of Finance 53.8 Disbursements 73.9 Performance of Equipment Suppliers and Contractors 7
4 PROJECT PERFORMANCE AND RESULTS 8
4.1 Overall Evaluation 84.2 Institutional Performance 94.3 Financial Performance 94.4 Economic Performance 12
5 SOCIAL AND ENVIRONMENTAL IMPACT 125.1 Social Impact 125.2 Environmental Impact 13
6 PROJECT VIABILITY 14
7 PERFORMANCE OF THE BANK, THE BORROWER AND THEEXECUTING AGENCIES
14
7.1 Performance of the Bank 147.2 Performance of the Executing Agency 15
8 OVERALL PERFORMANCE AND RATING 15
9 CONCLUSIONS, LESSONS AND RECOMMENDATIONS 159.1 Conclusions 159.2 Lessons 169.3 Recommendations 16

i
LIST OF ANNEXES
Page
1. Map of the Project Area 1
2. Description of the Project Components 2
3. List of Equipment procured by CPG 4
4. Phosphate Sector Production Trend (1993-2000) 1
5. Trend of Sales, Selling Prices and Parity of the US Dollar(1993 to 2000)
1
6. Expenditure of Other Donors by Category of Expenditure1
7. Calculation of the Project Rate of Return 4
8. Trend of CPG Operating Accounts (1995-2000)4
9. Performance Evaluation and Rating 2
10. Matrix of Recommendations and Follow-up Actions. 2
11. Sources of Information 1
This report was prepared by Messrs. DAOUAS Béchir, Mine Engineer, Consultant, and TRAORENoumouké, Consultant Financial Analyst under the co-ordination of Mr. N. MATONDO-FUNDANI, ChiefElectrical Engineer, and ONIN.2, following their mission to Tunisia from 03 to 15 December 2001. The DivisionChief in charge is Mr. K.BEDOUMRA, Manager, ONIN.2 (Extension 4161).

ii
CURRENCIES, ACRONYMS AND ABBREVIATIONS
CURRENCIES AND EQUIVALENTS
Currency Unit = Tunisian Dinar (TD)
* At Appraisal (June 1994); * During the completion mission(December 2001)
UA 1 = TD 1.4755 UA 1 = TD 1.83392
UA 1 = USD 1.4126 UA 1 = USD 1.26608
USD 1 = TD 0.9600 USD 1 = TD 1.44850
TD 1 = USD 1.045 TD 1 = USD 0.69036
FISCAL YEAR
01 January - 31 December
ACRONYMS AND ABBREVIATON S
ADB = African Development BankAFESD = Arab Fund for Economic and Social DevelopmentAMN = Agricultural Ammonium NitrateCPG = Compagnie des phosphates de GafsaDCP = Dicalcic amonnium phosphateDP = Diamonnium phosphateEEC = European Economic CommunityGCT = Groupe Chimique de TunisieIFA = International Fertilisers AssociationM tonnes = 1000 metric tonnesMIN = MineNI = Not IndicatedP2O5 = Phosphoric AcidPAC = Politique Agricole Commune (Common Agricultural Policy)PAN = Porous Ammonium NitrateRSD = Raw, Screened, DriedSNCFT = Société nationale de Chemin de fer TunisienSPA = Superphosphoric AcidTD = Tunisian DinarTSP = Triple superphosphateTUN = TunisiaUA = Unit of Account

iii
BASIC PROJECT DATA
1. Country : TUNISIA2. Name of Project : Phosphate Sector Rehabilitation3. Loan number : B/TUN/REH-FIP/94/564. Borrower : Government of the Republic of Tunisia5. Beneficiaries : Compagnie des Phosphates de Gafsa and
Groupe Chimique de Tunisie6. Executing Agencies : Compagnie des Phosphates de Gafsa and
Groupe Chimique de Tunisie
A. LOAN Estimate at ActualAppraisal Figures
1. Amount (in million UA) : 110.00 107.402. Interest rate : Variable Variable3. Repayment period : 20 years 20 years4. Grace period : 4 years 4 years5. Application date : - 15/06/19937. Negotiation date : - 28/07/19948. Approval date : - 24/08/19949. Signing date : - 11/10/199410. Effectiveness date : - 12/01/1995
B. PROJECT DATAEstimate at
Appraisal Actual Figures1. Total cost (in million UA) : 127.80 120.542. Financing plan
(in million UA)
SOURCESAt appraisal Actual figuresF.E L.C. F.E. L.C.
ADB 110.00 - 107.40 -AFESD 1.02 - 1.55 -CPG 6.18 8.72 4.98 3.43GCT 0.15 1.73 2.17 1.60TOTAL 117.35 10.45 116.11 4.43
3. Actual first disbursement date : - 24/01/19954. Actual last disbursement date : - 23/03/20005. Start of project implementation activities : June 1994 January 19956. Completion date of
of project implementation activities : Dec. 1997 December 1999
C. PERFORMANCE INDICATORS1. Cost reduction : 5.68 %2. Slippage on the schedule (%)
- Slippage on the entry into force : No slippage- Slippage on the completion date : 66 %- Slippage on the last disbursement : 66 %- Number of extensions of the last disbursement date : 1
3. Project implementation status : Completed4. List of verifiable indicators and completion levels
INDICATORS Estimate Actual

iv
Units At appraisal On completionProductivity of the CPG T. phosphate/man/year 900 1223Recovery rate of the P2O5 in % of the tonnage extracted 67.5 65.34Specific consumption of
Phosphate For one tonne of P2O5 3.78 3.84Sulphur For one tonne of P2O5 0.99 1.00
Debt ratio ofCPG < than 2.33 1.00GCT < than 2.33 0.50
5. Institutional performance : Satisfactory6. Performance of equipment suppliers : Satisfactory7. Contractors’ performance : Satisfactory
EVALUATION COMPLETION
GCT CPG GCT CPG
8. Internal financial rate of return : 14.18% 17.42% 31.39% 49.78%
9. Internal economic rate of return : 22.85% 47.15 %
10. Overall evaluation : Satisfactory
D. MISSIONS
Description DatesNumber
of persons Composition Man-dayPreparation November 1993 3 ( 1)+(2)+(4) 36Appraisal June 1994 3 (2)+(3)+(4) 36
Supervision 20 - 30/05/1996 2 (1)+(2) 2015 - 29/06/1997 2 (3)+(4) 2809 - 21/02/1998 2 (3)+(2) 24
29/07-10/08/1999 2 (1)+(2) 24Completion 03 - 15/12/2001 3 (1)+(3)+(4) 30
Total 17 198
NB: (1) = Industrial Engineer; (2) = Industrial Economist; (3)) Mine Engineer; (4) Financial Analyst;
E. DISBURSEMENTS(in million UA)
Estimate Actual Percentageat appraisal data. disbursed.
- Total disbursed 110.00 107.40 97.64%- Amount cancelled 0 2.60 2.36%
Comparison of the estimated/actual disbursements of the ADB loan(in millions UC)
Year 1 995 1 996 1 997 1 998 1 999 2 000 TotalEstimate 46.04 38.01 25.95 110.00Actual 43.53 22.92 33.25 1.01 5.87 0.82 107.40% of actual/estimate 94.54 60.30 128.15In % of the total 40.53 21.34 30.96 0.94 5.47 0.76 100
F. SUPPLIERS OF MACHINES, EQUIPMENT AND INPUTS

v
The list of contracts for the procurement of machines, equipment and inputs financed by theBank is given in Annex 3.
G. CONSULTANT
There was no provision for an external consultant at appraisal. The control and acceptanceof machines, equipment as well as the installations made under the project were carried out by thetechnical staff of CPG and GCT.

vi
PROJECT MATRIX
Name of project: Phosphate Sector Rehabilitation - TunisiaCompletion date: 31 December 1999
HIERARCHY OFOBJECTIVES (HO)
OBJECTIVELYVERIFIABLE
INDICATORS (OVI)
MEANS OFVERIFICATION (MOV)
IMPORTANTASSUMPTIONS
Sector Objectives
1. Strengthen the contributionof the sector to the growth ofthe industrial sector.
1.1 Industrial sector growthat a rate of 8.2 % per annum.
- Annual report of theBanque Centrale de Tunisie
- Review of the «EconomicSituation» of the Ministryof Industry.
Project Objectives1. Consolidate the productiontool and improve thecompetitiveness of the sector.
1.1 Increase in theproduction of the sector.
1.1 : Annual status reportsof CPG and GCT
1. Maintenance of afavourable internationaleconomic situation of thephosphate and by-productsmarkets.
1.2 Increase in T/h/yearoutput.
1.2 Project completionreports
1.3 Improvement of therecovery rate of P205
1.4 Reduction of specificconsumptions at GCT
2. Restore the financial returnof CPG and GCT.
Restoration of a financial
structure with:2.1 CPG and GCT financialreports
- Positive net operatingincomes
-Debt ratio below 2.33.
3. Improvement of the sector’scompetitiveness.
Outputs1. Maintenance of production 1.1 Procurement of:
- 14 bulldozers - Provisional and finalacceptance certificates ofthe equipment.
- 3 5 m3 loaders- 15 85 T dumpers

vii
- 3 170 T dumpers- 3 14 m3 hydraulicexcavators
- Project completion reportsof CPG, GCT and ADB
- 1 29 m3 hydraulicshovels
- 4 Rotary drills- 6 Grading machines- 5 Service trucks- 5 Lift trucks- 41 utility vehicles
2. Optimisation of production- 2.1 Reconditioning of99 quarry machines2.2 Flotation units at theSEHIB factory
2.3 Unsecured advance of 3 –4 months in the CPGquarries.
2.4 Procurement of over 546articles from 73 contracts.
3.Environmental protection CPG :- Creation of areas reservedfor solid wastes.
- Disposal of muddy wastefar from the urban areas, anddyking to protect pastures.
Procurement of 1.92 milliontonnes of sulphur.
4. Inputs
ACTIVITIES RESOURCES(in million UA )
- Preparation of biddingdocuments
* ADB : 107.,40 CPG, GCT and ADBproject completion reports.
- Procurement orders andcontracts
* AFESD : 1.55
* CPG : 8.41- Acceptance of equipment andmonitoring of performance.
* GCT : 3.1
Total : 120.54

viii
EXECUTIVE SUMMARY
1. Tunisia’s mining sector was hard hit by the 1990-1994 natural phosphate and by-productscrisis on the international market. This crisis characterised by a fall in demand and a deteriorationof prices, resulted in an under-utilisation of the productive capacities of the phosphate mining andprocessing industry, following a reduction in sales, a suspension of maintenance investments andrenewal of the production tools, as well as financial losses for enterprises in the sector. To remedythis disastrous situation, a financial adjustment and restructuring plan of the entire sector was put inplace in 1993. This plan also included an investment programme to improve the production andcompetitiveness of the sector. The Bank lent its assistance and support to the programme byparticipating in the financing of the phosphate sector rehabilitation project – subject of the presentcompletion report. This financing is the Bank’s second operation in the mining sector in Tunisia.
2. The implementation of the project helped remove the constraints on the running of thesector and greatly contributed to the rationalisation of activities from the technical, financial,administrative and institutional standpoints. It largely contributed to the improvement of theproduction and productivity of the sector, through the removal of bottlenecks in the enrichmentand processing installations, increase in the extracting, storage and handling capacities and theremoval of financial expenses and operating costs. Certain objectives included at appraisal werenot implemented, namely improvement of the P205 recovery rate in the enrichment and reductionof specific consumption during processing. Their implementation requires extra studies andinvestigations for a better technical mastery. Implemented over a period of five years, the projectwas completed with a slippage of two years on the scheduled drawn up at appraisal. The slippagewas mainly owing to long delays in the procurement of equipment.
3. The total project cost upon completion is UA 120.54 million compared to UA 127.80million at appraisal. The gap of UA 7.26 million or 5.68 % corresponds approximately to the costof the protective dykes of the silt storage areas, which were envisaged in the «EnvironmentalProtection» component, but were not implemented as they required more in-depth studies. Thesestudies were conducted and led to environmental projects that are programmed for implementationunder the Xth plan (2002 – 2006). The Bank participated to the tune of UA 107.40 million in thefinancing of the project. The other donors, namely the AFESD, the Groupe Chimique de Tunisie(GCT) and the Compagnie des Phosphates de Gafsa (CPG) contributed UA 1.55 million, UA 3.17million and UA 8.41 million respectively.
4. Having benefited from a highly favourable international economic situation, characterisedby an increase in demand and phosphate prices on the international market, the project contributedto the improvement of the annual operating incomes of CPG and GCT. These incomes becamepositive for GCT in 1995 and for CPG in 1996. Since the middle 90s, the whole sector has beenenjoying a healthy financial position. The financial rates of return of the project are 49 % for CPGand 31 % for GCT, which are clearly higher than those projected at appraisal, namely 17.42 % forCPG and 14.18 % for GCT.
5. The implementation of the project contributed to economic and social development in theGafsa, Gabès, Skhira and Sfax regions, by providing over 20,000 direct and indirect employments.The positive operating incomes recorded from 1996 and the availability of adequate financialresources enabled CPG and GCT to continue increasing their support to the social, sporting andcultural activities of the centres where they are established.
6. The project is classified in environmental category I. Its implementation has developed theextraction and chemical processing of phosphates, activities which have caused atmospheric, sea

ix
and soil pollution. Under the project, measures have been implemented to mitigate or removenuisance, notably: (i) the improvement of solid wastes dumping areas; (ii) the disposal of muddywastes outside the urban and grazing areas (temporary solution); (iii) continuation of the humidphosphate programme; (iv) reduction in the emission of polluting gases; and (v) control andmonitoring of the most noxious elements of these gases. These long-term measures will be pursuedduring the period of the Xth plan (2002–2006) through the implementation of other more importantmeasures like the storage of muddy wastes of the CPG factories and the tipping of phosphosgypsewastes from the Gabès platform.

1. INTRODUCTION
1.1 The phosphate sector occupies a pride of place in the economy of Tunisia in terms ofexports, employment and regional development. The exports of this sector come third after tourismand textile, and the foreign exchange earnings for the country (about 800 million Dinars in 2000)rank it in the forefront by its contribution to the balance of payments. Two state-owned enterprises:the Compagnie des Phosphates de Gafsa (CPG) and the Groupe Chimique de Tunisie (GCT), arethe leading operators. They are responsible for the extraction and enrichment of phosphates andtheir chemical processing into finished and semi-finished products. They employ 10 700 personsgrouped mainly in the governorates of Gafsa, Gabès and Sfax. Taking into account employments ofthe related activities and direct employments, as well as the dependants of the salaried employees,the number of persons living on the phosphate industry in Tunisia is estimated at more than 200000.
1.2 Within the framework of the development of activities related to the sector, the BankGroup, in 1974 and 1975, granted two loans totalling UA 8.9 million to the Société Nationale deChemin de Fer (SNCFT) for the procurement of wagons for transporting phosphates from themining centres to the embarkations of Sfax and GCT factories and also for the renovation,improvement and adaptation of the Southern network of the country. The last loan made it possibleto increase the volume of phosphates transported from the mining centres to the coast. In 1989, theBank granted the Compagnie des Phosphates de Gafsa (CPG) a loan of UA 33 million for therestructuring of phosphate extraction.
1.3 Over the period 1990-1994, the world phosphate and by-products market was marked by avery keen competition and high variations in demand, supply and prices. The fall in worldconsumption led to a fall in imports, giving rise to an imbalance between supply and demand. Thisresulted in a free fall in prices. The phosphate sector in Tunisia was hard hit by this seriouseconomic crisis that led to the fall in the level of sales and the reduction of its earnings. In thesecond semester of 11994, the world phosphate and phosphate fertiliser market started picking up,leading to increased demand and an upward trend of selling prices. It was in this context that theTunisian Government requested the Bank’s assistance to finance a «phosphate sectorrehabilitation» project. The purpose of the financing was to rehabilitate the sector, restore itsfinancial return and economic viability, so that it could take full advantage of the expected recoveryof the world phosphate market.
1.4 This report was prepared on the basis of the project completion reports, which the executingagencies submitted to the Bank, documents furnished by CPG and GCT during the mission toTunisia from 03 to 15 December 2001. The list of documents used for preparing this report isgiven in Annex 11.
2. PROJECT OBJECTIVES AND FORMULATION
2.1 Project Objectives
2.1.1 As defined at appraisal, the objective of the mining sector, whose phosphate sub-componentrepresents over 97% of the activity, was to improve and consolidate its contribution to the growthof manufacturing industries projected at 8.2 % per annum by the VIIIth plan (1992-1996) and theIXth plan (1996-2001), and to ensure the sustainability of an important source of foreign exchange.
2.1.2 The specific objective of the project was to improve the competitiveness of the phosphatesector. It was intended to assist in restoring the financial return of the two companies operating inthe sector, by consolidating and optimising the production tools and by adapting itself to the new

2
market demands both in terms of quality and quantity, in order to take advantage of the favourabletrend of the international phosphate and by-products market. Precisely, the project was to enablethe CPG to increase its production and enhance productivity by about 28 %, to attain 850 T/m/yearby 1997, compared to 658 T/m/year in 1994. For GCT, this project should help increase theproduction of its factories, with as objective the processing of 6.1 million tonnes of phosphate in1997, compared to 5.5 million in 1994, as well as cut down the principal specific consumptions.
2.2 Project Description
The project as defined at appraisal, had the following components: (i) maintenance of CPG’sproduction capacity by increasing quarry extraction to offset the tonnage lost following the closureof the underground mines; (ii) optimisation of the enrichment factories of the CPG and theprocessing factories of the GCT; (iii) environmental protection through reduction of atmospheric,sea and land pollution; (iv) procurement of inputs required for processing phosphates. Annex 2gives the detailed description of the various project components.
2.3 Project Formulation
2.3.1 To check the deteriorating situation of the sector observed during the 1990-1994 period, theGovernment set up a commission in 1992 to diagnose and identify the financial needs and themeasures to be taken to remedy this situation. After an in-depth study, the commissionrecommended a programme of actions focusing on: (i) coverage of stable fund requirementsthrough conversion into capital of State credits and onlent credits; and (ii) mobilisation of a loan ofTD 220 million: TD 70 million borne by the State and TD 150 million as external loan. TheCommission also recommended measures to be implemented by CPG and GCT in order to improvetheir non-operating revenues and expenses. These measures were reflected in an investmentprogramme focusing on: the rehabilitation of productive installations, the improvement of logistics,the optimisation of production and the reduction of expenses. The cost of investments required forthis adjustment was estimated at TD 355 million, corresponding to about UA 251.91 million in1993.
2.3.2 In early 1993, the Government sought the assistance of the World Bank and the ADB forthe financing of this programme. The World Bank expressed reservations in committing itself tothis programme but the Bank supported it and gave its agreement in principle in June 11994,following the improvement of the economic situation.
2.3.3 At appraisal, the formulation of certain project components was not specific. Only the«Machinery for Quarries» sub-component of the «Maintenance of the Production Capacity»component was relatively precisely defined with regard to the type, gauge and number ofmachinery to be procured. For the other components, detailed description was limited toinvestments that fall under the general policy. Certain constituents of the «Optimisation ofProduction» component, such as preparatory works and equipment maintenance fall under the day-to-day activity of the CPG and are normally covered every year on the operating budget. Theirposting under investments to be financed by the Bank was only on a short-term basis in the wake ofthe difficult financial situation the sector was going through. The amount allocated to the «Studiesand Tests of the flotation unit of Séhib» sub-component was over-estimated. The projectimplementation time was, on the other hand, under-estimated.
The content and details of the project components and sub-components financed by the Bank werebetter defined during the 1996 project supervision mission.
2.4 Preparation, Appraisal, Negotiation and Approval

3
The phosphate sector rehabilitation sector was identified by the Bank during a generalidentification mission in early 1993. The Tunisian Government submitted a request for itsfinancing in February 1993. In June of the same year, a CPG and GCT mission visited Abidjan topresent the project to the Bank. The project was then prepared in December 1993 and appraised inJune 1994. Loan negotiations took place in Abidjan in July 11994. To have an overview of thesector, it was decided that the loan should be granted to the Tunisian Government, which was toonlend it to CPG and GCT. The Board of Directors approved the financing of the project in August1994 and the loan agreement was signed on 11 October 1994.
3. PROJECT IMPLEMENTATION
3.1 Loan Effectiveness and Project Start-up
3.1.1 The loan became effective in January 1995, three months after the signing of the loanagreement. The conditions precedent to loan effectiveness were:
i) Evidence of the establishment of GCT through the merger/absorption of SAEPA by SIAPE;ii) Evidence of the onlending, to GCT and CPG, of a loan in the amount of UA 80 million and
UA 30 million respectively on the same conditions as the Bank loan;iii) Evidence of the adoption, by the Interministerial Committee, of the adjustment plan of the
CPG, aimed at removing its structural imbalance, providing it with a working capitalcompatible with its level of activity and enabling it to comply with the standard financingand debt ratios;
iv) Undertaking to submit the performance contracts concluded with CPG and GCT;v) Undertaking to prepare a new operational manual for GCT;vi) Undertaking to create a management control structure within the GCT;vii) Undertaking to comply with following staff reduction plan: 745 persons in 1994; 481 in
1995; 424 in 1996 and 352 in 1997;viii) Undertaking to submit the results of the study on the assessment of the storage site of the
phosphogypsum wastes.
3.1.2 The agreement by the Tunisian Government to onlend the loan to GCT and CPG wassigned on 28/12/1994. Project implementation started with the launching of the first bid by CPG forthe procurement of a lot of machinery for quarries in April 1994.
3.2 Procurement of Goods and Services
3.2.1 Bank-financed equipment for the project was procured in large part in accordance with therules of procedure of the Bank. There were 17 international bids, 59 limited bids and 8 mutualagreements. The lists of contracts for the procurement of machinery, equipment and inputs signedunder the project are given in Annex 3.

4
3.2.2 During loan negotiations, it was agreed that international bidding would be adopted as ageneral rule, limited bidding for certain specific equipment and the mutual agreement procedure forthe procurement of lots of spare parts. For the procurement of «inputs», GCT proposed the mutualagreement procedure in view of the specific nature of the sulphur and ammonia contract. The Bankaccepted this procedure on condition that there would be a prior resort to limited bidding. Themutual agreement procedure would be followed only if the bid was unsuccessful. On completion, itwas observed that the mutual agreement procedure had been extended to other procurements than«inputs» and that the procedure most used by GCT was limited bidding.
3.2.3 At its start, the project was confronted with difficulties of compliance with the Bank’s rulesof procedure for advertisement, notification, and public opening of bids and deadlines given tobidders. These defaults were observed in the GCT, whose knowledge and mastery of the Bank’srules of procedure were inadequate. In addition to these, there were frequent modifications of thelist of goods to be procured under the «Optimisation of production tools» component. Goods andservices financed by AFESD, CPG and GCT were procured in keeping with the Tunisianprocedures for public contracts.
3.3 Modifications
In terms of its objectives and components, the project design was not modified. However,some changes were made in the list of goods and services and in the financing plan. The« reconditioning of machinery» and «procurement of subsets» constituents of the «Maintenance ofProduction» component were implemented from CPG’s capital base. The amounts of the Bankloan allocated to these constituents went to the «Machinery for Quarries» sub-component and madeit possible to increase the number and the gauge of the machinery acquired. The equipment listedin the component « Optimisation of GCT Production» was reviewed and modified at eachsupervision mission. The diversity and nature of this equipment are such that it was necessary toupdate it. The machinery and equipment procured under the project are given in annex 3. For the« Procurement of Inputs» component, only sulphur was procured under the project, while ammoniaand the flocculating agent were bought from GCT’s equity.
3.4 Implementation Schedule
At appraisal, the project was planned to be implemented over a period of 36 months, fromJanuary 1995 to December 1997. This period was largely exceeded as the project was completedonly in December 1999. The two years’ delay results from the often very long procedures for theprocurement of public contracts in Tunisia, with regard to bid evaluation and approval by theinternal authorities of contractors and by the High Purchasing Committee. Some of the delays werehowever owing to the Bank, which took much time in processing certain GCT files, particularly in1997, in the absence of the project officer who was on training abroad.
3.5 Reports
The sector monitoring Committee that was to prepare and submit the quarterly status reportsto the Bank was inefficient. It was replaced by the project executing agency, which submitted 9reports to the Bank for CPG (7 status reports, one audit report in 1999 and one completion report in2001), 5 reports for GCT (4 status reports and one completion report in 2001). The status andcompletion reports are descriptive and limited to data on the bids; financed contracts anddisbursements made from the Bank loan. They are silent on all the aspects related to the projectobjectives (optimisation of the production tool, financial adjustment, competitiveness andenvironment…), and do not give any analysis of the project impact on the activity of theenterprises. These reports do not show any monitoring of the performance indicators stated as

5
objectives at appraisal. Project accounts were only audited in 1999, even though this requirementwas recalled during all the supervision meetings. However, every year, each company submittedthe general audit report of its accounts. The project accounts were audited in 1999 only further tothe recommendations of the last project supervision mission.
3.6 Project Outputs
3.6.1 The principal outputs of the project component are:
a) Maintenance of the production capacity: Acquisition of 50 machinery for quarries instead ofthe 48 projected (see details in annex 3) of a higher gauge and for a part of the fleet, inrelation to the initial estimates.
b) Optimisation of production: For CPG: (i) the Séhib flotation unit (ii) reconditioning of 99 machines; (iii) an unsecured
advance of the calcareous slab estimated at 3 to 6 months’ extraction depending on thequarry and recovery ratio.
For GCT: many measures relating to the six GCI factories and concerning several aspects,including: (i) renewal of equipment and rundown and worn out subsets; (ii) procurement ofequipment that enabled the removal of bottlenecks in the production channel; (iii) theputting up of installations to increase the storage and handling capacities; and (iv)procurement of equipment for the monitoring and control of certain consumables.
c) Environmental protection: A study to determine the storage site of solid phosphogypsumwastes. Several measures taken have helped significantly improve the environmentalprotection of the sea, atmosphere and the land (see 5.2).
d) Procurement of inputs: Procurement of 1,920,000 tonnes of sulphur.
3.7 Project Cost and Sources of Finance
3.7.1 The total project cost upon completion is UA 120.54 million, including UA 116.11 millionin foreign exchange, i.e. UA 96.32 % and UA 4.43 million in local currency. In comparison withthe cost estimate at appraisal, which was UA 127.80 million (117.35 million in foreign exchangeand 10.45 million in local currency), there was a reduction of UA 7.26 million, i.e. 5.68%, takinginto account the part of the loan cancelled. This gap corresponds approximately to certainunimplemented measures envisaged in the project; the financing of which was to be borne by CPG.They are the storage dykes of the muddy wastes and the second flotation unit. For reasons oftechnical difficulties, their implementation was postponed to the Xth plan (2002 – 2006). Table 3.1below gives the comparison of costs by component upon completion and at appraisal.
construction interest estimated at appraisal has been deducted from this total project cost.** These sub-components were implemented from the equity but their costs could not be replenished upon projectcompletion.

6
Table 3.1Table of comparative project costs by component
(in million UA)
Components Cost estimate at appraisal Costs on completion Gap in
Currency Currency
F.E L.C. Total F.E. L.C. Total MUA %
A – Maintenance of production capacity
A1-Machinery for quarries 20.99 0.00 20.99 26.74 0.11 26.84 5.85 27.88
A2-Day-to-day equipment 5.14 0.00 5.14 0.73 0.00 0.73 -4.41 -85.76
A3-Reconditioning of machines 4.99 0.76 5.75 2.57 1.71 4.28 -1.47 -25.50
S/total 31.12 0.76 31.88 30.04 1.82 31.86 -0.02 -0.07
B – Optimisation of Production
B1-Studies/tests/outputs 1.02 4.10 5.12 1.13 0.76 1.89 -3.23 -63.07
B2-Maintenance * 0.58 0.38 0.96 0.00 0.00 0.00 -0.96 -
B3-Preparatoy works* 0.00 0.93 0.93 0.00 0.00 0.00 -0.93 -
B4-Production investment 20.00 1.73 21.73 21.11 0.78 21.89 0.16 0.75
S/total 21.60 7.14 28.74 22.24 1.54 23.79 -4.96 -17.24
C – Environmental protection
E1 – Env. CPG 3.61 2.40 6.01 1.28 0.85 2.13 -3.88 -64.53
C2 – Env. GCT 1.02 0.15 1.17 1.55 0.22 1.77 0.60 51.62
S/total 4.63 2.55 7.18 2.83 1.07 3.91 -3.27 -45.60
D – Inputs 60.00 0.00 60.00 60.99 0.00 60.99 0.99 1.65
Grand total 117.35 10.45 127.80 116.11 4.43 120.54 -7.26 -5.68
3.7.2 The financing plan, upon completion of the project, as compared to the plan at appraisal isas follows:
Table 3.2Comparative table of project costs by sources of finance
(in million UA)SOURCES Estimated costs at appraisal Costs on completion Gap
Currency Currency
F.E L.C. Total F.E. L.C. Total Amount %
ADB 110.00 0.00 110.00 107.40 0.00 107.40 -2.60 -2.36
AFESD 1.02 0.00 1.02 1.55 0.00 1.55 0.53 52.35
CPG 6.18 8.72 14.90 4.98 3.43 8.41 -6.49 -43.54
GCT 0.15 1.73 1.88 2.17 1.00 3.17 1.29 68.83
Total 117.35 10.45 127.80 116.11 4.43 120.54 -7.26 -5.68
3.7.3 Table 3.3 confirms the observations made on the basis of the figures of table 3.1. In effect,the non-implementation, by CPG, of certain investments projected in the «EnvironmentalProtection» component constitutes the most significant gap in the project cost upon completioncompared to at appraisal, in spite of a substantial increase in the number of reconditionedmachinery for the quarries (99).
3.8 Disbursements

7
3.8.1 Disbursements from the Bank loan, which, at appraisal, were programmed over a period ofthree years, from 1995 to 1999, were in actual fact made over six years from 1995 to 2000. Theywere spread from 1995 to 1999 for CPG and from 1995 to 2000 for GCT. The total ADB loanamount of UA 110 million was utilised to the tune of 97.64 % and the balance was cancelled in2000. The comparative, provisional and actual project disbursement timetable is as follows:
Table 3.3Expenditure schedule
(in million UA)
ADD disbursement 1995 1996 1997 1998 1999 2000 Total
Projections 46.04 38.01 25.95 110.00
Actuals 43.52 22.91 33.25 1.01 5.87 0.81 107.40
% Actuals/Projections/Year 94.54 60.29 128.14 - - - 97.64
in % 40.53 21.34 30.96 0.94 5.47 0.76 100.00
Disbursement for the whole project 1995 1996 1997 1998 1999 2000 TotalProjections 52.39 45.76 29.65 127.80
Actuals 47.52 26.07 34.95 3.50 7.55 0.96 120.54
% Actuals/ Projections/Year 90.69 56.96 117.87 94.32
in % of the total 39.42 21.63 28.99 2.91 6.27 0.79 100.00
3.8.2 With the exception of a few payment delays, disbursements were well carried out. Themethod of direct payment of suppliers for CPG and the working capital for GCT were used, as CPGsubmitted to the Bank 54 payment applications for a total amount of UA 27.46 million,representing a balance of about UA 2.50 million that was cancelled. For GCT’s loan share, a totalamount of UA 79.93 million was disbursed: UA 78.12 million in respect of 7 working capitalrequests and UA 1.81 million in respect of 2 reimbursement requests.
3.9 Performance of Equipment Suppliers and Contractors
All the machines and equipment procured under the project are in keeping with thetechnical specifications of the bidding documents. Their suppliers are of international repute in themining industry and phosphate fertilisers. However, difficulties were encountered with certainmachines, notably a scoop type loader delivered to GCT, rotary drills delivered late and whosecontractual availability rate was not effected during start-up, the sea water distiller was damagedduring its handling, the bulldozers which had cracks in the mechanical structure of the chassis andtracks after 6,700 hours of operation. Solutions were found to each case. The scoop type loadersupply contract was cancelled and GCT kept the supplier’s security. The supplier replaced thedistiller. For the drilling machines, the supplier accepted the payment of penalties and provided thetechnical assistance required for achieving the contractual availability rate of the machines. For thebulldozers, the supplier recognised his fault and accepted to repair, at his own expense, the wholechassis and cracked tracks, to deliver three new chassis free of charge and to give a specialguarantee of 22,000 operating hours for these sub-sets. These poor performances should howeverbe put into perspective as they concern only three of the 92 procurement contracts for installations,equipment, machines and machine sub-sets concluded under the project.

8
4. PROJECT PERFORMANCE AND RESULTS
4.1 Overall Evaluation
4.1.1 The overall project performance is satisfactory. The loan agreement became effective threemonths after its signing. The four specific loan conditions (three proofs to be provided, fiveundertakings and six other conditions) were all fulfilled with the exception of that relating to thegradual reduction of the sector’s staff strength. The application of this condition, which wasdiscussed during negotiations, was never effective despite the reminders and recommendations ofthe successive supervision missions. In March 1998 it was suggested to the Tunisian party tosubmit a request to the Bank for the amendment of this condition. On 9 September 1999, GCTsought an amendment from its parent ministry but the latter did not submit it to the Bank.
4.1.2 The project was implemented in a highly favourable condition of the internationalphosphate and by-products market, characterised by a highly sustained demand and marked priceincrease. It has contributed to an improved competitiveness of the sector. The most significantresults recorded are:
For CPG: Production of 7.951 million tonnes in 1998 and 8.301 million tonnes in 2000 comparedto 5.565 million tonnes in 1994 and 6.6 million tonnes projected at appraisal. In comparison withestimates, the outputs recorded a 20.47 % increased in 1998 and by over 25.78% on completion ofthe project in 2000. This increase in production is owing to the availability of raw, sorted and driedphosphate (RSD) in adequate quantity, which enabled the optimal utilisation of the installedprocessing capacities. The increase in RSD extracted tonnage from 8.22 million tonnes in 11994to 12.661 million tonnes in 1999, representing a 54 % increase, results from the opening of newquarries at Mzinda and Kef Eddour Ouest and the significant increase in the extraction of otherquarries, thanks to the machines acquired under the project. The CPG production trend is given inannex 4.
For GCT:
(i) Increase in the production of all the phosphate by-products produced in the Group:phosphoric acid, DAP, TSP, DCP and AN with these two agricultural and porous varieties (annex4). The group therefore processed 6.5 million tonnes of raw in 1998 as against 5.2 million tonnes in1994 and projections of 5.6 million tonnes. The increase was 25% in relation to outputs in 1994 and16 % in relation to projections at appraisal.
(ii) Increase in its storage capacities of finished products and raw materials giving greaterautonomy to the production tool in relation to the programming of sales and the rate of delivery ofraw materials. As a guide, the storage capacity of the Skhira factory has increased from 21 to 30days’ production. The enterprise has significantly increased its handling facilities.
(iii) Substantial energy savings following the electrical inter-connection of the various factoriesthat self-generate their electricity.

9
4.2 Institutional Performance
4.2.1 The two companies operating in the sub-sector were brought strategically closer in August1994 through unification of the General Directorate of CPG and GCT, and appointment of the samepersons in the Boards of Director of the two companies. During the project implementation period(1995-1999), the sector did not undergo any significant institutional modification. In April 1996, itwas decided to bring the Marketing Departments of the two companies together. The latter fallsdirectly under the Managing Director and is organised in geographical departments. Thisorganisation has helped enhance the sales performance of the two companies. It has strengthenedthe place of Tunisian phosphate products on the international market.
Organisation and Management
4.2.2 From the organisational standpoint, the new organisation charts agreed by the parentMinistry have been put in place for the two companies. These organisation charts are functionallydetailed up to the level of the basic entities. In terms of hierarchy, they fix the conditions of accessto the higher level the training cycle and minimum seniority. Analysis of these organisation chartsshows that the sector has strengthened the structures in the areas of management control, miningplanning and maintenance for CPG. The new organisation chart has helped establish amanagement control structure and the preparation of procedures manuals. These structures haveenabled a better monitoring of the production costs, purchases and fixed assets.
Staff and Training
4.2.3 From 1994 to 2000, the staff of the sector was reduced from 2,033 workers to 12,548 and to10,515, i.e. a 16 % reduction. Only CPG reduced its staff from 8,467 to 6,137 workers,representing a 24 % reduction, while the GCT increased from 297 to 4,081 workers in 1994 and to4,378 in 2000, i.e. an increase of 7.3%. Recruitment in the whole sector during projectimplementation focused mainly on the graduates of the various ranks in order to beef up themanagement structure (GCT) and the maintenance of equipment and machines (CPG). The twocompanies of the sector have training structures upgraded to the rank of departments. They providecontinuing education, reconversion and re-adaptation training in the new work stations and standardimprovement training in general. All these trainings are defined in the staff regulations andconstitute almost the only way of internal promotion.
4.3 Financial Performance
Recent Market Trend
4.3.1 In recent years, the international phosphate and by-products market has been favoured bythe combined effects of the concomitant fall in the prices of raw materials, the rates of maritimefreight and a rise in the parity of the US dollar. In effect, since the world phosphate and by-products picked up in 1994, exports of the sub-sector in Tunisia have recorded five consecutiveyears of increase in price and tonnage, reaching an all-time high in 1998. It should however bepointed out that in 1999-2000, there was a drop in demand and dollar prices, which did not affectthe producers’ profit margin. The drop in sales that subsisted in 2000 came from the unexpectedincrease in exports from China, which until then was an importer. The slight imbalance betweenthe current world supply and demand meets the cyclical and standard trend of the sector, moreparticularly the P205 and the DP. According to specialised institutions, in view of the limitedavailability of raw phosphate in

10
quantity and quality and at acceptable costs, it will be difficult to see new large-scale projectsimplemented before the next decade. Thus, the difficult period to overcome would be between2000 and 2003.
Financial Performance of CPG and GCT
4.3.2 The analysis of the sector’s financial performance is based on the 1994-2000 auditedfinancial statements of CPG and GCT. To take account of the financial realities of 1994 and 1995in view of the change of the accounting plan in 1996, the necessary reclassification of accountswere effected without questioning the regularity of the accounting principles of presenting financialstatements. The breakdown of these operating accounts and the balance sheet is given in annexes 7and 8. The study of CPG’s principal financial indicators and ratios from 1994 shows that thefinancial position of the company has improved significantly as presented in tables 4.1 and 4.2hereunder.
Table 4.1Summary results of CPG’s operation 1994-2000
(in million TD)DESCRIPTION 1 994 1 995 1 996 1 997 1 998 1 999 2 000
Operating incomes 129.66 147.97 222.50 263.97 297.21 304.22 299.99Operating expenses 154.82 174.40 199.51 215.15 227.51 236.52 224.05Operating income -25.16 -26.43 22.99 48.82 69.71 67.69 75.94Net income -41.03 -35.99 11.02 45.44 68.82 69.73 81.16
4.3.3 Up from 130 MTD to 300 MTD, i.e. an increase of 130 %, CPG’s operating incomesshowed a favourable trend over the period 1994-2000. During this period, the production soldincreased by 96.5%. The control of operating costs, a better monitoring of amortizations andprovisions, and the resort to subcontracting for certain activities have made it possible to achievepositive performance in 1996. From 11.02 MTD in 1996, the incomes reached 81.16 MTD in 2000(annex 8). Moreover, this improvement of performance stems from the combined effects of thefollowing factors: (i) favourable demand on the international market; (ii) an annual average sellingprice on the increase (21.51 $/t in 1994, 31.8 $/t in 1997 and 39.34 $/t in 2000); (iii) a soldproduction higher than the productions of the 1994 and 1995 fiscal years through stocks offtake.The drop in operating incomes in 2000 results from a fall in the quantities of phosphate and by-products sold. A slight improvement in the market calls for greater vigilance in the monitoring ofthe trend of the international market. Besides, the high level of personnel expenses (37.8% of theexpenses) remains a major concern that the Bank had noted at appraisal. CPG’s principal financialindicators are:
Table 4.2CPG’s principal financial indicators
RATIOS 1 994 1 995 1 996 1 997 1 998 1 999 2 000Liquidity: current asset/current liability 0.71 0.48 0.84 2.04 2.52 2.58 2.97Permanent financing (standard >1) 0.63 0.33 0.87 1.58 1.48 1.71 1.10
PRINCIPAL INDICATORS (in million TD)Equity capital & reserves -74.8 -103.9 -74.9 -8.4 68.4 141.3 225.4Net income -41.0 -35.9 11.0 45.5 68.8 69.7 81.2Working capital -54.1 -95.0 -18.4 12.2 73.4 115.5 196.0Turnover (revenues) 146.7 155.1 208.1 253.3 286.5 291.0 287.7Investments on working capital 15.3 18.4 13.4 29.9 25.0 36.0Debts borne by the Government of the year 0.0 0.9 14.2 16.0 12.3 13.1 18.6Staff 7 918 7 584 7 273 6 928 6 546 6 137

11
4.3.4 The application of law 96-31 of 22 April 1996 led the Government to increase the capital ofthe two companies through the conversion of long and medium-term debts into capital. Throughthis action coupled with the project funds, CPG obtained a positive net income in 1996 and theworking capital, which had been negative for years, became positive at +12.2 MTD in 1997. Theequity firmed up to reach 68.4MTT in 1998 and 225.4 MTT in 2000. Following the financialadjustment law, the cash difficulties, which the company had from 1994 to 1997, were absorbed.From 1998, CPG’s return to financial viability was obvious as evidenced by the cash, debt andpermanent financing ratios. Over the period 1994-2000, the company was able to makeinvestments whose annual amounts increased gradually to reach 36 MTD in 1999, while its debtdecreased at the same time. The financial performances obtained could have been better if theGovernment had met all its commitments: the accumulation of debts owed by the Governmentreached 76.5 MTD in 2000, i.e. 26.5 % of the turnover and 93.8 % of the net income.
4.3.5 With regard to the Groupe chimique tunisien (GCT), the adjustment law was applied at thetime when the company was going through a serious financial crisis (1983-93) characterised bylosses of more than 100 MTD/year and operating in an international fertiliser market marked by anacute crisis that reached its peak in 1993. In 1994, there was a marked improvement in this market,which has ever since been maintained. The Bank’s loan came at an opportune moment of therecovery and enabled GCT to restore its production tool and especially to procure inputs to meet theinternational demand. The combined effects of the financial adjustment measures, the favourableeconomic situation and the project resources enabled the company to obtain from 1997, an incomethat stabilised at around 750 MTD/year. The positive annual net incomes from 1995 helped mopup the accumulated previous losses and meet its financial commitments from 1998: the workingcapital was positive in 1997 while net incomes and liquidity have been positive since 1998, as thedata in the table below show:
Table 4.3Principal financial indicators of GCT
(in million TD)DESCRIPTION 1 995 1 996 1 997 1 998 1 999 2 000
Turnover/Revenues 578 629 732 742 775 739
Cumulative incomes -180 -125 -36 72 133 217
Equity & Reserves 116 157 269 390 459 453
Investments 12 24 34 32 80 78
Investment capital 152 233 376 485 638 490
Stable working capital (1) - (2) - (3) -138 -86 10 63 165 241
Liquidity: (8) - (9) -152 -107 -81 -32 35 49
RATIOS
1 – Debt (standard < or = 1,5) 0.72 0.76 0.54 0.33 0.50 0.08
2 – Productivity: Staff expenses/ Revenues 7.15% 7.21% 6.61% 6.83% 7.37% 8.54%
3 – Net position (MTD) 116 157 268 389 458 452
4 – Structure: net position/Non-current asset 45.1% 67.0% 117.2% 166.5% 192.5% 186.6%
5 – Structure : Working capital (M TD) -138 232 29 124 239 122
6 – Return: Net income/ Revenues 6.70% 8.74% 12.16% 14.73% 7.94% 11.56%
7 – Liquidity: Current asset/Current liability 0.64 0.75 1.03 1.26 1.65 2.16
4.3.6 The dynamism and vitality of the company’s activity is obvious in the analysis of thebalance sheet that shows, from 1994 to 2000, a non-current asset (fixed), which decreases from 295MTD to 242 MTD while current assets (assets, convertible and quick) over the same period,doubled from

12
259 MTD to 450 MTD. At the same time, the equity capital remained constant, but all the equityincreased by over 577 %, from 80 MTD to 482 MTD. Today, GCT enjoys a healthy financialposition with a current liability less than half the equity, a healthy cash position and a return higherthan the capital cost.
Rate of Return
4.3.7 The project is financially viable. On the basis of projection assumptions made around theyear 2006 and given in annex 13, the internal financial rates of return of CPG and GCT are higherthan those projected at appraisal. These rates calculated over the period stand at 45.86 % for CPGand at 35.21 % for GCT against the 17.42% and 14.18% projected. These wide gaps are mainlyowing to the following factors: (i) the Bank’s loan resources came as a supplement to the alreadyexisting industrial units whose infrastructure was in place; (ii) productive investments have beenmade by each of the companies from their equity under the financial restructuring; and, especially(iii) the combined effects of the soaring parity of the dollar with the local currency, and the sellingprice of natural phosphate and its by-products and consequently the increase in sales (cf. annex 7).
4.4 Economic Performance
4.4.1 The project outputs fall within the objectives of Tunisia’s VIIIth and IXth DevelopmentPlans. The procurement of efficient industrial plant and equipment contributed to the improvedproduction and output of the quarries and chemical factories. By renewing the equipment of theprocessing plants and their input supply, the project helped strengthen the phosphate sector andenabled it to take advantage of the growing demand on the international market as well as the priceincreases. Thus, the total sales of the sector rose by 38.96 %, from 734 MTD in 1995 to 1,019MTD in 2000.
4.4.2 The assumptions and the basis used for the calculation of the economic rate of return aregiven in annex 13. On the basis of these assumptions, the project ERR is 46.55 % whereas it was22.85 % at appraisal. The wide gap in the ERRs comes from the increase in the sold tonnage of themining and chemical productions and the continuous increase in market prices. Phosphate price pertonne, for example, soared from 21.648 $ in 1995 to 38.815$ in 2000, i.e. a 44.22% increase.Moreover, the assessment of the project economic return should take into account the contributionof the latter to the value added of the sector estimated at USD 203 million in 1995 and USD 683 in2000. The implementation of the rehabilitation project therefore consolidated the contribution ofthe sector to the country’s external balance.
5 SOCIAL AND ENVIRONMENTAL IMPACT
5.1 Social Impact
5.1.1 The implementation has helped safeguard and increase the activity of the phosphate sector.In that regard, the project has contributed to the improvement of the socio-economic situation of theGafsa, Gabès, Skhira regions and, to a lesser extent, the Sfax region by securing 11 500 direct jobsand about as many jobs in the SMEs of the region, which provide various subcontract work(transportation, handling, servicing and maintenance of installations, cleaning and security). Inrecent years, a real subcontract dynamic has developed around the activity of the phosphate sector,thereby broadening the field of its operation to the satisfaction of the parties concerned, and aboveall benefiting from the support of the public authority. The sector plays a considerable social role inthe towns where it is established. Important social facilities often originate from it: housing,recreation centres, kindergartens, sport complexes and various cultural activities. The restructuringand financial adjustment of the two enterprises of the sector, to which the project has greatly

13
contributed, has enabled the continuation and improvement of financial support to these socialactivities.
5.2 Environmental Impact
5.2.1 The implementation of the project has enabled the development of phosphate extracting,enrichment and chemical processing activities. Problems affecting the environment in the quarriesand processing units – noise, explosions, dust and especially solid and muddy wastes – originatefrom these activities. In the GCT processing plants, the problems are atmospheric and seapollution. The first is produced by gaseous wastes often accompanied by bad odour owing to thepresence of ammonia; the second limited to the Gabès industrial area, is caused by solid wastesformed by sea phosphogypsum.
5.2.2 This project was classified in environmental category I; an environmental impactassessment was conducted and its findings and recommendations have been communicated tothe Board of Directors of the Bank. An environmental component was incorporated into theproject. It provided for the implementation of measures envisaged in the environmentalprotection component of the project given in annex 2. CPG and GCT have implemented thefollowing actions:
For CPG: Reservation of the areas outside the urban agglomeration for the stockpiling of solid
wastes. For their stabilisation and panoramic improvement, a reforestation programmehas been embarked upon for over three years and the results are satisfactory.
For the muddy wastes, CPG has in the first phase undertaken, as a temporary solution, todump them «far away» from the urban areas, grazing lands and areas that can be farmed.These wastes are always dumped into the wadis of the region, whose banks are dyked toavoid flooding, and the installation of pipe culverts for their crossing.
Continuation and completion of the humid phosphate programme: since the beginning ofthe decade, CPG has embarked on a drying cancellation programme, last phase of theprocessing making it possible to reduce the humidity of the finished product from 15 %to 1.5 %. The introduction of modifications to GCT’s chemical processing units, withregard to the acceptance of raw phosphate, has enabled the delivery of the quality filtered(humid) thereby avoiding moisture removal. The last plant to be adapted is the Sfax TSPplant. This investment has enabled a substantial fuel saving and made it possible to curbthe emission of polluting gas and dust in the atmosphere.
For GCT: Several measures have been implemented with a view to reducing the emission of polluting
gas in the atmosphere, namely: the installation of dual absorption in the chimneys; thereplacement of 30 metre chimneys with 70 metre chimneys; the adoption of a gaseouswastes washing system; the control and continuous monitoring of the rates of NOX, SO2and NH3 in the neighbouring urban agglomerations. All these measures have led to thenear total elimination of the fog that used to form regularly in the Gabès industrial area, andmade it possible to measure rates of NOX, SO2, and NH3 every quarter of an hour. Theresults achieved are clearly less than the standard fixed by the Environment ProtectionAgency (EPA).

14
Study of the phosphogypsum tipping of the Gabès platform: after the investigations carriedout on the Sebkhet El Maleh site, which lasted over three years, the site proved unsuitablefor the storage of phosphogypsum, owing to the presence of underground karstic cavities.This study is ongoing on another site at Sabkhet El Khalige where geophysical and geo-technical works are programmed.
5.2.3 The implementation of this project component has sensitised managers of the sector onthe problems of environmental protection. Impact assessments have been undertaken. Theyhave given rise to projects billed for implementation during the period of the Xth Plan (2002-2006). They are (i) construction of retention dykes in the areas suitable for the muddy wastes ofthe CPG plants; (ii) recovery of fluorine from the gaseous wastes in all the GCT plants; and (iii)characterisation of the Gabès phosphogypsum disposal site.
6 PROJECT VIABILITY
The sustainability of the results achieved by the project depends on the capacity of the twoenterprises of the sector to maintain the equipment and installations procured under the project andtheir operation in the best conditions. CPG and GCT have the human and material resources tocarry out these tasks. They have strengthened the framework of the project through a series oftraining cycles of the operating and maintenance staff in the new equipment. The financialsituation of the sector gives it the capacity to sustainably finance the operating and maintenance ofthe machines and installations put in place. The sector has the financial resources needed for themaintenance and renewal of the equipment. The results also depend on the continuation of afavourable economic trend of the international natural phosphate and by-products market. Barringthis exogenous factor, the sustainability of the sector is assured and its long and medium-termeconomic viability consolidated by the large reserves of phosphate in which Southern Tunisiaabounds, the technical mastery of the enrichment and processing procedures and the experienceacquired in the control of expenses.
7 PERFORMANCE OF THE BANK, THE BORROWER AND THE EXECUTINGAGENCIES
7.1 Performance of the Bank
From the appraisal of the project to its completion, the Bank regularly lent its support to CPG andGCT, which enabled the implementation of the project without any major problem. Foursupervision missions were organised during the project implementation period. There was onesupervision every year except in 1995. However, these supervision missions and their reportsconcerned only the part of the project financed by the Bank and were therefore inadequate. TheBank never analysed critically the status reports communicated by the executing agency. Thesereports were indeed simplistic and corresponded neither to the technical standard of the project norto the know-how of the two enterprises. In its completion report, GCT raised the issue of lack ofthe person to contact for the monitoring of their files during 1999. This shortcoming led to delaysin the processing of the project files by Bank services.

15
7.2 Performance of the Executing Agency
As the executing agencies, CPG and GCT successfully implemented the project technicallyand financially. They followed the whole procurement procedure, the monitoring of projectimplementation, the acceptance, the commissioning and the control of the performance of themachines and equipment. All these operations were implemented by the technical departments ofthe enterprises in the sector without any external assistance. The principal shortcomings of theexecuting agencies came to light in the submission of the partial status reports and in the accountingand financial management of the project, because the project accounts were not kept separately. Inaddition, each of the two executing agencies submitted only one audit report of the projectaccounts.
8. OVERALL PERFORMANCE AND RATING
All the equipment and machinery acquired under the project have been commissioned andare functioning normally and satisfactorily. As for the «inputs», they were acquired in accordancewith the needs of GCT and have made it possible to meet the demands for phosphoric acid and theby-products on the international market. The expected project objectives, in terms of improvingproduction, productivity and foreign exchange earning, have been achieved and even largelyexceeded. With an average mark of 3.1 out of 4 as shown in annex 9, the overall projectperformance is considered satisfactory.
9 CONCLUSIONS, LESSONS AND RECOMMENDATIONS
9.1 Conclusions
9.1.1 The phosphate sector rehabilitation project was completed two years behind the scheduledrawn at appraisal. This delay did not affect the project results. The objectives defined at appraisalhave been achieved and some even exceeded. During the implementation period, the sectorrecorded production, spending cuts and sales levels higher than estimated at appraisal. Theimprovement of GCT’s production methods and the utilisation of heavy-duty machinery forquarries enabled the sector to make considerable productivity gains and to significantly increase itsproduction capacity. On the other hand, the objectives of improving the P205 recovery rate atCPG, reducing the specific consumption of phosphate, sulphur and ammonia at GCT, and finally ofstaff reduction for the whole sector, could not be achieved. These weak performances are owing tothe favourable climate established in the sector, upon return of its earning capacity.
9.1.2 The project enabled significant advances in terms of environmental protection and respectof the international standards of atmospheric pollution, but two actions included in the project werenot implemented. They were the subject of studies, which gave rise to projects slated forimplementation during the period of the Xth plan (2002-2006), namely: the mud storage dykes andthe location of the zone that can receive the phosphogypsum wastes from the Gabès plants.
9.1.3 The project was implemented in good technical conditions according to the usual practices.The equipment and the installations put up under the project are functioning and have made itpossible to achieve a level higher than that estimated at appraisal in 1994. On the other hand, thefuture of the sector depends on the trend of demands and selling prices of natural phosphate and itsby-products on the world market.

16
9.2 Lessons
9.2.1 The project appraisal report shows notable gaps in the definition of equipment and physicalquantities to be acquired. These inaccuracies concern all the project components with the exceptionof the «Machinery for Quarries» sub-component, which was defined with the desired precision.Lack of the list of equipment complicated project management and the supervision missions weredevoted in part to defining these lists and updating them. The inaccuracy enabled GCT togeneralise the procedure for limited bidding, which, according to the loan agreement, should be theexception and not the rule for the procurement of equipment of the «Optimisation of Production»sub-component. For lack of prior definition, it was difficult for the Bank to oppose this trend andimpose the international bidding as the rule and not the exception.
9.2.2 Technically, the project was well managed, but there were weaknesses in the projectaccounts and finance, as CPG and GCT did not keep a separate project account. The projectaccounts were not audited yearly in keeping with the general conditions applicable to the Bank’sloan agreements, in spite of the reminders issued during the supervision mission. Only one auditreport was prepared in 1999, year of the end of project implementation. The executing agencieslimited it to expenses made from the loan resources. The parts of the project not financed by theBank were not taken into account. To determine the project cost upon completion, the expensesmade under the project by CPG, GCT and AFESD were reconstituted on the basis of the statusreports, financial reports and balance sheets of the two enterprises (cf. annex 6.
9.3 Recommendations
It is recommended:
a) To the Bank to: Systematise project launching missions; Regularly organise, for the borrowers and project executing agencies, training seminars on
the management and auditing of project accounts. During these seminars, the rules andguidelines for keeping project accounts, preparing status, audit and completion reportsshould be presented and explained to them. The model terms of reference for auditingproject accounts should be circulated;
Act in collaboration with the project beneficiaries in streamlining the procurement processof goods, works and services, especially with regard to the evaluation of bids and approvalof documents by bodies within the enterprises, Government control bodies and the Bank;
Continue its support to the sector for the development programme under the Xth Economicand Social Development Plan (2002-2006).
b) To the Government: Revive the sector monitoring committee, which did an excellent work at the beginning of
the last decade. By its representation level, it could give a new lease of life to the sector, fixthe priorities and solve certain problems persisting especially in trade and environment;
Initiate a study to analyse the results achieved by the sector in the last six years, in order todefine the share of the endogenous and exogenous factors.

17
c) To the Executing Agencies: Establish, for future projects, executing agencies that will take care of the technical,
financial and administrative aspects of the co-ordination and management of projects.These agencies should preferably be managed by Engineers with some seniority andmanagement experience in the enterprises so that they can easily accede to the differentdepartments;
Incorporate into the quarterly project status reports the outputs of all the projectcomponents, including those financed from the equity and by other donors. These reportsshould be elaborate and prepared according to the format and guidelines of the Bank forpreparing project implementation monitoring reports.

ANNEX 1
TUNISIA
PHOSPHATE SECTOR REHABILITATION PROJECT
PROJECT AREA
This map has been drawn by the African Development Bank exclusively for the use of readers of the report to which it isattached. The names used and the borders shown do not imply on the part of the Bank Group and its members anyjudgement concerning the legal status of a territory nor any approval or acceptance of these borders.
ANNEX 2Page 1 of 2
TUNISIAPHOSPHATE SECTOR REHABILITATION PROJECT
DESCRIPTION OF THE PROJECT COMPONENTS
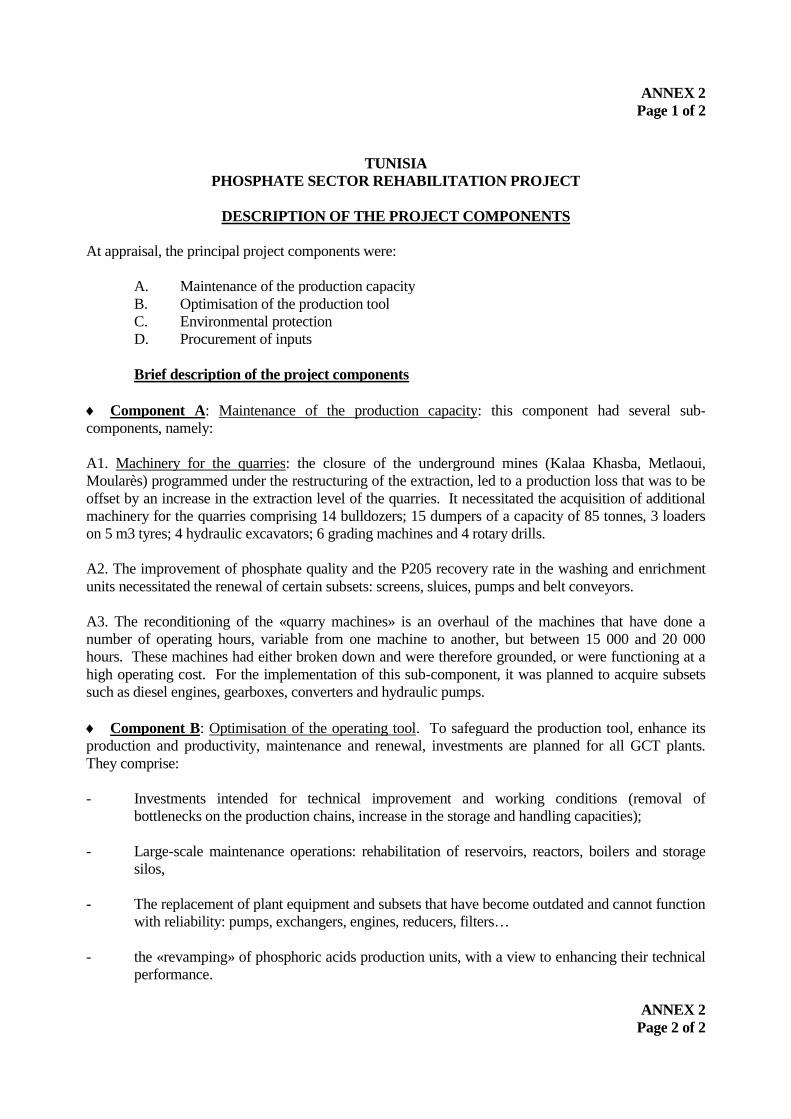
At appraisal, the principal project components were:
A. Maintenance of the production capacityB. Optimisation of the production toolC. Environmental protectionD. Procurement of inputs
Brief description of the project components
Component A: Maintenance of the production capacity: this component had several sub-components, namely:
A1. Machinery for the quarries: the closure of the underground mines (Kalaa Khasba, Metlaoui,Moularès) programmed under the restructuring of the extraction, led to a production loss that was to beoffset by an increase in the extraction level of the quarries. It necessitated the acquisition of additionalmachinery for the quarries comprising 14 bulldozers; 15 dumpers of a capacity of 85 tonnes, 3 loaderson 5 m3 tyres; 4 hydraulic excavators; 6 grading machines and 4 rotary drills.
A2. The improvement of phosphate quality and the P205 recovery rate in the washing and enrichmentunits necessitated the renewal of certain subsets: screens, sluices, pumps and belt conveyors.
A3. The reconditioning of the «quarry machines» is an overhaul of the machines that have done anumber of operating hours, variable from one machine to another, but between 15 000 and 20 000hours. These machines had either broken down and were therefore grounded, or were functioning at ahigh operating cost. For the implementation of this sub-component, it was planned to acquire subsetssuch as diesel engines, gearboxes, converters and hydraulic pumps.
Component B: Optimisation of the operating tool. To safeguard the production tool, enhance itsproduction and productivity, maintenance and renewal, investments are planned for all GCT plants.They comprise:
- Investments intended for technical improvement and working conditions (removal ofbottlenecks on the production chains, increase in the storage and handling capacities);
- Large-scale maintenance operations: rehabilitation of reservoirs, reactors, boilers and storagesilos,
- The replacement of plant equipment and subsets that have become outdated and cannot functionwith reliability: pumps, exchangers, engines, reducers, filters…
- the «revamping» of phosphoric acids production units, with a view to enhancing their technicalperformance.
ANNEX 2Page 2 of 2

This component contained more than 546 articles to be procured under the project.
Component C: Environmental protection: Several actions were programme to reduce atmospheric,maritime and land pollution.
For GCT:
- With regard to the atmosphere, processing the SO2 wastes of the four sulphuric acid productionunits by installing the dual absorption to wash the ammonia gas before its disposal and, finally,to put in place a continuous and automatic disposal control system in order to verify thatgaseous emissions conform to internationally admitted standards.
- With regard to the sea: the phosphogypsum wastes estimated at 10 to 12 000 tonnes/day weredispatched offshore. A study on them should consider all the disposal variants complying withthe environment.
For CPG
- Disposal and stockpiling of the final wastes of the phosphate enrichment plants, which are inmud form, in the areas protected by the dikes.
Component D: Procurement of inputs: This component concerned the financing of inputs such assulphur, ammonia and flocculent for GCT. These elements consisted of raw materials indispensable forthe processing of phosphate.

ANNEX 3Page 1 of 4
TUNISIAPHOSPHATE SECTOR REHABILITATION PROJECT
LIST OF EQUIPMENT PROCURED BY CPG"MAINTENANCE OF CPG PRODUCTION CAPACITY" COMPONENT
N°Of I.C.B.
ContractNo.
Description ofequipment
Successfulbidder
Country F.E. Contractamount
(in 1000 UA paid byADB)
A – MACHINERY FOR QUARRIES
AO. 2105 A2/7801 09 Bulldozers and their accessories MARUBINI JAPAN YEN 3 443
AO. 2513 A2/7907 05 Bulldozers and their accessories MARUBINI JAPAN YEN 1 684
AO.2105 A2/7802 03 5 m3 loaders and their accessories ITOCHU JAPAN YEN 740
AO.2105 A2/7803 03 85 T dumpers and their accessories BEML INDIA $ US 1 186
AO. 2513 A2/7906 12 85 T. dumpers and their accessories BEML INDIA $ US 5 161
AO. 2513 A2/7911 04 14.5 m3 hydraulic excavators DEMAG Germany DM 5 699
AO. 2513 A2/7910 04 Rotary drills and their accessories DRILTECH U.S.A $ US 1 678
AO.2105 A2/7801 03 Grading machines and their accessories MARUBINI JAPAN YEN 776
AO. 2513 A2/7909 03 Grading machines and their accessories ITOCHU JAPAN YEN 252
AO. 2715 A2/8517 01 14.5 m3 hydraulic excavators and theiraccessories.
DEMAG Germany DM 2 911
AO.2715 A2/8518 03 170 T dumpers and their accessories CATERPILLAR U.S.A $ US 3 209
B – ROLLING STOCK
AO.2524 A2/7929 05 Trucks and their accessories RVI France FF 221
AO.2524 A2/7930 05 Lift trucks and their accessories HYSTER England £ 136
AO.2526 A2/7932 41 Utility cars MAZDA JAPAN YEN 375

ANNEX 3Page 2 of 4
TUNISIAPHOSPHATE SECTOR REHABILITATION PROJECT
LIST OF EQUIPMENT CONTRACTS"OPTIMISATION OF GCT PRODUCTION" COMPONENT
BID No. Description of Equipment SuccessfulBidder
Country F.E.Amount paid
byADB
(in 1000 UA)GE 41 1214 Supply of two gas analysers for control of SO2 and NOX
in the air in the urban area Environment France FF 86GE 41 1178 Supply of a stirrer for the storage reservoir of the TK 3701phosphoric acid 78
Lump France FFGE 41 1181 Purchase of a lot of droplet catchers Begg Coussland United
Kingdom
$ US 36
GE 41 1188 Purchase of a lot of pumps Moret France FFEnsival Belgique BFIDP France FF 261
GE 41 1191 Supply of 50 pins Kyoei Japan Yen 68GE 41 5393 Purchase of spare parts of the ENSIVAL pumps Ensival Belgium BF 145GE 41 1186 Supply of a tractor with towrope Loukil Tunisia TD 37GE 51 1042 Coupling of the high pressure network (lot of pumps for
condenser)IDP France FF 19
GE 51 1037 Purchase of two stackers for the loading of DAP sacks EIM Tunisia TD 31GE 51 1095 Purchase of a spare reducer for the WT 3902 sector of the
DAP A workshopMerger France FF 78
GE 41 1184 Purchase of two graphite tube exchangers Carbonne France FFSGL Technic France FF 192
GE 41 1185 Purchase of two scoop type loaders, two lift trucks and onemini loader on tyre
Sacmi Tunisia TD 270
GE 41 1195 Supply of one telephone switchboard SOTETEL Tunisia TD 41SE 52 521 Purchase of conveyor belts PNT Italy Lires 836SE 51 1538 Purchase of one scoop type loader Dalmas Tunisia DT 0GE 41 1192 Supply of 4 sluices for the installation of ammonia Novotherm Tunisia TD 28GE 41 1193 Supply of two calcareous crushing installations Poittemill France FF 859GE 51 1043 Supply of a set of calcareous dosage for the Gabès DCP unit Sautelma France FF 42GE 41 1194 Supply of two ammonia compressors Quiri France FF 57GE 51 1038 Coupling of the high pressure vapour network (lot of tubes
and accessories)Sovema France FF
Outillac Belgium BF 137GE 51 1039 Coupling of the high pressure vapour network (lot of industrial
taps)Klinger Belgium BF
Novotherm Tunisia TDSNRI France FF 101
GE 51 1419 Increase in the P2O5 storage capacity at Skhira and Gabès MFGT Tunisia TD 2 328GE 51 1421 Converters for sulphuric unit 2 of the phosphoric acid plant Guerton France FF 2 250SS 62 4648 1 Alternator rotor Alsthom France FF 347

ANNEX 3Page 3 of 4
TUNISIAPHOSPHATE SECTOR REHABILITATION PROJECT
LIST OF EQUIPMENT CONTRACTS"OPTIMISATION OF GCT PRODUCTION" COMPONENT
SE 61 1533 Acquisition of one fork lift truck with a capacity of two tonnes Dalmas Tunisia DT 19SE 52 784 Grouped purchase of bearings and accessories N.T.N France FF
FAG Germany DMSKF France FF 215
SE 61 1522 Lot of stirrers + scrapers Robin France FF 781Lump France FF
GE 51 1424 Anti-acid coating of two storage reservoirs. SGL Acotec France FF 231GE 61 1078 Two lift trucks SAM Tunisie DT
One telescopic crane Sacmi Tunisia DTFour scoop type loaders Magrimex Tunisia DT 599
GE 51 1420 Supply of one sea water distillation post with a capacity of 25T/H
Entropie France FF 539
GE 61 1077 1 slurry filter Aoustin France FF 2 480GE 41 1179 Supply of a lot of reducers Flender France FF
Merger France FF 50GE 41 1196 Supply of a transformer for the DAP plant F.Transfo France FF 143GE 51 1423 Replacement of the hot gas generator of the DAP "A"
workshopPillard France FF 120
GE 41 1197 Services and supply of equipment for the revamping of G.Schneider France FF 44330 kv posts and the coupling of the 30 kv network of Gabès plants
GE 61 1084 1 absorption tower SCIN France FF 958GE 41 1182 Sulphuric acid coolant Chemetics Canada $ US 119GE 51 1040 Coupling of the high pressure vapour network (lot of
regulatory equipment)Fisher France FF
Eurotherm France FFElsag Bailey France FFKrohne France FF 205
SE 61 1525 Seven diaphragm pumps Dorr-Oliver France FF 122SE 61 1526 16 centrifugal pumps Ensival Belgium BF 174SE 61 1581 Supply of 4 submerged motor-pump generators Pleuger Wor. Germany DM 62GE 51 1044 Supply of three (3) engines for the new CAILLARD Crane Leroy Somer France FF 32SE 61 1532 Purchase of two screw compressors Sacmi Tunisia TD 84SE 61 1524 Two scoop type loaders Parénin Tunisia TD 170GE 61 1316 4 sulphur filters Devita Calata Italy Lires 457GE 61.1270 Replacement of the granulator of the DAP plant CMESSA/SCI
NFrance FF - TD 378
GE 81 1018 2 locotractors CFD France FF 893SE 71 1577 SFAX cooling tower I.W.C S. A $ US 106GE 71 1222 Lot of MT electric engines ABB BP France FF 238SE 81.1503 Mechanical shovels S.P.E.I.A Tunisia TD 99GE 71 1244 Two graphic tube exchangers SGL Technic France FF 461GE 81 1068 Stator for alternator Alsthom France FF 387SE 81.1509 Vacuum pumps for slurry filters Ensival Belgium BF 291SE 81.1588 Phosphoric acid exchanger Berthier France FF 781GE 81.1057 Reducer for turbo-alternator Posiva France FF 75

ANNEX 3Page 4 of 4
TUNISIAPHOSPHATE SECTOR REHABILITATION PROJECTLIST DES CONTRACTS APPROVED BY THE BANK
GCT «INPUTS» COMPONENTContract N°. Approval date Article Suppliers Quantity (in tonne) Contract amount
in $ USUtilised
N°1 06/01/95 Sulphur ELF AQUITAINE 450 000 354 225,710 21 614 900,72
N°2 08/02/95 Sulphur K.P.C 300 000 311 018 ,745 17 331 338,13
N°3 06/01/95 Sulphur MG CHEMIEHANDEL 300 000 247 148,050 14 649 672,79
N°4 08/02/95 Sulphur PRISM 360 000 213 929,810 11 617 712,84
N°5 06/01/95 Sulphur SHELL 300 000 302 774,880 16 473 227,20
N°6 06/01/95 Sulphur AMOCO 210 000 102 467,2 6 708 579,98
Total 1 920 000 1 531 564,39 88 395 431,66
OUTPUTS OF CERTAIN PROECT COMPONENTSUPON COMPLETION.
Maintenance of ProductionEstimates Actuals
A1. Machinery for quarries
A – Bulldozers 20 14
B - 5m3 loaders 6 3
C - 85 tonne dumpers 13 15
D - 170 tonne dumpers 0 3
E - 14 m3 hydraulic excavators 3 4
F - 29 m3 hydraulic excavators 0 1
G – Rotary drills 0 4
H – Grading machines 6 6
A2. Current equipment
A – Service trucks NI 5
B – Lift trucks NI 5
C – Utility vehicle NI 41
A3-Reconditioning of machines
A – Machinery for quarries 48 machines 99 machines
B – Diesel engines 38 Implemented from E.F
C – Gearbox 15 Implemented from E.F.
D – Converters 15 Implemented from E.F.
B. Optimisation of Production NI Implemented
C. Environmental Protection NI Implemented
D – Inputs Sulphur Sulphur
Ammonia Implemented from E.F.
Flocculent Implemented from E.F.
Ces composantes étaient prévues initialement sur financement de la Banque
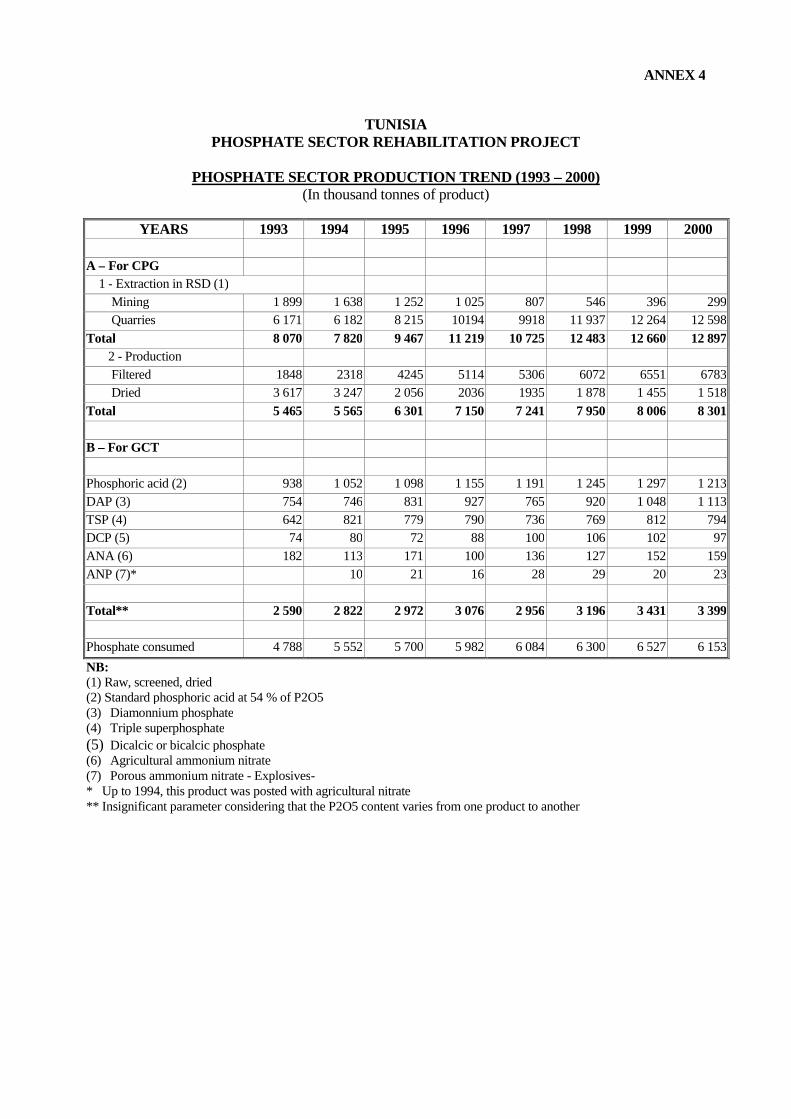
ANNEX 4
TUNISIAPHOSPHATE SECTOR REHABILITATION PROJECT
PHOSPHATE SECTOR PRODUCTION TREND (1993 – 2000)(In thousand tonnes of product)
YEARS 1993 1994 1995 1996 1997 1998 1999 2000
A – For CPG
1 - Extraction in RSD (1)
Mining 1 899 1 638 1 252 1 025 807 546 396 299
Quarries 6 171 6 182 8 215 10194 9918 11 937 12 264 12 598
Total 8 070 7 820 9 467 11 219 10 725 12 483 12 660 12 897
2 - Production
Filtered 1848 2318 4245 5114 5306 6072 6551 6783
Dried 3 617 3 247 2 056 2036 1935 1 878 1 455 1 518
Total 5 465 5 565 6 301 7 150 7 241 7 950 8 006 8 301
B – For GCT
Phosphoric acid (2) 938 1 052 1 098 1 155 1 191 1 245 1 297 1 213
DAP (3) 754 746 831 927 765 920 1 048 1 113
TSP (4) 642 821 779 790 736 769 812 794
DCP (5) 74 80 72 88 100 106 102 97
ANA (6) 182 113 171 100 136 127 152 159
ANP (7)* 10 21 16 28 29 20 23
Total** 2 590 2 822 2 972 3 076 2 956 3 196 3 431 3 399
Phosphate consumed 4 788 5 552 5 700 5 982 6 084 6 300 6 527 6 153
NB:(1) Raw, screened, dried(2) Standard phosphoric acid at 54 % of P2O5(3) Diamonnium phosphate(4) Triple superphosphate
(5) Dicalcic or bicalcic phosphate(6) Agricultural ammonium nitrate(7) Porous ammonium nitrate - Explosives-* Up to 1994, this product was posted with agricultural nitrate** Insignificant parameter considering that the P2O5 content varies from one product to another

ANNEX 5
TUNISIAPHOSPHATE SECTOR REHABILITATION PROJEDT
TREND OF SALES, SELLING PRICES AND PARITY OF THE DOLLAR(For the entire sector from 1993 to 2000)
YEARS 1993 1994 1995 1996 1997 1998 1999 2000I – Sales (in 1000 tonnes of product)
A : CPG
Exports 1 113 1 311 1 330 1 222 1 262 951 1 087 1 070
Domestic sales 4 886 5 506 5 742 6 103 6 062 6 484 6 463 6 260
Total 5 999 6 817 7 072 7 325 7 324 7 435 7 550 7 330
B : GCT
Phosphoric acid 496 635 670 676 786 720 755 646
DAP 770 749 806 888 809 885 1 064 1 076
TSP 630 805 788 726 732 780 737 875
DCP 74 77 73 86 102 105 94 101
ANA 182 117 178 157 131 132 156 154
ANP 11 20 17 27 27 21 21
II – Average selling prices in TD
A – For CPG
* Export 21,648 21,603 21,780 27,355 30,940 37,970 37,622 38,815
* Domestic sales 22,686 21,590 21,974 28,565 32,030 38,639 38,718 39,323
For all CPG sales 22,494 21,519 21,936 28,364 31,850 38,554 38,561 39,248
B – For GCT (FOB in bulk Raw/90 DAYS IN USD
Phosphoric acid 230 266 327 341 348 352 343 298
DAP 140 179 221 229 223 212 185 154
TSP 112 131 154 173 163 159 145 124
DCP 183 177 189 199 201 203 206 192
ANA 121 102 147 169 216 146 145 115
ANP 195 200 208 201 201 207 170
III – Dollar/TD parity 1.0070 1.0078 0.9457 0.9650 1.1050 1.1392 1.1887 1.3729

ANNEX 6
TUNISIAPHOSPHATE SECTOR REHABILITATION PROJECT
EXPENDITURE OF OTHER DONORS BY CATEGORY OF EXPENDITURECPG - GCT - AFESD
(000)
Years 1995 1996 1997 1998 1999 2000 Total
CPG
1 – Reconditioning of the machinesa – Bulldozers 610.104 565.38 342.8 610.71 2128.994b –5 m3 loaders 575.695 602.63 334.84 335.128 1848.293c – 35 tonne dumpers 576.468 185.756 275.45 468.784 1506.458d – Grading machines 81.6 92.152 72.141 61.407 307.3e – Compressors 117.695 123.136 137.46 141.035 519.326
S/total 1961.562 1569.054 1162.691 1617.064 6310.3712 – Flotation unita – Studies/tests 105.420 340.003 445.423b – Equipment 2 097.171 544.920 2 642.091S/total 0.000 0.000 105.420 340.003 2 097.171 544.920 3 087.5143 – EnvironmentSludge disposal 146.000 194.000 600.000 940.000Humid phosphate 700.000 1 500.000 2 200.000Stocks of solid wastes 146.000 146.000S/total 146.000 146.000 700.000 1 694.000 600.000 0.000 3 286.000
Total CPG from 1 to 3 in 1000TD
2 107.562 1 715.054 1 968.111 3 651.067 2 697.171 544.920 12 683.885
UA/TD exchange rate 1.42405 1.43071 1.52353 1.54464 1.6163 1.79234
Total CPG - in 1000 UC 1 479.978 1 198.743 1 291.810 2 363.701 1 668.732 304.027 8 306.990
AFESD
In 1000 TD 2 212.000In 1000 UA 1 553.316 1 553.316
GCT
1 – Production investment 669.000 2 134.000 2 803.0002 – Environment 115.770 23.690 104.400 40.040 42.704 326.604
Total GCT in 1000 TD 784.770 2 157.690 104.400 40.040 42.704 0.000 3 129.604Total GCT - in 1000 UA 551.083 1 508.125 68.525 25.922 26.421 0.000 2 180.076
TOTAL SECTOR in 1000 UA 2 031.061 2 706.869 1 360.335 2 389.623 1 695.153 304.027 10 487.067

ANNEX 7Page 1 of 4
TUNISIAPHOSPHATE SECTOR REHABILITATION PROJECT
INTERNAL ECONOMIC AND FINANCIAL RATES OF RETURN OF THE PROJECT
A – ASSUMPTIONS FOR FINANCIAL PROJECTIONS
Financial projections are established on the basis of the sectors’ data and on thefollowing assumptions:
A. Productions and Sales:
1. The production volumes are assumed to be enough to cover the selling needs. Provision wasnot made for stock variations throughout the period. In spite of the favourable trend of demand onthe international market, sales were assumed to maintain their expected 2002 levels. The outputs ofthe sector’s activities largely exceeded the production estimated at appraisal. Thus, productionestimates in 1998 were 6,600.00 T for CPG and 530,000 T of P2O5, 815,000 T DAP and 815,000 Tof TSP for GCT; 815.000t de DAP et 815.000 T de TSP. Concretely in 1998, they attained7,400,000 T for phosphate, 1,213,000 T for P2O5, 1,113,000 T for DAP and 794,000 T for TSP.Owing to the weakening of the market, sales from 2001 to 2006 are estimated at 8,000,000 T whilethe quantity of fertilisers and the by-products is estimated as follows:
(in thousand tonnes)
Phosphates CPG 2000 2001 2002 2003 2004 2005 2006- Export 1070 1450 1500 1500 1500 1500 1500- Domestic sales 6260 6450 6500 6500 6500 6500 6500- Total sales 7330 8000 8000 8000 8000 8000 8000
Production GCTPhosphoric acid (1) 1 213 1 311 1 300 1 300 1 300 1 300 1 300DAP (2) 1 113 186 186 186 186 186 186TSP (3) 794 132 132 132 132 132 132DCP (4) 97 16 16 16 16 16 16ANA (5) 159 27 27 27 27 27 27
2. Prices (in $/tonne): the projected price trend by product is as follows:
Selling price CPG (DT) 2 000 2 001 2 002 2 003 2 004 2 005 2 006- Export 38.815 38.815 38.815 38.815 38.815 38.815 38.815- Domestic 39.323 39.323 39.323 39.323 39.323 39.323 39.323Average phosphate price/ total 39.248 39.248 39.248 39.248 39.248 39.248 39.248
Dollar/TD parity 1.3729 1.3729 1.3729 1.3729 1.3729 1.3729 1.3729GCT: FOB price in USD/1000 tPhosphoric acid 298 300 300 300 300 300 300DAP 154 180 180 180 180 180 180TSP 124 140 140 140 140 140 140DCP 192 200 200 200 200 200 200ANA 115 140 140 140 140 140 140ANP 170 200 200 200 200 200 200

ANNEX 7Page 2 of 4
- The selling price of fertilisers for the 2001-2006 period will, in a voluntarily stable view, bebelow the average of prices obtained in the last five years on the international market;
- the purchasing prices of inputs are assumed to increase by 5% per annum;- the trend in staff expenses will be according to the annual statutory increase of 5%;
B – ASSUMPTIONS FOR THE CALCULATION OF THE IRR
i) As at appraisal, the internal rate of return was calculated over a period of 12 years, consideredas the life of the heavy equipment acquired by the project;
ii) capital investments: in addition to those made by the project, it was considered that CPG andGCT would maintain the levels they reached from 1995 to 2000 and which varied from 13.4MTD to 36 MTD and from 12 MTD to 80 MTD, respectively;
iii) operating expenses: in view of the volumes of phosphate, fertilisers and by-products, duringproject implementation, future operating and maintenance expenses will be calculated on thebasis of the costs of spare parts, chemical products, electricity, labour and other indispensableinputs;
iv) for purposes of analysis and to reduce the interference of many other projects implemented andongoing in the sector with other donors, the amounts used for maintenance and renewals are anaverage of these amounts spent by the two enterprises. These amounts are mainly intended forthe renewal and normal maintenance of the machines and mining equipment for CPG and forthe maintenance and servicing of the plants for GCT;
v) as at appraisal, the period of 12 years is considered the life of the equipment procured. There isno residual value at the end of the operating life of the project;
vi) In view of Tunisia’s new accounting plan, necessary adjustments have been made to theoperating incomes by taking amortizations into account in determining the cash flow generatedannually.
C. ASSUMPTIONS FOR THE CALCULATION OF THE ECONOMIC RATE OFRETURN
i) As at appraisal, and in order to obtain results comparable to projections, the prices of productswere not adjusted owing to the competition on the international market;
ii) the exchange rate remains unchanged because the Tunisian currency is stable, thanks to theefforts made by the Government under its adjustment programmes, which have enabled thecountry to have a compatible exchange rate;
iii) the investment cost was adjusted, as it comprises a small amount in local currency (90% inforeign exchange and 10% in local currency). The inclusions of other transfers, especially fromlabour and other transports could be considered marginal: equipment is delivered on the sites,installed and tested by the supplier;
iv) intermediate consumptions (energy, inputs, spare parts and other supplies) are adjusteddownward by 10% of their amounts to take account of duties and taxes;
v) staff expenses are considered to be reckonable wage after a 115 % deduction of their amounts asincome tax and contribution to social security.

ANNEX 7Page 3 of 4
TUNISIAPHOSPHATE SECTOR REHABILITATION PROJECT
CALCULATION OF THE INTERNAL FINANCIAL RATE OF RETURN.
1 FOR THE GAFSA PHOSPHATE COMPANY(in million TD
Description 1 995 1 996 1 997 1 998 1 999 2 000 2 001 2 002 2 003 2 004 2 005 2 006Operating income -35 968 11 019 45 444 68 826 69 736 81 164 86 009 96 355 88 151 86 023 86 023 86 023Depreciations 24 475 23 023 30 981 37 815 33 403 30 199 30 199 30 199 30 199 30 199 30 199 30 199Project investments 7606 2918 12271 1011 5873 0 0 0 0 0 0 0Investments from equity 12700 15100 31100 43400 56500 25200 24100 24100 24100 24100 24100 24100Maintenance and Renewal 18400 13400 29900 25000 36000 16300 16300 16300 16300 16300 16300 16300Financial flows -50 199 2 624 3 154 37 230 4 766 69 863 75 808 86 153 77 950 75 822 75 822 75 822
IRR : 45.88 %
2. FOR THE GROUPE CHIMIQUE TUNISIEN(in million TD
Description 1 995 1 996 1 997 1 998 1 999 2 000 2 001 2 002 2 003 2 004 2 005 2 006Operating incomes 50 816 86 219 104 764 130 782 65 988 66 042 65 144 65 144 65 908 65 908 65 908 65 908Depreciations 43 276 43 625 43 187 27 754 89 534 30 287 30 287 30 287 30 287 30 287 30 287 30 287Project investments 41 716 22 632 21 591 40 43 815 0 0 0 0 0 0Investments from equity 33 000 84 716 136 248 187 719 57 787 6 000 6 000 6 000 6 000 6 000 6 000 6 000Maintenance and Renewal 12 000 24 000 34 000 32 000 80 990 78 230 24 810 22 405 22 405 22 405 22 405 22 405Financial flows 7 376 -1 504 -43 888 -61 223 16 702 11 283 64 621 67 026 67 789 67 789 67 789 67 789
ERR : 35.21%
ANNEX 7

Page 4 of 4
TUNISIAPHOSPHATE SECTOR REHABILITATION PROJECT
CALCULATION OF THE PROJECT ECONOMIC RATE OF RETURN(in million DT)
DESCRIPTION 1 995 1 996 1 997 1 998 1 999 2 000 2 001 2 002 2 003 2 004 2 005 2 006Operating income 29 875 111 576 165 673 215 905 152 992 166 020 170 719 181 437 173 625 171 497 171 497 171 497Depreciation 67 751 66 648 74 169 64 109 122 936 60 152 60 152 60 152 60 152 60 152 60 152 60 152Gross operating income 97 626 178 224 239 842 280 014 275 928 226 172 230 871 241 589 233 777 231 649 231 649 231 649Project investment 67 676 37 138 53 239 5 421 12 232 2 006 0 0 0 0 0 0Investments from equity 45 700 99 816 167 348 231 119 114 287 31 200 30 100 30 100 30 100 30 100 30 100 30 100Maintenance and Renewal 30 400 37 400 63 900 57 000 116 990 94 530 41 110 38 705 38 705 38 705 38 705 38 705Present value -46 150 3 870 -44 645 -13 526 32 419 98 437 159 661 172 784 164 972 162 844 162 844 162 844
ERR : 47.15%

ANNEX 8Page 1 of 3
TUNISIAPHOSPHATE SECTOR REHABILITATION PROJECT
TREND OF CPG OPERATING ACCOUNTS(in million TD)
DESCRIPTION 1 995 1 996 1 997 1 998 1 999 2 000Operating proceeds 147.97 222.50 263.97 297.21 304.22 299.99Fixed assets 7.35 5.21 1.37 3.50 2.34 1.93Operating subsidies 0.00 3.56 0.42 0.00 0.01 0.03Transfer of operating expenses 0.00 1.57 4.88 3.76 6.16 4.45Other operating proceeds 0.00 4.07 3.99 3.40 4.73 6.18Phosphate stocks -14.52Operating Expenses 174.40 199.51 215.15 227.51 236.52 224.05Phosphate stocks variation 0.00 4.57 4.93 -12.70 -11.39 -18.15Purchases consumed 32.81 35.37 35.03 40.07 39.01 43.03Industrial electricity 49.97 5.66 5.72 5.75 5.66 5.93Sub-contracting of production 0.00 17.42 19.03 29.31 31.70 29.60Personnel expenses 67.15 72.32 77.23 82.82 84.76 84.77Subsidised salaries 3.56 0.42Appropriation to amortisations & provisions 24.48 23.02 30.98 37.82 33.40 30.20Other expenses -0.01 37.59 41.81 44.44 53.38 48.67Operating income -26.43 22.99 48.82 69.71 67.69 75.94Financial expenses -17.03 12.85 14.14 8.97 9.31 9.79Investment income 7.49 0.88 10.77 8.09 11.35 15.01Net income -35.97 11.02 45.44 68.83 69.74 81.16
TREND OF GCT OPERATING ACCOUNTS(in million TD)
ITEMS 1 995 1 996 1 997 1 998 1 999 2 000
I – Operating incomes 582.00 628.52 731.52 741.65 775.00 739.30
Other operating incomes 1.73 4.26 4.96 7.42 6.32 7.10
Fixed assets 1.74 0.74 0.29 0.44 0.45 0.11
2 – Operating expenses 531.15 542.30 626.75 610.87 709.01 673.26
Stock variation of products finished andoutstanding
0.00 -15.32 7.59 -13.66 -2.39 0.91
Purchases consumed 440.94 379.57 413.44 438.90 438.81 471.55Staff expenses 41.39 44.98 47.98 50.12 56.61 62.55Appropriation to amortizations and provisions 48.05 48.47 47.99 29.22 99.48 33.28Other operating expenses 0.77 84.61 109.76 106.29 116.50 104.97
3 - Operating incomes 50.85 86.22 104.76 130.78 65.99 66.04
Net financial expenses 8.73 36.37 27.60 26.47 6.19 68.10
Income -3.13 4.64 11.16 5.47 4.87 88.08Taxes 0.25 0.00 0.00 1.70 3.70 1.40
6 – Net income 38.74 54.49 88.33 108.08 60.98 84.61
ANNEX 8

Page 2 of 3
TUNISIAPHOSPHATE SECTOR REHABILITATION PROJECT
TREND OF CPG BALANCE SHEET(in million TD)
ASSETS 1 995 1 996 1 997 1 998 1 999 2 000
Non-current assets 119.1 104.6 112.1 108.4 120.1 109.6Fixed assets 119.0 97.2 102.2 96.6 106.3 96.6Other non-current assets 0.1 7.4 10.0 11.8 13.9 13.0
Current assets 123.0 139.7 151.9 222.0 293.8 374.7Including finished and outstanding stocks 65.6 68.9 64.2 69.9 79.5 87.6
- Customers and related accounts 37.2 51.6 67.2 70.7 88.3 81.6- Other current assets 0.0 16.1 17.6 17.0 21.9 28.5- Liquidities and equivalents to liquidities 0.0 3.2 2.9 9.3 7.7 28.6- Maturity of credit borne by the State 0.0 12.1 25.7 35.0 45.0 60.2
TOTAL 242.1 256.4 289.7 365.4 459.0 544.4
LIABILITIES
Equity -103.9 -74.9 -8.4 68.4 141.3 225.4Capital base 284.0 286.9 334.5 334.5 334.5 334.5Reserves 1.4 1.4 1.4 2.4 3.4 4.6Other equities 36.1 51.2 24.7 32.7 35.8 38.7Differed income -389.4 -425.4 -414.4 -369.9 -302.1 -233.6Accounting modifications 0.0 0.0 5.4 0.0 0.0 0.0Net income -36.0 11.0 40.0 68.8 69.7 81.2
Non-current liabilities 163.3 206.3 185.5 160.0 141.3 112.5Including – Convertible debts borne by the State 12.8 100.1 72.9 59.8 44.7 33.3
- Borrowings 134.6 81.2 91.6 79.5 73.6 60.2- Provisions 15.1 24.8 20.7 20.4 22.7 18.8
Current liability 182.7 112.9 86.9 102.0 131.4 146.3Including – Suppliers and related accounts 152.9 42.5 33.4 41.0 44.0 43.6
- Banking assistance 29.8 45.1 21.7 23.2 40.7 43.7
Total of liabilities 346.0 319.2 272.4 262.0 272.7 258.9Convertible capital debts not paid by the State 0.0 12.1 25.7 35.0 45.0 60.2
TOTAL 242.1 256.4 289.7 365.4 459.0 544.4

ANNEX 8Page 3 of 3
TUNISIAPHOSPHATE SECTOR REHABILITATION PROJECT
TREND OF GCT BALANCE SHEETS(in million TD)
ASSETS 1995 1996 1997 1998 1999 2000NON-CURRENT ASSETS 257 235 229 234 238 242Non capital assets 240.91 218.09 212.13 216.04 220.18 224.25
Other capital assets 16.50 16.56 17.27 18.09 17.99 18.23CONVERSION GAP 0.00 0.00 13.96 8.54 23.75 0.17Shareholders of paid-up capital 47.96 44.37 24.37 24.37 24.37 0.00Allocation not paid by the State 32.69 84.72 136.25 187.72 234.76 6.22CURRENT ASSETS 245.22 260.84 327.21 305.77 418.63 450.08
TOTAL 583 625 731 761 940 699LIABILITIESEQUITY 296 323 346 360 398 368Share capital 238.04 238.04 238.04 238.04 238.04 238.04Others 57.98 84.65 107.92 122.12 131.13 61.99Reserves 0.00 0.00 0.00 0.00 28.59 67.96
CUMULATIVE INCOME -180 -165 -77 30 61 85Accumulated losses -205.08 -219.51 -166.02 -78.30 0.00 0.00Accumulated benefits 25.36 54.09 88.93 108.08 60.88 84.62
S/ TOTAL 116 157 269 390 459 453NON-CURRENT LIABILITIES 83.78 119.08 145.54 128.25 227.28 37.94CURRENT LIABILITIES 383.21 347.83 316.78 242.33 253.76 208.38
TOTAL 583 624 731 761 940 699

ANNEX 9Page 1 of 2
TUNISIAPHOSPHATE SECTOR REHABILITATION PROJECT
PERFORMANCE EVALUATION AND RATING
1. Implementation Performance
Evaluation criteria Marks Observations
1. Compliance with the implementation schedule 1 The project was implemented over 5 years instead of3.
2. Compliance with the costs 4 The total project on completion represents 94. 32%of the cost estimated at appraisal. The gap is MUA7.26 or 5.68 %
3. Compliance with the contractual clauses 2 All the loan conditions were fulfilled with theexception of those relating to audit reports and staffreduction.
4. Adequacy of the monitoring, evaluation andreports
2 The project status and completion reports preparedby CPG and GCT were partial because they wererestricted to contracts financed by the Bank.
5. Satisfactory operating 3 The equipment and installations have been put inplace and are functioning normally without anymajor problem.
Overall evaluation of the implementationperformance
2.4 Satisfactory
2. Performance of the Bank during the project cycle
Evaluation criteria Marks Observations
1. During identification ND
2. During project preparation 2 The project did not reach an adequate maturity stageand its components could not be defined withaccuracy.
3. At appraisal 2 In its design, restructure the sector with a view to areviving the project, whereas the needs of GCT andCPG in 1994 were cash requirements, i.e., line ofcredit. Certain components were not accuratelydefined. The implementation period was under-estimated (lists of equipment not specified).
4. During supervision 2 The project was supervised 4 times per annum exceptin the first year; the supervision reports were silent onthe technical aspects and parts of the project financedby CPG, GCT and AFESD.
Evaluation of the Bank’s overall performance 2

ANNEX 9Page 2 of 2
3. Project Results
N° Indicators of the components Marks(1 à 4)
Observations
1. 1. Relevance and achievement of objectives 3
i) Macro-economic policy 3 Participation of the project in the socio-economic development of theregion, promotion of SME, social actions.
ii) Sector policy 3 Significant contribution of the phosphate sub-sector to the developmentof the industrial sector and to the balance of payments;
iii) Physical outputs (including production) 3 The project is fully implemented and its physical output objectiveshave even been exceeded;
iv) Financial component 4 97.64 % of the ADB loan was utilised and the balance of UA 2.6million was cancelled at the borrower’s request;
v) Poverty reduction, social impact 3 Very positive project impacts on poverty reduction and on the socialliving conditions of the populations;
vi) Environment 2 Some measures were implemented and others postponed to the Xth
plan;vii) Promotion of the private sector 4 The project has enabled the introduction of a subcontracting policy,
thereby contributing to the promotion of local SMEs with anundeniable economic impact;
viii) Development of the private sector 3 The development of the sector’s activity has at the same time enabledthe development of subcontracting;
2. Institution Building 2.5i) Institutional framework (including
restructuring)4 The project has contributed to the successful restructuring of the sector.
No internal information system specific to the project has been put inplace for its management (proper accounting with books by sources;annual auditing of the project accounts…); the technical staff has beentrained.
ii) Financial and management informationsystems, including the audit system;
1
iii) Transfer of technology 3
Endowment with qualified staff 3
3. Sustainability 2.9i) Borrower’s continuing commitment 1 The borrower fulfilled the conditions precedent, but under the general
conditions failed to monitor the implementation by the Follow-upCommittee;
ii) Environmental policy 2 The sector is committed to the implementation of an ambitiousprogramme to eliminate environmental nuisance;
iii) Institutional framework 3 The project has contributed to the strengthening of the organisation ofthe sector through its support to the strategic bridge of the twoenterprises;
iv) Technical viability and staff guidance 3 The two companies have skilled and trained staff, as well as logisticaland material facilities to maintain the equipment.
v) Financial viability, including the cost recoverysystem.
4 The financial position of the sector has improved. However,fluctuations in the prices of phosphate, fertiliser and the by-products onthe international market could be a risk in the event of the drop ofprices;
vi) Economic viability 4 Through the economic spin-offs, foreign exchange earnings,maintenance of employment and promotion of SMEs in the Southregion of Tunisia, the project is a factor of economic development;
vii Environmental viability 2 The actions taken are in the long-term but efforts in this area should bepursued.
viii Operating and maintenance (availability ofrecurrent funds, exchange rate, spare parts,workshop equipment, etc).
4 GCT and CPG provide, without any difficulty, the operating andmaintenance of the equipment acquired, thanks to their positiveoperating incomes. Adequate foreign exchange earnings and enoughbasic infrastructure (workshops).
4. Internal economic rate of return 4 The project economic rate of return upon completion is 47.15 % andthe net value of GCT’s present cash flow is 31.39 % and that of CPG49.78 %.
Overall evaluation of the impact on development 3,1 The overall evaluation of project results is satisfactory.

ANNEX 10Page 1 of 2
TUNISIA
PHOSPHATE SECTOR REHABILITATION PROJECTMatrix of recommendations and follow-up actions
Principal observations and conclusions Lessons drawn and recommendations Follow-up actions Responsibility
* Project formulation and justifications BankAt appraisal, certain components wereinaccurately defined; the equipment to beprocured for these components was definedduring project implementation.
Project appraisal should be undertaken onlyif all the components are well studied anddefined.
Ensure prior to the appraisal of projects that all thecomponents have been studied and accuratelydefined.
CPG
GCT* Project implementationThe project was completed two years behindschedule owing to very long delays in theprocurement process.
Under-estimate of the time for processingbidding documents, especially thosesubmitted to the High PurchasingCommission for approval.
Initiate a dialogue with the Government in order toreduce these delays for Bank-financed projects.
Bank
* Respect of the loan clauses andconditions:
Bank- Certain conditions were fulfilled late in
spite of reminders during the supervisionmissions.
Greater attention should be paid to theverification of the loan conditions duringsupervision missions.
Sensitise the project agencies on the necessity torespect the clauses and general conditions of theloan through the organisation of training seminarsand the circulation of the audit terms of reference.
- Non keeping of a separate account- Absence of the 1995-1998 annual audit
report. Only one was performed in 1999.
* Project managementProject management focused only on thecomponent financed by the Bank because theloan was managed like a line of credit.
Systematise the establishment of a projectmanagement unit in the case ofimplementation agencies that do not have aproject management organisation.
Sensitise the implementation agencies on theorganisation to be set up for Projects Management.
Bank

ANNEX 10Page 2 of 2
* Performance Evaluation Pursue the actions of improving the productivityof the sector through greater modernisation ofthe production tool and staff reduction.
CPG - GCT
The performance of the project is overallsatisfactory. Most of the project objectives wereachieved, and some exceeded projections atappraisal. Others could not be achieved.
This project has contributed in large part tothe improvement of the two companiesoperating in the sector since 1996.
* EnvironmentThe project has enabled the implementation ofactions that help reduce and eliminate certainenvironmental nuisance of the phosphateindustry.
Pursue studies and the implementation ofenvironmental measures to mitigate thenegative impacts on the environment. Itwould be very advisable to assess the share ofthe economic situation – soaring of prices,dollar parity – and the actual effort of thesector on the performance registered.
Support the country in the implementation of theenvironmental projects studied.
Bank
* SustainabilityThe project has contributed to the sustainabilityof the sector.
Undertake actions to shield the sector against aturnaround in the market situation – at least inthe medium-term.
- CPG
The results will be on a medium and even long-term basis if the situation of the internationalphosphate and by-products market does notworsen.
- GCT
- Government

ANNEX 11
TUNISIAPHOSPHATE SECTOR REHABILITATION PROJECT
SOURCES OF INFORMATION
1. Appraisal report of the Phosphate Sector Rehabilitation project, ADB, June 1994
2. Report of the negotiations on the phosphate sector rehabilitation project, ADB, July1994 – Loan Agreement between the Tunisian Government and the ADB, 11 October1994.
3. Loan agreement between the ADB and the Tunisian Government, 11 October 1994.
4. Project supervision mission reports, ADB, 1996, 1997, 1998 and 1999
5. Financial statements of the Compagnie des Phosphates de Gafsa (CPG) 1994 - 2000
6. Financial statements of the Groupe Chimique Tunisien (GCT) 1994-2000
7. Letter to the Board of Directors of the Groupe Chimique Tunisien – 2000 Fiscal year(Assistance Management Audit System – February 2001)
8. Accounts audit report of the phosphate sector rehabilitation project, MajedAbdesselem Firm, October 1999.
9. Accounts audit report of the Compagnie des Phosphates de Gafsa:
- 1993 Fiscal year – Adourad Guellaty Firm;- 1994 Fiscal year - Jelil Bouraoui & Co Firm;- 1995 Fiscal year - Jelil Bouraoui & Co Firm- 1996 Fiscal year - Jelil Bouraoui & Co Firm- 1997 Fiscal year - Ahmed Mansour & Associés Firm.
10. CPG technical status reports from 1994 to 2000
11. Annual reports of the Banque Centrale de Tunisie from 1999 to 2000


