Turndown Ratio of a Gasifier-Combustor Predicted by a Simulation Model
p . K. Chandra, F. A. Payne MEMBER
ASAE MEMBER
ASAE
ABSTRACT
A mathematical model of a gasifier-combustor was developed and validated with experimental data.
The observed and predicted thermal efficiencies differed by an average of 5.8%. The model was used to analyze the effects of biomass moisture, unit size, and degree of insulation on turndown ratio. Turndown ratio was defined as the ratio of design to minimum thermal output and was calculated for a specific updraft biomass gasifier-combustor configuration. Turndown ratio decreased from approximately 8 to 2 as moisture content increased from 10 to 50% (w.b.). The effect of insulation was more significant for smaller gasifier-combustors than for larger ones.
INTRODUCTION
Biomass gasifier-combustors, which gasify biomass in the first stage and burn the gas in the second stage, have been found to be efficient, controllable, and clean burning systems if properly designed and operated (Richey et. al., 1985; Morey et. al., 1984; Payne, 1980). One of the prime characteristics of a biomass combustion system is its "turndown ratio." Turndown ratio was defined as the ratio of design to minimum thermal output. Minimum thermal output is the lowest gasifier-combustor output at which the particular system can be operated and still maintain the minimum level of temperature and oxygen in the secondary combustor. The design output is less tangible and for this work was defined as the thermal output of the system when it is operating at a preselected maximum gasification rate.
Design of two-stage biomass combustion systems requires more attention to detail than conventional single-stage systems because of the increased demands for a clean exhaust and, for some systems, a controllable thermal output. Design is further complicated by both the high moisture content of the typical biomass fuel and the relatively large quantity of heat loss for typical small-sized biomass burners. Both conditions reduce the operating range over which satisifactory combustion is possible. Mathematical modeling of both the physical processes involved and mechanical design of a two-stage
Article has been reviewed and approved for publication by the Electric Power and Processing Div. of ASAE. Presented as ASAE Paper No. 85-3079.
The investigation reported in this paper (No. 242) is in connection with a project of the South Carolina Agricuhural Experiment Station and is published with approval of the Director.
The paper was prepared with partial support of the USDA (Grant No. 82-CRSR-2-2012) and the Southeast Biomass Energy Program, DOE, Administered by TVA (Grant No. TV-64320A).
The authors are: P. K. CHANDRA, Research Specialist, Agricultural Engineering Dept., Clemson University, Clemson, SC; and F. A. PAYNE, Associate Professor, Agricultural Engineering Dept., University of Kentucky, Lexington.
combustion system would allow the quantitative determination of the effects of biomass moisture content and design on turndown ratio.
Reed (1981) discussed the need for turndown ratio to be included in measurements and specifications of gasifiers because this property is required for load-varying applications. He also reported that fixed-bed and fluidized bed gasifiers have typical turndown ratios of 5 and 2, respectively, and that the field of gasification is so new that very little reliable data on turndown ratio of established systems is available.
Several configurations of two-stage combustion systems designed specifically for biomass have been studied by Payne (1980); Bozdech (1980); Lepori et al. (1983); Morey et al. (1984); and Richey et al. (1985). The turndown ratio was reported by Richey et al. (1985) to be 3 for dry corncobs for a downdraft channel gasifier. Payne et al. (1985b) tested a 0.3 GJ/h updraft gasifier-combustor and measured a turndown ratio of approximately 2. No information was found in the literature quantifying the combined effect of fuel moisture content and gasifier-combustor insulation on turndown ratio.
The objectives of this study were to: (a) formulate a steady state mathematical model of a specific updraft gasifier-combustor design, (b) validate the model using experimental data, and (c) determine the effects of insulation, unit size, and biomass moisture content on turndown ratio for the specific gasifier-combustor design being considered.
MATHEMATICAL MODEL DEVELOPMENT
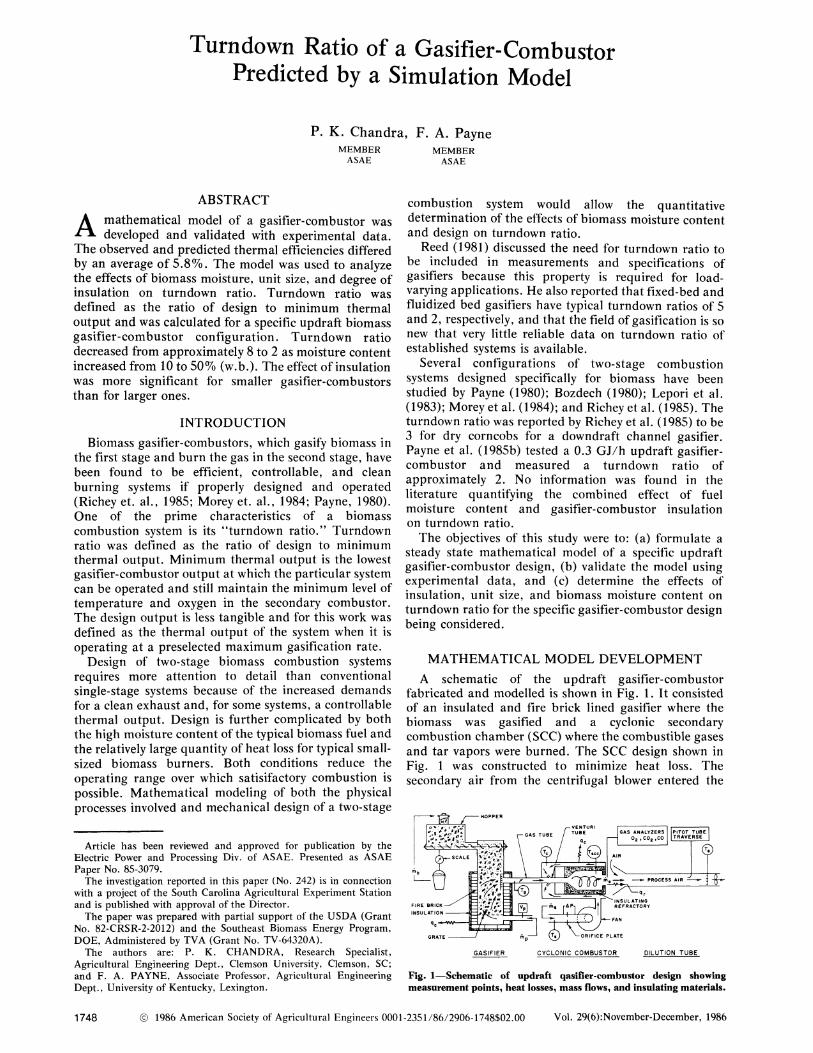
A schematic of the updraft gasifier-combustor fabricated and modelled is shown in Fig. 1. It consisted of an insulated and fire brick lined gasifier where the biomass was gasified and a cyclonic secondary combustion chamber (SCC) where the combustible gases and tar vapors were burned. The SCC design shown in Fig, 1 was constructed to minimize heat loss. The secondary air from the centrifugal blower entered the
DILUTION TUBE
Fig, 1—Schematic of updraft qasifier-combustoi- design showing measurement points, heat losses, mass flows, and insulating materials.
annular section around the SCC such that it moved with a spiral motion picking up heat as it proceeded through the chamber. A venturi tube with multiple nozzles was used to draw the gas from the gasifier. Secondary air was injected through these jets and imparted with both an angular and forward velocity. The forward velocity component created a suction on the gasifier. The gas was drawn from the gasifier, mixed with the secondary air, and ignited in the SCC. A detailed description of the venturi design was presented by Payne et al. (1985a). Physical dimensions of the laboratory gasifier were given by Payne and Chandra (1985) and of the combustor by Payne and Chandra (1986). These publications also describe the procedure and equipment used to collect data for a complete mass and energy balance on the gasifier-combustor.
The mathematical model was organized such that three parameters: (a) net heat output, (b) SCC temperature, and (c) fuel properties (ultimate analysis, gross heat of combustion, and moisture content) could be selected and then the mass and energy flows and unit performance calculated. Net heat output from the system, q, was defined as the sensible heat of the exhaust above atmospheric temperature. The exhaust flow rate, m , was then calculated using the operating temperature of the SCC, Tscci atmospheric temperature, T , and the mean specific heat of the exhaust gas, Cp, as follows:
me Cp (Tscc -Ta
Since the mean specific heat is a function of exhaust composition and temperature, its value was initially assumed and corrected later in the model in an iterative procedure.
The energy lost from the gasifier—combustor due to conduction and convection through the walls, q ., and radiation through the open end of the SCC, q,., were evaluated using estimated convection coefficients, material conductivities supplied by manufacturers, and an assumed emissivity of 1.0 for q .. Conduction heat loss through the gasifier was estimated by assuming the following temperature profile within the gasifier:
1. interior brick surface temperature of 600°C below the grate,
2. gas temperature of 90°C exiting the gasifier, and 3. the fuel bed (and interior brick surface)
temperature of 1200°C at the grate decreasing to 90°C at the top of the gasifier.
The calculation of the wet biomass gasification rate, m^, was made by assuming steady state and complete combustion of the biomass and dividing the sum of heat losses and net heat output (total sensible heat converted) by the net energy content of biomass, AH, :
mb _ q + qr + qc
AHn
The net heat of combustion AH ^ measures the maximum sensible heat which can be extracted from a fuel if the water in the fuel and the water generated during combustion exit the system as a vapor. The net heat of combustion as defined by ASTM (1974) corrects the gross heat of combustion to exclude the heat of vaporization of the water and makes a minor correction from a constant volume to a constant pressure process. The minor correction was shown to be insignificant for a
typical biomass fuel and when neglected permits AH,, to be calculated by the following equation when using positive values for AH (Payne, 1984):
AHn = AHo - (X + A H o ) X ^ k j / w e t kg
where, AHQ = AH — 9AXH = net heat of combustion at
zero fuel moisture content. Units: kJ/dry kg.
AH = gross heat of combustion (higher heating value). ASTM (1974) D-2015 is a standard method of measurement. Units: kJ/dry kg.
A = 2442 kJ/kg, latent heat of vaporization of water at a reference temperature of 25°C.
XH = mass fraction of hydrogen in the dry fuel. Units: kg H/kg dry fuel.
Excess air, £, was calculated at this point since SCC temperature, heat loss per unit fuel, and fuel properties are known (Payne, 1984). With £ known, the primary and secondary air flow rates were estimated using the equations presented by Payne and Chandra (1985):
iTip = m b (1 - Xjn) S° 0g
ms = mb ( l - X ^ J S ^ ^ ( l + e - 0 g )
where: nip, m, = primary and secondary air rates,
respectively, kg/s £ = excess air index, i.e., ratio of amount of
excess air used to stoichiometric air requirement, dimensionless
S° = stoichiometric air requirement, kg air/kg dry biomass, i.e., the amount of air required for complete combustion, and
<t>g = equivalence ratio for gasification, i.e., the fraction of the stoichiometric air requirement used in the gasification step, dimensionless.
The equivalence ratio for gasification was estimated using the correlation developed by Payne and Chandra (1985) for wood chip gasification:
( g = 0.14 + 1.27 f
where: f = the fraction of fuel gross heat of combustion
which is converted to sensible or latent heat in the gasifier and exits either through the gasifier walls or with the gas.
Inclusion of the above relationship makes the model specific to wood chip gasification with regard to predicting primary air flow rates. The relation for ^^ was slightly different for corncobs as reported by Payne and
Vol. 29(6):November-December, 1986 1749
Chandra (1985). Thermal efficiency was calculated by dividing the net
energy output by the net energy input.
MODEL VALIDATION
The mathematical model permits the calculation of the mass flows and energy efficiency when the heat output, biomass fuel properties, and SCC temperature are selected. The model was validated by comparing calculated and measured values for mass flows and thermal efficiency.
The measured thermal efficiency was determined in two ways: one by calculating the enthalpy of the input and output mass flows; and the other by calculating net energy input and output. The equation used to calculate efficiency using the enthalpy method (Payne, 1984) is as follows:
where
(Hp - Hpa)
(Hr - Hpa)
H„
H.
= enthalpy of products of combustion at Ts c^ = enthalpy of products of combustion at T ,
and = enthalpy of reactants.
Thermal efficiency was also calculated by comparing net energy input with output using the following equation:
(mp + mb + nis) Cp ( T s c c " Ta)
n i b ^^n
An average thermal efficiency r]^^ defined as the average of r]^ and r]^ was used to compare with the calculated thermal efficiency. Fourteen experiments were conducted on the 80 kJ/s laboratory gasifier-combustor sketched in Fig. 1. The experimental tests were run with wood chips over a moisture range of 12 to 48% and a specific dry gasification rate of 11 to 38 g/m2s (Payne and Chandra, 1986). The measured energy output, fuel properties, and SCC temperature of the experiments were used as input to the model to predict primary and secondary air rates, gasification rate, and
TABLE 2. STATISTICAL ANALYSIS ON MEASURED A N D CALCULATED ENTITIES AT 0.05 LEVEL OF SIGNIFICANCE.
Variables Test UQ: b - l = 0 b *
m b 0.18 t < t c r i t
mg 0 .25 t < tcri t
no t rejected
no t rejected
1.05
0.93
0.97
0.88
* Slope of the least squares line be tween measured and calculated enti t ies .
tcri t ^^ *^^^ ^^^^ ^ ^ s 1.812.
average thermal efficiency. Measured and calculated values are compared in Table 1. The measured and calculated mass rates for primary air were close as expected since the relationship for <j>g was developed from the data. Least squares estimation of a linear relation between measured and calculated values of gasification rate and secondary air rate were calculated. A test of the hypothesis that the slopes were not significantly different from unity was performed and the results summarized in Table 2. The standard deviation for the difference between calculated and measured values of m^ and m was 0.42 and 4.52 g/s, respectively.
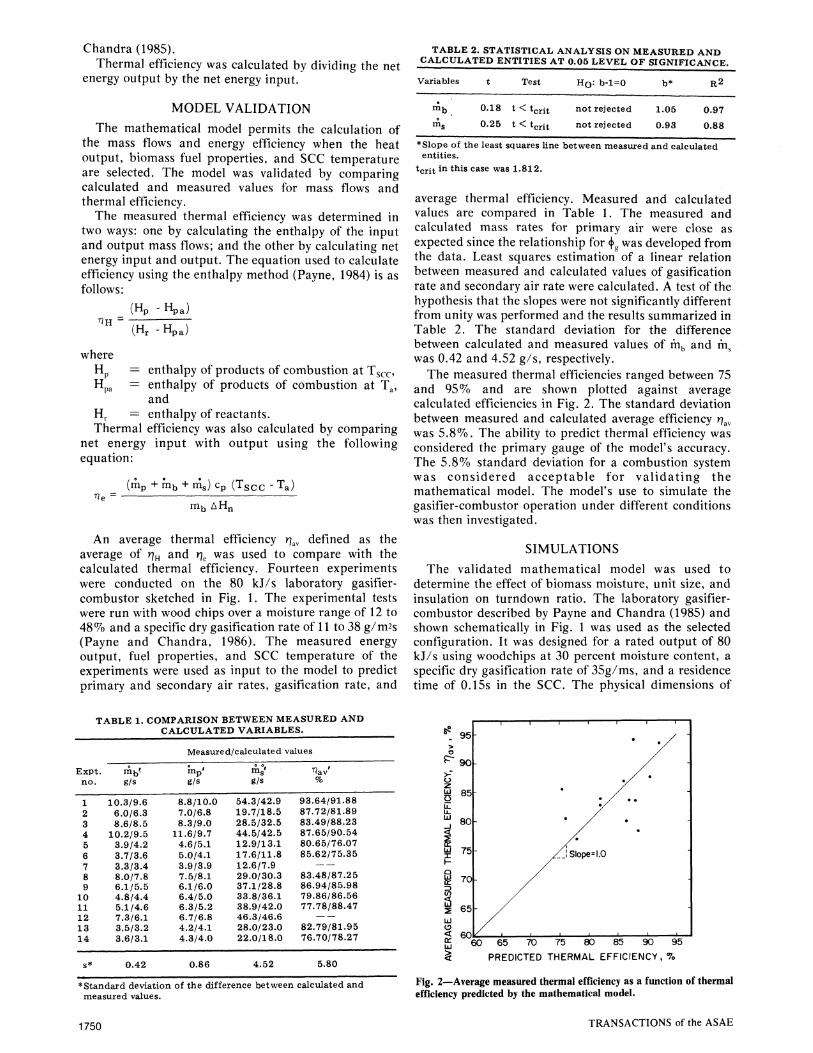
The measured thermal efficiencies ranged between 75 and 95% and are shown plotted against average calculated efficiencies in Fig. 2. The standard deviation between measured and calculated average efficiency v)^^ was 5.8%. The ability to predict thermal efficiency was considered the primary gauge of the model's accuracy. The 5.8% standard deviation for a combustion system was considered acceptable for validating the mathematical model. The model's use to simulate the gasifier-combustor operation under different conditions was then investigated.
SIMULATIONS
The validated mathematical model was used to determine the effect of biomass moisture, unit size, and insulation on turndown ratio. The laboratory gasifier-combustor described by Payne and Chandra (1985) and shown schematically in Fig. 1 was used as the selected configuration. It was designed for a rated output of 80 kJ/s using woodchips at 30 percent moisture content, a specific dry gasification rate of 35g/ms, and a residence time of 0.15s in the SCC. The physical dimensions of
TABLE 1. COMPARISON BETWEEN MEASURED AND CALCULATED VARIABLES.
•S t anda rd deviation of the difference be tween calculated and measured values.
'60 65 70 75 80 85 90 95
PREDICTED THERMAL EFFICIENCY, 7o
Fig. 2—Average measured thermal efficiency as a function of thermal efficiency predicted by the mathematical model.
1750 TRANSACTIONS of the ASAE
TAB^E 3. SUMMARY OF PHYSICAL DIMENSIONS OF THE GASIFIER-COMBUSTORS
Rated output,
kJ/s
80 200 800
4000
Grate area, m2
0.22 0.55 2.20
11.00
Gasifier height,
m
0.76 1.03 1.75 3.60
Gas tube diameter
m
0.095 0.150 0.300 0.670
Cyclonic SCC
Inside diameter,
m
0.30 0.42 0.66 1.53
Inside length,
m
0.58 0.75 1.20 1.52
three larger gasifier-combustors having rated output capacities of 200, 800, and 4000 kJ/s were specified based on the laboratory model design. A maximum gasification rate of 35 g/m^s was used for all gasifier designs. The inside height between the grate and the top of the gasifier was designed to be equal to the square root of the grate area. An additional length, variable with capacity, was added below the grate for ash removal. A summary of the gasifier-combustor dimensions is given in Table 3.
The average velocity at rated output in the primary air inlet, gas tube, secondary air inlet, and exhaust exit from the SCC were designed to be 1.0, 2.5, 6.1, and 3.9 m/s, respectively, and were the same as the gas velocities at rated output for the laboratory model. The temperatures of the gas entering the SCC and the exhaust exiting the SCC were assumed to be 90 and 1100°C, respectively, for all sizes. The cyclonic SCC length and diameter were estimated as summarized in Table 3. The residence time at rated output was 0.15 s for all designs except for the 4000 kJ/s size which was 0.20 s because the velocity restrictions of 3.9 m/s yielded an abnormally short combustor.
The effect of increasing amounts of insulation was tested by incrementing the resistance of the insulation while maintaining a constant thickness. The exterior dimensions of the gasifier-combustor thus remained constant for all tests on each size. Six levels of insulation were used in the simulation ranging from no insulation to very high insulation (thermal resistance of 25400 and 5000 m2s K/kJ for the gasifier and the SCC, respectively). The fire brick in the gasifier and convection coefficients for both the gasifier and SCC provided a base thermal resistance which remained constant for all tests.
Moisture mass fractions were included in the simulation to show the effect of moisture on turndown ratio. Five levels of moisture considered were 0.1, 0.2, 0.3, 0.4 and 0.5 kg of moisture per kg of wet biomass. The four levels of gasifier output, five levels of moisture
8
6
/\
2
0
SIZE. kJ/s:
. - 4000 0 ^^^ ^ ?oo
o ^°
1
MOISTURE LEVEL, X^=0.3
-
^ ^ Q J
, GASIFIER- 2.54 25400.0
COMBUSTOR-• 0.5 5.0 50.0 500.0 5000.0
THERMAL RESISTANCE OF INSULATION, m2s K/kJ
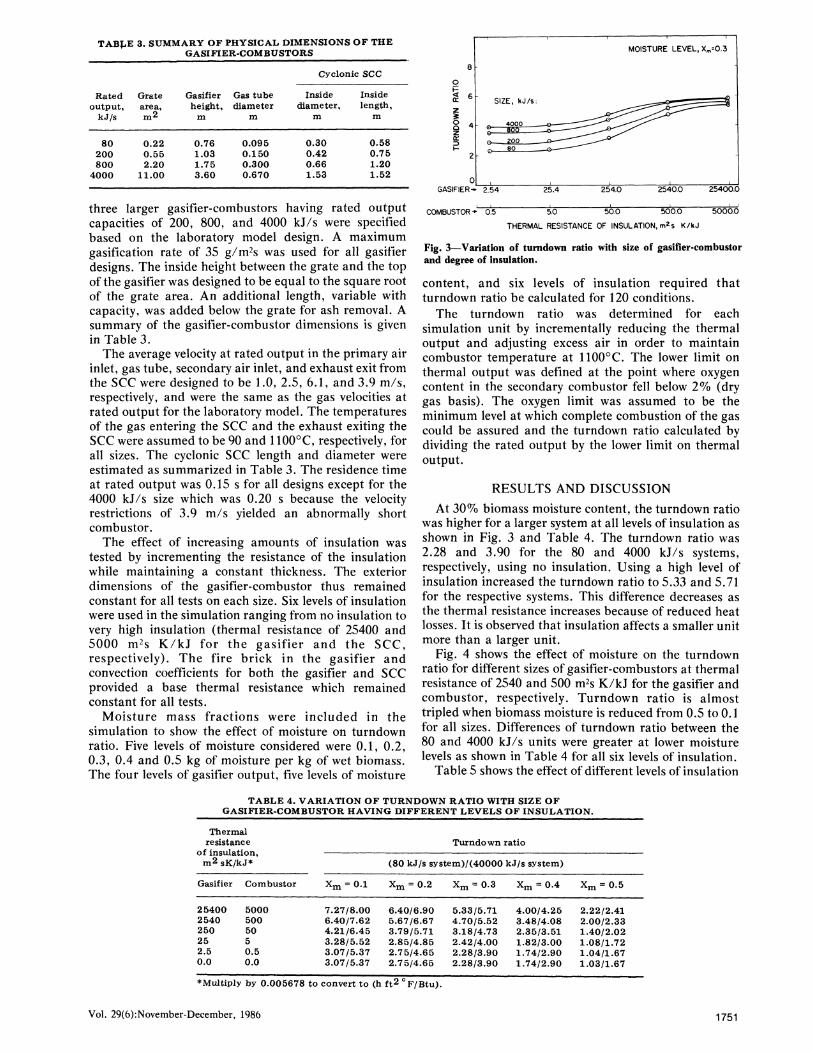
Fig. 3—Variation of turndown ratio with size of gasifier-combustor and degree of insulation.
content, and six levels of insulation required that turndown ratio be calculated for 120 conditions.
The turndown ratio was determined for each simulation unit by incrementally reducing the thermal output and adjusting excess air in order to maintain combustor temperature at 1100°C. The lower limit on thermal output was defined at the point where oxygen content in the secondary combustor fell below 2% (dry gas basis). The oxygen limit was assumed to be the minimum level at which complete combustion of the gas could be assured and the turndown ratio calculated by dividing the rated output by the lower limit on thermal output.
RESULTS AND DISCUSSION
At 30% biomass moisture content, the turndown ratio was higher for a larger system at all levels of insulation as shown in Fig. 3 and Table 4. The turndown ratio was 2.28 and 3.90 for the 80 and 4000 kJ/s systems, respectively, using no insulation. Using a high level of insulation increased the turndown ratio to 5.33 and 5.71 for the respective systems. This difference decreases as the thermal resistance increases because of reduced heat losses. It is observed that insulation affects a smaller unit more than a larger unit.
Fig. 4 shows the effect of moisture on the turndown ratio for different sizes of gasifier-combustors at thermal resistance of 2540 and 500 m s K/kJ for the gasifier and combustor, respectively. Turndown ratio is almost tripled when biomass moisture is reduced from 0.5 to 0.1 for all sizes. Differences of turndown ratio between the 80 and 4000 kJ/s units were greater at lower moisture levels as shown in Table 4 for all six levels of insulation.
Table 5 shows the effect of different levels of insulation
TABLE 4. VARIATION OF TURNDOWN RATIO WITH SIZE OF GASIFIER-COMBUSTOR HAVING DIFFERENT LEVELS OF INSULATION.
•Multiply by 0.005678 to convert to (h ft^ °F/Btu).
Vol. 29(6):November-December, 1986 1751
?6 <
^ 4 Q
z
»- 2
XrT,= MOISTURE MASS FRACTION
Xm=O.I ^
Xm;02__
xm=03
Xm=0.5
10 80 200 800
SIZE OF SYSTEM, kJ/s 4000
Fig. 4—Turndown ratio as a function of system size and biomass moisture content for thermal resistance of 2540 and 500 m^sK/kJ for the gasifier and combustor, respectively.
on heat loss from the gasifier-combustor for different size units. The calculated total amount of heat loss due to conduction, convection, and radiation was divided by AH„ to determine the fraction of heat loss. The heat loss data were calculated for units operating at the rated output and at the minimum output as defined previously. The fraction of heat loss remains almost unchanged for all systems operating at minimum output, indicating that maintaining temperature in the combustor limits the system. When operated at the rated output. Table 5 shows that fraction of heat loss is reduced by both insulation and increased size. Fig. 5 shows that the fraction of heat loss is higher for smaller
z o \-o <
CO
y 1 -< LlJ X
GASIFIE
0.15
0.13
0.11
0.09
0.07
SIZE, kJ/s:
2.54
8 0
2 0 0
8 0 0
4000
25.4 254.0 2540.0
I
25400.0
COMBUSTOR-*' 0.5 5.0 50.0 500.0 50000 THERMAL RESISTANCE OF INSULATION, m s K/kJ
Fig. 5—Effect of size and insulation on heat losses from gasifier-combustor at design output for all moisture levels.
units with low levels of insulation, and decreases with increasing size and insulation to a minimum. Heat loss can never go to zero because of radiation heat loss through the SCC opening. Radiation heat loss is not related to the level of insulation and depends primarily on the area of the combustor exit and combustor temperature.
Table 6 shows the rate (kJ/s) and proportion of heat loss from the gasifier and combustor for the six levels of insulation and two size units. The heat loss from the combustor is further divided into conduction and radiation fractions. It is observed that radiation losses are dominant for the large (4000 kJ/s) unit. For the small unit (80 kJ/s), insulation greatly alters the proportion of heat losses.
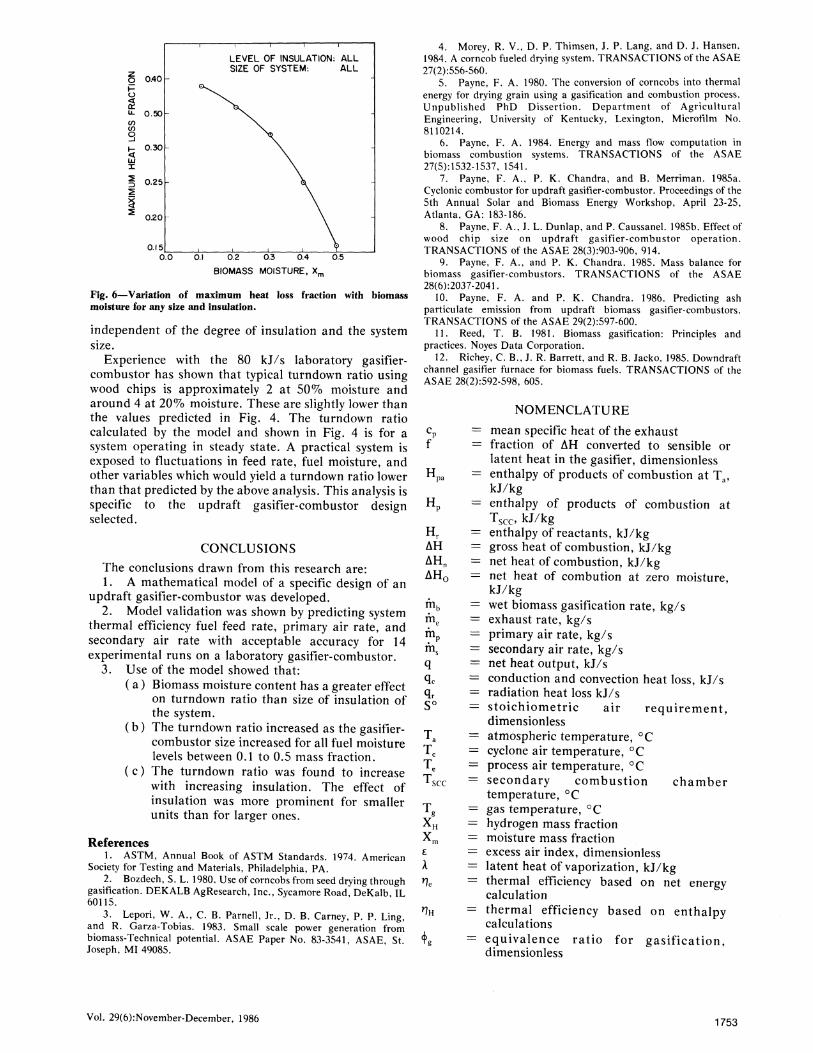
Fig. 6 shows the limiting amount of heat which can be lost from the system as a function of moisture content. This minimum point of operation is a function of the thermal limit placed on SCC temperature and is
TABLE 5. EFFECT OF SIZE AND INSULATION ON HEAT LOSS FROM GASIFIER-COMBUSTOR.
*The values at ra ted o u t p u t vary lit t le with mois ture level, f These values are t aken at mois ture mass fraction of 0 . 1 . :|:Multiply by 0 .005678 to convert t o (h ft2 ° F / B t u ) .
TABLE 6. PROPORTION AND RATE OF HEAT LOSSES FROM THE GASIFIER AND COMBUSTOR.
* These values are taken at biomass moisture of 0 . 1 . All o ther values are no t influenced by mois ture .
1752 TRANSACTIONS of the ASAE
O 0.40
< Q::
0.50
< UJ X
1 5
0.30
0.25
0.1 5|
LEVEL OF INSULATION: SIZE OF SYSTEM:
ALL ALL
0.0 0.1 0.2 0.3 0.4 0.5
BIOMASS MOISTURE, X^
Fig. 6—Variation of maximum heat loss fraction with biomass moisture for any size and insulation.
independent of the degree of insulation and the system size.
Experience with the 80 kJ/s laboratory gasifier-combustor has shown that typical turndown ratio using wood chips is approximately 2 at 50% moisture and around 4 at 20% moisture. These are slightly lower than the values predicted in Fig. 4. The turndown ratio calculated by the model and shown in Fig. 4 is for a system operating in steady state. A practical system is exposed to fluctuations in feed rate, fuel moisture, and other variables which would yield a turndown ratio lower than that predicted by the above analysis. This analysis is specific to the updraft gasifier-combustor design selected.
CONCLUSIONS
The conclusions drawn from this research are: 1. A mathematical model of a specific design of an
updraft gasifier-combustor was developed. 2. Model validation was shown by predicting system
thermal efficiency fuel feed rate, primary air rate, and secondary air rate with acceptable accuracy for 14 experimental runs on a laboratory gasifier-combustor.
3. Use of the model showed that: ( a) Biomass moisture content has a greater effect
on turndown ratio than size of insulation of the system.
(b) The turndown ratio increased as the gasifier-combustor size increased for all fuel moisture levels between 0.1 to 0.5 mass fraction.
( c ) The turndown ratio was found to increase with increasing insulation. The effect of insulation was more prominent for smaller units than for larger ones.
References 1. ASTM, Annual Book of ASTM Standards. 1974. American
Society for Testing and Materials, Philadelphia, PA. 2. Bozdech, S. L. 1980. Use of corncobs from seed drying through
gasification. DEKALB AgResearch, Inc., Sycamore Road, DeKalb, IL 60115.
3. Lepori, W. A., C. B. Parnell, Jr., D. B. Carney, P. P. Ling, and R. Garza-Tobias. 1983. Small scale power generation from biomass-Technical potential. ASAE Paper No. 83-3541, ASAE, St. Joseph, MI 49085.
4. Morey, R. V., D. P. Thimsen, J. P. Lang, and D. J. Hansen. 1984. A corncob fueled drying system. TRANSACTIONS of the ASAE 27(2):556-560.
5. Payne, F. A. 1980. The conversion of corncobs into thermal energy for drying grain using a gasification and combustion process. Unpublished PhD Dissertion. Department of Agricultural Engineering, University of Kentucky, Lexington, Microfilm No. 8110214.
6. Payne, F. A. 1984. Energy and mass flow computation in biomass combustion systems. TRANSACTIONS of the ASAE 27(5):1532-1537, 1541.
7. Payne, F. A., P. K. Chandra, and B. Merriman. 1985a. Cyclonic combustor for updraft gasifier-combustor. Proceedings of the 5th Annual Solar and Biomass Energy Workshop, April 23-25, Atlanta, GA: 183-186.
8. Payne, F. A., J. L. Dunlap, and P. Caussanel. 1985b. Effect of wood chip size on updraft gasifier-combustor operation. TRANSACTIONS of the ASAE 28(3):903-906, 914.
9. Payne, F. A., and P. K. Chandra. 1985. Mass balance for biomass gasifier-combustors. TRANSACTIONS of the ASAE 28(6):2037-2041.
10. Payne, F. A. and P. K. Chandra. 1986. Predicting ash particulate emission from updraft biomass gasifier-combustors. TRANSACTIONS of the ASAE 29(2):597-600.
11. Reed, T. B. 1981. Biomass gasification: Principles and practices. Noyes Data Corporation.
12. Richey, C. B., J. R. Barrett, and R. B. Jacko. 1985. Downdraft channel gasifier furnace for biomass fuels. TRANSACTIONS of the ASAE 28(2):592-598, 605.
NOMENCLATURE
mean specific heat of the exhaust fraction of AH converted to sensible or latent heat in the gasifier, dimensionless enthalpy of products of combustion at T^, kJ/kg enthalpy of products of combustion at
f
Hpa
Hp
H. AH AH„ AHo
q
qr
s°
Ta Te Te T
£
A
^H
i
Tscc, kJ/kg enthalpy of reactants, kJ/kg gross heat of combustion, kJ/kg net heat of combustion, kJ/kg net heat of combution at zero moisture, kJ/kg wet biomass gasification rate, kg/s exhaust rate, kg/s primary air rate, kg/s secondary air rate, kg/s net heat output, kJ/s conduction and convection heat loss, kJ/s radiation heat loss kJ/s stoichiometric air requirement, dimensionless atmospheric temperature, °C cyclone air temperature, °C process air temperature, °C secondary combustion chamber temperature, °C gas temperature, °C hydrogen mass fraction moisture mass fraction excess air index, dimensionless latent heat of vaporization, kJ/kg thermal efficiency based on net energy calculation thermal efficiency based on enthalpy calculations equivalence ratio for gasification, dimensionless


![FLEX FUEL GASIFIER SIMULATION MODEL [FFGSM]mypages.iit.edu/~abbasian/documents/ffgsm_user_manual.pdf · 6) Gasifier Tab: This tab opens the Gasifier Panel where the gasifier input](https://static.documents.pub/doc/80x56/5eb664fad746ec31aa42c957/flex-fuel-gasifier-simulation-model-ffgsm-abbasiandocumentsffgsmusermanualpdf.jpg)


