22
TWIGGS COUNTY RURAL TRANSIT DEVELOPMENT PLAN Middle Georgia Regional Development Center May 2007

TWIGGS COUNTY RURAL TRANSIT
DEVELOPMENT PLAN
Middle Georgia Regional Development Center
May 2007

2
Table of Contents
Executive Summary ............................................................................................4 Introduction .........................................................................................................4 Demographic Analysis........................................................................................5 Regional Profile ....................................................................................5 Population.............................................................................................5 Racial Makeup .....................................................................................6 Components of Population Change ......................................................7 Comparison of Population Density by County ......................................9 Employment .......................................................................................10 Commute to Work ...............................................................................11 Income Levels ....................................................................................11 Elderly.................................................................................................12 Persons with Disabilities .....................................................................12 Summary ............................................................................................12 Evaluation of Existing Services ......................................................................13 Department of Human Resources (DHR) ...........................................13 GA Department of Transportation (GDOT) Section 5311 Program.....14 Private Transportation Services..........................................................15 Goals and Objectives .......................................................................................16
Benefits of Rural Transit .....................................................................16 Overall Goal & Objectives...................................................................16
Performance Evaluation of Existing Transit Service ....................................17 Evaluation of Existing Services...........................................................17 Transit Needs Assessment .................................................................17

3
Demand Estimation and Transit Alternatives ................................................19 Demand Estimation.............................................................................19 Transit Alternatives .............................................................................19 Ride Share..........................................................................................20 Capital Improvement Plan ...............................................................................21 Recommendations and Implementation Schedule ........................................22 Short-Range Actions (Year 1) ............................................................22 Mid-Range Actions (2-3 Years)...........................................................22 Long-Range Actions (4-5 Years).........................................................22

4
TWIGGS COUNTY TRANSIT DEVELOPMENT PLAN EXECUTIVE SUMMARY The Georgia Department of Transportation (GDOT) has contracted with the Middle Georgia Regional Development Center (RDC) to assist with the preparation of a rural Transit Development Plan (TDP) for Twiggs County. Upon completion of the plan, the Twiggs County TDP will be used, along with the plans from surrounding Middle Georgia counties, to create a regional transit development plan. The primary purpose of the Twiggs County Transit Development Plan is to present transit alternatives and recommendations on how to best achieve personal transportation goals and objectives identified by the community. Introduction Providing access to transportation for the elderly and for those individuals with special needs is a critical issue for counties, and is especially acute for people in rural areas where public transportation may not be available. Day-to-day needs, such as medical care, employment, and other social services, become especially challenging to low-income families. According to a report released through the USDA, since the 1990s we have seen rural public transportation services grow because of increased federal funding through the Transportation Equity Act for the 21st Century (TEA-21) legislation, with non-metro providers offering 62 percent more passenger trips, and 60 percent more vehicles (vans and buses). However, less than 10 percent of federal funding is allocated for public transportation in rural areas. In an article in the National Association of Counties, James Davenport states, “public transportation is available in 60 percent of rural counties, with 28 percent of about 1,200 systems offering only limited service (less than 25 trips taken each year per non-car household). With access to many federal programs for the disadvantaged contingent on public transportation, rural areas without transit may be unable to address the mobility needs of the elderly, handicapped and poor.”

5
DEMOGRAPHIC ANALYSIS
Regional Profile The Middle Georgia Region is comprised of 11 counties. These include the counties of Baldwin, Bibb, Crawford, Houston, Jones, Monroe, Peach, Pulaski, Putnam, Twiggs, and Wilkinson. The current 2006 estimated total population of the Middle Georgia region is approximately 470,736 residents. Given a total land area of 3549.9 square miles, the current population density of Middle Georgia equals 133 persons per square mile. The Middle Georgia region, as a whole, is currently experiencing a growth rate of over six percent since 2000. Special planning considerations will be necessary to ensure that the cities and counties of Middle Georgia will be able to continue to meet increasing infrastructure needs and demand for community services brought about by the ongoing expansion. Socio-economic conditions will also continue to change as the area experiences additional development. Thoughtful consideration is necessary to anticipate the parameters and impacts brought about by these changes. The following table displays the compiled and predicted total population figures for the eleven Middle Georgia counties.
Population The total population of the Middle Georgia region as a whole is expected to grow at a rate of 21 percent from 2000 to 2025. While Bibb and Houston Counties will continue to constitute a significant proportion of the total population of the Middle Georgia region, Houston County is expected to outpace Bibb. Bibb County’s total population is only expected to increase 3.6 percent from 2000 to 2025. Houston County will continue to evolve as the major contributor in the region. With the total population of Houston County expected to increase 43.3 percent from 2000 to 2025, they will begin to approach the total population of Bibb County by that timeframe. Together, these two counties will continue to comprise approximately 68 percent of the total population for the Middle Georgia region.
Total Population Estimates Source: Woods & Poole, Inc. 2006
Name 1980 1990 2000 2003 2005 2006 2010 2015 2020 2025 Baldwin 34,810 39,630 44,740 45,050 45,230 45,580 46,540 47,860 49,270 50,800Bibb 150,360 150,270 153,830 154,470 154,920 155,360 155,650 156,500 157,730 159,380Crawford 7,610 9,070 12,460 12,660 12,870 13,090 13,830 14,780 15,750 16,750Houston 78,160 89,690 111,260 120,030 126,160 128,070 134,390 142,540 150,870 159,510Jones 16,680 20,800 23,700 25,520 26,840 27,200 28,400 29,950 31,540 33,200Monroe 14,670 17,210 21,860 23,340 23,780 24,130 25,290 26,770 28,300 29,870Peach 18,960 21,220 23,810 24,390 24,790 24,970 25,440 26,090 24,790 27,560Pulaski 8,960 8,150 9,600 9,740 9,740 9,810 10,000 10,260 10,540 10,850Putnam 10,360 14,270 18,860 19,480 19,830 20,070 20,850 21,870 22,920 24,010Twiggs 9,360 9,840 10,590 10,540 10,300 10,300 10,210 10,140 10,090 10,080Wilkinson 10,340 10,240 10,230 10,220 10,140 10,150 10,110 10,080 10,080 10,110Middle GA Totals 362,250 392,380 442,940 457,443 466,605 470,736 482,720 498,855 513,900 534,145
6
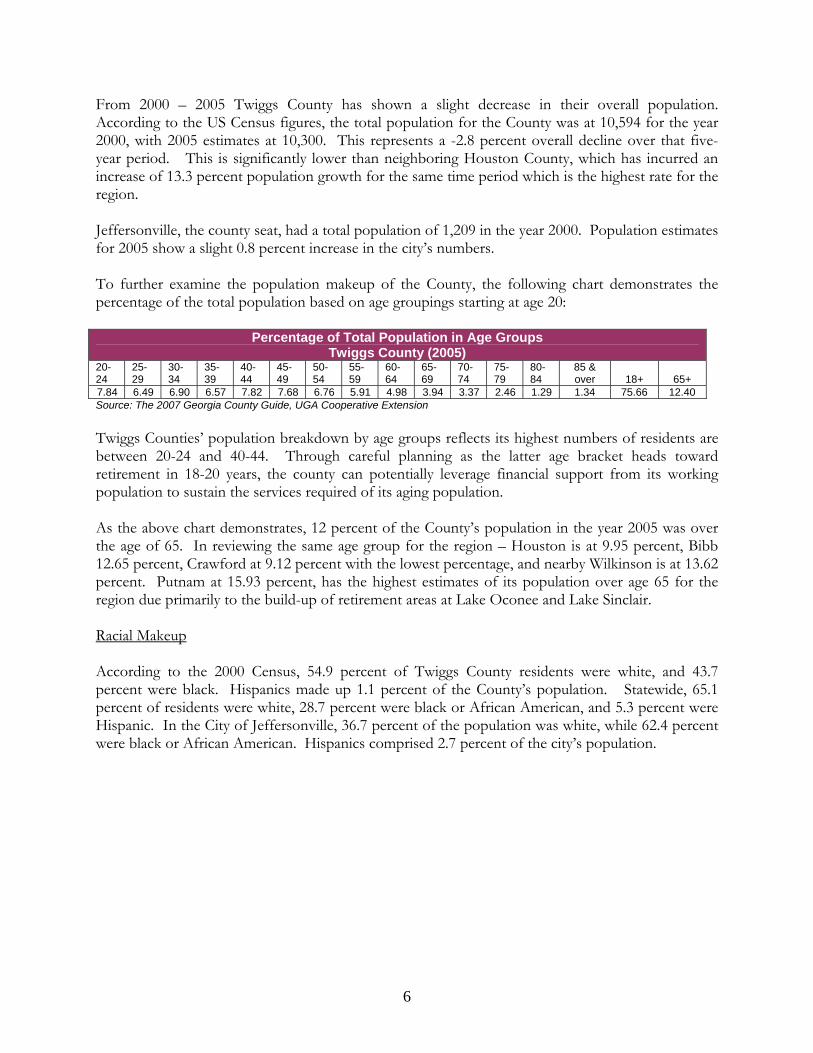
From 2000 – 2005 Twiggs County has shown a slight decrease in their overall population. According to the US Census figures, the total population for the County was at 10,594 for the year 2000, with 2005 estimates at 10,300. This represents a -2.8 percent overall decline over that five-year period. This is significantly lower than neighboring Houston County, which has incurred an increase of 13.3 percent population growth for the same time period which is the highest rate for the region. Jeffersonville, the county seat, had a total population of 1,209 in the year 2000. Population estimates for 2005 show a slight 0.8 percent increase in the city’s numbers. To further examine the population makeup of the County, the following chart demonstrates the percentage of the total population based on age groupings starting at age 20:
Percentage of Total Population in Age Groups Twiggs County (2005)
20- 24
25-29
30-34
35-39
40-44
45-49
50-54
55-59
60-64
65-69
70-74
75-79
80-84
85 & over
18+
65+
7.84 6.49 6.90 6.57 7.82 7.68 6.76 5.91 4.98 3.94 3.37 2.46 1.29 1.34 75.66 12.40 Source: The 2007 Georgia County Guide, UGA Cooperative Extension Twiggs Counties’ population breakdown by age groups reflects its highest numbers of residents are between 20-24 and 40-44. Through careful planning as the latter age bracket heads toward retirement in 18-20 years, the county can potentially leverage financial support from its working population to sustain the services required of its aging population. As the above chart demonstrates, 12 percent of the County’s population in the year 2005 was over the age of 65. In reviewing the same age group for the region – Houston is at 9.95 percent, Bibb 12.65 percent, Crawford at 9.12 percent with the lowest percentage, and nearby Wilkinson is at 13.62 percent. Putnam at 15.93 percent, has the highest estimates of its population over age 65 for the region due primarily to the build-up of retirement areas at Lake Oconee and Lake Sinclair. Racial Makeup According to the 2000 Census, 54.9 percent of Twiggs County residents were white, and 43.7 percent were black. Hispanics made up 1.1 percent of the County’s population. Statewide, 65.1 percent of residents were white, 28.7 percent were black or African American, and 5.3 percent were Hispanic. In the City of Jeffersonville, 36.7 percent of the population was white, while 62.4 percent were black or African American. Hispanics comprised 2.7 percent of the city’s population.

7
Components of Population Change Population change is comprised of: (a) net migration people moving into the region minus people moving out, and (B) natural increase – births minus deaths. Twiggs County actually experienced 100 percent of population change due to natural increase from 1980 to 1990. Conversely between 1990 and 2000, the change was due primarily from net migration. The trends in net migration experienced between 1990 and 2000 reflect an overall increase in the majority of the counties (except for Bibb and Wilkinson). The counties in the Middle Georgia region that are expected to experience the most growth (Baldwin, Crawford, Houston, Jones, Monroe, Peach, and Putnam) in the next 25 years should continue to see a large percentage of their population change derived from in-migration. Between 1990 and 2000, the percentage of population increase due to net migration in Twiggs County increased dramatically to 55.74 percent. The average percentage of population growth in the Middle Georgia region at this time had also increased dramatically to 51.29 percent from 9.30 percent between the years 1980 – 1990. 1990.
Components of Population Change from 1980-1990 Source: University of Georgia, Center for Agribusiness and Economic Development
Name Total Population Change
Population Change Due to
Natural Increase
% Change Due to Natural Increase
Population Change Due to Net Migration
% Change Due to Net Migration
Baldwin 4,844 2,521 52.04 2,323 47.96
Bibb -289 8,929 0.00 -9,218 0.00
Crawford 1,307 477 36.50 830 63.50
Houston 11,603 8,773 75.61 2,866 24.70
Jones 4,160 1,550 37.26 2,610 62.74
Monroe 2,503 780 31.16 1,723 68.84
Peach 2,038 1,460 71.64 578 28.36
Pulaski -842 110 0.00 -952 0.00
Putnam 3,842 794 20.67 3,048 79.33
Twiggs 452 634 100.00 -182 0.00
Wilkinson -140 744 0.00 -884 0.00
Middle GA Average 2,680 2,434 90.82 249 9.30

8
Between the years 2000 and 2003, the percentage of population growth due to natural increase in Twiggs County began to decrease going from 44.26 percent between 1990 and 2000 declining to zero percent. Consequently the percentage of population growth due to net migration in Twiggs County rose to 100 percent. The average for Middle Georgia during this time period reflects a 50/50 split between increases due to natural increase versus net migration with Baldwin, Bibb, and Wilkinson experiencing 100 percent of their population change due to natural increase. These percentages overall only cover a three-year time period whereas the previous statistics cover a ten-year period. When similar statistics are available for the period between 2000 and 2010, comparable population changes may be observed. The main reason that Twiggs County has experienced a dramatic increase in net migration since 2000 is the availability of cheaper land than the surrounding counties and the lure of living in a rural setting versus a congested urban setting. However, many of these residents have to commute outside Twiggs County in order to work.
Components of Population Change from 1990-2000 Source: University of Georgia, Center for Agribusiness and Economic Development
Name Total
Population Change
Population Change Due to Natural
Increase
% Change Due to Natural Increase
Population Change Due to Net Migration
% Change Due to Net Migration
Baldwin 5,170 1,991 38.51 3,179 61.49
Bibb 3,750 8,724 100.00 -4,974 0.00
Crawford 3,504 516 14.73 2,998 85.56
Houston 21,557 8,469 39.29 13,088 60.71
Jones 2,900 1,116 38.48 1,784 61.52
Monroe 4,644 886 19.08 3,758 80.92
Peach 2,479 1,543 62.24 936 37.76
Pulaski 1,480 93 6.28 1,387 93.72
Putnam 4,675 580 12.41 4,095 87.59
Twiggs 784 347 44.26 437 55.74
Wilkinson -8 556 0.00 -564 0.00
Middle GA Average 4,630 2,256 48.73 2,375 51.29

9
Comparison of Population Density by County Population density is the term that describes the number of individuals occupying an area in relation to the size of that area. The population density is derived by dividing the number of people (population) by the area they occupy (per square mile of land area). The following table depicts the population density for each of the Middle Georgia counties for the time period between 1980 and the most recent 2000 census. A significant trend, in terms of population density for Middle Georgia, is the foreseeable rise in total population density across the region. With an observed rise in total population over time, and a
Components of Population Change from 2000-2003 Source: University of Georgia, Center for Agribusiness and Economic Development
Name Total Population Change
Population Change Due to
Natural Increase% Change Due to Natural Increase
Population Change Due to Net Migration
% Change Due to Net Migration
Baldwin 253 420 100.00 -116 0.00
Bibb 400 2,787 100.00 -2,321 0.00
Crawford 58 51 87.93 27 46.55
Houston 9,669 2,752 28.46 6,834 70.68
Jones 1,833 330 18.00 1,477 80.58
Monroe 1,470 270 18.37 1,197 81.43
Peach 652 527 80.83 156 23.93
Pulaski 136 124 91.18 21 15.44
Putnam 763 196 25.69 577 75.62
Twiggs -124 54 0.00 -156 100.00
Wilkinson 47 165 100.00 -110 0.00Middle GA Average 1,378 698 50.64 690 50.05
Population Density (Persons/Square Mile) Source: Woods & Poole Economics, Inc.
Name 1980 1990 2000 % Change 1980-2000 Baldwin 134.67 153.06 173.32 28.70
Bibb 601.44 601.15 615.95 2.41
Crawford 23.41 27.78 38.60 64.89
Houston 207.42 237.96 295.46 42.45
Jones 42.36 52.81 60.09 41.86
Monroe 37.08 43.41 55.23 48.95
Peach 125.49 140.73 156.78 24.93
Pulaski 36.20 32.83 38.78 7.13
Putnam 30.07 41.40 54.84 82.37
Twiggs 25.97 27.28 29.40 13.21
Wilkinson 23.16 22.98 22.90 -1.12
Middle GA Average 117.02 125.58 140.12 19.74
10
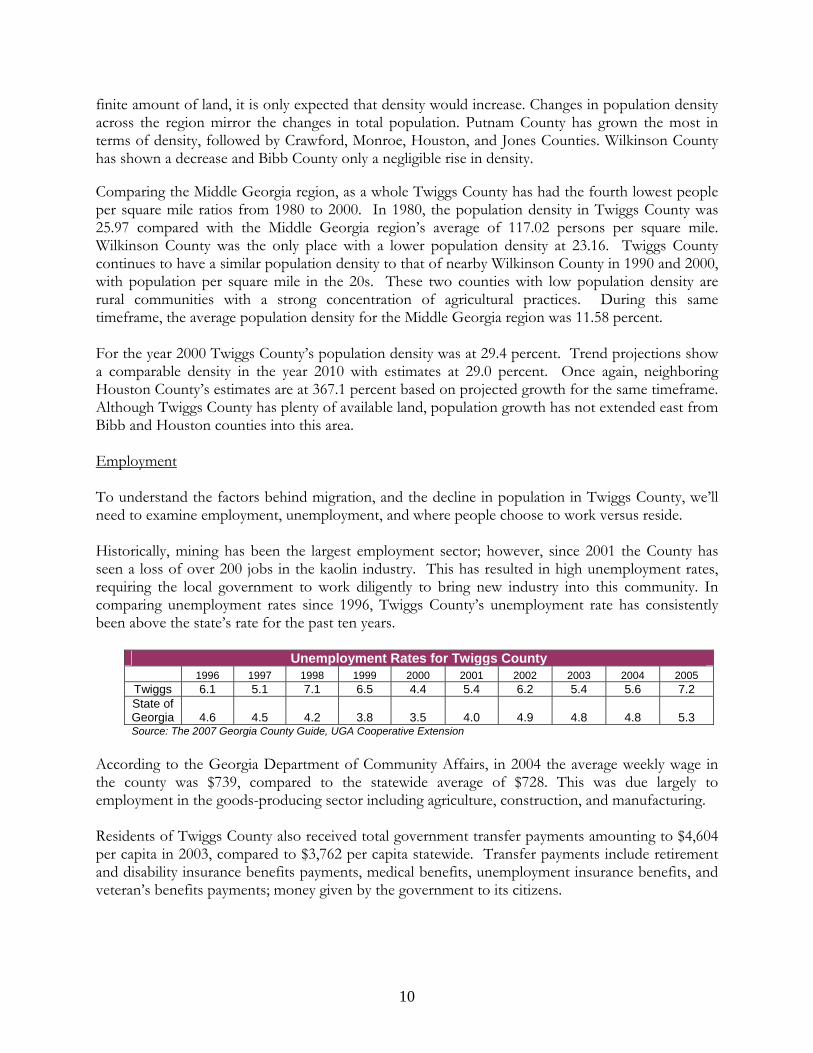
finite amount of land, it is only expected that density would increase. Changes in population density across the region mirror the changes in total population. Putnam County has grown the most in terms of density, followed by Crawford, Monroe, Houston, and Jones Counties. Wilkinson County has shown a decrease and Bibb County only a negligible rise in density. Comparing the Middle Georgia region, as a whole Twiggs County has had the fourth lowest people per square mile ratios from 1980 to 2000. In 1980, the population density in Twiggs County was 25.97 compared with the Middle Georgia region’s average of 117.02 persons per square mile. Wilkinson County was the only place with a lower population density at 23.16. Twiggs County continues to have a similar population density to that of nearby Wilkinson County in 1990 and 2000, with population per square mile in the 20s. These two counties with low population density are rural communities with a strong concentration of agricultural practices. During this same timeframe, the average population density for the Middle Georgia region was 11.58 percent. For the year 2000 Twiggs County’s population density was at 29.4 percent. Trend projections show a comparable density in the year 2010 with estimates at 29.0 percent. Once again, neighboring Houston County’s estimates are at 367.1 percent based on projected growth for the same timeframe. Although Twiggs County has plenty of available land, population growth has not extended east from Bibb and Houston counties into this area. Employment To understand the factors behind migration, and the decline in population in Twiggs County, we’ll need to examine employment, unemployment, and where people choose to work versus reside. Historically, mining has been the largest employment sector; however, since 2001 the County has seen a loss of over 200 jobs in the kaolin industry. This has resulted in high unemployment rates, requiring the local government to work diligently to bring new industry into this community. In comparing unemployment rates since 1996, Twiggs County’s unemployment rate has consistently been above the state’s rate for the past ten years.
Unemployment Rates for Twiggs County 1996 1997 1998 1999 2000 2001 2002 2003 2004 2005
Twiggs 6.1 5.1 7.1 6.5 4.4 5.4 6.2 5.4 5.6 7.2 State of Georgia 4.6 4.5 4.2 3.8 3.5 4.0 4.9 4.8 4.8 5.3 Source: The 2007 Georgia County Guide, UGA Cooperative Extension
According to the Georgia Department of Community Affairs, in 2004 the average weekly wage in the county was $739, compared to the statewide average of $728. This was due largely to employment in the goods-producing sector including agriculture, construction, and manufacturing. Residents of Twiggs County also received total government transfer payments amounting to $4,604 per capita in 2003, compared to $3,762 per capita statewide. Transfer payments include retirement and disability insurance benefits payments, medical benefits, unemployment insurance benefits, and veteran’s benefits payments; money given by the government to its citizens.

11
Commute to Work The mean travel time to work for Twiggs County residents is 29.3 minutes. This is consistent with the following chart that demonstrates 75 percent of those residents that reside in Twiggs County travel outside of County to work. According to the 2006 Robins Air Force Base Economic Impact Report, almost 100 residents of Twiggs County commute to work at the Base in nearby Houston County. With the majority of the commercial centers in nearby Bibb, Houston, and Laurens Counties, sales tax revenue is being spent beyond the County’s borders. With this loss of dollars comes the increasing dependence on local property taxes to offset that sales tax income. Income Levels The 2004 per capita income for Twiggs County is $20,415 with 16.6 percent of the population living in poverty according to the 2007 Georgia County Guide. Median household income is estimated at $31,652 for the County with nearby Houston County at $46,317. Of the 65 and older population in Twiggs County, 25.8 percent are below poverty levels as compared to 9.5 percent in Houston and 18 percent in rural Wilkinson County. A higher poverty rate translates into an increased need for ancillary services, to include transportation.
Commuting and Place of Work Source: The 2007 Georgia County Guide, UGA Cooperative Extension
County as Place of Residence County as a
Place of Work
Resident Workers
Worked IN County of Residence
Worked OUT of County of Residence
Total of All
Working in
County
Workers Coming in from
Elsewhere
Age 16+ # % # In
State
# Out of
State Total
% # # %
Baldwin 17,115 13,630 79.6 3,361 124 20.4 18,791 5,161 27.5 Bibb 63,229 54,125 85.6 8,761 343 14.4 84,921 30,796 36.3 Crawford 5,309 918 17.3 4,364 27 82.7 1,349 431 31.9 Houston 53,089 33,338 62.8 19,300 451 37.2 50,148 16,810 33.5 Jones 10,543 2,472 23.4 8,044 27 76.6 3,552 1,080 30.4 Monroe 10,316 4,116 39.9 6,083 117 60.1 6,491 2,375 36.6 Peach 9,731 4,137 42.5 5,530 64 57.5 8,553 4,416 51.6 Pulaski 3,894 2,241 57.6 1,653 0 42.4 3,393 1,152 34.0 Putnam 8,055 4,479 55.6 3,447 129 44.4 6,513 2,034 31.2 Twiggs 4,086 1,019 24.9 3,046 21 75.1 1,906 887 46.5 Wilkinson 4,060 1,933 47.6 2,112 15 52.4 3,469 1,536 44.3

12
Elderly The elderly population is a category of individuals that have a higher dependence on public transportation--especially as the ability to drive diminishes, but the will to be independent sustains the interest in social activities. This is a challenge for local officials to plan and coordinate the provision of services to meet the needs of seniors in an effective and efficient method. According to the July 2003 Georgia State of the State’s Housing: Service Delivery Region 6 produced by the Housing and Demographics Research Center at the University of Georgia, between 1990 and 2000 Twiggs County’s change in population 85 years and older increased by 33.7 percent. As the baby boomer generation ages, the potential impact on transit planning may need to be closely measured and monitored. The dependency ratio is used to approximate the number of individuals providing economic support per dependent persons. A higher dependency ratio means there are more people in the non-working age relative to persons working age. GSSH defines the dependency ratio as the number of children younger than 18 years old plus the number of elderly persons 65 years old or older, per 100 persons ages 18 to 64 years. (This dependency ratio is defined in terms of the age of the population; it has no relationship to the receipt of government aid.) With people living longer and working past the age of 65, a dependency ratio defined using the number of persons 85 years old or older may be more appropriate. In this case, Twigg’s ratio stands at 28.4; for those less than 18 and greater than 65 years old, the ratio is the third highest in the region at 62.1. A higher dependency ratio may be an indicator for increased services including medical, housing, and transit. Persons with Disabilities Those individuals with disabilities typically rely on public transit since their disabilities deny them of their ability to operate an automobile or limit their capacity to do so. Under the provisions of the Americans with Disabilities Act (ADA), transportation accommodations are defined with regards to accessibility. Public transportation may not discriminate against people with disabilities, such that a good faith effort must be made to provide accessible transit. According to the 2007 Georgia County Guide, there were a total of 2,257 aged 5 and older with a disability in Twiggs County, which represents 23.3 percent of the population. The highest percentage of individuals with disabilities is associated with the 75+ age group at 60.2 percent. A growing trend in the elderly and individuals with disabilities is for the increased need for specialized services including medical care and personal transportation. Summary In reviewing the demographics of Twiggs County, indications are that the community is faced with many variables that suggest a need for short-term and long-term transit planning. Although the County is not experiencing rapid growth like its neighboring Houston County, it has a population that is aging. In this rural community, the economy is reliant on property tax revenue. Its lower per capita and household incomes, coupled with the distance required to travel to major business centers, will require strategic action on the part of the local government to accommodate the needs of its citizens both equitably and prudently.

13
EVALUATION OF EXISTING SERVICES Twiggs County currently operates its transit services under a Coordinated Transportation System. This is defined as a system that combines all relevant personal transit needs in the County under a single transportation provider who has direct operating control. This Coordinated Transportation System is designed to work with the various human service agencies in Twiggs County to provide transportation to its clients, as well as those citizens without a means of transportation. Department of Human Resources (DHR) Coordinated Transportation System Recognizing the importance of transportation in linking people with services and opportunities, the Department of Human Resources (DHR) developed a statewide transportation system to provide quality and cost-effective transportation to eligible DHR consumers for vital services designed to enhance health, independence, and self-sufficiency. DHR includes the Division of Aging Services (DAS); Division of Family and Children Services (DFCS); the Division of Mental Health, Developmental Disabilities, and Addictive Diseases (MHDDAD); and the Division of Public Health. Coordinated Transportation Services are also provided to the Georgia Department of Labor’s Vocational Rehabilitation Services Program (DOL/VRS) and GoodWORKS Program. The Georgia Department of Human Resources contracts with Middle Georgia Regional Development Center (RDC) to administer the DHR Coordinated Transportation Program in the eleven-county region in Middle Georgia including Twiggs County. The RDC has an agreement with the Middle Georgia Community Action Agency, Inc. (MGCAA) to provide transportation services in Twiggs County for the following human service agencies/programs: Twiggs County Senior Center, Twiggs County Department of Family and Children Services, Twiggs GoodWorks, Vocational Rehab Program – DOL Milledgeville HUB, and River Edge Behavior Center. Middle Georgia Community Action Agency provides fare-based, demand response, public transportation (as a subcontractor) to any eligible resident of Twiggs County. The coordinated transportation provides a valuable service in the County such that residents are able to pre-arrange non-emergency trips to areas outside county boundaries such as Macon and Dublin. A total of four vehicles are being utilized to provide coordinated transportation in Twiggs County – two (2) Section 5311 vehicles and two (2) MGCAA vans. Eligibility criteria and essential trip priorities are outlined below for each DHR human service agency that is serviced by DHR Coordinated Transportation in Twiggs County: Division of Aging Services (DAS)
• Trips to and from Senior Centers • Trips to and from medical appointments • Trips for shopping • Trips to and from work/employment • Field trips • Trips to pay bills

14
Division of Family and Children Services (DFCS) • Trips in support of Temporary Assistance to Needy Families (TANF) recipients
(employment, job training, job search, etc.) • Trips to and from technical schools and adult education • Trips to and from work experience sites for food stamp recipients • Trips to and from medical appointments • Trips to and from mental health centers • Other non-TANF trips • Trips to and from substance abuse treatment • Trips for social services • Miscellaneous trips
Division of Mental Health/Developmental Disabilities/Addictive Diseases (MHDDAD)
• Trips to and from employment locations • Trips to and from day centers • Trips to and from mental health appointments • Trips to and from community training and integration activities • Trips to and from medical appointments • Trips for social services • Miscellaneous trips
Department of Labor Vocational Rehabilitation Services Program (DOL/VRS)
• Trips to and from school • Trips to and from employment • Trips for job search and job placement • Trips to and from job training • Trips to and from workshops and assessment sites • Miscellaneous trips
DHR seeks to provide the maximum amount of essential trips services that can be accomplished given funding levels. A priority listing of essential trips is established for each Division based on statewide input channeled through annual needs assessments. These priorities are updated annually and adjusted based on the results of the annual needs assessment. Transportation funding is committed to transit services for the highest priorities first. As funding increases or decreases, priority lists shift as to which essential trips will be performed. Georgia Department of Transportation (GDOT) Section 5311 Program The Section 5311 Program is the federal funding program administered by the Federal Transit Administration (FTA) to provide assistance for rural public transportation. Federal funds are allocated to individual states on a formula basis and can be utilized for capital assistance, operating and planning assistance, and program administration. GDOT is responsible for administrating the program in Georgia. These programs provide necessary mobility to non-urban centers in rural

15
communities. The success of this partnership has resulted in providing additional mobility to the County’s rural residents. DHR’s Coordinated Transportation System purchases trips to human service agencies from Section 5311 providers. This results in less duplication of services and efficiency through the “coordination” of the two state agencies. DHR’s regional representative for Twiggs County is in Bibb County. Actual services are provided through contracted vendors bid out in each region of the state. Contractors may come from government entities, the private sector, or not-for-profit vendors who provide the actual transportation service. Eligibility for the service is determined at the local level by the individual human service agencies, which are under the DHR umbrella within each individual county. Additionally, DHR partners with the Georgia Department of Transportation (GDOT) in order to coordinate services and provide for a more effective and efficient system of personal transportation. The GDOT Section 5311 Program, a rural transportation program, offers local areas an opportunity to provide rural public transit services and to improve access to business, commercial, and activity centers. Private Transportation Services Currently, there are no private transportation services such as taxis or van pools in Twiggs County. Magnolia Transportation based in nearby Warner Robins does provide services to Jeffersonville, but the rates are cost prohibitive to use on a regular basis. Competition in the provision of fee-based, demand response transportation has not been readily available in Middle Georgia to provide choices for those individuals who do not have their own vehicle. Macon is the only community with public mass transportation with 20 buses running regular runs through the City and Bibb County.

16
GOALS AND OBJECTIVES Benefits of Rural Transit
Public transit provides the primary link for small towns to essential services. Many residents have limited access to a motor vehicle. Without public transportation that is safe, reliable, and affordable, elderly citizens would miss important medical appointments, could not take care of their shopping needs, and would have limited social contact.
An accessible public transit system means increased mobility for all citizens. It connects people with jobs, retail establishments, educational institutions, and recreational areas. Public transportation provides independence for the elderly and disabled, which greatly improves their quality of life.
Outlining goals and objectives are integral to the planning process. As an evolution of the process for this Transit Development Plan, the TDP Steering Committee was formulated comprised of local officials, GDOT staff, MGCAA, representatives from human service agencies, and other interested parties. The Steering Committee identified the following transit goal for Twiggs County: Overall Goal: To provide the citizens of Twiggs County with equitable services for personal transportation needs. Of primary importance is also for the safe, reliable, and efficient use of resources and means to meet the needs of the clients of the Human Service Agencies and the citizens as a whole. Primary consideration is for those individuals who for whatever reasons are limited in the opportunity to provide their own means of transportation and are thus restricted in their access to the many services they need that contribute to their quality of life. Objectives:
• Ensure that transit services are available to all Twiggs County residents who have a need for personal transportation.
• Ensure transit services are provided in the most cost-effective means to ensure the County is able to maintain a high level of service to its residents.
• Provide a public forum whereby any gaps in service can be identified and quantified to ensure needs are being met.
• Continue to collaborate and develop meaningful partnerships for public transit. • Examine current agreements and financial resources to ascertain if other opportunities exist
to revenue share where possible. • Improve air quality by introducing other alternative modes of transportation – walking,
bicycling, and car pooling. • Ensure this plan supports other local plans in the community. • Support coordinated transportation to avoid the duplication of transit service. • Market and promote transit opportunities as needed.

17
PERFORMANCE EVALUATION OF EXISTING TRANSIT SERVICE Evaluation of Existing Services Under DHR’s Coordinated Transportation system, services are made available twenty-four (24) hours a day, seven (7) days per week. Core hours are Monday through Friday between 6:00 a.m. and 6:00 p.m.; however, MGCAA must provide scheduled trips beyond the core hours and days as demand warrants thus meeting the needs of DHR consumers. The following chart highlights the trip information MGCAA provided over the past three and a half years for Twiggs County residents (in the agreement with the RDC). Overall, the Twiggs Senior Center was the recipient of the majority of the trips. The County has two vehicles provided under the Section 5311 program and two vehicles under the MGCAA program that were utilized for the above listed trips. As mentioned earlier, DHR partners with GDOT to avoid a duplication of efforts and services. DHR’s Coordinated Transportation System purchases trips to human services from 5311 providers. This “coordination” increases the efficiency of services and ensures utilization of vehicles and drivers. Under the Section 5311 program, Twiggs County provided 7,975 trips in 2006; utilizing their two vehicles, 2,663 were public trips. Most of these trips were for medical appointments, shopping, paying bills, and personal needs. Since advertising for these services is primarily through word-of-mouth, most clients are able to be accommodated within a reasonable timeframe. There was an overall consensus among human service providers, representatives from GDOT and DHR, and local officials in Twiggs County that services are being provided across the County geographically covering the entire population. Transit Needs Assessment The demographics of Twiggs County indicate relatively low income levels, high poverty, and a number of residents traveling outside of the community to work. These factors lend themselves to a continuing use of public transit in order to serve the working poor. With no real commercial/retail areas in the County, community members have to travel quite a distance for most basic shopping needs. The absence of a hospital or medical center in the county also adds to the myriad of medical services residents are forced to travel to in neighboring Warner Robins or Macon.
DHR/MGCAA Trips Twiggs County
July 2003 – December 2006
Year Total 2006 12,896 2005 11,594 2004 8,274
Jul - Dec 2003 2,889

18
The Twiggs County Transit Development Plan Steering Committee expressed overall concerns with funding levels for transit programs as the County is struggling to maintain its budgetary match for the Section 5311 program. Rising gas prices, older vehicles that require higher maintenance costs, and the human service agencies that are anticipating additional client needs in Twiggs County create a challenge for local officials to sustain funding levels for the transit program. In order to maintain the coordinated transportation agreement and current service, the County strives to avoid a cost-shift of the financial burden to the riders who utilize the service.

19
DEMAND ESTIMATION AND TRANSIT ALTERNATIVES Demand Estimation Historical data from DHR’s Coordinated Transportation Service demonstrates that the majority of trips are being utilized by Senior Center clients followed by River Edge participants. According to the MGCAA, in Twiggs County less than three trips a year had to be re-scheduled due to multiple wheelchair requests at the same time. In these small communities, the regular riders know the schedule of availability and tend to make their appointments accordingly. Annually, DHR conducts a needs assessment to identify clients (unserved), the number of trips needed for new clients, and the additional trips needed for current clients. The results of the FY2006 Needs Assessment showed six new clients unserved with over 2,000 trips needed for new clients. Based on feedback from the identified human service providers and the Twiggs County TDP Steering Committee, the future demand is expected to increase with the aging population of the community. Also, since the primary marketing tool for this service is through word-of-mouth or the Resource Directory at Family Connections (communities and schools), and as more individuals learn about the service, the ridership has increased 56 percent over the past three years. Transit Alternatives In examining future needs for Twiggs County, demographic information; such as population, concentrations of disabled and the elderly, poverty, employment and household income; was analyzed. Discussions were held on alternate routes or additional areas that geographically might be unserved by current services. Finally, the Steering Committee identified where the majority of their Section 5311 trips traveled to and for what purpose. It was determined that with no large commercial shopping and retail centers nor medical facilities available in Twiggs County, the majority of trips are to Macon for everything from medical appointments, to shopping, bill paying, and personal needs. The Committee agreed clients are served from all areas of Twiggs County and was not aware of pockets of the community not able to be accommodated either under the DHR program or the Section 5311 program. In 2004, the Georgia Department of Transportation contracted with the Middle Georgia RDC to compile a sidewalk survey database for the Cities of Jeffersonville and Danville to explore pedestrian and sidewalk networks and connectivity. With Twiggs County and the Cities of Jeffersonville and Danville prepared to begin the Comprehensive Planning process in summer 2007, the results of the sidewalk survey will be utilized to identify issues and opportunities for improving and expanding bicycle and pedestrian facilities within the communities. The purpose is two-fold, first for health purposes to promote the benefits of walking, and secondly to encourage the development of more downtown shopping areas convenient to residential neighborhoods.

20
Ride Share Twiggs County has a “Ride-Share” area, a one-acre paved lot on the Macon side of the Courthouse for carpooling by local citizens into nearby areas – Dublin, Macon and Warner Robins. Twiggs County would like signage and additional funds to market this location to ensure it is utilized. The Steering Committee would like to see more flyers in common public areas, ads in the newspaper, and additional signs around town highlighting its location.

21
CAPITAL IMPROVEMENT PLAN As with most rural counties, Twiggs County budgets one year at a tine thus making capital improvements budgets projected out over a period of years very difficult and cumbersome to gauge. Twiggs County officials are supportive of the Section 5311 program, but are realistic in terms of their ability to invest in an expansion of the program due to limited local resources. The 50 percent required local share for increased operations, that would be associated with any expansion of service, would create a financial burden for the county. Even the five percent local share for vehicle procurements places a financial hardship on the county. The capital contract for one vehicle in Twiggs County was $26,400 federal share, $3,300 state, and $3,300 local share. Under the GDOT Section 5311 Program, local funding for operations is required to cover the non-federal costs. Ten percent of the public transportation operating costs must be provided from fare income or other local dollars. The remaining 90 percent of the operating cost is considered the net operating deficit. Federal funding may be provided for up to 50 percent of the net operating deficit; the remaining 50 percent (or more) must be provided from local funds. For 2006, the operating budget for Twiggs County was $44,523 federal share, and a local match of $44,523. For the 2007/08 contract the Georgia Department of Transportation is utilizing an 18-month capital improvement plan for the replacement of vehicles procured under the Section 5311 Rural Transit Plan. For Twiggs County, the capital contract for one replacement vehicle of one shuttle van with a lift is $30,240 federal, $5,670 state, and Twiggs County share of $1,890. The operating costs for this 18-month period are $73,390 for the County’s local share; Twiggs County budgeted a total of $87,930 for expenses related to the 5311 program.

22
RECOMMENDATIONS AND IMPLEMENTATION SCHEDULE Short-Range Actions (Year 1):
• Quantify unmet transit needs by using a variety of survey techniques and conducting a series of public forums.
• Define a database of client activity to measure which parts of the County utilize the transit
service, and capture the number of trips used by the general public and for what purpose (shopping, medical appointments, paying bills, employment, etc.)
• Establish a Transit Advisory/Guidance Committee to assist with the Transit Needs Survey
and provide direction and recommendations based on the survey results. The Committee would like to meet once a year to continue ongoing efforts.
Mid-Range Actions (Years 2-3)
• Develop and implement appropriate marketing strategies to make residents aware of the transit programs and services.
• Explore funding sources and alternatives to expand transit capabilities in order satisfy any
unmet needs and ensure the best use of taxpayer dollars.
Long-Range Actions (Years 4-5)
• Implement appropriate transit strategies based on the results of the Transit Needs Survey.


