101 4 Two-Dimensional Comprehensive Liquid Chromatography Luigi Mondello, Paola Dugo, Tiina Kumm, Francesco Cacciola, and Giovanni Dugo 4.1 INTRODUCTION High-performance liquid chromatography (HPLC) represents a powerful method widely applied for the separation of real-world samples in several fields. Although this methodology may often provide sufficient resolving power for the separation of target components, many matrices present a complexity that greatly exceeds the separation capacity of any single chromatographic system. Therefore, despite a careful method optimization procedure, conventional HPLC may be inade- quate when faced with truly complex samples. Moreover, peak overlapping may occur even in the case of relatively simple samples that contain components with similar properties. In such cases, the combination of more than one separation step is a convenient choice, generating a great increase in the resolving power of a chromatographic system, expanding separation space, enhancing peak capacity, and, thus, enabling the resolution of components even in highly complex matrices. The most widespread among multidimensional HPLC techniques are two-dimensional (2D) methods, in which components migrate along two imaginary axes. Figure 4.1 illustrates such a process, where five fractions of the first-dimension separation are subjected to a second-dimension separation. CONTENTS 4.1 Introduction .......................................................................................................................... 101 4.2 History .................................................................................................................................. 103 4.3 General Principles ................................................................................................................ 103 4.4 Instrumentation ..................................................................................................................... 106 4.4.1 Interface .................................................................................................................... 106 4.4.2 First Dimension ........................................................................................................ 106 4.4.3 Second Dimension .................................................................................................... 108 4.4.4 Detectors ................................................................................................................... 109 4.4.5 Data Elaboration and Software ................................................................................. 109 4.5 Method Development in LCxLC .......................................................................................... 111 4.5.1 Coupling when Problems of Solvent Incompatibility Occur .................................... 111 4.5.2 Coupling without Problems of Solvent Incompatibility ........................................... 113 4.5.3 Peak Focusing at the Head of the Secondary Column ............................................. 115 References ...................................................................................................................................... 116
Luigi Mondello, Paola Dugo, Tiina Kumm, Francesco Cacciola, and Giovanni Dugo
4.1 IntroduCtIon
High-performance liquid chromatography (HPLC) represents a powerful method widely applied for the separation of real-world samples in several fields. Although this methodology may often provide sufficient resolving power for the separation of target components, many matrices present a complexity that greatly exceeds the separation capacity of any single chromatographic system. Therefore, despite a careful method optimization procedure, conventional HPLC may be inade-quate when faced with truly complex samples. Moreover, peak overlapping may occur even in the case of relatively simple samples that contain components with similar properties. In such cases, the combination of more than one separation step is a convenient choice, generating a great increase in the resolving power of a chromatographic system, expanding separation space, enhancing peak capacity, and, thus, enabling the resolution of components even in highly complex matrices.
The most widespread among multidimensional HPLC techniques are two-dimensional (2D) methods, in which components migrate along two imaginary axes. Figure 4.1 illustrates such a process, where five fractions of the first-dimension separation are subjected to a second-dimension separation.
Contents
4.1 Introduction .......................................................................................................................... 1014.2 History .................................................................................................................................. 1034.3 General Principles ................................................................................................................ 1034.4 Instrumentation ..................................................................................................................... 106
4.4.1 Interface .................................................................................................................... 1064.4.2 First Dimension ........................................................................................................ 1064.4.3 Second Dimension .................................................................................................... 1084.4.4 Detectors ................................................................................................................... 1094.4.5 Data Elaboration and Software ................................................................................. 109
4.5 Method Development in LCxLC .......................................................................................... 1114.5.1 Coupling when Problems of Solvent Incompatibility Occur .................................... 1114.5.2 Coupling without Problems of Solvent Incompatibility ........................................... 1134.5.3 Peak Focusing at the Head of the Secondary Column ............................................. 115
If the separation mechanisms are independent, then the probability of component overlapping is quite small: components, unresolved in first separation according to one parameter, will probably be separated during the second separation. In the case where the two chromatographic separations are preceded by a solvent extraction step, the latter should be considered as a part of the multidi-mensional system, yielding a 3D system [1]. An additional dimension is also represented by a mass spectrometric detector and hence, even 4D systems are achievable.
Multidimensional HPLC analyses can be performed either off-line or on-line. In an off-line HPLC, the fractions eluted from the primary column are collected manually or by a fraction col-lector, concentrated if necessary and then reinjected into a second column. These techniques can be time consuming, operative intensive, and difficult to automate and reproduce. Furthermore, of greater importance in areas of quantitative trace analysis is the fact that off-line sample treatments can be susceptible to solute loss and contamination. However, the off-line approach is quite easy, because both analytical dimensions can be considered as two independent methods. This technique is most used when only parts of the first separation require a secondary separation. In an on-line HPLC system, the two columns are connected by means of a special interface, usually a switch-ing valve, which allows the transfer of the fractions of the first column effluent onto the second column. There are two types of on-line multidimensional liquid chromatography: heart-cutting and comprehensive. While the former enables the bidimensional analysis of specific fractions of the initial sample, the second is a more powerful approach that extends the 2D advantage to the entire matrix. The heart-cutting techniques, extensively reviewed in previous papers [2,3], are not the argument of this chapter, devoted to the comprehensive approach for the characterization of complex matrices.
It has been stated that a comprehensive 2D separation should possess the following features [4,5]:
All components in a sample mixture are subjected to two separations in which their dis-•placement depends on different factors.Equal percentages (either 100% or lower) of all sample components pass through both •columns and eventually reach the detector.Any two components separated in the first dimension must remain separated in the second •dimension.The elution profiles from both dimensions are preserved.•
The comprehensive HPLC is characterized by the following advantages if compared to the 1D mode:
1. Higher resolving power and peak capacity 2. Greater amount of information about the sample in a single analysis 3. Great potential for the identification of “unknowns” (formation of chemical class patterns
on the 2D space plane, described later)
First dimensionSe
cond
dim
ensio
n
FIGure 4.1 Schematic representation of a 2D separation.
However, this technique presents a number of challenges:
1. More thought must be given to method and instrument design 2. Incompatibility of different mobile phases can occur: immiscibility, precipitation of buffer
salts, incompatibility between the mobile phase from one column and the stationary phase of the other
3. Need for specific interfaces and software
4.2 hIstory
The origin of MD liquid chromatography lies in planar chromatography. Initially, the major 2D separations were realized using thin-layer beds, originally in the form of paper chromatography (i.e., the partition between a liquid moving by capillary action across a strip of paper impreg-nated with a second liquid). The development of paper chromatography proceeded in parallel with the development of liquid–liquid partition chromatography on columns, and in 1944, Martin and coworkers [6] discussed the possibility of different eluents in different dimensions. In the following years, a variety of hyphenated techniques were developed, until the most important planar separation, based on the use of gel electrophoresis, was reported by O’Farrell in 1975 [7]: up to 1000 proteins from a bacterial culture were separated by using isoelectric focusing in one dimension and sodium dodecylsulfonate–polyacrylamide gel electrophoresis in the second. Most developments, in the past two decades, however, have involved coupled column systems which are much more amenable to automation and more readily permit quantitative measurements. Comprehensive 2D liquid chromatography was first introduced by Erni and Frei in 1978 [8], who analyzed a complex plant extract with a SEC column as the first dimension and a reversed-phase (RP) column as the second dimension, connecting the two columns with an eight-port valve. Next, the technique was evolved and improved by Bushey and Jorgenson in 1990 [9], who used a microbore cation exchange column for the first-dimension separation and a size exclusion column (SEC) for the second-dimension separation, using an eight-port valve for transferring the first column effluent into the second. The system was applied to the separation of protein standards and serum proteins.
In the last years, the use of comprehensive liquid chromatography has been greatly increased and it has been widely used to separate and characterize various complex samples, such as biomolecules [10–15], polymers [16,17], lipids [18–21], essential oils [22], acidic and phenolic compounds [23–28], pharmaceuticals and traditional medicines [29–31], etc. Comprehensive LC has been reviewed by several authors [32–37].
4.3 General PrInCIPles
The complete separation of the compounds of interest must always be a primary goal in any chro-matographic separation. The effectiveness of a separation may be measured by the peak capacity nc, which shows the maximum number of peaks that fits side by side into the available separation space (with resolution equal to 1). It has been demonstrated that the frequency with which component peaks overlap depends upon the peak capacity [38]. High-resolution linear separation systems usu-ally generate an nc in the range of several hundreds, which is apparently enough for the separation of 100 peaks. However, to realize the maximum peak content, the peaks must be evenly spaced at their highest allowed density. In complex real-world samples, this occurs quite rarely, as the peaks tend to fall across the chromatogram in a random mode and co-elutions are observed. Therefore, the real number of components that may be isolated in most separation processes is much less than the peak capacity. Davis and Giddings [38] and Martin et al. [39] showed how peak capacity is only the maximum number of mixture constituents which a chromatographic system may resolve. Through
104 Handbook of HPLC
the statistical method of component overlap (SMO) [38], it was estimated that no more than 37% of the peak capacity is used for peak resolution. This percentage corresponds to the number of visible peaks in a chromatogram.
Real-world samples are usually characterized by a variety of chemical groups and, conse-quentially, by random peak distribution, therefore requiring a high separating power. A practical method for enhancing the peak capacity, as mentioned before, can be achieved by using multidi-mensional separations. In MD systems, the peak capacity is the sum of the peak capacities of the 1D processes:
n nc ci
i i
k
( )max ==∑
(4.1)
As mentioned above, the most common multidimensional separations are performed by using 2D systems. A considerable increase in peak capacity of the 2D system can be achieved if the whole sample is subjected on-line to two independent displacement processes (comprehensive MD separa-tion) with peak capacities of nz and ny, respectively. If the two separations have different retention mechanisms (e.g., are orthogonal to each other), the maximum peak capacity n2D of the system is approximately equal to the product of the peak capacities nz and ny [5]:
n n nz y2D ≅ ×
(4.2)
This is illustrated in Figure 4.2. The peak capacities of the two dimensions are shown as the num-ber of adjacent Gaussian profiles that can be packed into the space along the respective separation coordinates. The separation plane is divided into rectangular boxes that represent the resolution units in the 2D plane. The total peak capacity n2D is therefore approximately equal to the number of such boxes.
For example, peak capacities of 50 in both dimensions give a total peak capacity over 2000, which would require about 10 million theoretical plates in an 1D system. In reality, most of 2D systems have at least some retention correlation, and this decreases the optimum resolution and peak capacity of the system [40]. The same is caused by the additional broadening of the component zones in their migration along the second coordinate.
nx
ny
Adjacent Gaussian profiles
Adjacent Gaussian profiles
FIGure 4.2 Peak capacity in a 2D system. (From Giddings, J.C., J. High Resolut. Chromatogr. Chromatogr. Commun., 10, 319, 1987.)
The improvement in resolving power of MD chromatography is expressed also in terms of enhanced resolution. Giddings showed [1] how the contributors to the overall resolution, Rs, along the two axes, Rx and Ry , contribute to the final resolution according to
R R Rx ys ≅ +( )2 2 1 2
(4.3)
The isolation of a component from a neighboring one in a 2D system is much more probable than in a linear system, because the two displacements of the components are much less likely similar than in the case of a monodimensional separation.
Since the introduction of 2D chromatographic techniques, it has become clear that each separa-tion step should ideally provide different selectivities (orthogonal system) as this maximizes the gain in peak capacity and hence the number of chromatographically resolvable components [8,40–42]. Through orthogonality, cross-information or synentropy existing between the two dimensions is minimized, resulting in maximum peak capacity and hence, high resolution. Minimizing synen-tropy maximizes the efficiency and the information content, generating a key for complex sample analysis [43–45].
The separation in both dimensions should be controlled by parameters that are relatively inde-pendent, otherwise the system has little effectiveness. With two independent migrations, we have two parameters characterizing each component peak emerging from a secondary column, the first identified by the position in the sequence of cuts from the first column and the second measured by the retention time in the secondary column. However, if the cut from the primary column is very broad (large Δtr), then the component peaks emerging from the secondary column will have consid-erable uncertainty in the retention time for their migration through the primary column. The greater the “cut,” the greater the degradation of the quality of information relative to each component’s identity. Broader cuts also incorporate more components and increase the likelihood of interference in subsequent separation steps. Component separation will improve with decreasing Δtr. Murphy et al. have stated that to obtain a high 2D resolution, each peak in the first dimension should be sampled at least three to four times [46].
The effectiveness of a 2D separation, where a first-dimension peak is unraveled in three compounds (a, b, and c), is illustrated in Figure 4.3, where the number of samplings over the first-dimension peak is 3.
For quantitation, the areas of all peaks relative to the same compound must be summed, as illustrated in Figure 4.4.
Cut 1 Cut 2Conventional LC +
modulation
2D separation
LC–LCCut 3
c a
a
a cc
b
b b
b
ac
Cut 1 Cut 2 Cut 3
FIGure 4.3 Effects of modulation on three co-eluting peaks.
106 Handbook of HPLC
4.4 InstruMentatIon
Various comprehensive HPLC systems have been developed and proven to be effective both for the separation of complex sample components and in the resolution of a number of practical problems. In fact, the very different selectivities of the various LC modes enable the analysis of complex mixtures with minimal sample preparation. However, comprehensive HPLC techniques are com-plicated by the operational aspects of transferring effectively from one operation step to another, by data acquisition and interpretation issues. Therefore, careful method optimization and several related practical aspects should be considered.
4.4.1 interface
A typical comprehensive 2D HPLC separation is attained through the connection of two HPLC systems by means of an interface (usually a high-pressure switching valve), which entraps specific quantities of first-dimension eluate, and directs them onto a secondary column. An ideal inter-face should retain the primary column eluate and reintroduce it as a sharp pulse when desired. Figures 4.5 through 4.7 show different types of multiport switching valves used in comprehensive LC approaches: an example of connecting two 6-port valves (Figure 4.5), an 8-port valve (Figure 4.5), and a 10-port valve (Figure 4.7). The valve is generally equipped with two sample loops (shown in the figures) or trapping columns.
In the previously described approaches, different HPLC pumps are used in the two dimensions. A different approach, where the flow from one single pump was splitted and introduced to one first- and two second-dimension columns, was used by Venkatramani and coworkers [45,47]. In this approach, a 12-port valve equipped with three loops [45] or with three guard columns [47] was used as an interface (Figure 4.8).
4.4.2 first diMension
Most of the frequently used comprehensive 2D LC systems employ a microbore HPLC column in the first dimension, operated at low flow rate, both under isocratic and gradient conditions. This enables the transfer of fractions of small volume via the multiport valve equipped with two identical
sample loops, into the second-dimension column. The loop volume usually corresponds to the mobile-phase quantity per modulation time eluting from the first-dimension column.
Such a system has been used for the comprehensive 2D chromatography of proteins [9,14], synthetic polymers [16], oxygen heterocyclic fraction of cold-pressed citrus oils [22,29], carote-noids [39], triglycerides in fats and oils [18–21], pharmaceuticals [29], and acidic and phenolic compounds [27,28].
When a conventional column is used as a first-dimensional column, two different LCxLC con-figurations may be used, with either two trapping columns or fast secondary columns in parallel rather than storage loops. In the former setup, each fraction from the first dimension is trapped alternatively on one of the two trapping columns. At the same time, the compounds retained from the previous fraction on the other trapping column are back-flushed onto the analytical column for second-dimension analysis. In the latter setup, a fraction from the first-dimension column is trapped alternatively at the head of one of the two columns during the loading step in a one-column
FIGure 4.5 Example of coupling of two 6-port two-position switching valves. (Reprinted with permission from Tanaka, N. et al., Anal. Chem., 76, 1273, 2004. Copyright 2004, American Chemical Society.)
focusing mode, meanwhile in the other column the solutes, transferred in the previous cut from the first-dimension column, are separated.
These two approaches were investigated by several groups for the analysis of peptides and proteins [10,11,15,49–55] and for the analysis of phenolic antioxidants [24–26].
4.4.3 second diMension
The second-dimension separation of the transferred fraction must be completed before the injection of the successive fraction eluting from the first column and should be fast enough to permit that 3–4 fractions must be taken across the width of each first-dimension peak to avoid serious loss of
FIGure 4.8 12-Port two-position switching valve. (Reprinted with permission from Venkatramani, C.J. and Zelechonok, Y., Anal. Chem., 75, 3484, 2003. Copyright 2003, American Chemical Society.)
information in the 2D separation due to under-sampling of first-dimension peaks, in agreement with Murphy et al. [46]. This consideration further emphasizes the need for very fast second-dimension separations in 2D LC. Moreover, short analysis times are particularly useful in the case of biological or other unstable samples, which risk to degrade or change with time. Second-dimension fast separa-tion can be achieved in different ways. A common approach is to use short monolithic columns at high flow rates. The high permeability and good mass-transfer characteristics of monolithic stationary phases make them ideally suited for use in the second dimension because they enable to work at high flow rates without loss of resolution, thus reducing the second-dimension analysis time. Moreover, successive gradient cycles with a very brief equilibration time can be performed [19–22,24,26,56].
Another approach to improve the effective speed of the second-dimension separation is the use of an array of second-dimension columns, used in parallel [10,11,15,24,25,45,47,52–55,57], especially with 1.5 μm i.d. pellicular columns [10,15,54,55,58]. This approach is more complicated due to the fact that different columns are rarely identical, and it is critical to achieve precision of retention time in consecutive second-dimension separation containing the same analyte peak.
Another possibility to speed up the 2D analysis time is to use high temperatures, as described by Stoll et al. [13,59]: the decreased viscosity of the eluent at high temperature (100°C–120°C) allowed a much higher linear velocity through the column to allow faster gradient development without sig-nificant loss in efficiency. They demonstrated that excellent repeatability of retention times could be obtained using narrow-bore (2.1 mm i.d.), wide-pore (300 Å), and 3 μm carbon-coated zirconia col-umns at high temperature (100°C) with only one-column volume of flushing with the initial eluent. Regarding analyte thermal stability, with very short residence times (10–20 s) at high temperature, very little detectable degradation of either small, labile organic analytes or proteins occurred.
4.4.4 detectors
Most of the traditional HPLC detectors can be applied to LCxLC analyses; the choice of the detectors used in comprehensive HPLC setup depends above all on the nature of the analyzed com-pounds and the LC mode used. Usually, only one detector is installed after the second-dimension column, while monitoring of the first-dimension separation can be performed during the optimiza-tion of the method. Detectors for microHPLC can be necessary if microbore columns are used. Operating the second dimension in fast mode results in narrow peaks, which require fast detectors that permit a high data acquisition rate to ensure a proper reconstruction of the second-dimension chromatograms.
PDA detectors can be operated at rapid data acquisition rates (up to 40 Hz) and are the most com-mon used. Quadrupole MS systems are capable of supplying sufficient spectra for peak. For reliable component assignment, of course, TOF-MS systems possessing higher scan speed can be used.
Most of the detectors permit peak recognition but provide no structural information, which can be particularly important for identification of unknown compounds. From this point of view, the spectro-metric detectors, specifically mass spectrometer and photodiode array detectors, add a third dimension to the multidimensional system and give additional information useful in components identification.
4.4.5 data elaBoration and software
LCxLC analyses produce great amounts of data, which contain retention information obtained from each separation. Such data is of high level of complexity and requires considerable data elaboration power and more sophisticated software which permit to collect all the information available and to compare the samples. Considering the overwhelming amount of data generated per run, the data handling may result in a real analytical problem, due to the fact that currently the area of dedicated software for LCxLC is poorly developed. In fact, dedicated software for LCxLC data processing is not yet commercially available as a complete package and therefore most of analysts use their own, homemade software.
110 Handbook of HPLC
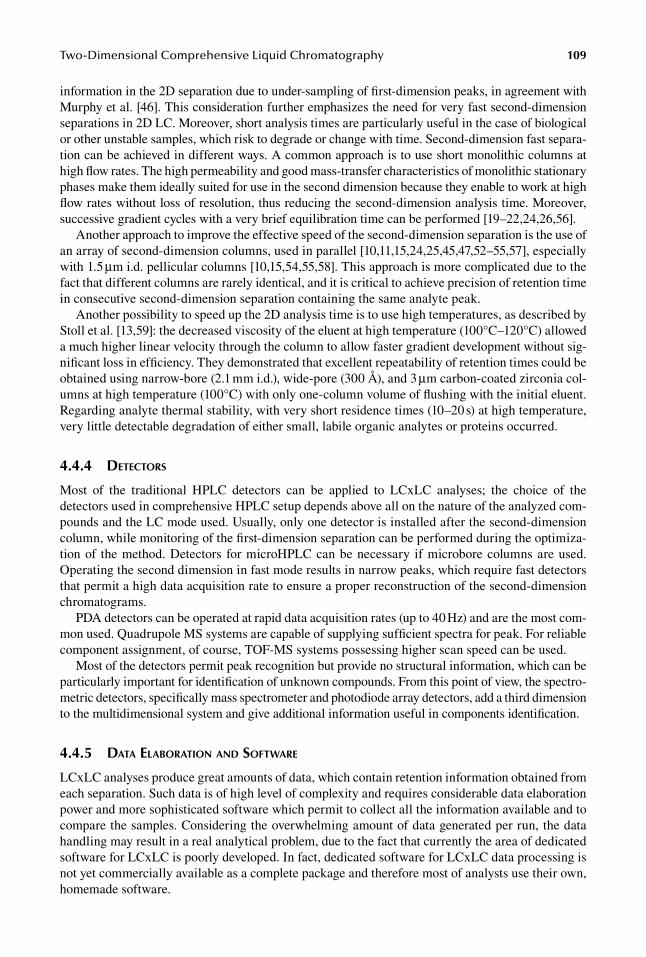
With regard to comprehensive LC data elaboration, the acquired data is commonly elaborated with dedicated software that constructs a matrix with rows corresponding to the duration of the second-dimension analysis and data columns covering all successive second-dimension chro-matograms. The result is a bidimensional contour plot, where each component is represented as an ellipse-shaped peak, defined by double-axis retention time coordinates. When creating a 3D chromatogram, a third axis by means of relative intensity is added. The colour and dimension of each peak is related to the quantity of each compound present in the sample. Figure 4.9 illustrates an example of data elaboration in comprehensive LC.
From the 3D plot, the individual first- or second-dimension separation can be deconvoluted, precluding the need for a 1D detector, which introduces band broadening into the system.
Different chemometric methods in a number of ways have been used to handle data generated by comprehensive analyses. The most relevant is the use of chemometric methods to reduce the dimensionality of the analyte and to allow comparison between different samples. This is usually done using principal component analysis (PCA), from which the entire multidimensional data set can be visualized as one point relating to the two principal components of the data. Points falling in particular regions of the plot can be categorized according to some standard training set, and differences between samples can be easily investigated.
Chemometric methods can greatly increase the number of analyzable peaks in MDLC; in particular, the generalized rank annihilation method (GRAM) can quantify overlapping peaks by deconvoluting the combined signal to those of each dimension. Standards with precise retention time are required, and there must be some resolution in both dimensions [60,61].
Peak integration and quantification can be performed by summing the areas of individual second-dimension peaks belonging to one analyte peak, which are integrated using conventional integration algorithms. It is, of course, necessary to confirm the identity of each peak prior to area summation.
Raw 2D chromatogram(at second column outlet)
2. Transformation
1. Modulation3D plot
Contour plot
2D color plot
12
3
3. Visualization
Seco
nd dimen
sion
Second dim
ension
Second-dimension chromatogramsstacked side by side
First dimension
First dimension
1D chromatogram(at first column outlet)
12 3
FIGure 4.9 Data elaboration in comprehensive chromatography. (Reprinted from Dalluge, J. et al., J. Chromatogr. A, 1000, 69, 2003. Copyright 2003. With permission from Elsevier.)
In the development and optimization of a comprehensive LCxLC method, many parameters have to be taken in account in order to accomplish successful separations. First of all, selectivity of the columns used in the two dimensions must be different to get maximum gain in peak capacity of the 2D system. For the experimental setup, column dimensions and stationary phases, particle sizes, mobile-phase compositions, flow rates, and second-dimension injection volumes should be carefully selected. The main challenges are related to the efficient coupling of columns and the preservation of mobile phase/column compatibility.
Most of the frequently used comprehensive HPLC are operated in a continuous mode, which means that the time of the second-dimension analysis corresponds to the transfer time of a fraction from the first into the second dimension. The total analysis time will be the product of the second-dimension analysis time and the total number of fractions injected onto the secondary column.
Comprehensive 2D HPLC can be also operated under stop-flow mode. In this case, after trans-ferring a desired fraction volume onto the secondary column, the flow of the mobile phase in the first dimension is stopped and the fraction analyzed in the second dimension. When the separation is finished, the mobile-phase flow in the first dimension is switched on and the whole procedure is repeated again for the analysis of all the transferred fractions. The disadvantage of this procedure is the long analysis time, while the advantage can be that the second-dimension column can give higher plate numbers if compared to the continuous approach [23].
4.5.1 coupling wHen proBleMs of solvent incoMpatiBility occur
LC techniques are characterized by a wider variety of separation mechanisms with truly different selectivities. As such, the number of theoretically achievable orthogonal combinations is high. It must be considered, though, that the combination of certain LC mode types can present difficulties if not impossibilities due to mobile-phase immiscibilities, precipitation of buffer salts, 1D mobile phase–2D stationary phase incompatibility. In comprehensive 2D LC, when selecting mobile phase for each dimension, compatibility should be considered. Generally, mobile phases used in RPxRP, RPxIEC, SECxRP, SECxNP are compatible. However, problems may occur if the mobile phases in the first and in the second dimension have great difference in viscosity. It is more difficult to combine NP and RP modes due to mobile-phase immiscibility.
If a large volume of an incompatible eluent is transferred from the first to the secondary column, broadened and distorted peaks can be obtained, and the solvent plug from the first chromatographic dimension can considerably alter the selectivity of the second dimension. If solvent incompatibility is unavoidable, the first-dimension eluate isolation and suitable solvent changeover can be performed. However, this can be complicated due to the need of extra equipment, increased maintenance, and thus longer sample treatment time. Literature reports two approaches used to overcome this problem in multidimensional heart-cutting LC. Sonnenfeld et al. [62] used a system in which the fraction of interest were transferred from the first (normal phase (NP)) column to a packed precolumn, and the NP eluent was removed by passage of on inert gas and vacuum. Once the solvent was removed, the precolumn was desorbed using a RP eluent and transferred to the second (RP) analytical column. Later on, Takeuchi et al. [63] used a microcolumn in the first dimension and a conventional-size column in the second dimension to interface NP and RP separations. Due to the reduced peak vol-ume generated by the use of microcolumns, solvent removal was not required. This approach offers several advantages [3,58]:
The small column i.d. helps to ensure a minimum of dilution and provides flow rates that •are compatible with the sample volume for the secondary column.The dead volumes of the system are minimized.•There is no need for a pre-concentration step at the head of the secondary column.•
112 Handbook of HPLC
The low flow rate in the microbore column ensures sample volumes compatible with the secondary conventional column and permits the injection of a small volume onto the secondary column, mak-ing the transfer of incompatible solvents possible without peak shape deterioration or resolution losses [63]. The possible disadvantage could be the lower sample capacity of microbore LC col-umns. However, in LCxLC, a sensitivity enhancement can be obtained if the formation of com-pressed solute bands at the head of the secondary column is achieved during the transfer from the first to the second dimension. Moreover, a larger volume can be injected into the first-dimension microcolumn, used as a highly efficient pre-separation step, and a limited decrease in efficiency due to a large injection volume can be tolerated.
The combination of normal (silica) and reversed (C18) phase HPLC in a comprehensive 2D LC system was used for the first time for the analysis of alcohol ethoxylates [64]; the NP separation was run using aqueous solvents, so the mobile phases used in the two dimensions were miscible, resulting in the easy injection of the entire first-dimension effluent onto the second-dimension column.
The first fully comprehensive coupling of NP and RP, where the previously described difficulties related to solvents immiscibility were overcome, was developed by Dugo et al. and applied to the analyses of oxygen heterocyclic components of lemon essential oils [22]. Based on the configuration described in this work, other applications were developed for the analysis of carotenoids in citrus samples [48], citrus fruit extracts [29], pharmaceutical products [29], and triglycerides in fats and
FIGure 4.10 NPxRP LC contour plot for linseed oil TAGs. Comprehensive 2D silver ion–RPLC separation of the triglyceride fraction of linseed oil. First-dimension column: Ag-column (150 × 1 mm i.d., 5 μm dp); flow rate 11 μL/min; gradient elution using n-hex/ACN 99.3:0.7 (A) and n-hex/ACN 99.1:0.9 (B). Second-dimension column: monolithic C18 (100 × 4.6 mm i.d.); flow rate 4 mL/min; gradient elution using acetonitrile (A) and isopropanol (B); injection: 2 μL. Interface: 10-port valve equipped with two 20 μL sample loops. Detection was by using APCI-MS. S = stearic, O = oleic, P = palmitic, L = linoleic, Ln = linolenic. (Reprinted from Dugo, P. et al., J. Chromatogr. A, 1112, 269, 2006. Copyright 2006. With permission from Elsevier.)
oils [19–21]. Figure 4.10 shows an example of comprehensive NPxRP separation of a high number of triglycerides present in linseed oil.
Drawbacks that may occur working with incompatible solvents in the two dimensions may be system peaks which originate from the solvent incompatibility, hence reducing the available chro-matographic separation space in the second dimension. When operating the second dimension at high flow rate, a solvent bump due to the poor mixing of the solvents in the sample loop was observed [29]. Both solvent peaks and “bump” are very reproducible over the run, so these factors can be accounted for if a blank run is performed and the 2D contour plot can be constructed after background subtraction.
4.5.2 coupling witHout proBleMs of solvent incoMpatiBility
In order to obtain 2D RPxRP separations with high degree of orthogonality, an accurate selection of RP columns, temperature, and mobile-phase composition are required. Adequate difference in selec-tivity can be obtained either by employing columns of analogous selectivity and different mobile phases or columns of different selectivity and analogous mobile phase. Ikegami et al. demonstrated that 2D HPLC systems employing equal C18 stationary phases with different organic modifiers in mobile phases for each dimension could produce large peak capacity for compounds with a large range of polarity [65]. Aromatic amines and non-amines were analyzed in comprehensive LC operat-ing on both dimensions under comparable RP conditions [45]. In this case, the orthogonal separation was achieved by tuning the operating parameters, such as mobile-phase strength, temperature, and buffer strength, in conjunction with different secondary columns (ODS-AQ/ODS monolith, ODS/amino, ODS/cyano). On the other hand, various stationary phases, including polar-RP ether-linked phenyl phase with polar endcapping [66], PEG phase bonded on silica [23], or zirconium dioxide with deposited carbon layer [24,25], provide significant differences in selectivities with respect to C18 phases bonded on silica. Recently, 2D RPxRP separations by using various combination of silica-based columns in the two dimensions have been reported for the analysis of drugs and degradation products [67]. Figure 4.11 shows an example of comprehensive RPxRP separation of a mixture of phenolic and flavone standards, obtained using different stationary phases in the two dimensions.
Two-dimensional IECxRP setups by using an ion exchange column by means of salt gradient in the first dimension and an RP column in the second dimension have been extensively employed for
A25
913 26
8
6187 12
105 3
15228
4
1
16
3130
1129
20 212227
1419
24
Seco
nd d
imen
sion
(min
)
First dimension (10–1 min)
FIGure 4.11 RPxRP LC separation of a mixture of phenolic antioxidant and flavonoid standards. First-dimension: phenyl column (50 × 3.9 mm i.d., 5 mm dp); flow rate 0.3 mL/min; gradient program using water and ACN; injection: 20 μL. Second-dimension: monolithic C18 column (100 × 4.6 mm i.d.); flow rate 2 mL/min; gradient program using water and ACN. Detection was by UV–vis at 280 nm. Interface: two C18 columns (30 × 4.6 mm i.d., 2.5 mm dp) mounted on a 10-ports valve. (Reprinted from Cacciola, F. et al., J. Chromatogr. A, 1149, 73, 2007. Copyright 2007. With permission from Elsevier.)
114 Handbook of HPLC
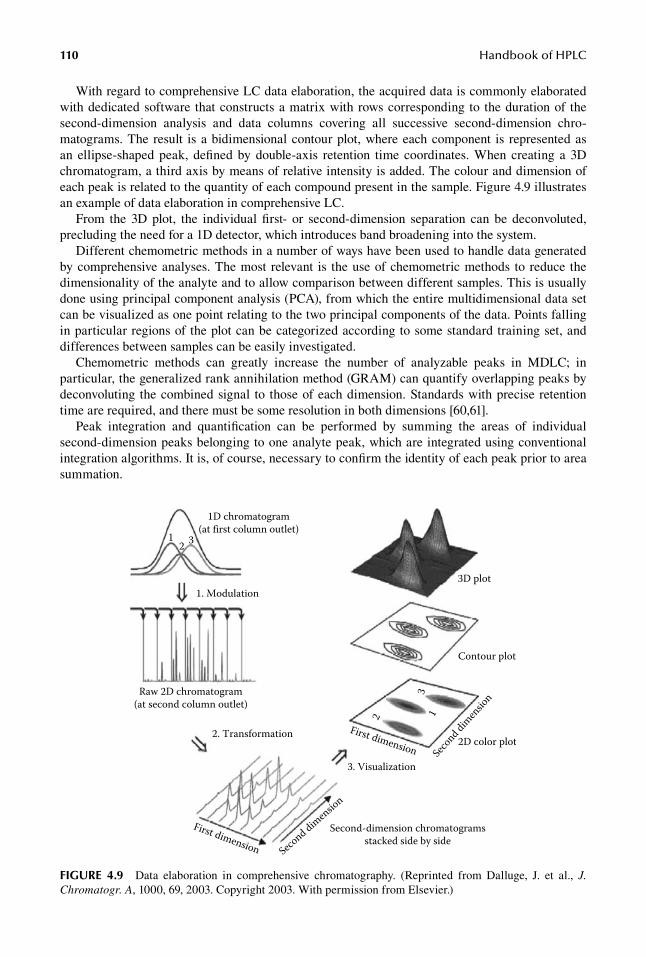
separation of proteins, peptide fragments, and other biopolymers. Combination of RP LC in the sec-ond dimension and pH gradients for protein separation according to their pI’s in the first dimension seems to be a promising new 2D technique as potential alternative to 2D CE in proteomic research, because it is fast and can be easily automatized [49–51]. The resolving power of this technique is shown in Figure 4.12, which reports a comprehensive strong cation-exchange x RP chromatogram of a tryptic digest from bovine serum albumin (BSA).
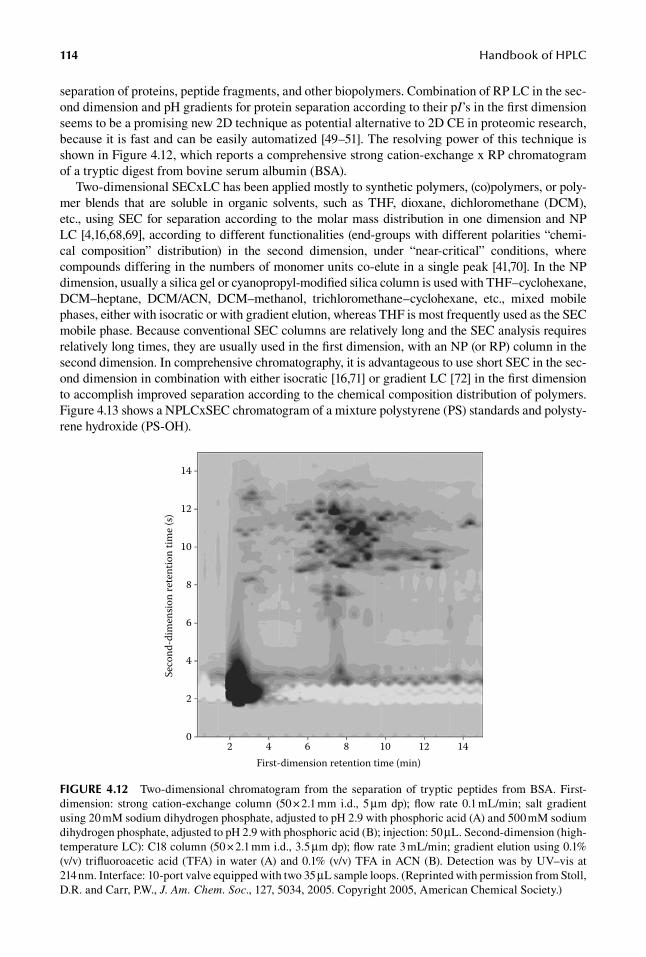
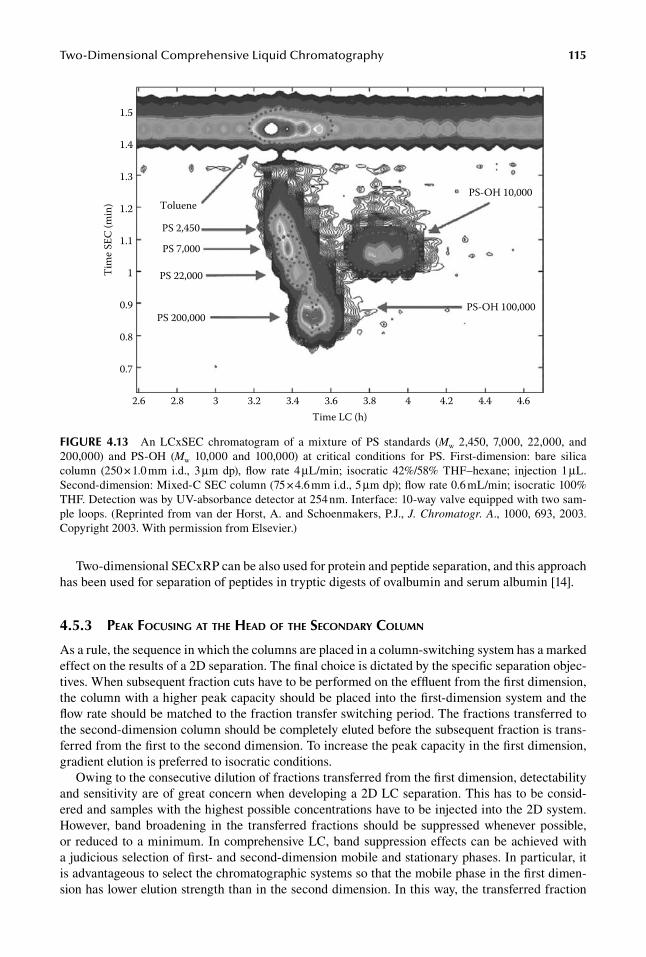
Two-dimensional SECxLC has been applied mostly to synthetic polymers, (co)polymers, or poly-mer blends that are soluble in organic solvents, such as THF, dioxane, dichloromethane (DCM), etc., using SEC for separation according to the molar mass distribution in one dimension and NP LC [4,16,68,69], according to different functionalities (end-groups with different polarities “chemi-cal composition” distribution) in the second dimension, under “near-critical” conditions, where compounds differing in the numbers of monomer units co-elute in a single peak [41,70]. In the NP dimension, usually a silica gel or cyanopropyl-modified silica column is used with THF–cyclohexane, DCM–heptane, DCM/ACN, DCM–methanol, trichloromethane–cyclohexane, etc., mixed mobile phases, either with isocratic or with gradient elution, whereas THF is most frequently used as the SEC mobile phase. Because conventional SEC columns are relatively long and the SEC analysis requires relatively long times, they are usually used in the first dimension, with an NP (or RP) column in the second dimension. In comprehensive chromatography, it is advantageous to use short SEC in the sec-ond dimension in combination with either isocratic [16,71] or gradient LC [72] in the first dimension to accomplish improved separation according to the chemical composition distribution of polymers. Figure 4.13 shows a NPLCxSEC chromatogram of a mixture polystyrene (PS) standards and polysty-rene hydroxide (PS-OH).
2 4 6 8First-dimension retention time (min)
Seco
nd-d
imen
sion
rete
ntio
n tim
e (s)
0
2
4
6
8
10
12
14
10 12 14
FIGure 4.12 Two-dimensional chromatogram from the separation of tryptic peptides from BSA. First-dimension: strong cation-exchange column (50 × 2.1 mm i.d., 5 μm dp); flow rate 0.1 mL/min; salt gradient using 20 mM sodium dihydrogen phosphate, adjusted to pH 2.9 with phosphoric acid (A) and 500 mM sodium dihydrogen phosphate, adjusted to pH 2.9 with phosphoric acid (B); injection: 50 μL. Second-dimension (high-temperature LC): C18 column (50 × 2.1 mm i.d., 3.5 μm dp); flow rate 3 mL/min; gradient elution using 0.1% (v/v) trifluoroacetic acid (TFA) in water (A) and 0.1% (v/v) TFA in ACN (B). Detection was by UV–vis at 214 nm. Interface: 10-port valve equipped with two 35 μL sample loops. (Reprinted with permission from Stoll, D.R. and Carr, P.W., J. Am. Chem. Soc., 127, 5034, 2005. Copyright 2005, American Chemical Society.)
Two-dimensional SECxRP can be also used for protein and peptide separation, and this approach has been used for separation of peptides in tryptic digests of ovalbumin and serum albumin [14].
4.5.3 peak focusing at tHe Head of tHe secondary coluMn
As a rule, the sequence in which the columns are placed in a column-switching system has a marked effect on the results of a 2D separation. The final choice is dictated by the specific separation objec-tives. When subsequent fraction cuts have to be performed on the effluent from the first dimension, the column with a higher peak capacity should be placed into the first-dimension system and the flow rate should be matched to the fraction transfer switching period. The fractions transferred to the second-dimension column should be completely eluted before the subsequent fraction is trans-ferred from the first to the second dimension. To increase the peak capacity in the first dimension, gradient elution is preferred to isocratic conditions.
Owing to the consecutive dilution of fractions transferred from the first dimension, detectability and sensitivity are of great concern when developing a 2D LC separation. This has to be consid-ered and samples with the highest possible concentrations have to be injected into the 2D system. However, band broadening in the transferred fractions should be suppressed whenever possible, or reduced to a minimum. In comprehensive LC, band suppression effects can be achieved with a judicious selection of first- and second-dimension mobile and stationary phases. In particular, it is advantageous to select the chromatographic systems so that the mobile phase in the first dimen-sion has lower elution strength than in the second dimension. In this way, the transferred fraction
2.6
0.7
0.8
0.9
1
1.1
1.2
1.3
1.4
1.5
2.8 3 3.2 3.4 3.6Time LC (h)
PS 200,000PS-OH 100,000
PS-OH 10,000
PS 22,000
PS 7,000
PS 2,450
Toluene
Tim
e SEC
(min
)
3.8 4 4.2 4.4 4.6
FIGure 4.13 An LCxSEC chromatogram of a mixture of PS standards (Mw 2,450, 7,000, 22,000, and 200,000) and PS-OH (Mw 10,000 and 100,000) at critical conditions for PS. First-dimension: bare silica column (250 × 1.0 mm i.d., 3 μm dp), flow rate 4 μL/min; isocratic 42%/58% THF–hexane; injection 1 μL. Second-dimension: Mixed-C SEC column (75 × 4.6 mm i.d., 5 μm dp); flow rate 0.6 mL/min; isocratic 100% THF. Detection was by UV-absorbance detector at 254 nm. Interface: 10-way valve equipped with two sam-ple loops. (Reprinted from van der Horst, A. and Schoenmakers, P.J., J. Chromatogr. A., 1000, 693, 2003. Copyright 2003. With permission from Elsevier.)
116 Handbook of HPLC
is concentrated (focused) at the head of the secondary column, obtaining the “modulation” effect [4,73]. Focusing is better achieved if the second dimension is operated under gradient elution, because even lower eluent strength can be used during the transfer of the fraction [59].
In NPxRP LC, mobile phase used in the first-dimension NP–LC separation is always stronger than the mobile phase at the head of the RP-secondary column [74,75]. However, it was demon-strated that the use of microcolumns in the first dimension operated at a high flow rate and a mono-lithic column in the second dimension operated at high flow rate in gradient mode can overcome problems of immiscibility of mobile phase. In particular, the use of a low percentage of strong solvent in the first step gradient of the 2D improves the chromatographic performance because of improved peak focusing.
reFerenCes
1. J.C. Giddings, High Resolut. Chromatogr. Chromatogr. Commun. 10, 319–323, 1987. 2. C. Corradini, Coupled-column liquid chromatography, in Multidimensional Chromatography,
L. Mondello, C. Lewis, K.D. Bartle (Eds.) John Wiley & Sons, Chichester, U.K., 2001, pp. 109–129. 3. H.J. Cortes, J. Chromatogr. 626, 3–23, 1992. 4. P. Schoenmakers, P. Marriott, J. Beens, LC–GC Eur. 16, 335–338, 2003. 5. J.C. Giddings, Anal. Chem. 56, 1258A–1270A, 1984. 6. R. Consden, A.H. Gordon, A.J.P. Martin, Biochem. J. 38, 224–232, 1944. 7. P.H. O’Farrell, J. Biol. Chem. 250, 4007–4021, 1975. 8. F. Erni, R.W. Frei, J. Chromatogr. 149, 561–569, 1978. 9. M. Bushey, J.W. Jorgenson, Anal. Chem. 62, 161–167, 1990. 10. K. Wagner, K. Racaityte, K.K. Unger, T. Miliotis, L.E. Edholm, R. Bischoff, G. Marko-Varga,
J. Chromatogr. A 893, 293–305, 2000. 11. G.J. Opiteck, J.W. Jorgenson, R.J. Anderegg, Anal. Chem. 69 2283–2291, 1997. 12. L.A. Holland, J.W. Jorgenson, Anal. Chem. 67, 3275–3283, 1995. 13. D.R. Stoll, P.W. Carr, J. Am. Chem. Soc. 127, 5034–5035, 2005. 14. G.J. Opiteck, K.C. Lewis, J.W. Jorgenson, R.J. Anderegg, Anal. Chem. 69, 1518–1524, 1997. 15. G.J. Opiteck, S.M. Ramirez, J.W. Jorgenson, M.A. Moseley III, Anal. Biochem. 258, 349–361, 1998. 16. A. van der Horst, P.J. Schoenmakers, J. Chromatogr. A 1000, 693–709, 2003. 17. K. Im, Y. Kim, T. Chang, K. Lee, N. Choi, J. Chromatogr. A 1103, 235–242, 2006. 18. H. Nakashima, Y. Hirata, K. Jinno, P. Sandra, A.J. Rackstraw (Eds.), Proceedings of the 22nd International
Symposium on Capillary Chromatography, Gifu, Japan, Naxos Software Solutions, M. Schaefer, Scriesheim, Germany, 1999.
19. L. Mondello, P.Q. Tranchida, V. Stanek, P. Jandera, G. Dugo, P. Dugo, J. Chromatogr. A 1086, 91–98, 2005.
20. P. Dugo, T. Kumm, M.L. Crupi, A. Cotroneo, L. Mondello, J. Chromatogr. A 1112, 269–275, 2006. 21. P. Dugo, T. Kumm, B. Chiofalo, A. Cotroneo, L. Mondello, J. Sep. Sci. 29, 1146–1154, 2006. 22. P. Dugo, O. Favoino, R. Luppino, G. Dugo, L. Mondello, Anal. Chem. 76, 2525–2530, 2004. 23. E. Blahová, P. Jandera, F. Cacciola, L. Mondello, J. Sep. Sci. 29, 555–566, 2006. 24. F. Cacciola, P. Jandera, E. Blahová, L. Mondello, J. Sep. Sci. 29, 2500–2513, 2006. 25. F. Cacciola, P. Jandera, L. Mondello, J. Sep. Sci. 30, 462–474, 2007. 26. F. Cacciola, P. Jandera, Z. Hajdú, P. Cesla, L. Mondello, J. Chromatogr. A 1149, 73, 2007. 27. J. Pól, B. Hohnová, M. Jussila, T. Hyötyläinen, J. Chromatogr. A 1130, 64–71, 2006. 28. M. Kivilompolo, T. Hyötyläinen, J. Chromatogr. A 1145, 155–164, 2007. 29. I. François, A. de Villiers, P. Sandra, J. Sep. Sci. 29, 492–498, 2006. 30. X. Chen, L. Kong, X. Su, H. Fu, J. Ni, R. Zhao, H. Zou, J. Chromatogr. A 1040, 169–178, 2004. 31. L. Hu, X. Chen, L. Kong, X. Su, M. Ye, H. Zou, J. Chromatogr. A 1092, 191–198, 2005. 32. Z. Liu, M. L. Lee, J. Micro Sep. 12, 241–254, 2000. 33. P.Q. Tranchida, P. Dugo, G. Dugo, L. Mondello, J. Chromatogr. A 1054, 3–16, 2004. 34. T. Stroink, M.C. Ortiz, A. Bult, H. Lingeman, G.J. de Long, W.J.M. Underberg, J. Chromatogr. B 817,
37. P.Q. Tranchida, P. Donato, P. Dugo, G. Dugo, L. Mondello, Trends in Anal. Chem. 26(3), 191–205, 2007.
38. J.M. Davis, J.C. Giddings, Anal. Chem. 55, 418–424, 1983. 39. M. Martin, D.P. Herman, G. Guiochon, Anal. Chem. 58, 2200–2207, 1983. 40. P.J. Slonecker, X. Li, T.H. Ridgway, J.G. Dorsey, Anal. Chem. 68, 682–689, 1996. 41. J.C. Giddings, J. Chromatogr. A 703, 3–15, 1995. 42. Z. Liu, D.G. Patterson Jr., M.L. Lee, Anal. Chem. 67, 3840–3485, 1995. 43. M.M. Bushey, J.W. Jorgenson, Anal. Chem. 62, 978–984, 1990. 44. C.J. Venkatramani, X. Jingzhen, J.B. Phillips, Anal. Chem. 68, 1486–1492, 1996. 45. C.J. Venkatramani, Y. Zelechonok, Anal. Chem. 75, 3484–3494, 2003. 46. R.E. Murphy, M.R. Schure, J.P. Foley, Anal. Chem. 70, 1585–1594, 1998. 47. C.J. Venkatramani, A. Patel, J. Sep. Sci. 29, 510–518, 2006. 48. P. Dugo, V. Škeríková, T. Kumm, A. Trozzi, P. Jandera, L. Mondello, Anal. Chem. 78,
7743–7750, 2006. 49. T. Greibrokk, M. Pepaj, E. Lundanes, T. Andersen, K. Novotna, LC–GC Eur. 18, 355–360, 2005. 50. M. Pepaj, S.R. Wilson, K. Novotna, E. Lundanes, T. Greibrokk, J. Chromatogr. A 1120, 132–141, 2006. 51. M. Pepaj, A. Holm, B. Fleckenstein, E. Lundanes, T. Greibrokk, J. Sep. Sci. 29, 519–529, 2006. 52. H. Liu, S.J. Berger, A.B. Chakraborty, R.S. Plumb, S.A. Cohen, J. Chromatogr. A 782, 267–289, 2002. 53. K. Wagner, T. Miliotis, G. Marko-Varga, R. Bischoff, K.K. Unger, Anal. Chem. 74, 809–820, 2002. 54. E. Machtejevas, H. John, K. Wagner, L. Standker, G. Marko-Varga, W. Forssmann, R. Bischoff,
K.K. Unger, J. Chromatogr. B 803, 121–130, 2004. 55. K.K. Unger, K. Racaityte, K. Wagner, T. Miliotis, L.E. Edholm, R. Bischoff, G. Marko-Varga, J. High
Resolut. Chromatogr. 23, 259–265, 2000. 56. N. Tanaka, H. Kobayashi, N. Ishizuka, H. Minatuchi, K. Nakanishi, K. Hosoya, T. Ikegami, J. Chromatogr.
A 965, 35–49, 2002. 57. O.P. Haefliger, Anal. Chem. 75, 371–378, 2003. 58. A.P. Köhne, T. Welsch, J. Chromatogr. A 845, 463–469, 1999. 59. D.R. Stoll, J.D. Cohen, P.W. Carr, J. Chromatogr. A 1122, 123–137, 2006. 60. C.G. Fraga, B.J. Prazen, R.E. Synovec, Anal. Chem. 73, 5833–5840, 2001. 61. G.M. Gross, B.J. Prazen, R.E. Synovec, Anal. Chim. Acta 490, 197–210, 2003. 62. W.J. Sonnenfeld, W.H. Zoller, W.E. Maj, S.A. Wise, Anal. Chem. 54, 723–727, 1984. 63. T. Takeuchi, M. Asai, H. Haraguchi, D. Ishii, J. Chromatogr. 499, 549–556, 1990. 64. R.E. Murphy, M.R. Schure, J.P. Foley, Anal. Chem. 70, 4353–4360, 1998. 65. T. Ikegami, T. Hara, H. Kimura, H. Kobayashi, K. Hosoya, K. Cabrera, N. Tanaka, J. Chromatogr. A
1106, 112–117, 2006. 66. T.J. Whelan, M.J. Gray, P.J. Slonecker, R.A. Shalliker, M.A. Wilson, J. Chromatogr. A 1097,
148–156, 2005. 67. J. Pellet, P. Lukulay, Y. Mao, W. Bowen, R. Reed, M. Ma, R.C. Munger, J.W. Dolan, L. Wrisley,
K. Medwig, N.P. Toltl, C.C. Chan, M. Skibic, K. Biswas, K.A. Wells, L.R. Snyder, J. Chromatogr. A 1101, 122–135, 2006.
68. T. Chang, Adv. Polym. Sci. 163, 1–60, 2003. 69. H. Pasch, Adv. Polym. Sci. 150, 1–66, 2000. 70. L.R. Snyder, J.W. Dolan, Adv. Chromatogr. 38, 115–187, 1998. 71. X. Jiang, A. van der Horst, V. Lima, P.J. Schoenmakers, J. Chromatogr. A 1076, 51–61, 2005. 72. S.J. Kok, T. Hankmeier, P.J. Schoenmakers, J. Chromatogr. A 1098, 104–110, 2005. 73. P. Marriott, R. Shellie, TRAC—Trends Anal. Chem. 21, 573–583, 2002. 74. N.E. Hoffman, S.-L. Pan, A.M. Rustum, J. Chromatogr. 465, 189–200, 1989. 75. P. Dugo, M. del Mar Ramírez Fernández, A. Cotroneo, G. Dugo, L. Mondello, J. Chromatogr. Sci. 44,