TWO FACTORS INFLUENCING THE SERUM CALCIUM AND INORGANIC PHOSPHATE OF THE RABBIT I. THE INFLUENCE OF DIET II. DIURNAL VARIATION BY ERXEST F. DUPRfi AND EUGENIA SEMEONOFF (Prow the Department of Physiology, University of Edinburgh, Edinburgh, Scotland) (Received for publication, July 5, 1931) The extensive use of the rabbit as an experimental animal, and the wide range of the normal level of serum calcium and in- organic phosphate as found by various workers and ourselves, have led us to investigate the usefulness of this animal for calcium and phosphorus investigations. A careful search of the available literature revealed several possible explanations; e.g., differences due to sex, seasonal variation, age, environment, hemorrhage, and diet. As our experiments will show, the differences attributed to sex, seasonal variation, age, environment, and hemorrhage are of no great significance compared to those due to diet. Technique The ear of the rabbit from which blood was to be drawn was shaved and cleaned with ether. The superficial vessels were dilated by warming near an ordinary electric lamp for 2 or 3 min- utes, then rubbed gently with benzene or xylene. The benzene or xylene was carefully removed by wiping. A diagonal incision was made in one of the marginal veins and the blood allowed to drop directly into a clean, dry test-tube. About 5 cc. of blood were collected. The method used for inorganic phosphorus determinations was that of Briggs (1). The sulfite and hydroquinone solutions were made up together. 1 cc. of serum was used for each de- termination. 341 by guest on July 14, 2018 http://www.jbc.org/ Downloaded from
Transcript
TWO FACTORS INFLUENCING THE SERUM CALCIUM AND INORGANIC PHOSPHATE OF THE RABBIT
I. THE INFLUENCE OF DIET
II. DIURNAL VARIATION
BY ERXEST F. DUPRfi AND EUGENIA SEMEONOFF
(Prow the Department of Physiology, University of Edinburgh, Edinburgh, Scotland)
(Received for publication, July 5, 1931)
The extensive use of the rabbit as an experimental animal, and the wide range of the normal level of serum calcium and in- organic phosphate as found by various workers and ourselves, have led us to investigate the usefulness of this animal for calcium and phosphorus investigations.
A careful search of the available literature revealed several possible explanations; e.g., differences due to sex, seasonal variation, age, environment, hemorrhage, and diet. As our experiments will show, the differences attributed to sex, seasonal variation, age, environment, and hemorrhage are of no great significance compared to those due to diet.
Technique
The ear of the rabbit from which blood was to be drawn was shaved and cleaned with ether. The superficial vessels were dilated by warming near an ordinary electric lamp for 2 or 3 min- utes, then rubbed gently with benzene or xylene. The benzene or xylene was carefully removed by wiping. A diagonal incision was made in one of the marginal veins and the blood allowed to drop directly into a clean, dry test-tube. About 5 cc. of blood were collected.
The method used for inorganic phosphorus determinations was that of Briggs (1). The sulfite and hydroquinone solutions were made up together. 1 cc. of serum was used for each de- termination.
The method of calcium estimation used was that of Kramer and Tisdall as modified by Clark and Collip (2). 1 cc. of serum was used. After addition of the oxalate the serum was allowed t’o stand overnight to allow sufficient time for complete precipitation. The precipitate was washed once with 2 cc. of 2 per cent ammonia water. The first pink color lasting for 30 seconds with vigorous shaking was taken as the end-point in the permanganate titration. The titrations were made against time, 90 seconds being allowed as the maximum.
EXPERIMENTAL
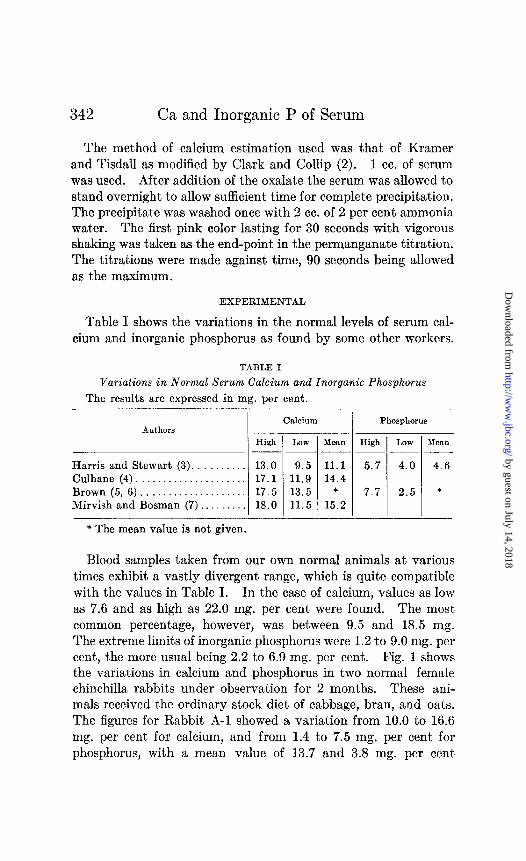
Table I shows the variations in the normal levels of serum cal- cium and inorganic phosphorus as found by some other workers.
TABLE I
Variations in Normal Serum Calcium and Inorganic Phosphorus
Blood samples taken from our own normal animals at various times exhibit a vastly divergent range, which is quite compatible with t,he values in Table I. In the case of calcium, values as low as 7.6 and as high as 22.0 mg. per cent were found. The most common percentage, however, was between 9.5 and 18.5 mg. The extreme limits of inorganic phosphorus were 1.2 to 9.0 mg. per cent, the more usual being 2.2 to 6.9 mg. per cent. Fig. 1 shows the variations in calcium and phosphorus in two normal female chinchilla rabbits under observation for 2 months. These ani- mals received the ordinary stock diet of cabbage, bran, and oat’s The figures for Rabbit A-l showed a variation from 10.0 to 16.6 mg. per cent for calcium, and from 1.4 to 7.5 mg. per cent for phosphorus, with a mean value of 13.7 and 3.8 mg. per cent
respectively. For Rabbit A-2 the values ranged between 9.4 and 15.8 mg. per cent for calcium, and between 2.5 and 8.5 mg. per cent for phosphorus, the mean values being 13.3 and 5.8 mg. per cent respectively. Fig. 1 also shows definitely that a rise in calcium is accompanied by a simultaneous fall in inorganic phos-
24 27 March 9 II 16 18 20 24 FIG. 1. Random variations in the level of serum Ca and P in two normal
female chinchilla rabbits (Rabbits A-l and A-2) during an interval of 6 weeks. The similarity between the changes shown by the two animals points to some external cause affecting them both. The composition of the diet varied in an uncontrolled manner from day to day, but was the same for the two animals on any one day.
phorus, and vice versa. This tendency to an inverse variat.ion has also been pointed out by Brown (5).
I. Influence of Diet
The most obvious physiological explanation of fluctuations of serum calcium and phosphorus is diet.
Culhane (S), states that “the consumption of cabbage pro- duces a definite, though temporary, rise in serum calcium of rab-
bits.” At the 4th hour after cabbage feeding there was an average rise of 1.2 mg. per cent from the initial value. At the 6th hour the calcium returned to normal. Although this is not a dramatic change in itself, it is definitely significant. At the end of the 2nd hour, however, there is a fall of 0.98 mg. per cent, which is almost
i L ---. .-
--A p
A;:0 22 25 28 3OMay4 7 A? 16 1!9 2f
FIG. 2. Effect of a change from a diet of bran and oats (April 20 to May 7) to a diet of cabbage (May 7 to 21) on the serum Ca and P levels of a female chinchilla rabbit.
as great a change as the rise of 1.22 mg. per cent at the 4th hour. For this Culhane offers no explanation.
Kapsinow and Underhill (9) conclude that as a result of their study “it is impossible to stat,e that cabbage has a definite calcium- raising substance.”
To show the effect of diet we have subjected a series of rabbits to a systematic and simple dietary. The first group of rabbits (see Fig. 1) was fed for 2 months on the ordinary stock diet of mixed bran and oats and cabbage. During this period they showed a mean value of 13.5 mg. per cent for calcium and 4.8 mg. per cent for inorganic phosphorus, with variations in calcium from
I$,/6 /8 20 22 25 27 30 2$ 6 8
FIG. 3. Effect of a change from a diet of cabbage (April 14 to 25) to a diet of bran and oats (April 25 to May 8) on the serum Ca and P levels of a female chinchilla rabbit.
9.4 to 16.0 and in phosphorus from 1.4 to 8.5 mg. per cent. Al- though the average values for calcium and phosphorus concentra- tions are approximately those given as the normal by others, the wide fluctuations from this level have still to be explained. We decided that this was due to the fact that on some days the rabbits received only bran and oats, and on other days only cabbage.
We t’hen segregated the animals, feeding one group solely upon cabbage and the other upon a mixture of bran and 0ats.l
Figs. 2 and 3 show the results from a typical rabbit of each group. Rabbits fed on bran and oats exhibit a tendency towards a low calcium and a high phosphorus level, but even on this
two i6 19 21 22 25 27 28 Fro. 4. Rapid alternations between a cabbage diet and one of bran and
oats. Note the rise in serum Ca level when food is withheld after a period of bran and oats feeding.
constant diet there is still a slight fluctuation. Rabbits fed on cabbage exhibit a tendency towards a high calcium and a low phosphorus level, with a fluctuation even more marked than in those fed on bran and oats. Reversing the diets brought about
1 We are aware that bran and oats are not a perfect diet, but we observed no ill effects during the course of our experimenk.
the expected effects; i.e., the low calcium level due to bran and oats was raised, while the high level due to cabbage fell. The in- organic phosphorus also shows a correspondingly marked change. Fig. 2 shows that when the diet of bran and oats is changed to one of cabbage there is a marked rise in 6 hours of 4.2 mg. per cent in calcium, and a fall of 3.3 mg. per cent in phosphorus. Con- tinued feeding of cabbage produced a further rise in calcium and
14-
/ - --w--w
1
/ \
//
/\ -- -& /’ P
2- ------J
o- June 19 22 25 27 28
FIG. 5. A further example of frequent alternations between a cabbage diet and one of bran and oats. Note that withholding of food after a period of cabbage feeding results in a fall in serum Ca level.
fall in ‘phosphorus concentrations. 12.2 and 7.5 mg. per cent were the averages for the serum calcium and phosphorus during the interval of bran feeding. The ranges during this period were 11.4 to 12.8 and 6.6 to 9.0 mg. per cent respectively. During the period of feeding cabbage the average values for calcium and phosphorus were 18.3 and 3.0 mg. per cent respectively, with a range of 16.0 to 21.8 mg. per cent for calcium and of 2.4 to 3.6 mg. per cent for phosphorus.
We attach significance to the fact that the blood samples taken 12 hours after the last feed of bran and oats show a fairly constant calcium level. The three instances cited in Fig. 2 show values of 12.6, 12.8, and 12.8 mg. per cent.
Figs. 4 and 5 show still more dramatic responses to changes of diet. Feeding cabbage definitely produces a high concent,ration of serum calcium and a fall in that of inorganic phosphate, while a change to bran and oats produces the reverse effect. With- holding food for 12 to 24 hours from animals previously fed upon bran and oats results in a rise in calcium concentration and a fall in phosphorus. This indicates that the phosphorus level had been exceeded and the calcium level correspondingly depressed, and that the true normals are now being established. In our opinion bran and oats also have a specific effect on serum calcium and phosphorus, but in the opposite direction t.o that of cabbage. When food is withheld from animals previously fed on cabbage, there is a definite fall in calcium concentration with a correspond- ing rise in phosphorus. This indicates t,hat in this case, also. during fasting the serum calcium and phosphorus tend to establish their normal equilibrium.
DISCUSSION
In our opinion the essential factor causing fluctuation in the concentration of serum calcium and phosphorus is diet. In an endeavor to ascert’ain the direct cause of these changes we have had to eliminate, as insignificant, many factors put forward in previous works. As we have shown in the above experiments the magnitude of the immediate fluctuations caused by diet overshadows changes at,tributed to the other factors.
The question of the advisability of using rabbits for experiments on calcium and phosphorus in the blood serum has to be considered in the light of the above facts. In an experiment which is ex- pected to raise the blood calcium, we suggest that the animal should be kept on a diet which will give a low initial calcium value; e.g., bran and oats. It would be essential to keep the animal on such a diet for 2 or 3 days and then to fast it for 18 hours prior to, and during the experiment. This of course is possible only for short term experiments. For experiments covering a period of more than 2 days this procedure would be incompatible wit.h
normal body metabolism, and therefore we consider the rabbit an unsuitable animal for such experiment.s. The withholding of food for 18 hours prior to the experiment is necessary to allow the calcium and phosphorus to establish an equilibrium. As we have shown above, a diet of bran and oats raises the phosphorus to such a high level that this may be the influencing factor in keep- ing the calcium out of the blood stream. Although we have not investigated the fate of the calcium on this diet, it is reason- able to assume that the calcium is stored in the body tissues, as is indicated by the slight but consistent rise occurring after 12 to 24 hours fast’ing (cf. Figs 2 and 4).
II. Diurnal Variation
In the first part of this paper we have shown that diet is the principal factor causing fluctuations in the normal serum calcium
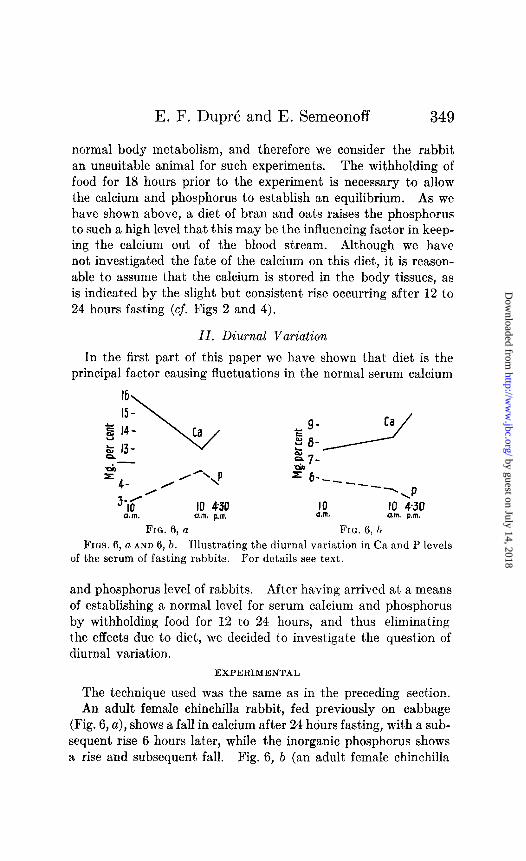
FIG. 6, u FIG. 6, b
FIGS. 6, a AND 6, b. Illustrating the diurnal variation in Ca and P levels of the serum of fasting rabbits. For details see text.
and phosphorus level of rabbits. Aft’er having arrived at a means of est,ablishing a normal level for serum calcium and phosphorus by withholding food for 12 to 24 hours, and thus eliminating t’he effects due to diet, we decided to investigate the question of diurnal variation.
EXPERIMENTAL
The technique used was the same as in the preceding section. An adult female chinchilla rabbit,, fed previously on cabbage
(Fig. 6, a), shows a fall in calcium after 24 hours fasting, with a sub- sequent rise 6 hours later, while the inorganic phosphorus shows a rise and subsequent fall. Fig. 6, b (an adult female chinchilla
rabbit, previously fed on bran and oats) shows after 24 hours fasting a slight rise in calcium and a fall in inorganic phosphorus. 6 hours later there was a further slight rise and fall in calcium and phosphorus respectively.
Such a subsequent rise has been attributed by Charles (10) to the effect of a second bleeding. On the other hand, Kapsinow and Underhill (9) state that there is a fall in calcium due to bleed- ing. From the result of our experiments, we are of the same opin- ion as Culhane (8) and Mirvish and Bosman (7), who report that repeated withdrawal of blood from a rabbit has no connection with the blood calcium level.
The second slight rise in calcium and fall in phosphorus is quite significant of a diurnal variation, rather than the effect of bleed-
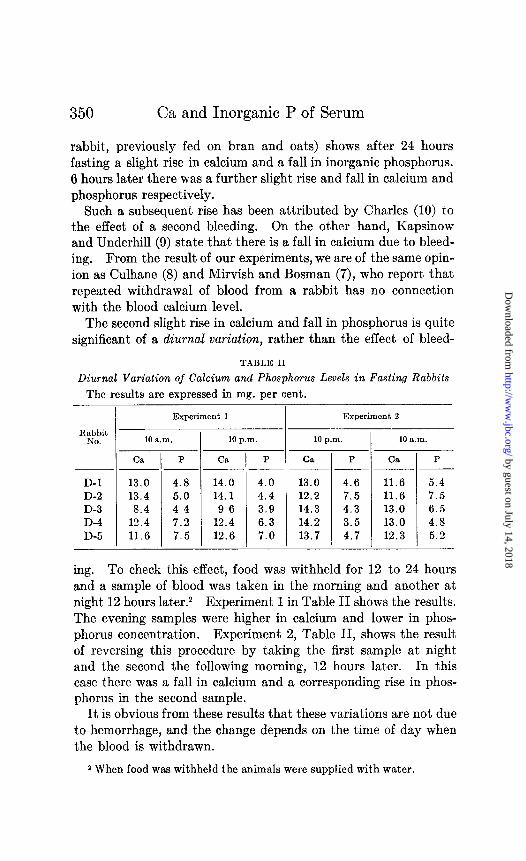
TABLE II
Diurnal Variation of Calcium and Phosphorus Levels in Fasting Rabbits
ing. To check this effect, food was withheld for 12 to 24 hours and a sample of blood was taken in the morning and another at night 12 hours later.2 Experiment 1 in Table II shows the results. The evening samples were higher in calcium and lower in phos- phorus concentration. Experiment 2, Table II, shows the result of reversing this procedure by taking the first sample at night and the second the following morning, 12 hours later. In this case there was a fall in calcium and a corresponding rise in phos- phorus in the second sample.
It is obvious from these results that these variations are not due to hemorrhage, and the change depends on the time of day when the blood is withdrawn.
* When food was withheld the animals were supplied with water.
1. Cabbage fed to rabbits causes a marked rise in the serum calcium, and a simultaneous fall in the inorganic phosphorus concentration.
2. Bran and oats fed to rabbits cause a marked rise in the inorganic phosphorus of serum, with a simultaneous fall in calcium.
3. A rise in calcium is accompanied by a fall in inorganic phos- phorus, and vice versa.
4. There is a definite diurnal variation in the serum calcium and phosphorus levels of the rabbit. The evening calcium level is 1.0 to 1.5 mg. per cent higher than the morning sample. The change in phosphorus is of about the same magnitude.
5. In view of this diurnal variation, a rise or fall of less than 1.5 mg. per cent in serum calcium and phosphorus is of no significance.
6. Rabbits are not suitable animals for experiments in which changes of calcium and phosphorus in the blood serum are effected, if such experiments are to cover a period of more than 2 days.
The expenses of this work have been defrayed by a grant to one of us (E. F. D.) from the Earl of Moray Fund.
BIBLIOGRAPHY
1. Briggs, A. P., J. Biol. Chem., 63, 13 (1922). 2. Clark, E. P., and Collip, J. B., J. Biol. Chem., 63, 461 (1925). 3. Harris, L. J., and Stewart, C. P., Biochem. J., 23, 206 (1929). 4. Culhane, K., Biochem. J., 21, 1015 (1927). 5. Brown, W. H., J. Exp. Med., 47,539,563 (1928). 6. Brown, W. H., J. Exp. Med., 47, 637 (1928). 7. Mirvish, L., and Bosman, L. P., Quart. J. Exp. Physiol., 18, 14 (1927). 8. Culhane, K., J. Bid. Chem., 86, 113 (1930). 9. Kapsinow, R., and Underhill, F. P., J. Biol. Chem., 82,377 (1929).
10. Charles, E., Quart. J. Exp. Physiol., 21, 81 (1931).


![Possible Correlation between INR and Serum Calcium · T. A. Helin et al. 1183 prothrombin time, and vitro in duodenal preparations reduced calcium absorption. Our recent workin [25]](https://static.documents.pub/doc/80x56/5cab498688c99319398cf413/possible-correlation-between-inr-and-serum-calcium-t-a-helin-et-al-1183-prothrombin.jpg)


