Page 1
CASE STUDY
Two models of inventory control with supplier selection in caseof multiple sourcing: a case of Isfahan Steel Company
Masood Rabieh1 • Mohammad Ali Soukhakian2 • Ali Naghi Mosleh Shirazi2
Received: 13 August 2015 / Accepted: 23 February 2016 / Published online: 24 March 2016
� The Author(s) 2016. This article is published with open access at Springerlink.com
Abstract Selecting the best suppliers is crucial for a
company’s success. Since competition is a determining
factor nowadays, reducing cost and increasing quality of
products are two key criteria for appropriate supplier
selection. In the study, first the inventories of agglomera-
tion plant of Isfahan Steel Company were categorized
through VED and ABC methods. Then the models to
supply two important kinds of raw materials (inventories)
were developed, considering the following items: (1) the
optimal consumption composite of the materials, (2) the
total cost of logistics, (3) each supplier’s terms and con-
ditions, (4) the buyer’s limitations and (5) the consumption
behavior of the buyers. Among diverse developed and
tested models—using the company’s actual data within
three pervious years—the two new innovative models of
mixed-integer non-linear programming type were found to
be most suitable. The results of solving two models by
lingo software (based on company’s data in this particular
case) were equaled. Comparing the results of the new
models to the actual performance of the company revealed
10.9 and 7.1 % reduction in total procurement costs of the
company in two consecutive years.
Keywords Inventory control � Supplier selection �Multiple sourcing � Mathematical models
Introduction
Supplier selection is turning to become one of the crucial
decisions in operations management area for many
companies. Nowadays that competition plays a major role
in business, two factors, namely, cost reduction and
increase in quality of products, are keys to success of a
company. Attaining these two factors is heavily depen-
dent on having appropriate suppliers. Therefore, selecting
appropriate suppliers can increase the competitiveness of
a business.
The main cost of a product is mostly dependent on the
cost of raw material and component parts in most industries
(Ghodsypour and O’Brien 2001). Under such a condition
the raw material supply and its inventory control can play a
key role in the efficiency and effectiveness of a business
and have a direct impact on cost reduction, profitability and
its flexibility. Regarding supplier selection, there are two
general situations:
Single sourcing A situation in which there is no con-
straint and a single supplier of an item is able to satisfy all
requirements of the buyer.
Multiple sourcing In this situation there are many sup-
pliers of a required item, but no single suitable supplier can
satisfy all requirements of the buyer. Thus, the buyer must
choose ‘‘an appropriate set of suitable supplies’’ to work
with (Ghodsypour and O’Brien 1998).
Considering many factors such as variations in price,
terms and conditions, quality, quantity, transportation costs
and distances, etc. of each supplier, the multiple sourcing
situations usually involves taking complex decisions.
While there is a paucity of research that takes into
account different aspects of this complex decision situa-
tion, only a limited number of mathematical models have
been proposed for such decisions. Many of the proposed
& Masood Rabieh
[email protected]
1 Department of Industrial Management, Shahid Beheshti
University, Tehran, Iran
2 Department of Management, Shiraz University, Shiraz, Iran
123
J Ind Eng Int (2016) 12:243–254
DOI 10.1007/s40092-016-0145-y
Page 2
models consider ‘‘net price’’ as the main factor, a few of
them consider ‘‘the total costs of logistics’’.
The present study investigates the issue of multiple
sourcing and proposes mathematical models based on
considering factors such as net price, transportation costs,
inventory costs and shrinkage problems.
The rest of this paper is organized as follows. In
‘‘Background’’ section literature review is presented. In
‘‘The situation’’ section, the case study is described. The
mathematical formulating of problem is presented in
‘‘Formulating the models’’ section. Data collection and
parameters are described in ‘‘Parameters of model’’ sec-
tion. Computational result is presented in ‘‘Model runs and
results’’ section and finally, some concluding remarks are
given in ‘‘Discussion and conclusion’’ section.
Background
Supplier selection literature may generally be divided into
two areas: First, descriptive, survey type approaches and,
second, quantitative modeling methods. In the first area, the
researches of Dickson (1966) and Weber et al. (1991)
should be mentioned as the most comprehensive ones.
Dickson has identified and summarized a number of cri-
teria that purchasing managers consider for supplier
selection. In his view, the most important criteria are
quality, delivery, and the performance history of the sup-
plier. Weber et al. (1991) in a review of 74 articles on
supplier selection criteria, found that the most important
factor is net price, yet, they suggested that supplier selec-
tion is dependent on a multitude of factors with different
priorities, depending on the particular purchasing situation.
In the second area, which is more relevant to this article,
a few number of fine research attempts should be men-
tioned here.
Benton (1991) applied Lagrange relaxation to develop a
non-linear program for supplier selection under various
conditions including multiple suppliers, multiple items,
resource limitations and quantity discount. Ghodsypour and
O’Brien (1997) suggested integrated analytical hierarchy
process (AHP) with mixed integer programming to develop
a decision support system (DSS). Their objective was to
reduce the number of suppliers. Ghodsypour and O’Brien
(1998) also developed a model to take into account both
qualitative and quantitative factors. This approach was
based on the integration of AHP and linear programming
model. In a further development Ghodsypour and O’Brien
(2001) presented a mixed integer non-linear programming
model to solve the multiple sourcing problems. Their model
takes the total cost of logistics into consideration. Kumar
et al. (2004) advised a fuzzy goal programming approach to
solve the vendor selection problem in case of multiple
objectives. Chen et al. (2006) presented a fuzzy decision
making approach to solve the supplier selection problem.
They proposed linguistic values to evaluate the ratings for a
number of quantitative and qualitative factors including
quality, price, flexibility, and delivery performance. Their
model shown to be very good tool for supplier selection
decision making situation. Basnet and Leung (2005)
investigated the problem of supplier selection considering
the lot-sizing. Amid et al. (2006) represented multi objec-
tive linear programming model to supplier selection. Lin
and Chang (2008) propose mixed-integer programming and
fuzzy TOPSIS approach to solve the supplier selection
problem. Aissaouia et al. (2007) have extended previous
survey papers by presenting a literature review that covers
the entire purchasing process and covers internet-based
procurement environments. In the mentioned work they
have focused especially on the final selection stage that
consists of determining the best mixture of vendors and
allocating orders among them so as to satisfy different
purchasing requirements. Also, they have concentrate
mainly on works that employ operations research and
computational models. Farzipoor saen (2007) has consid-
ered widespread application of manufacturing philosophies
such as just-in-time (JIT), emphasis has shifted to the
simultaneous consideration of cardinal and ordinal data in
supplier selection process and proposed an innovative
method, which is based on imprecise data envelopment
analysis (IDEA) to selected the best suppliers in the pres-
ence of both cardinal and ordinal data. Ustun and Aktar
Demirtas (2008) have recommended an integrated approach
of analytic network process (ANP) and multi-objective
mixed integer linear programming (MOMILP) for supplier
selection problem. Their approach considers both tangible
and intangible factors in choosing the best suppliers and
defines the optimum quantities among selected suppliers to
maximize the total value of purchasing (TVP), and to
minimize the total cost and total defect rate and to balance
the total cost among periods. Soukhakian et al. (2007)
developed a model based on the Ghodsypour and O’Brien
(2001) model. The contribution of the developed model is
compared with basic the basic model which consider limi-
tations such as integer number of orders and minimum
assigned order quantity to each supplier. Due to the com-
plexity of model and its non-linearity, the model is solved
by genetic algorithm. Rabieh et al. (2008) developed a new
model based on the Ghodsypour and O’Brien (2001) model
for a real case of the agglomeration unit of Isfahan Steel
Company. In this model assume that some suppliers of iron
concentrate in have to cover the inventory in turn during
each ordering cycle (T), while other suppliers of iron ore
deliver their shipments simultaneously. In end, the non-
linear model is solved by LINGO 8 software. Jafarnezhad
et al. (2009) introduced a fuzzy decision making approach
244 J Ind Eng Int (2016) 12:243–254
123
Page 3
for supplier selection problem in case of single sourcing. In
this research, the fuzzy TOPSIS method was developed for
ranking and selecting suppliers. At the end, a numerical
example was introduced for showing performance of the
developed method. Wu and Blackhurst (2009) presented a
supplier selection and evaluation method based on an
extension of data envelopment analysis (DEA) that can
efficiently evaluate suppliers. Kuo and Lin (2012) intro-
duced an integrated approach of analytic network process
(ANP) and data envelopment analysis (DEA) in solving
supplier selection problem. Their model also considered
green indicators due to environmental protections issues.
Finally, Mendoza and Ventura (2012) presented two mixed
integer nonlinear programming models to select the best
suppliers and determine order quantities. Their research
integrated the issues of inventory management and supplier
selection. Rao et al. (2013) developed a new approach to
design a multi-echelon, multi-facility, and multi-product
supply chain in uncertain environment in fuzzy form. In this
research, a mixed integer programming was formulated at
strategic level and a non-linear programming model was
presented in tactical level. In the tactical level, inventory
control of raw material of suppliers was considered
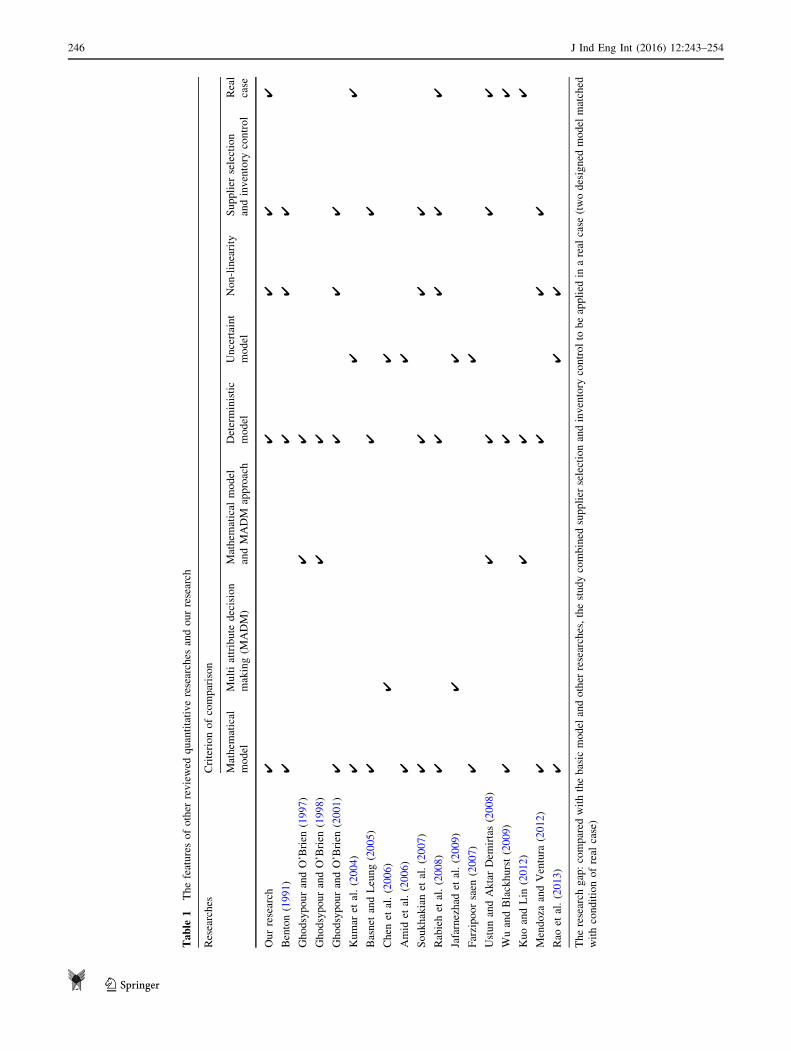
(Table 1).
The situation
The agglomeration unit of Isfahan Steel works—one of the
largest steel manufacturing firms in the ME region located in
central Iran—is the case studied in this research. The main
task of this unit is to agglomerate different kinds of raw
materials in specific proportions. Most of the raw materials
come from different quarries and plants scattered all over the
country. The materials are bought and transported to the
works mainly via railroads and sometimes by trucks in dis-
tances even up to 1300 km. The functional and financial
importance of each required raw materials for agglomeration
unit found to be different in nature. So, as the first step, a
classification of inventory items should have been curried
out prior to actual modeling. The following three popular
classification methods, so called selective inventory control
techniques, are usually applied for grouping inventory items:
ABC analysis, classifies items in terms of annual
financial requirement.
VED analysis, classifies items in terms of their func-
tional importance (Vital, Essential, Desirable).
FNS analysis, classifies items in terms of their move-
ment speed (Fast, Normal, Slow; Nair 2002).
Using ABC and VED methods, the inventory items of
agglomeration plant were analyzed, and iron ore and iron
concentrate were found to be the most important raw
materials respectively. Thus, modeling in this study was
focused around the purchasing and supply of these two
items.
Iron concentrate is a supplementary material which is
very similar to iron ore in appearance and should be mixed
with iron ore in agglomeration process. Since it contains
more Fe; its price is much higher than iron ore. However,
to obtain a desired and consistent quality of the agglom-
eration process output, a right percentage of these two
materials should be mixed together each time. The needed
iron ore and concentrate for agglomeration plant is pur-
chased from five different suppliers, none of which has the
sufficient capacity to supply the whole annual require-
ments. Furthermore, there are some quality variations in
their products and each supplier has its own supply
characteristics.
The developed models in this study take into account
such variations, and are formulated in a way to obtain a
right combination of the raw materials in one hand, and
minimize the total inventory costs in the other.
Formulating the models
Defining model parameters and variables
Before describing the model, the pertaining parameters and
variables are defined as follows:
Decision variables
Q: Ordered quantity to all suppliers in each period.
Qi: Ordered quantity to ith supplier in each period.
Xi: Percentage of Q assigned to ith supplier.
Yi ¼1 if Xi [ 0
0 if Xi ¼ 0
(
Parameters
D: Annual iron ore and concentrate demand (in term of
tons).
T: The length of each period.
Ti: Part of the period in which the lot of ith supplier (Qi)
is used.
n: Number of suppliers
Ci: Annual capacity of the ith supplier to supply raw
material.
Cti: Transportation cost for ith supplier per unit of raw
material.
J Ind Eng Int (2016) 12:243–254 245
123
Page 4
Table
1T
he
feat
ure
so
fo
ther
rev
iew
edq
uan
tita
tiv
ere
sear
ches
and
ou
rre
sear
ch
Res
earc
hes
Cri
teri
on
of
com
par
iso
n
Mat
hem
atic
al
mo
del
Mu
lti
attr
ibu
ted
ecis
ion
mak
ing
(MA
DM
)
Mat
hem
atic
alm
od
el
and
MA
DM
app
roac
h
Det
erm
inis
tic
mo
del
Un
cert
ain
t
mo
del
No
n-l
inea
rity
Su
pp
lier
sele
ctio
n
and
inv
ento
ryco
ntr
ol
Rea
l
case
Ou
rre
sear
ch4
44
44
Ben
ton
(19
91
)4
44
4
Gh
od
syp
ou
ran
dO
’Bri
en(1
99
7)
44
Gh
od
syp
ou
ran
dO
’Bri
en(1
99
8)
44
Gh
od
syp
ou
ran
dO
’Bri
en(2
00
1)
44
44
Ku
mar
etal
.(2
00
4)
44
4
Bas
net
and
Leu
ng
(20
05
)4
44
Ch
enet
al.
(20
06
)4
4
Am
idet
al.
(20
06
)4
4
So
uk
hak
ian
etal
.(2
00
7)
44
44
Rab
ieh
etal
.(2
00
8)
44
44
4
Jafa
rnez
had
etal
.(2
00
9)
44
Far
zip
oo
rsa
en(2
00
7)
44
Ust
un
and
Ak
tar
Dem
irta
s(2
00
8)
44
44
Wu
and
Bla
ckh
urs
t(2
00
9)
44
4
Ku
oan
dL
in(2
01
2)
44
4
Men
do
zaan
dV
entu
ra(2
01
2)
44
44
Rao
etal
.(2
01
3)
44
4
Th
ere
sear
chg
ap:
com
par
edw
ith
the
bas
icm
od
elan
do
ther
rese
arch
es,
the
stu
dy
com
bin
edsu
pp
lier
sele
ctio
nan
din
ven
tory
con
tro
lto
be
app
lied
ina
real
case
(tw
od
esig
ned
mo
del
mat
ched
wit
hco
nd
itio
no
fre
alca
se)
246 J Ind Eng Int (2016) 12:243–254
123
Page 5
r: Inventory holding cost rate.
Ai: Ordering cost of ith supplier’s raw material.
Pi: Selling price of ith supplier’s raw material.
hi: Percentage of moisture in the item of the ith supplier.
D0: Speed of material consumption.
P0: Speed of receiving materials.
SS: Safety stock.
SSi: Safety stock of the ith supplier’s item.
bi ¼ ðPi þ CtiÞ and ai ¼ 1 � D0i
P0i
� �
Other parameters and variables will be described later.
The basic assumptions
• Constant annual demand (D)
• Infinite raw materials storage space
• Stable prices over the year
• Gradual receiving and consumption of raw materials
• Stable safety-stock levels
• Stock-out is not allowed.
Graphical explanation of models
The basic model
The basic model is built following the approach and
assumptions of Ghodsypour and O’Brien (2001) model.
This model assumes instant, in-simultaneous order receives
from different suppliers and gradual consumption of the
materials. Figure 1 shows the behavior of inventory levels
of an item under the assumptions of this model.
In Fig. 1, total order cycle (T) is equal to the sum of
order cycles of every supplier (Ti) and at the time one
supplier’s inventory is used up, the next supplier’s ship-
ment would arrive in.
In general, this model is applicable to situations where,
the quality specification of receiving items from different
sources is identical. And no mixing of different items is
required.
The new models
Because of the need for mixing iron ore and concentrating
on the agglomeration process, the basic model couldn’t be
applied for the current situation. Furthermore, the inven-
tory supply is not instantaneous, but placed orders are
shipped gradually. So, the basic model had to be manipu-
lated to fit the situation correctly. Two slightly different
possibilities were considered as shown in Figs. 2 and 3.
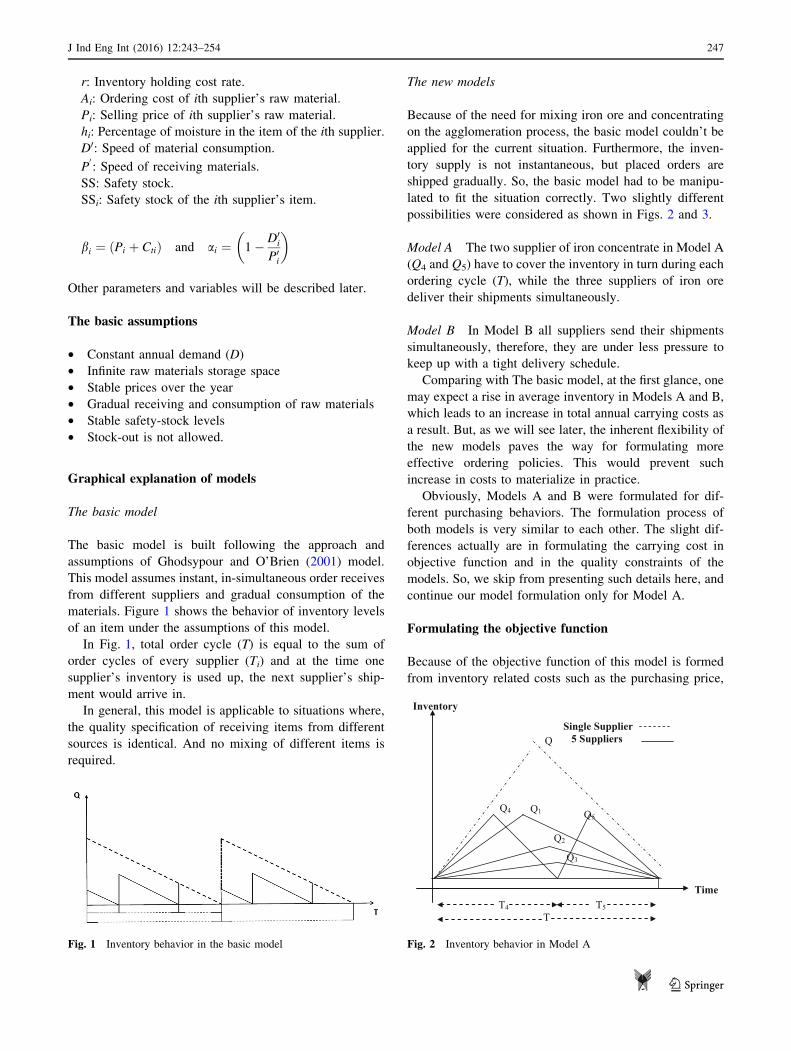
Model A The two supplier of iron concentrate in Model A
(Q4 and Q5) have to cover the inventory in turn during each
ordering cycle (T), while the three suppliers of iron ore
deliver their shipments simultaneously.
Model B In Model B all suppliers send their shipments
simultaneously, therefore, they are under less pressure to
keep up with a tight delivery schedule.
Comparing with The basic model, at the first glance, one
may expect a rise in average inventory in Models A and B,
which leads to an increase in total annual carrying costs as
a result. But, as we will see later, the inherent flexibility of
the new models paves the way for formulating more
effective ordering policies. This would prevent such
increase in costs to materialize in practice.
Obviously, Models A and B were formulated for dif-
ferent purchasing behaviors. The formulation process of
both models is very similar to each other. The slight dif-
ferences actually are in formulating the carrying cost in
objective function and in the quality constraints of the
models. So, we skip from presenting such details here, and
continue our model formulation only for Model A.
Formulating the objective function
Because of the objective function of this model is formed
from inventory related costs such as the purchasing price,
Fig. 1 Inventory behavior in the basic model
SS
Inventory
Q
Q4 Q1 Q5
Q3
Q2
T5 T4 T
Single Supplier 5 Suppliers
Time
Fig. 2 Inventory behavior in Model A
J Ind Eng Int (2016) 12:243–254 247
123
Page 6
transportation costs, carrying and ordering costs, shrinkage
cost, it is a minimizing type objective function. The
shrinkage cost is mainly related to the evaporation of raw
materials moisture during the agglomeration process. Since
the iron ore quarries are located in both dray and wet areas
of the country, the water content of their stones differ
significantly, and should be taken into account as a part of
the total annual purchasing cost.
Annual purchasing cost (APC)
Since ordering quantity (Q) should be shared by n = 5
suppliers, we have the following:
Q ¼Xni¼1
Qi Qi ¼ XiQ Ti ¼ XiT 0�Xi � 1
Xni¼1
Xi ¼ 1 i ¼ 1; 2; . . .; n
Since annual purchasing from ith supplier is XiD and its
price is Pi, APC is:
APC ¼Xni¼1
XiPiD i ¼ 1; 2; . . .; n
Annual transportation cost (ATC)
ATC is computed by multiplying annual purchasing
quantity, and transportation tariff, for ith supplier, thus:
ATC ¼Xni¼1
XiCtiD i ¼ 1; 2; . . .; n
Annual weight reduction cost (AWRC)
As we mentioned earlier, the moisture content of receiving
shipments from each supplier is significantly different.
Therefore, the weight reduction of materials due to evap-
oration in agglomeration process should be taken into
account. The data for this is obtainable from Isfahan Steel
works daily Lab Reports. Let hi be the average moisture
fraction of ith supplier, then, AWRC is computed as:
AWRC ¼Xni¼1
XiDðhiÞðPi þ CtiÞ ¼Xni¼1
XiDhiðPi þ CtiÞ
The above formula considers the fact that the evaporated
moisture is actually bought and paid for its transportation.
To avoid unnecessary repetition, let bi be equal to
ðPi þ CtiÞ1. Hence:
AWRC ¼Xni¼1
XiDhibi i ¼ 1; 2; . . .; 5
And, the sum of forgoing three costs is:
APC þ ATIC þ AWRC ¼Xni¼1
XiDð1 þ hiÞðPi þ CtiÞ
¼Xni¼1
XiDð1 þ hiÞbi
Therefore, it is inferred that the unit cost of ith supplier’s
material in agglomeration process is equal to ð1 þ hiÞbi.We will apply this formula to compute annual holding
(carrying) cost.
Annual holding cost (AHC)
Referring to different behavior of inventory levels in Models
A and B, especially in regard with iron concentrate, obvi-
ously, the formulation of AHC differs slightly. To save us
time, we proceed with formulating AHC for Model A only.
Average inventory in gradual receipt of shipments is
equal to: Q2
1 � D0
P0
� �þ SS, or in general is Q
21 � D0
i
P0i
� �þ SSi,
so, the average holding cost in Ti would be:
Xi
Q
21 � D0
i
P0i
� �þ SSi
� �rpi
In order to avoid unnecessary repetitions, let 1 � D0i
P0i
� �be equal to ai. Since SS is a constant value, it will be
omitted in differentiation process any way. Thus, Total
Holding Cost per Period (THCP) is formulated as follows:
THCP ¼ X1
Q
2a1rð1 þ h1Þb1T1 þ X2
Q
2a2rð1 þ h2Þb2T2
þ � � � þ Xn
Q
2anrð1 þ hnÞbnTn
In Model A, for those suppliers that we have on hand
inventory during the whole order cycle, Ti ¼ T ,
i ¼ 1; 2; . . .;m, and for those vendors that we have on hand
inventory just during a part of cycle, Ti ¼ XiPn
i¼mþ1Xi
T ,
Fig. 3 Inventory behavior in Model B
248 J Ind Eng Int (2016) 12:243–254
123
Page 7
i ¼ mþ 1; . . .; n. Now, we know that T ¼ QD
, and consider-
ing the shape of the model, and the fact that n = 5, we have:
T1 ¼ T2 ¼ T3 ¼ T ¼ Q
D; T4 ¼ X4
X4 þ X5
Q
D;
T5 ¼ X5
X4 þ X5
Q
D
(Here the flexibility and adoptability of the new models
become clearer, as when the model, for any reason, does
not allow purchase from supplier 4, for instance, then, we
have: X4 = 0, T4 = 0, and T5 = T).
However, the detailed computation of THCP is:
THCP ¼ X1
Q
2a1rð1 þ h1Þb1
Q
Dþ X2
Q
2a2rð1 þ h2Þb2
Q
D
þ X3
Q
2a3rð1 þ h3Þb3
Q
D
þ X4
Q
2a4rð1 þ h4Þb4
X4
X4 þ X5
Q
D
þ X5
Q
2a5rð1 þ h5Þb5
X5
X4 þ X5
Q
D
or
THCP ¼X3
i¼1
XiQ2 airð1 þ hiÞbi
2D
þ X24
X4 þ X5
Q2 a4rð1 þ h4Þb4
2D
þ X25
X4 þ X5
Q2 a5rð1 þ h5Þb5
2D
Still, the shorter form for THCP is
THCP ¼ rQ2
2D
X3
i¼1
Xiaið1 þ hiÞbi
!
þ rQ2
2D
1P5i¼4 xi
X5
i¼4
X2i aið1 þ hiÞbi
!
The Annual Holding Cost (AHC) is computed by multi-
plying THCP and the number of order cycles per year, or
AHC ¼ ðTHCPÞ � 1
T¼ ðTHCPÞD
Q
And with suitable substitutions, we have
AHC ¼ rQ2
2D
X3
i¼1
Xiaið1 þ hiÞbi
!D
Q
þ rQ2
2D
1P5i¼4 xi
X5
i¼4
X2i aið1 þ hiÞbi
!D
Q
or, simply
AHC ¼ rQ
2
X3
i¼1
Xiaið1 þ hiÞbi
!
þ rQ
2
1P5i¼4 xi
X5
i¼4
X2i aið1 þ hiÞbi
!
Also holding cost of Model B is:
AHC ¼ rQ
2
X5
i¼1
Xiaið1 þ hiÞbi
!
Annual ordering cost (AOC)
Due to the fact that the required raw materials are ordered
and purchased from n suppliers, the Ordering Cost each
Period (OCP) is:
OCP ¼Xni¼1
AiYi; i ¼ 1; 2; . . .; 5
where Yi ¼1 if Xi [ 0
0 if Xi ¼ 0
(i ¼ 1; 2; . . .; 5
AOC is obtained from multiplication of OCP by the
number of periods per year:
AOC ¼ ðOCPÞ � 1
T) AOC ¼
Xni¼1
AiYi
!1
T
¼Xni¼1
AiYi
!D
Q
Having formulated the annual costs of purchased
materials and AHC and AOC, the Total Annual Costs
(TAC) is simply computed by adding up all these
costs:
TAC ¼ APC þ ATC þ AWRC þ AHC þ AOC
TAC ¼X5
i¼1
XiPiDþX5
i¼1
XiCtiDþ rQ
2
X3
i¼1
Xiaið1 þ hiÞbi
!
þ 1P5i¼4
xi
� rQ
2
X5
i¼4
X2i aið1 þ hiÞbi
!þ D
Q
X5
i¼1
AiYi
!
þXni¼1
hibiXiD
Manipulating the above equation a bit and considering
that bi ¼ Pi þ Cti, a simpler from of TAC will be:
J Ind Eng Int (2016) 12:243–254 249
123
Page 8
TAC ¼X5
i¼1
XiDð1 þ hiÞbiþrQ
2
X3
i¼1
Xiaið1 þ hiÞbi
!þ 1P5
i¼4
xi
� rQ
2
X5
i¼4
X2i aið1 þ hiÞbi
!þ D
Q
X5
i¼1
AiYi
!
As usual, we differentiate the above equation in respect
to Q to obtain the optimum order quantities. Doing so, we
have:
ðTAC)0 ¼ r
2
X3
i¼1
Xiaið1 þ hiÞbi
!þ r
2
� 1P5i¼4 Xi
X5
i¼4
X2i aið1 þ hiÞbi
!
� D
Q2
X5
i¼1
AiYi
!
Finally, omitting Q, the objective function for Model A
is:
And the optimum order quantity, Q*, is:
Q� ¼
ffiffiffiffiffiffiffiffiffiffiffiffiffiffiffiffiffiffiffiffiffiffiffiffiffiffiffiffiffiffiffiffiffiffiffiffiffiffiffiffiffiffiffiffiffiffiffiffiffiffiffiffiffiffiffiffiffiffiffiffiffiffiffiffiffiffiffiffiffiffiffiffiffiffiffiffiffiffiffiffiffiffiffiffiffiffiffiffiffiffiffiffiffiffiffiffiffiffiffiffiffiffiffiffiffiffiffiffiffiffiffi2D
Pni¼1 AiYi
� �rPm
i¼1 Xiaið1 þ hiÞbi� �
þ 1Pn
i¼mþ1Xi
Pni¼1 X
2i aið1 þ hiÞbi
� �vuut
the objective function for Model B after omitting Q is:
Min TAC ¼X5
i¼1
XiDð1 þ hiÞbi
þ
ffiffiffiffiffiffiffiffiffiffiffiffiffiffiffiffiffiffiffiffiffiffiffiffiffiffiffiffiffiffiffiffiffiffiffiffiffiffiffiffiffiffiffiffiffiffiffiffiffiffiffiffiffiffiffiffiffiffiffiffiffiffiffiffiffiffiffiffiffiffiffiffiffiffi2Dr
X5
i¼1
Xiaið1 þ hiÞbi
! X5
i¼1
AiYi
!vuutAnd the optimum order quantity, Q*, is:
Q� ¼
ffiffiffiffiffiffiffiffiffiffiffiffiffiffiffiffiffiffiffiffiffiffiffiffiffiffiffiffiffiffiffiffiffiffiffiffiffiffiffiffiffiffiffiffiffi2D
Pni¼1 AiYi
� �rPn
i¼1 Xiaið1 þ hiÞbi� �
s
The model constraints
The constraints of this model actually pertains to the
buyer’s annual demand and quality of receiving materials,
on one hand, and the suppliers’ allocable capacity, on the
other. In the following section, we present formulation of
these constraints, as they were introduced to the model:
Demand constraint
Assuring D is the Isfahan works, annual demand for iron
ore and iron concentrate, as we mentioned earlier, n = 5
vendors can satisfy D at the present time. Therefore, we
have:Xni¼1
XiD ¼ D i ¼ 1; 2; . . .; 5
Omitting D from both sides of equation, then we have:
Xni¼1
Xi ¼ 1 i ¼ 1; 2; . . .; 5
Fe quality constraint
In practice, to get a quality agglomeration process output
with a prescribed Fe content, a calculated mix of input
materials, based on their Fe content is used. In this case we
have:
X5
i¼1
XiDqFei � qaFeD
And, omitting D from both sides, we have:
X5
i¼1
XiqFei � qaFe
TAC ¼X5
i¼1
XiDð1 þ hiÞbi þ
ffiffiffiffiffiffiffiffiffiffiffiffiffiffiffiffiffiffiffiffiffiffiffiffiffiffiffiffiffiffiffiffiffiffiffiffiffiffiffiffiffiffiffiffiffiffiffiffiffiffiffiffiffiffiffiffiffiffiffiffiffiffiffiffiffiffiffiffiffiffiffiffiffiffiffiffiffiffiffiffiffiffiffiffiffiffiffiffiffiffiffiffiffiffiffiffiffiffiffiffiffiffiffiffiffiffiffiffiffiffiffiffiffiffiffiffi2Dr
X3
i¼1
Xiaið1 þ hiÞbi
!þ 1P5
i¼4 Xi
X5
i¼4
X2i aið1 þ hiÞbi
!vuut �
ffiffiffiffiffiffiffiffiffiffiffiffiffiffiffiffiX5
i¼1
AiYi
vuut
250 J Ind Eng Int (2016) 12:243–254
123
Page 9
where qaFe is the minimum acceptable percent of Fe in the
input mix, and qFei is the percent of Fe content in the ith
supplier’s material.
Due to the assumptions of Model A, which requires
breaking the order cycle into two parts, we should divide
the Fe quality constraint into two parts as well, and intro-
duce it to the model as follows:
ðX1DqFe1 þ X2DqFe2 þ X3DqFe3
þ ð1 � X1 þ X2 þ X3ÞÞDqFe4Þ�DqaFe
ðX1DqFe1 þ X2DqFe2 þ X3DqFe3
þ ð1 � X1 þ X2 þ X3ÞÞDqFe5Þ�DqaFeX5
i¼1
DXiqFei � 1020Y4D� 1020Y5D�Dqafe
Knowing that:
X4 �ð1 � ðX1 þ X2 þ X3ÞÞX5 �ð1 � ðX1 þ X2 þ X3ÞÞ
And omitting D from both sides, we have:
ðX1qFe1 þ X2qFe2 þ X3qFe3 þ ð1 � X1 þ X2 þ X3ÞÞqFe4Þ� qafe
ðX1qFe1 þ X2qFe2 þ X3qFe3 þ ð1 � X1 þ X2 þ X3ÞÞqFe5Þ� qafeX5
i¼1
XiqFei � 1020Y4 � 1020Y5 � qafe
X4 �ð1 � ðX1 þ X2 þ X3ÞÞX5 �ð1 � ðX1 þ X2 þ X3ÞÞ
Additionally the number 1020 that represented is a very
large number in the model.
Quality Constraint for Model B is:
X5
i¼1
XiqFei � qaFe
Capacity constraint
This constraint stems from the fact that the ith supplier can
satisfy only a fraction of the annual buyer’s needs, Ci, each
year. Thus: XiD�Ci.
Finally, we have to make sure that Yi has an integer value
of 0 or 1. To introduce this constraint to model, and
knowing that Xi is always equal or less than 1, then we have:
Xi � Yi i ¼ 1; 2; . . .; n
Xi � eYi
where, e is a little bit greater than 0.
Instead, in above constraint formulas, where ever we
have Xi, we can multiply it by Yi.
Fe quality constraint
Model A formulation
Now, we summarize Model A formulation as follows:
MinTAC¼Xni¼1
XiDð1þhiÞbiþrQ
2
Xmi¼1
Xiaið1þhiÞbi
!
þ 1Pni¼mþ1Xi
� rQ
2
Xni¼mþ1
X2i aið1þhiÞbi
!þD
Q
Xni¼1
AiYi
!
Xni¼1
Xi¼1 i¼1;2; . . .;m; . . .mþ1; . . .n
Xmi¼1
XiqFeiþ 1�Xmi¼1
Xi
! !qFeðmþ1Þ
!�qaFeYmþ1
Xmi¼1
XiqFeiþ 1�Xmi¼1
Xi
! !qFeðmþ2Þ
!�qaFeYmþ2
..
. ... ..
.
Xmi¼1
XiqFeiþ 1�Xmi¼1
Xi
! !qFeðnÞ
!�qaFeyn
Xni¼1
XiqFei�1020Xni¼mþ1
Yi�qaFe
0�Xmþ1� 1�Xmi¼1
Xi
! !
0�Xmþ2� 1�Xmi¼1
Xi
! !
..
. ...
0�Xn � 1�Xmi¼1
Xi
! !
XiD�Ci i¼1;2; . . .;n
Qi¼XiQ
Xi � Yi
Xi � eYi
Q¼Xni¼1
Qi
Xi � 0;Yi¼0;1; i¼1;2; . . .;m; . . .;n
Model B formulation
We summarize Model B formulation as follows:
J Ind Eng Int (2016) 12:243–254 251
123
Page 10
Min TAC ¼Xni¼1
XiDð1 þ hiÞbi þrQ
2
Xni¼1
Xiaið1 þ hiÞbi
!
þ D
Q
Xni¼1
AiYi
!
Xni¼1
Xi ¼ 1 i ¼ 1; 2; . . .; n
Xni¼1
XiqFei � qaFe i ¼ 1; 2; . . .; n
XiD�Ci i ¼ 1; 2; . . .; n
Qi ¼ XiQ
Xi � Yi
Xi � eYi
Q ¼Xni¼1
Qi
Xi � 0; Yi ¼ 0; 1; i ¼ 1; 2; . . .;m. . .; n
Parameters of model
It should be considered that the model was tested for two
time periods (two successive years). Some of the parame-
ters are the same for two time period and others are dif-
ferent thus they are represented separately (Tables 2, 3).
Model runs and results
In order to run the formulated models and compare its
results with actual performance, we had to compute model
parameters from Company’s records. This was done care-
fully using data of two consecutive financial years. We
employed the global option of Lingo Version 8 for running
the models. The results are summarized in Table 4.
Take notice of the fact that the model has chosen three
of the suppliers for the first year and only two of them in
the second year. Exactly, the same results obtained when
running Model B too. Obtaining the same results from
Models A and B is rather exceptional, and relates only to
this studied situation, and stems from the fact that both
models rejected buying iron concentrate from a particular
vendor. Models are based on important criteria such as
cost, quality and capacity.
Actually, Isfahan Steel Co. on a regular basis, has been
buying raw materials form all five suppliers during those
2 years. A comparison of the model results with the actual
cost performance of the Company is made in Table 5.
Discussion and conclusion
Examining the results presented in Tables 4 and 5, reduc-
ing cost by 10.9 and 7.1 %, increasing company’s annual
profit, attract any top manager’s attention. One might argue
that real world mangers of large processing firms like
Isfahan Steel Company keep purchasing from different
sources to ensure a continuous and reliable stream of
Table 2 Common parameters for two successive years
i r ai qFei hi Ci
1 0.16 0.685 60.19 0.0189 2,021,000
2 0.16 0.594 61.56 0.0434 142,000
3 0.16 0.837 60.41 0.0773 84,000
4 0.16 0.282 67.26 0.0915 3,000,000
5 0.16 0.084 68.06 0.0832 4,000,000
Table 3 Different parameters for two successive years
i First year Second year
Ai bi Ai bi
1 10,485,422 157,682 10,083,210 122,000
2 10,485,422 170,000 10,083,210 128,000
3 10,485,422 198,000 10,083,210 167,500
4 10,485,422 254,000 10,083,210 254,000
5 10,485,422 215,000 10,083,210 215,000
qa first year = 61.17, qa second year = 60.23, Dfirst year = 2,082,368,
Dsecond year = 1,861,518
Table 4 Model A results
First year Second year
Objective function (Rials) 286,884,300,000 300,929,000,000
X1 0.8191556 0.9949174
X2 0.0681916 0
X3 0 0
X4 0 0
X5 0.1126528 0.005082592
Y1 1 1
Y2 1 0
Y3 0 0
Y4 0 0
Y5 1 1
Q 100,844.4 66,727.33
Q1 82,640.02 66,388.18
Q2 6879.469 0
Q3 0 0
Q4 0 0
Q5 11,364.91 339.1478
252 J Ind Eng Int (2016) 12:243–254
123
Page 11
supplies. However, it turned out to be a very expensive way
to get such assurances. The responsible managers of the
said company had not been aware of the tremendous dif-
ferences that a wrong suppliers selection decisions could
create. Furthermore, one of the real potential values of
mathematical modeling is reminding the mangers of
alternative ways of doing their daily affairs.
However, some points should be mentioned about the
new models and the present study:
1. The models determine the percentages of iron ore and
iron concentrate to be mixed in agglomeration process.
This is done by considering the minimum Fe contents
required for specified output quality of the process,
qafe, and other constraints, and objective function. The
models recommended a mix of 88.73472 % iron ore
and 11.26528 %, concentrate for the first year and
99.49174 % iron ore, 0.005082592 % concentrate for
the second year.
2. A sensitivity analysis of the models was assumed by
changing capacity and quality constraints’ parameters,
the number of placed orders in a year, D/Q. The results
of the sensitivity analysis revealed that even in the
most pessimistic conditions, the models would result in
total costs reduction.
One of the interesting findings of the sensitivity
analysis of the model was that if the second iron ore
supplier had no capacity limitations, and could supply
the Company’s whole annual needs, a substantial costs
reduction could happened. Based on this finding, we
recommended the management helping that particular
supplier to invest in increasing its capacity through a
joint venture project.
3. The non-linear assumption of these models makes
them closer to the real world managerial problems.
Most of the relationships in socio-economic systems
are non-linear in nature. Yet, Model B is flexible
enough to be changed to a linear model simply by
assuming D/Q as constant. As a result, the new models
are applicable to a fairly large area of operations
management special problems.
4. The new models are not just a simple inventory model.
As we have seen, the models can handle a multi-
criteria situation comprising cost and quality and help
us select appropriate suppliers. They also can present a
purchasing schedule to tell us when and how much to
buy from each vendor. At the same time, the models
can suggest an optimum consumption mix of the
materials.
In summary, the new models presented in this article have
notable advantages and improvements over the previously
introduced ones, such as Ghodsypour and O’Brien model
(2001), with a considerable number of real world special
applications.
Open Access This article is distributed under the terms of the
Creative Commons Attribution 4.0 International License (http://crea
tivecommons.org/licenses/by/4.0/), which permits unrestricted use,
distribution, and reproduction in any medium, provided you give
appropriate credit to the original author(s) and the source, provide a
link to the Creative Commons license, and indicate if changes were
made.
References
Aissaouia N, Haouaria M, Hassinib E (2007) Supplier selection and
order lot sizing modeling: a review. Comput Oper Res
34:3516–3540
Amid A, Ghodsypour SH, O’ Brein CO (2006) Fuzzy multiobjective
linear model for supplier selection in a supply chain. Int J Prod
Econ 104:394–407
Basnet C, Leung JMY (2005) Inventory lot-sizing with supplier
selection. Comput Oper Res 32:1–14
Benton WC (1991) Quantity discount decision under conditions of
multiple items, multiple suppliers and resource limitation. Int J
Prod Econ 27:1953–1961
Chen C-T, Lin C-T, Huang S-F (2006) A fuzzy approach for supplier
evaluation and selection in supply chain management. Int J Prod
Econ 102(2):289–301
Dickson GW (1966) An analysis of vendor selection systems and
management. J Purch 2(1):5–17
Farzipoor Saen R (2007) Suppliers selection in the presence of both
cardinal and ordinal data. Eur J Oper Res 183:741–747
Ghodsypour SH, O’Brien C (1997) A decision support system for
reducing the number of suppliers and managing the supplier
partnership in a JIT/TQM environment. In: Proceedings of 3rd
international symposium on logistics, University of Padua, Italy
Ghodsypour SH, O’Brien C (1998) A decision support system for
supplier selection using an integrated analytic hierarchy process
and linear programing. Int J Prod Econ 56–57:199–212
Ghodsypour SH, O’Brien C (2001) The total cost of logistics in
supplier selection, under conditions of multiple souring, multiple
criteria and capacity constraint. Int J Prod Econ 73:15–27
Jafarnezhad A, Esmaelian M, Rabieh M (2009) Evaluation and
selection of supplier in supply chain in case of single sourcing
with fuzzy approach. Manag Res Iran 12(4):127–153
Kumar M, Vrat P, Shankar R (2004) A fuzzy goal programming
approach for vendor selection problem in a supply chain.
Comput Ind Eng 46(69):58
Kuo RJ, Lin Y (2012) Supplier selection using analytic network
process and data envelopment analysis. Int J Prod Res
50(11):2852–2863
Lin HT, Chang WL (2008) Order selection and pricing methods using
flexible quantity and fuzzy approach for buyer evaluation. Eur J
Oper Res 187:415–428
Table 5 Comparing the model results with actual data
Results First year Second year
Total cost of the Model A 286,884,300,000 300,292,000,000
Total actual cost (Rials) 321,929,098,600 323,290,000,000
Cost reduction (Rials) 35,044,798,600 22,998,000,000
% of reduction 10.9 7.1
J Ind Eng Int (2016) 12:243–254 253
123
Page 12
Mendoza A, Ventura JA (2012) Analytical models for supplier
selection and order quantity allocation. Appl Math Model
36:3826–3835
Nair NG (2002) Resource management. Vikas Publishing House,
New Delhi
Rabieh M, Soukhakian MA, Jafarnezhad A (2008) Designing a non-
linear compatible model of supplier selection in case of multiple
sourcing: a case study of Isfahan Steel Company. Iran J Trade
Stud 12(45):57–83
Rao KN, Subbaiaha KV, Singh GVP (2013) Design of supply chain in
fuzzy environment. J Ind Eng Int. 9:9. doi:10.1186/2251-712X-
9-9
Soukhakian MA, Rabieh M, Afsar A (2007) Designing a inventory
control model with a consideration of total cost of logistics in
case of multiple sourcing. J Soc Sci Humanit Shiraz Univ
26(150):75–94
Ustun O, Aktar Demirtas E (2008) An integrated multi-objective
decision-making process for multi-period lot-sizing with supplier
selection. Omega 36:509–521
Weber CA, Current JR, Benton WE (1991) Vendor selection criteria
and methods. Eur J Oper Res 50:2–18
Wu T, Blackhurst J (2009) Supplier evaluation and selection: an
augmented DEA approach. Int J Prod Res 47(16):4593–4608
254 J Ind Eng Int (2016) 12:243–254
123