Abstract—A key requirement in preparing for a growing UAS industry and for the integration of unmanned vehicles into the US national airspace, is a method for clear and specific forecasting. We must know what types of operations are being performed, where they will occur, and what types of vehicles will be used.
Current demand forecast models are not tightly coupled to the real purpose of the mission requirements (e.g. in terms the real locations of physical structures such as windmills to inspect, farms to survey, pipelines to patrol, etc.). To this end, Mosaic ATM under NASA guidance, is developing a crowd-sourced demand forecast engine for commercial and government organizational users to draw upon and share vetted and accurate projection data, and extend that data to evaluate associated impacts.
The UAS Demand Generator for Discrete Airspace Density (UAXPAN) project combines forecast data from disparate sources in a common data format, and uses these to present a solid basis for demand forecasts. This specific, data-driven forecasting is crucial to understanding the impacts of a growing UAS industry on regional infrastructure, environment, and economy.
The FAA is moving forward in collaboration with NASA's UAS Integration in the NAS Project, and these efforts will follow the guidelines, practices and procedures of the FAA Aviation Management System. The real drive to facilitate funding changes to the current NAS will come from both operators and government jointly seeing an accurate forecast of UAS demand data.
This requires not an aggregate demand forecast, but rather a detailed picture of how the demand is spread across small to large UAS, how it is spread across a wide range of missions
and where, specifically, the demand will appear. The UAXPAN concept is graphically depicted in Figure (1).
In 2013 the Volpe National Transportation Systems Center released a study of the overall demand for UAS [1]. Industry segmentation in that report is largely limited to defense & civilian activities. In 2016, the FAA released their 20-year Aerospace Forecast (including anticipated UAS activity), which begins to expand the industry-specific analysis by listing the top five industry categories expected to use small UAS [2].
However, the underlying UAS activity will appear in clusters of activities grouped by similar missions on a smaller geographical area and then growing from those small cells. Unmanned aerial systems involve a wide range of aircraft and potential uses, and the diversity of airframe types and uses is growing rapidly.
The availability of a common data format that can distinguish by operational type, integrate varying growth curves such as the classic sigmoid approach, and link the geospatial location of the UAV activities, will greatly enhance and stabilize major system level analysis problems such as communications spectrum and reuse and safety case analysis.
This paper reports on an innovation in the research and development using a cloud-based software system which
allows users from all over the globe to create, share, critique, and use a variety of models to produce common data driven forecasts of UAS usage patterns and to then extend that forecast data with plug-in application solvers to further their analysis of the results (e.g., deriving associated impact on communications infrastructure, nearby environment, or local economy).
First, the overall architecture of the system is discussed. This is followed by an explanation of the process for reporting on UAS activity, then a discussion of modeling related impacts (communications bandwidth, environment, and economy) and closes with a summary.
II. SYSTEM OVERVIEW
UAXPAN is a cloud-based software system and common data format for working with UAS industry forecasts. It allows users from all over the globe to create, share, critique, and use specific UAS-industry predictions, and to generate data-driven forecasts. Users can create and share mission types, vehicle types, and forecasts of future growth. Forecasts can be promoted for review by a panel of industry experts, if desired.
The forecast engine combines user-entered forecast data with geospatial data, to model UAV activity across space and time.
Reports are generated by bundling one or more available forecasts, and selecting a desired timespan and geographic area. The system calculates anticipated activity for the region and period of interest, then presents the resulting forecast prediction to the user. Users can view the forecast demand graphically on a map, or download the underlying data.
A plug-in architecture allows calculated demand forecast data to be sent to external applications for processing, and receives results for visual display and download. This supports
extended analysis of the impacts of a growing industry. The overall system architecture is illustrated in Figure (2).
The Phase 1 project achieved all of its technical objectives and concluded with a successful demonstration of a prototype system at the NASA Glenn Research Center in 2015. Current work in Phase 2 continues the design, development, and study of the UAXPAN concept. Mosaic ATM, NASA, and Honeywell have collaborated to create a working prototype. The system is running in a cloud-based environment, and available for use as a public Beta. We are continuing to develop and refine the system features, and to assess the performance and marketability of the idea.
III. FORECASTING UAS ACTIVITY
The UAXPAN tool is designed to make it as easy as possible for users to create large, small, local, and/or regional UAS demand forecasts and to then accumulate these partial forecasts into a single merged activity forecast over specified spatial regions and time.
Users with specialized knowledge of current or potential future UAV operations use the tool by creating one or more of the basic UAXPAN data elements: industry categories, UAV types, operations, and operational forecasts.
Operational forecasts encapsulate the basic growth information for a particular type of UAS operation. After selecting an Industry and a type of Operation within that industry, the user enters data indicating the growth over time. A user’s forecast consists of at least two data points (number of UAVs performing that mission at a given point in time) and a growth curve which best represents their prediction. Example forecast curves are illustrated in Figure (3).
UAXPAN’s Gold Standard governance feature provides a framework through which a panel of industry experts can
Figure 2 - UAXPAN System Architecture
2
identify and promote best-in-class forecasts within the system. Users can submit their forecasts for review. If approved, the forecast is included in the Gold Standard set, which is highlighted throughout the system.
A role-based permission system allows users to make their forecasts publicly available, or keep them private.
IV. PREDICTING AIRSPACE DEMAND
Users interested in creating demand reports can select one or more forecasts available in the UAXPAN system. Users may assemble a Scenario based on the highlighted Gold Standard forecasts, or any publicly-available forecasts in the tool. Comprehensive demand forecasts would include operations / forecasts from all industry categories, while more specialized demand forecasts might include only operations / forecasts from a single industry or operational type.
Demand reports are then created from these scenarios, which provide UAV activity numbers over user specified regions and over a user-specified time period. Figure (4) depicts the basic UAXPAN forecast data elements and how they are combined in a report scenario.
In addition to the Forecast selection, a Scenario contains a start and end date, to establish the bounds for the report. For example, an underlying Forecast may cover activity for 2016-2036, but the user may only be interested in demand for 2016-2020. This allows the user to specify the time window of interest to them.
With all the parameters defined and a scenario selected, the UAXPAN system will iterate through all of the operational and forecast data to project UA counts onto geospatial reporting regions intersecting operational geometries for each time bin in the reporting period. The projection logic keeps track of two metric types for counting purposes: a Max metric and a Density metric.
The Max metric keeps track of the maximum possible number of UA counts for each reporting area for each time. The Density metric keeps track of the UA counts for each reporting region by evenly smearing each UA over its operational geometry giving a kind of average of what one may expect to see on any particular day.
Once the forecast engine has completed its calculations, the user is notified that the report results are available. The user is able to easily view the airspace demand on a map and view changes over time. Additionally, the underlying data may be downloaded in CSV format or passed to one or more Application Solver plug-ins, for extended processing.
V. EXTENDING DEMAND PREDICTIONS
While the UAXPAN system provides an improved method for predicting UAS activity and airspace demand, it also supports extended analysis and modeling of the ancillary impacts of that UAS activity on a given region. For example, increased UAV traffic in an area has a direct impact on communications infrastructure and environment, as well as less direct but still relevant impacts on the regional economy.
UAXPAN provides tools for assessing these associated impacts, through a suite of plug-in Application Solvers. Once a demand forecast has been created for a given area, it can be handed off to one or more Application Solvers for additional processing. These applications model the impacts of UAV activity in a given region, and produce a report of anticipated impact.
The first application solver implementation was performed in partnership with Honeywell, to predict the impact of increased UAS activity on communications infrastructure.
VI. PREDICTING COMMUNICATIONS DEMAND
Increasing UAV activity in a given region means additional demands on the area's wireless communication spectrum due to command and control activity, real-time photo and video transmission, and even voice and data links. To better understand this relationship, the UAXPAN system was integrated with Honeywell's communication system simulation model.
The model uses activity forecast data to predict the aggregate bandwidth required to support projected UAS operations. It estimates communication channel loading, one-
Figure 4 – Combining Forecasts for a Demand Report
Figure 3 – Forecast Growth Curves
3
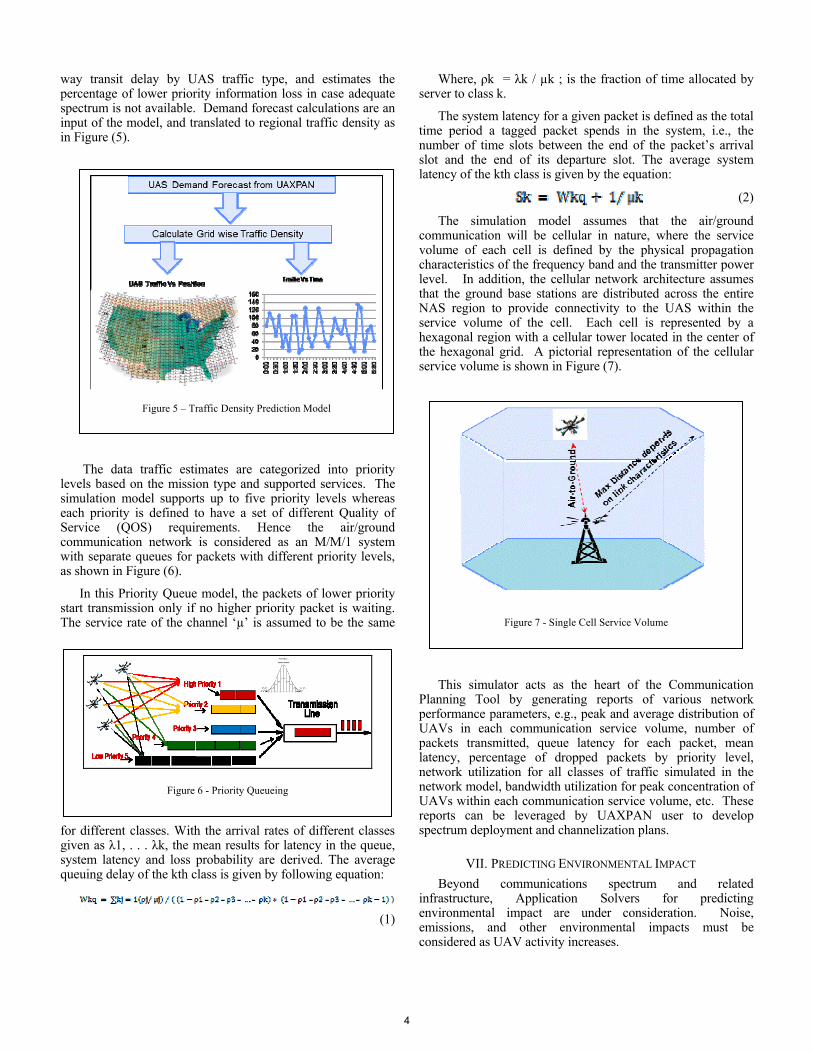
way transit delay by UAS traffic type, and estimates the percentage of lower priority information loss in case adequate spectrum is not available. Demand forecast calculations are an input of the model, and translated to regional traffic density as in Figure (5).
The data traffic estimates are categorized into priority levels based on the mission type and supported services. The simulation model supports up to five priority levels whereas each priority is defined to have a set of different Quality of Service (QOS) requirements. Hence the air/ground communication network is considered as an M/M/1 system with separate queues for packets with different priority levels, as shown in Figure (6).
In this Priority Queue model, the packets of lower priority start transmission only if no higher priority packet is waiting. The service rate of the channel ‘µ’ is assumed to be the same
for different classes. With the arrival rates of different classes given as λ1, . . . λk, the mean results for latency in the queue, system latency and loss probability are derived. The average queuing delay of the kth class is given by following equation:
(1)
Where, ρk = λk / µk ; is the fraction of time allocated by server to class k.
The system latency for a given packet is defined as the total time period a tagged packet spends in the system, i.e., the number of time slots between the end of the packet’s arrival slot and the end of its departure slot. The average system latency of the kth class is given by the equation:
(2)
The simulation model assumes that the air/ground communication will be cellular in nature, where the service volume of each cell is defined by the physical propagation characteristics of the frequency band and the transmitter power level. In addition, the cellular network architecture assumes that the ground base stations are distributed across the entire NAS region to provide connectivity to the UAS within the service volume of the cell. Each cell is represented by a hexagonal region with a cellular tower located in the center of the hexagonal grid. A pictorial representation of the cellular service volume is shown in Figure (7).
This simulator acts as the heart of the Communication Planning Tool by generating reports of various network performance parameters, e.g., peak and average distribution of UAVs in each communication service volume, number of packets transmitted, queue latency for each packet, mean latency, percentage of dropped packets by priority level, network utilization for all classes of traffic simulated in the network model, bandwidth utilization for peak concentration of UAVs within each communication service volume, etc. These reports can be leveraged by UAXPAN user to develop spectrum deployment and channelization plans.
VII. PREDICTING ENVIRONMENTAL IMPACT
Beyond communications spectrum and related infrastructure, Application Solvers for predicting environmental impact are under consideration. Noise, emissions, and other environmental impacts must be considered as UAV activity increases.
Figure 5 – Traffic Density Prediction Model
Figure 6 - Priority Queueing
Figure 7 - Single Cell Service Volume
4
The Massachusetts Institute of Technology has supported a number of research efforts dedicated to the understanding and mitigation of noise, emission, and other environmental impacts from the general aviation industry. Their PARTNER program aggregates a number of useful models for evaluating the impact of aviation activity on noise and emission levels.
Particularly relevant works include examination aircraft noise annoyance [3] and the impact of open rotor noise on nearby communities [4]. Models such as those referenced here can be easily adapted to UAS parameters. A new integrated application for UAXPAN can be developed to combine UAS activity forecast predictions with nearby population data, and thus begin to assess one type of environmental impact.
Clearly, the overall environmental impact of future UAV use in a given area is a broad topic with many interrelated and non-linear factors. There is no single model to predict environmental impact generally. The plug-in architecture of UAXPAN, however, provides a pathway for connecting specialized assessment models.
By combining UAS activity forecasts with nearby population data and applying such a model, we can begin to assess one type of environmental impact.
VIII. PREDICTING ECONOMIC IMPACT
In a similar fashion, the UAXPAN system can be expanded to predict the effects of future UAS activity on local and regional economics.
Several useful models exist for predicting the regional economic impact of a new industry. Input-Output approaches such as the IMPLAN model [5] are well-documented and widely-used methods of predicting the economic impact of cooperative efforts and industries. Work by Garrison [6] examines the impact of new industries on rural communities.
New, integrated applications can be developed to apply these models to population data and UAS activity forecasts for a given region, providing valuable data to regional and local government planners. Resulting predictions can be used to clarify the anticipated economic impacts in a given area. These figures help reduce risk and quantify the return communities might expect from certain infrastructure and UAS program investment.
As with environment, the overall picture of economic impact is complex and multi-faceted. The UAXPAN system provides an important and useful framework for applying and comparing multiple models of economic impact.
IX. SUMMARY
The growing UAS industry presents a complex challenge to aviation operators, regulators, manufacturers, and communities. Evaluation of industry growth and regional UAV activity must be based upon realistic region- and mission-specific forecasts. The UAXPAN system provides a much-needed structure for aggregating discrete knowledge into a common, cloud-based data format.
In addition to improving forecast accuracy, the system provides a framework by which the ancillary impacts of a growing industry can be evaluated. Plug-in applications can extend the airspace demand forecasts to predict impacts on regional resources. The first such integration has been completed, and evaluates the specific impacts of UAS activity on local communications spectrum. Additional applications can be developed to assess environmental impact, economic impact, and more.
Broad assessment of UAS industry impact is a complex issue. While broad UAS industry forecasts are common, they vary widely and lack detail. Communities and governments that wish to evaluate a predicted return on their investment require data-driven tools that are specific and flexible. The UAXPAN system helps us move beyond the industry hyperbole, and to begin to parse out the specific impacts on regional infrastructure, environment, and economy.
ACKNOWLEDGMENT
The UAXPAN project is a Small Business Innovation Research (SBIR) effort that is supported by the NASA Glenn Research Center (Cleveland, Ohio).
DISCLAIMER
The text and graphics within this paper express only the views and/or opinions of the authors as individuals and do not represent endorsements, commitments or polices of their firm, agency or organization.
REFERENCES
[1] John A. Volpe Transportation Systems Center, Technical Report,
Version 0.1, UAS Service Demand: 2015-2035, DOT-VNTSC-DoD-13-01, September 2013.
[2] Federal Aviation Administration, FAA Aerospace Forecast: Fiscal Years 2016-2036, March 2016.
[3] K. Foertsch and P. Davies, "The Number-of-Events as a Predictor Variable in Aircraft Noise Annoyance Models", Report No. PARTNER-COE-2013-002, Massachusetts Institute of Technology PARTNER Program, December 2013.
[4] Dimitri Mavris, Jimmy Tai, Russell Young, Ben Havrilesko, "Open Rotor Noise Impact on Airport Communities", Report No. PARTNER-COE-2011-007, Massachusetts Institute of Technology PARTNER Project, July 2011.
[5] Steven Deller, N.R. Sumathi, David Marcouiller, "Regional Economic Models for the State of Wisconsin: An Application of the Micro-IMPLAN Modeling System", Staff Paper 93.6, November 1993.
[6] Charles Garrison, "The Impact of New Industry: An Application of the Economic Base Multiplier to Small Rural Areas", Land Economics, Vol. 48 No. 4, November 1972.