University of California, Berkeley December 4, 2010 UC BERKELEY WATER USAGE & CONSERVATION STUDY REPORT Prepared for: Chancellor’s Advisory Committee on Sustainability Prepared by: Joanna Zhang
Transcript
University of California, Berkeley
December 4, 2010
UC BERKELEY WATER USAGE & CONSERVATION STUDY REPORT
Prepared for: Chancellor’s Advisory Committee on Sustainability
Prepared by: Joanna Zhang
CACS Water Associate Joanna Zhang Page 2
Contents
LIST OF TABLES & FIGURES .............................................................................................................. 3
Figure 1: “A Sustainable Water Plan for University of California Berkeley” (Daniels, 2005) .................... 5
Figure 2: Total Water Consumption (Gallons) ............................................................................................. 7
Figure 3: Total Consumption Gallons/Capita/Day ....................................................................................... 8
Figure 4: Total Consumption Gallons/Square Foot ...................................................................................... 8
Figure 5: Main Campus Consumption .......................................................................................................... 9
Figure 6: Main Campus Gallon/Sq Ft ........................................................................................................... 9
Figure 7: Main Campus Gallon/Capita/Day ...............................................................................................10
Figure 8: Other Accounts Consumption .....................................................................................................10
Figure 9: Residence Hall Total Consumption (Gallons).............................................................................11
Figure 10: Residence Hall Consumption by Location ................................................................................11
Figure 11: 2009 Residence Hall Consumption Breakdown ........................................................................12
Figure 12: 2008 Estimated Campus Usage By Type ..................................................................................13
Figure 13: Estimated Campus Restroom Water Usage...............................................................................14
Figure 14: Greywater Schematic for Toilet Use (Anglin, Maravilla, Miller, 2008) ...................................18
Figure 15: Greywater Schematic for Irrigation (Anglin, Maravilla, Miller, 2008).....................................18
CACS Water Associate Joanna Zhang Page 4
EXECUTIVE SUMMARY
In order to address California’s fourth consecutive year of drought, the State of California has issued a state of emergency, passed water conservation legislation, and ordered immediate action to mitigate a potential water shortage crisis. In response, the Chancellor’s Advisory Committee on Sustainability (CACS) at University of California, Berkeley commissioned this report to better understand baseline water consumption and identify areas of opportunities for water conservation with a focus on domestic1 and industrial use of potable water in campus buildings and Auxiliaries. Past reports on campus water consumption have not included all buildings and operations. In addition, there are not sufficient meters and sub-meters to adequately assess usage and trend. A feasibility study of water conservation opportunities is conducted to identify potential water saving projects.
BENCHMARKING
Benchmarking research focused on other large universities’ water usage profiles. Water consumption at a range of universities was examined, including other research institutions and universities who have successfully reduced their consumption2. Total water usage by institutions of higher education varies substantially by size, location and climate, efficiency of water usage, and other factors.
It was not possible, however, to accurately analyze UC Berkeley’s usage against these benchmarks. Not all universities report water consumption and not all use the same protocol for
1 Domestic usage includes toilet, urinal, faucet and shower usages. 2 Benchmarking information is obtained from http://www.greenreportcard.org/ for 2010 for Arizona State University, Georgia Institute of Technology, Pomona College, UC Davis, Duke University, UC San Diego, Harvard University, and University of Washington. Follow-up phone calls were made to a smaller number of institutions.
2009 California Delta-Water Bill Package Summary (http://gov.ca.gov/issue/water-supply):
A new seven-member board to oversee the Sacramento-San Joaquin River Delta. A 20 percent conservation mandate for urban areas by 2020, with credits for cities
that have made significant conservation efforts. Agricultural entities would have to follow best practices for water use.
New regulations to monitor groundwater levels throughout the state. Increased penalties for illegal water diversions, although the penalties and enforcement
were significantly weakened from an earlier plan. A $11.1 billion bond to pay for the overhaul.
CACS Water Associate Joanna Zhang Page 5
reporting usage3. In addition, there has been limited analysis of broad water usage patterns in higher education.
It was possible to examine best practices at other universities. The most common steps being taken by universities are one with a relatively low upfront cost: education and outreach, enhanced leak detection and repair, improved irrigation practices, and installation of low-flow domestic fixtures (toilets, faucets, and showers). There are also examples of institutions who have reduced water usage in laundries and cooling towers or who have found ways to expand the use of non-potable water (e.g., through water reuse or rainwater capture).
There were few schools, however, who had found it economical to convert all domestic features to low flow or to implement some of the more costly projects (e.g. conversion of all cooling towers to a closed loop system). All such universities identified in this analysis were located in the southeastern United States, which is experiencing a severe drought and possible near-term water shortages. Otherwise, schools reported that relatively low water pricing meant that the financial feasibility of many projects was not sufficient for implementation.
RESEARCH OF EXISTING STUDIES AND POLICIES
There are rich resources of past studies, projects, policies and educational programs regarding water at U.C. Berkeley. One of the key documents evaluated is the “A Sustainable Water Plan for the University of California Berkeley” by Jubilee Daniels 2005.
In the report, Daniels covered historic and current water use and disposal, campus sustainability policies, main campus water audit and result, the residence halls water audit and result, and case studies of water conservation and reuse with new development and major renovations. Critical sections including main campus water audit and residence hall water audit have provided much assistance to the study. The conservation recommendations are illustrated in the graph below.
Figure 1: “A Sustainable Water Plan for University of California Berkeley” (Daniels, 2005) 3 Key differences include how to report use of non-potable water sources and whether institutions were reporting usage by all campus buildings and operations.
CACS Water Associate Joanna Zhang Page 6
DATA COLLECTION
In collaboration with U.C. Berkeley Physical Plant-Campus Services, Cal Housing, and East Bay Municipal Utility District (EBMUD), historical potable water consumption data have been collected and compiled. In the past campus Sustainability Assessments (2005, 2008, 2009), annual consumption was reported as the total of nine main campus meters covering area approximately bounded by Hearst Ave., Piedmont Ave., Bancroft Way and Oxford St. In this study, however, in addition to the above, usage at residence halls and 98 additional water accounts4 outside of the campus boundary is studied. While there are nine major water meters on campus and a number of smaller building meters present, complete historical consumption data have not been reported on an on-going basis. Furthermore, many individual functions/locations currently do not have working water meters, making it difficult to understand usage and trend.
DATA ANALYSIS
There are three main categories of data studied: main campus accounts, 98 additional accounts and Residence Hall accounts.
The nine main campus accounts usage has been provided by Physical Plant-Campus Services (PP-CS).
The usage of 98 ADDITIONAL accounts including nine F & H accounts, one FIRE SERVICE account and 88 OTHER accounts has also been collected from PP-CS. Of the nine F & H accounts, two Lawrence Berkeley National Lab accounts were removed.
Residence hall usage data is based on the historical records provided by EBMUD. It includes the list of accounts under “Housing and Dining” in the EnergyCAP Online system. Because these accounts do not provide the association with specific residence units, educated estimation is made based on investigation of the meter addresses in the system.
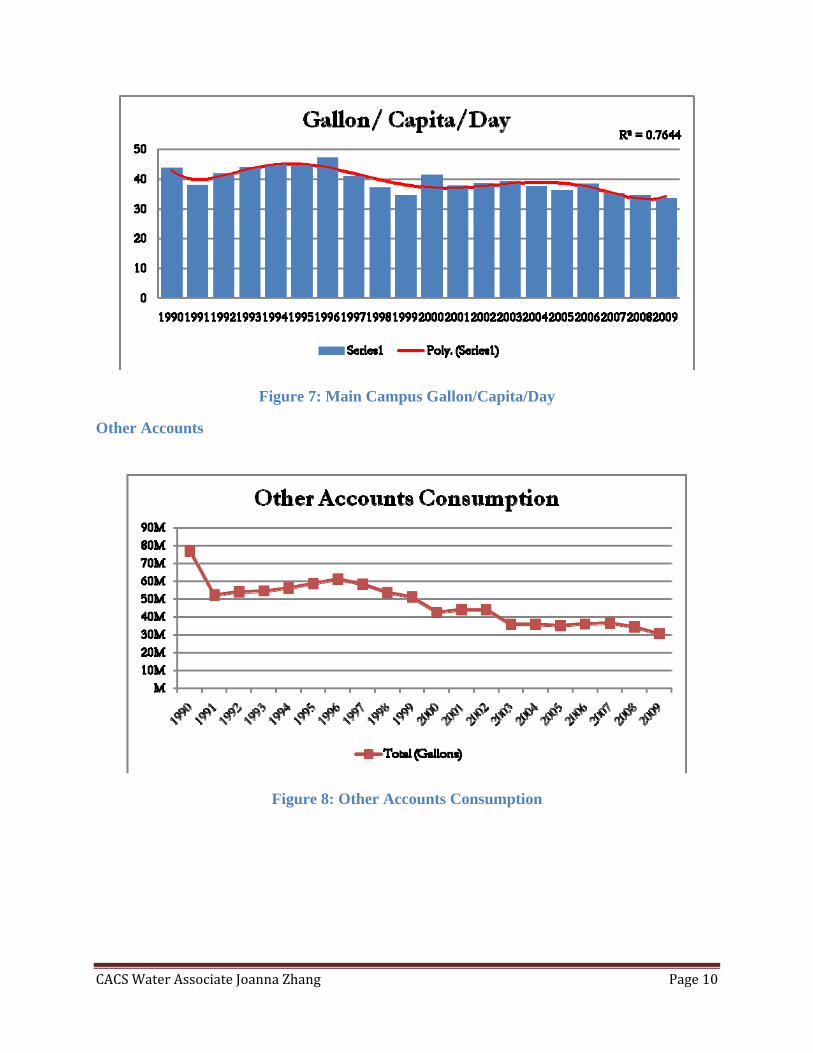
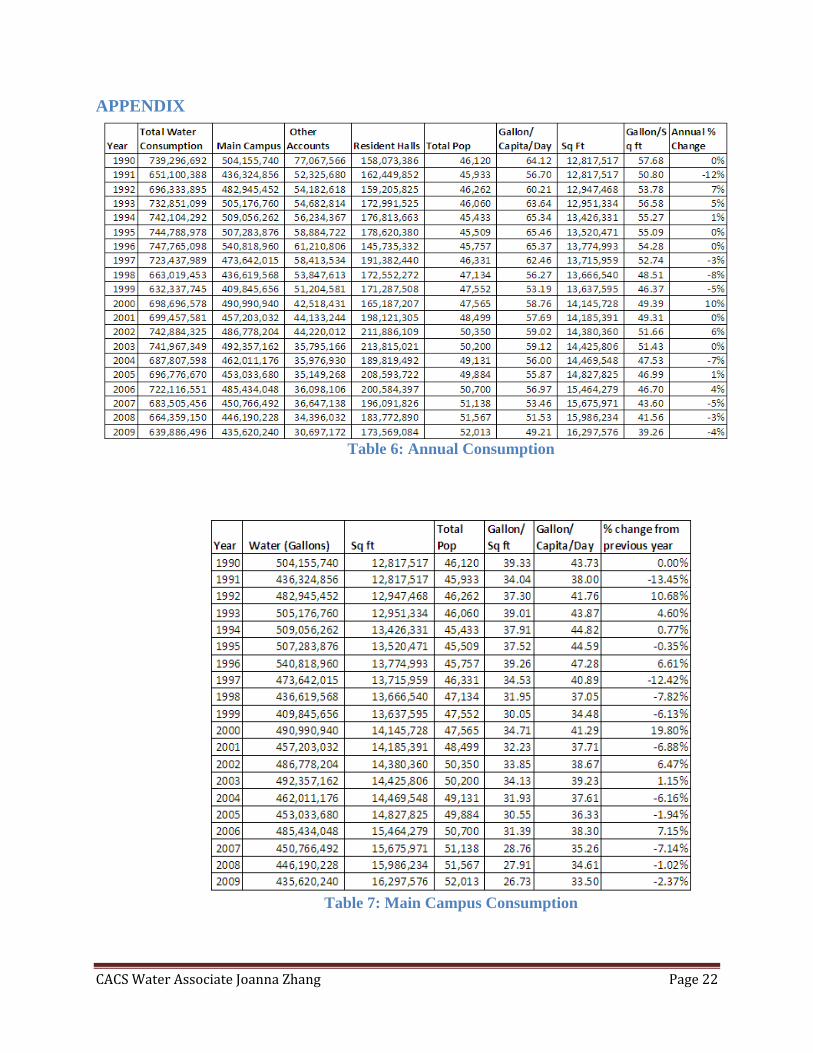
With the complete sets of historical usage data from 1990 to 2009, a trendline analysis is performed to study the usage pattern of the total consumption, main campus, other accounts and residence halls. Overall, other than residence hall usages, all other usages have shown remarkable reduction since 1990.
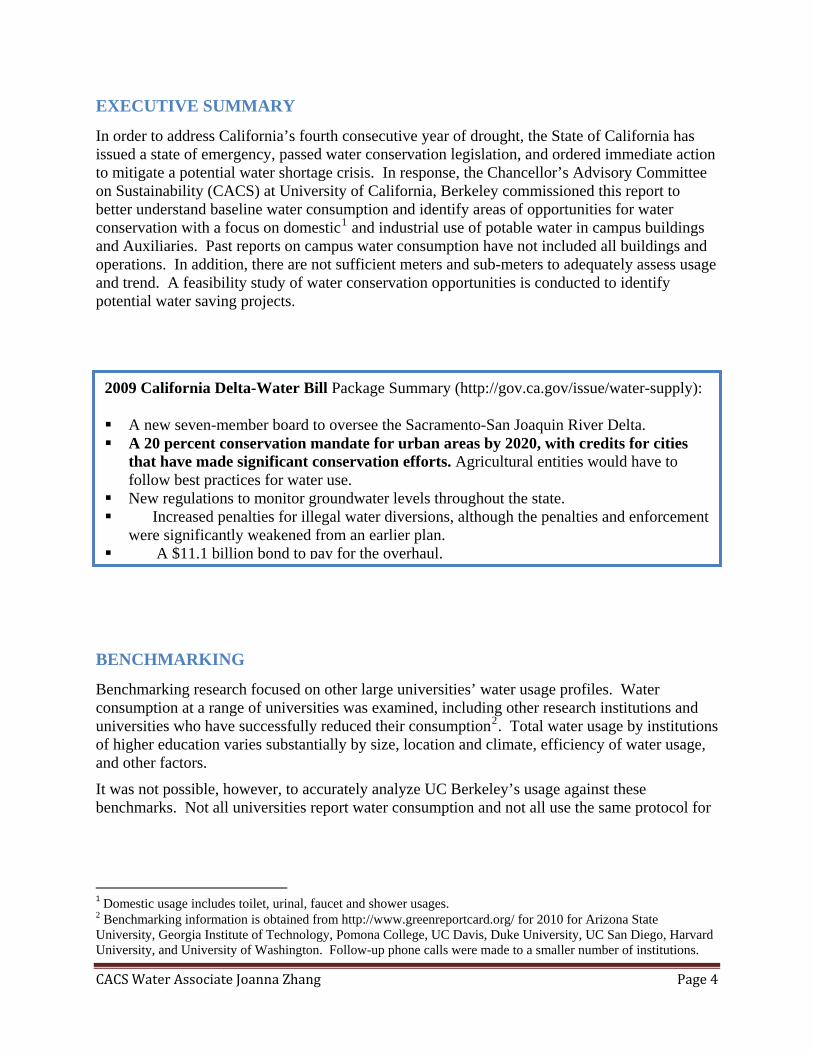
Additional analysis includes gallons/capita/day and gallons/square foot analysis. It is shown by the usage that gallons/capita/day dropped from 64 gallons in 1990 to 49 gallons in 2009 and gallons/square foot dropped from 58 gallons in 1990 to 39 gallons in 2009.
Furthermore, as it is important to understand the breakdown of the total water usage, a categorization has been developed to assist with further analysis. Because 2008 data are most inclusive and accurate, total consumption for 2008 was used for the breakdown analysis. Major categories include “Steam Plant”, “Irrigation”, “Lab Building”, “Domestic—Residence Halls”, “Domestic—Other Buildings”, and “Other”. Among which, “Domestic—Other Buildings” includes all campus domestic usage which is calculated based on the types of the restroom
4 Two accounts for LBNL are excluded (6600791 and 6600801).
CACS Water Associate Joanna Zhang Page 7
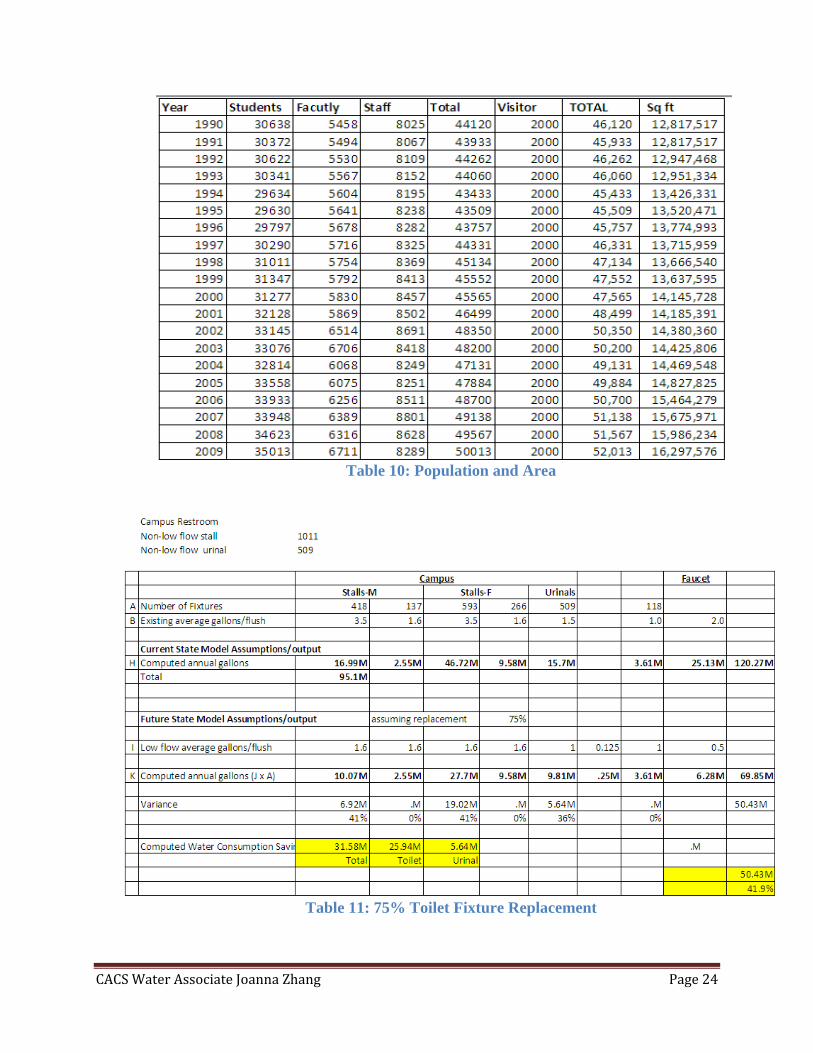
fixtures (3.5 gpf5, 1.6 gpf and etc) and the total campus population (staff, faculty, visitor and student).
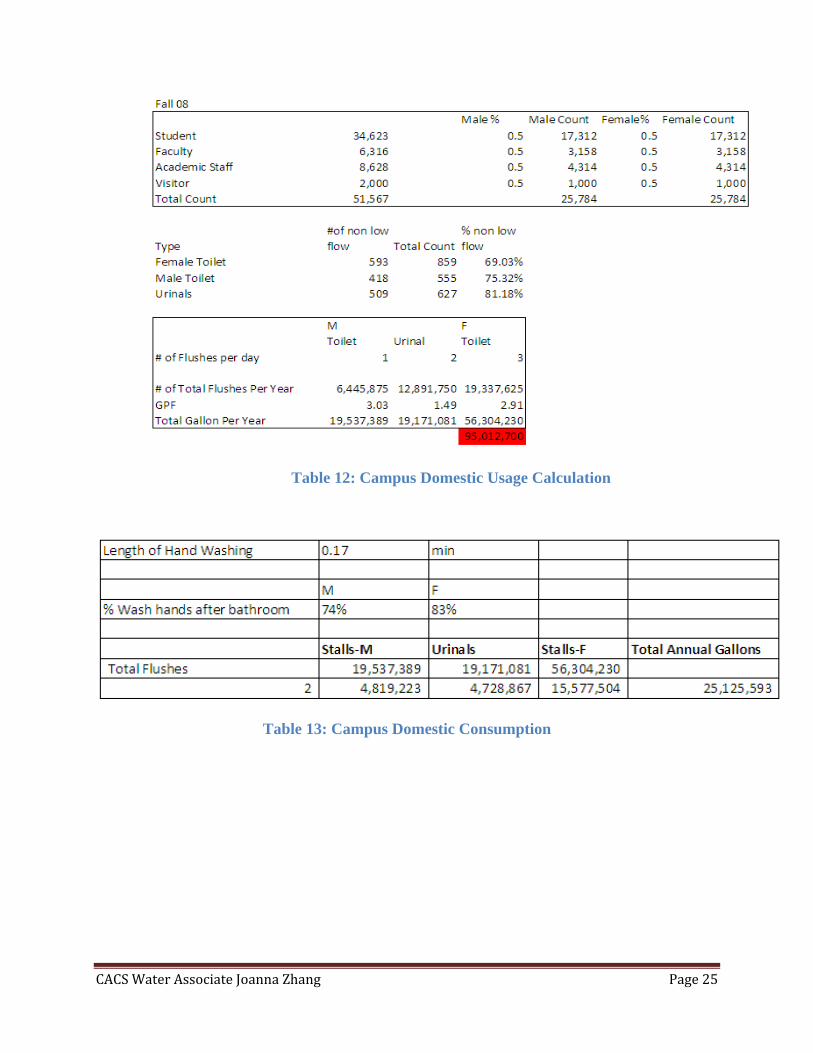
Domestic usage was estimated using an attendance-based analysis method. Assuming an average person (student, staff, faculty, or visitor) uses the restroom three times per day: a female uses the toilet three times, and a male uses the toilet once and the urinal twice. Based on the inventory of campus restroom fixtures, an average gallon per flush is calculated and extrapolated to total annual consumption assuming 250 days per year and 51,000 daily campus populations.
RESULTS
Change in Consumptions between 1990 and 2009
Year 1990 2009 % change
Total Consumption 739,296,692 639,886,496 -13%
Main Campus 504,155,740 435,620,240 -14%
Other Accounts 77,067,566 30,697,172 -60%
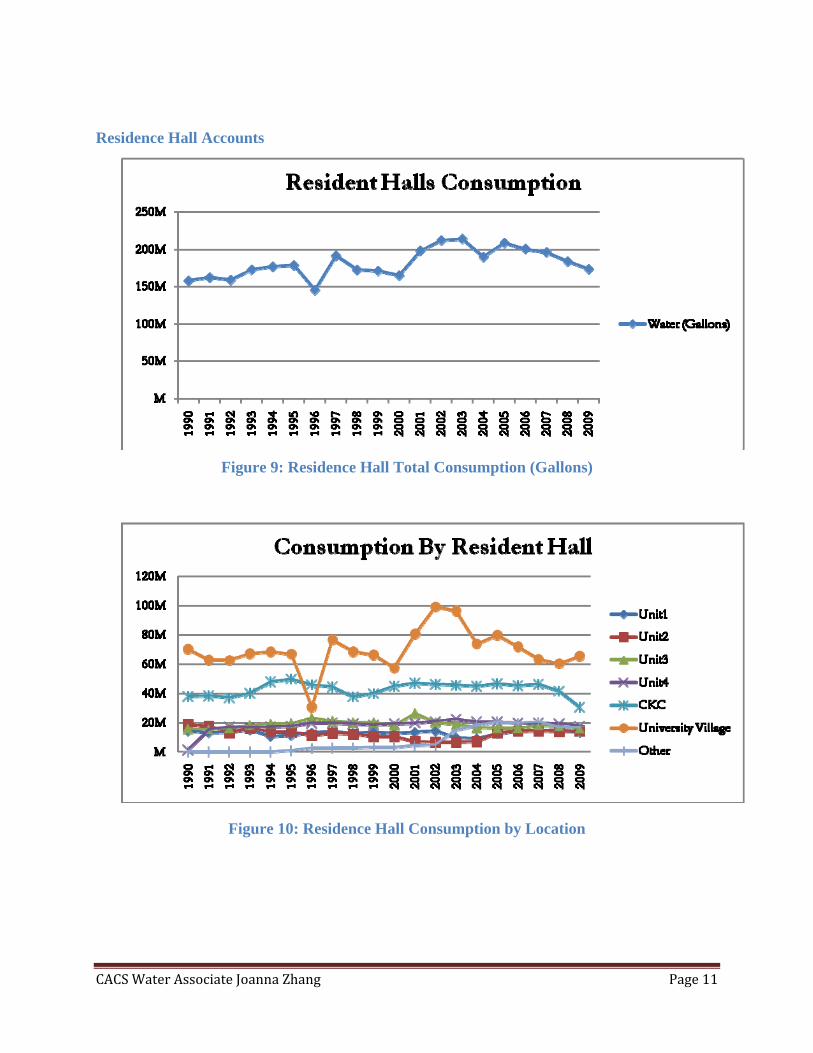
Residence Halls 158,073,386 173,569,084 10%
Table 1: Consumption Change
Total Consumption
Figure 2: Total Water Consumption (Gallons) 5 Gpf stands for gallon per flush.
CACS Water Associate Joanna Zhang Page 8
Figure 3: Total Consumption Gallons/Capita/Day
Figure 4: Total Consumption Gallons/Square Foot
Assumptions/Notes: 1. Total consumption include usage from main campus accounts (9) and additional off
campus accounts (98), including industrial usages and Residence Hall usages. 2. The additional accounts (1990-1997) usage data extrapolation is based on assumption
that usage in these accounts changed by the same percentage as did the main accounts.
CACS Water Associate Joanna Zhang Page 9
3. Total population includes FTE staff, FTE faculty, students, and assumed 2000 visitors per day.
4. Assumed Year = 250 days.
Main Campus Accounts
Figure 5: Main Campus Consumption
Figure 6: Main Campus Gallon/Sq Ft
CACS Water Associate Joanna Zhang Page 10
Figure 7: Main Campus Gallon/Capita/Day
Other Accounts
Figure 8: Other Accounts Consumption
CACS Water Associate Joanna Zhang Page 11
Residence Hall Accounts
Figure 9: Residence Hall Total Consumption (Gallons)
Figure 10: Residence Hall Consumption by Location
CACS Water Associate Joanna Zhang Page 12
Figure 11: 2009 Residence Hall Consumption Breakdown
Assumptions/Notes: 1. 1990-2009 water consumption data are based on EBMUD records which include Unit
1, 2, 3, 4, CKC and Other. (Other includes Channing & Bowditch Apt, Haste Street Child Development Center, Manivlle Apt, RSSP Building, University Village and Westminster)
CACS Water Associate Joanna Zhang Page 13
Consumption Breakdown
Figure 12: 2008 Estimated Campus Usage By Type
Assumptions/Notes: 1. The breakdown is analyzed from the total consumption in 2008 which includes main
campus accounts, other accounts and residence hall accounts. 2. Assume Irrigation includes campus irrigation and residence halls irrigation.
a. Assume current campus metered irrigation only accounts for 95% of campus irrigation.
b. Assume residence halls irrigation accounts for 10% of total residence hall usage.
3. Consumption from labs buildings including Latimer, Stanley, Koshland, LSA, VLSB, Birge, Etcheverry, McCone, Soda, Cory, and Hildebrand is obtained, of which 10% is assumed to be domestic usage and 90% is assumed to be lab usage.
4. Assume 90% of Residence Hall usage is domestic. 5. Assumed 90% of ADDITIONAL accounts is domestic. 6. Assumes "Domestic-Other Buildings" includes campus restroom usages, 90% of
ADDITIONAL account, and RSF showers. a. Assume 25% of RSF visitors shower after exercise. b. Assume gallon per min is 2 at RSF. c. Assume average length of shower is 8 min.
7. Assumes "Other" category includes swimming pools, leaks, and other miscellaneous usage.
CACS Water Associate Joanna Zhang Page 14
Extrapolated Building Domestic- Campus Restroom Water Usage
Figure 13: Estimated Campus Restroom Water Usage
Assumptions/Notes:
1. GPF (Gallon Per Flush) is calculated to be a weighted average for low flow and non low flow fixtures based on Jubilee Daniel’s restroom fixture audits.
2. Assume low flow= 1.6 gpf toilet and 1.0 gpf urinal. 3. Assume non-low flow=3.5gpf toilet and 1.6 gpf urinal. 4. Assume gallon per min for faucets is 2. 5. Assume average length of hand washing is 10 sec. 6. Assume 74% of men and 83% of women wash hands after using the bathroom.
(http://www.asm.org/Media/index.asp?bid=21773) 7. Assume restroom user rate is Females 3 times a day, Males 1 a day for Toilets/ Twice
a day for Urinals (Vickers, 2002). 8. Assume Year = 250 days. 9. Assumed employee Male to Female ratio is 1:1. 10. Total population includes FTE staff, FTE faculty, students, and assumed 2000 visitors
per day.
FEASIBILITY STUDY
A list of feasible projects is identified under three main categories: Possible Main Campus
Project, Possible Auxiliary project, and Other Projects. The following table describes the Main
Campus and Auxiliary Projects.
er Associate Joanna Zhang Page 15
Proposed Project Description
Annual Water Savings (gallons)
Annual Water
Savings (%)
Upfront Capital Cost
($) One Time
Rebate
Net Annual Costs
(Savings) ($)
Simple Payback (years)
Total Net Present Value ($)
Possible Main Campus Projects
General Education & Awareness Campaign
Assumes broad base campus campaign to raise awareness and reduce water usage with unknown impact. $20,000 -$10,000
Install Water Meters in Large Buildings
Install 40 meters assuming $5000 cost per meter which includes PPCS labor costs $200,000
Enhanced Leak Reduction Efforts
Assumes all leaking toilets are repaired (per CalCAP course analysis) 4,265,372 0.6% $10,000 $18,989 0.53 $127,917
Expand Sink Aerator Installations
Assumes 700 additional bathroom sink aerators are changed to 0.5 gpm from 2gpm 6,548,025 1.0% $3,841 $29,151 0.13 $126,636
Campus Toilet Conversion Assumes 75% of toilets are retrofitted to low-flow 25,940,000 3.9% $527,742 $37,913 $115,482 4.24 $2,079,414
Campus Urinal Conversion Assumes 75% of urinals are retrofitted to low-flow 5,640,000 0.8% $265,698 $76,350 $25,109 7.54 $534,963
Assumes reduction in water consumption at Residence Halls and RSF through reducing shower length 16,000,000 2.4% TBD $71,229.95 TBD TBD
Table 2: Project Feasibility
CACS Wat
CACS Water Associate Joanna Zhang Page 16
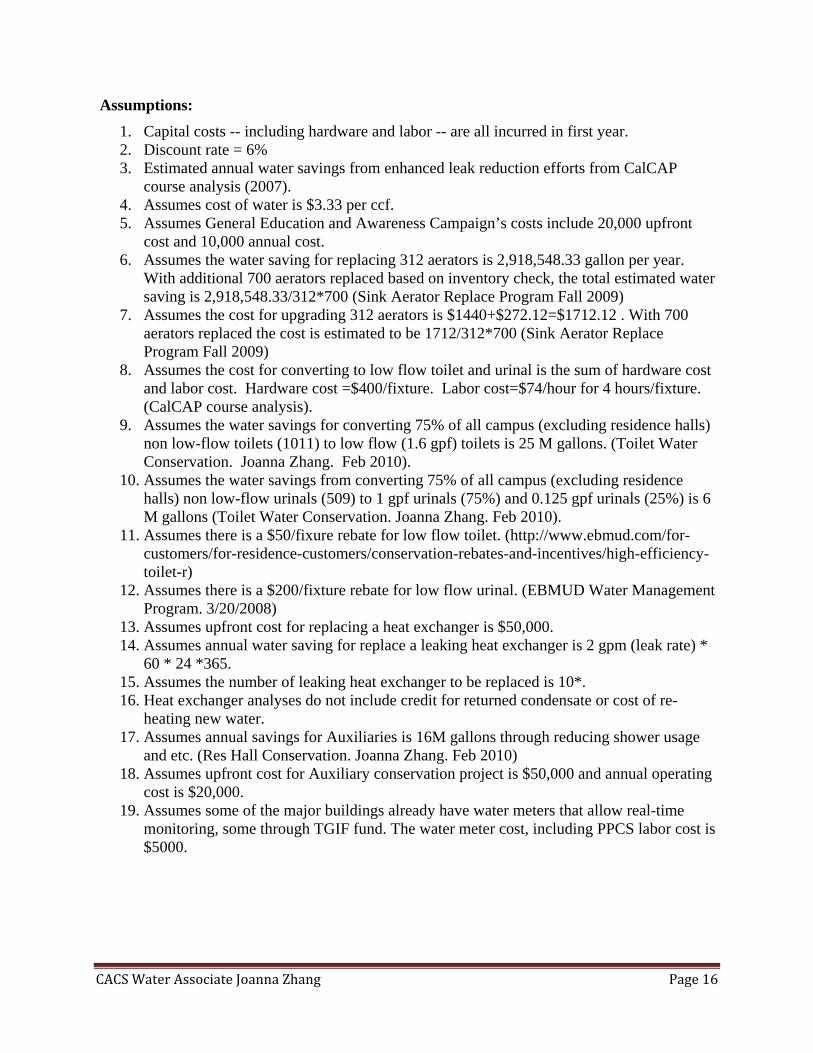
Assumptions:
1. Capital costs -- including hardware and labor -- are all incurred in first year. 2. Discount rate = 6% 3. Estimated annual water savings from enhanced leak reduction efforts from CalCAP
course analysis (2007). 4. Assumes cost of water is $3.33 per ccf. 5. Assumes General Education and Awareness Campaign’s costs include 20,000 upfront
cost and 10,000 annual cost. 6. Assumes the water saving for replacing 312 aerators is 2,918,548.33 gallon per year.
With additional 700 aerators replaced based on inventory check, the total estimated water saving is 2,918,548.33/312*700 (Sink Aerator Replace Program Fall 2009)
7. Assumes the cost for upgrading 312 aerators is $1440+$272.12=$1712.12 . With 700 aerators replaced the cost is estimated to be 1712/312*700 (Sink Aerator Replace Program Fall 2009)
8. Assumes the cost for converting to low flow toilet and urinal is the sum of hardware cost and labor cost. Hardware cost =$400/fixture. Labor cost=$74/hour for 4 hours/fixture. (CalCAP course analysis).
9. Assumes the water savings for converting 75% of all campus (excluding residence halls) non low-flow toilets (1011) to low flow (1.6 gpf) toilets is 25 M gallons. (Toilet Water Conservation. Joanna Zhang. Feb 2010).
10. Assumes the water savings from converting 75% of all campus (excluding residence halls) non low-flow urinals (509) to 1 gpf urinals (75%) and 0.125 gpf urinals (25%) is 6 M gallons (Toilet Water Conservation. Joanna Zhang. Feb 2010).
11. Assumes there is a $50/fixure rebate for low flow toilet. (http://www.ebmud.com/for-customers/for-residence-customers/conservation-rebates-and-incentives/high-efficiency-toilet-r)
12. Assumes there is a $200/fixture rebate for low flow urinal. (EBMUD Water Management Program. 3/20/2008)
13. Assumes upfront cost for replacing a heat exchanger is $50,000. 14. Assumes annual water saving for replace a leaking heat exchanger is 2 gpm (leak rate) *
60 * 24 *365. 15. Assumes the number of leaking heat exchanger to be replaced is 10*. 16. Heat exchanger analyses do not include credit for returned condensate or cost of re-
heating new water. 17. Assumes annual savings for Auxiliaries is 16M gallons through reducing shower usage
and etc. (Res Hall Conservation. Joanna Zhang. Feb 2010) 18. Assumes upfront cost for Auxiliary conservation project is $50,000 and annual operating
cost is $20,000. 19. Assumes some of the major buildings already have water meters that allow real-time
monitoring, some through TGIF fund. The water meter cost, including PPCS labor cost is $5000.
CACS Water Associate Joanna Zhang Page 17
Other Projects to be further analyzed include:
1. More efficient irrigation-- Fix leaks in irrigation system and meter and connect all irrigation systems to the SCADA system.
2. Convert Irrigated Lawns to Dry Meadows-- Project includes a planning charrette, development of planning guide, signage, and lawn conversion of one of multiple possible sites. (Project underway with TGIF funding)
3. Install more efficient dishwashers and laundry machines 4. More efficient lab equipment 5. Cooler Tower Consolidations or Conversion to Closed Loop
COST TABLE Fiscal Year State-Funded
Water & Sewer Expenditures
Recharge Water & Sewer Expenditures
Residence Halls Expenditure
Current Prediction of TOTAL Water & Sewer Expenditures
1. Assumes the Annual Savings is $259,320 per year. 2. Residence hall expenditure is taken from ENERGYCAP Online where the FY cost is
estimated from splitting two Calendar year cost.
REUSE AND RECYCLE OPTIONS
According to “Alternative Water Reuse Scenarios for the UCB Campus with Cost-Benefit Analysis” (2008) by Bojana Anglin, Kristin Maravilla and Lindsay Miller, there are four recycle and reuse scenarios for the UC Berkeley: campus-wide recycled water, treated greywater reuse within a single building (new construction or major upgrades), grey water from dorms and campus buildings for subsurface irrigation and rainwater capture.
The campus-wide recycled water scenario assumes “about half of the water that UC Berkeley campus uses, all of which is currently potable, could be substituted with non-potable water” after it has been treated to a tertiary level. Costs associated with such scenario include pipeline
CACS Water Associate Joanna Zhang Page 18
installation, site assessment, engineering reports, treatment plant, and operational costs (Anglin, Maravilla, Miller, 16).
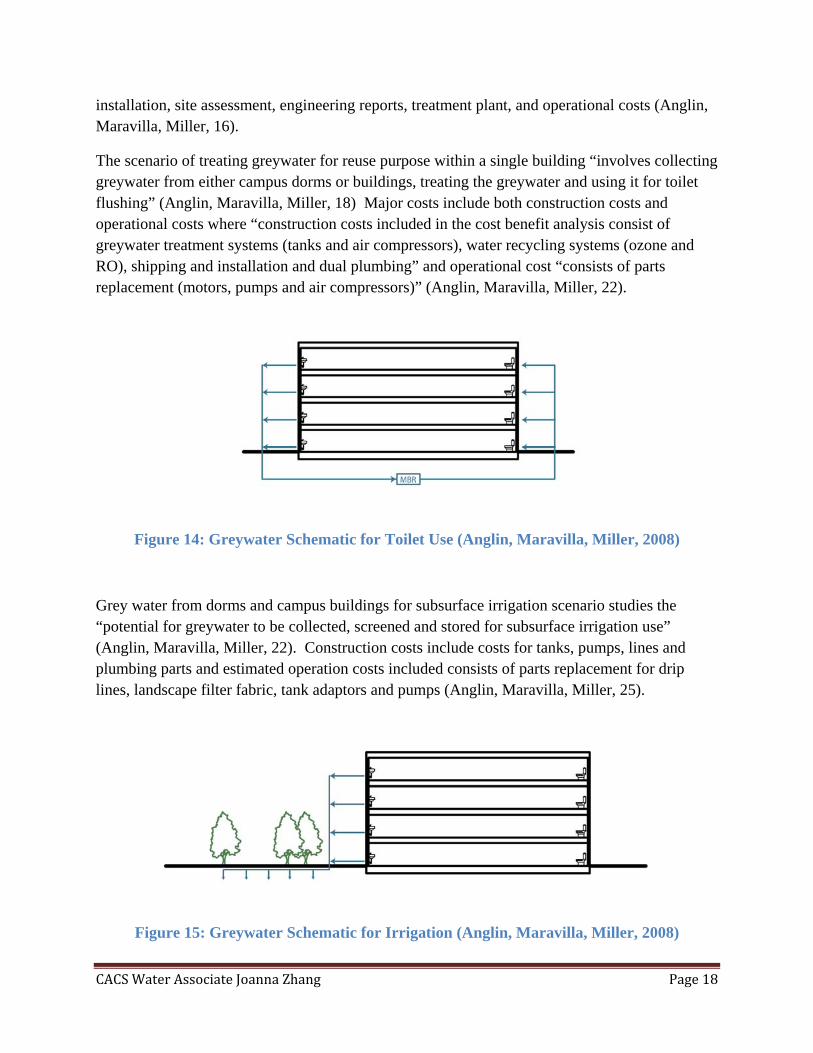
The scenario of treating greywater for reuse purpose within a single building “involves collecting greywater from either campus dorms or buildings, treating the greywater and using it for toilet flushing” (Anglin, Maravilla, Miller, 18) Major costs include both construction costs and operational costs where “construction costs included in the cost benefit analysis consist of greywater treatment systems (tanks and air compressors), water recycling systems (ozone and RO), shipping and installation and dual plumbing” and operational cost “consists of parts replacement (motors, pumps and air compressors)” (Anglin, Maravilla, Miller, 22).
Figure 14: Greywater Schematic for Toilet Use (Anglin, Maravilla, Miller, 2008)
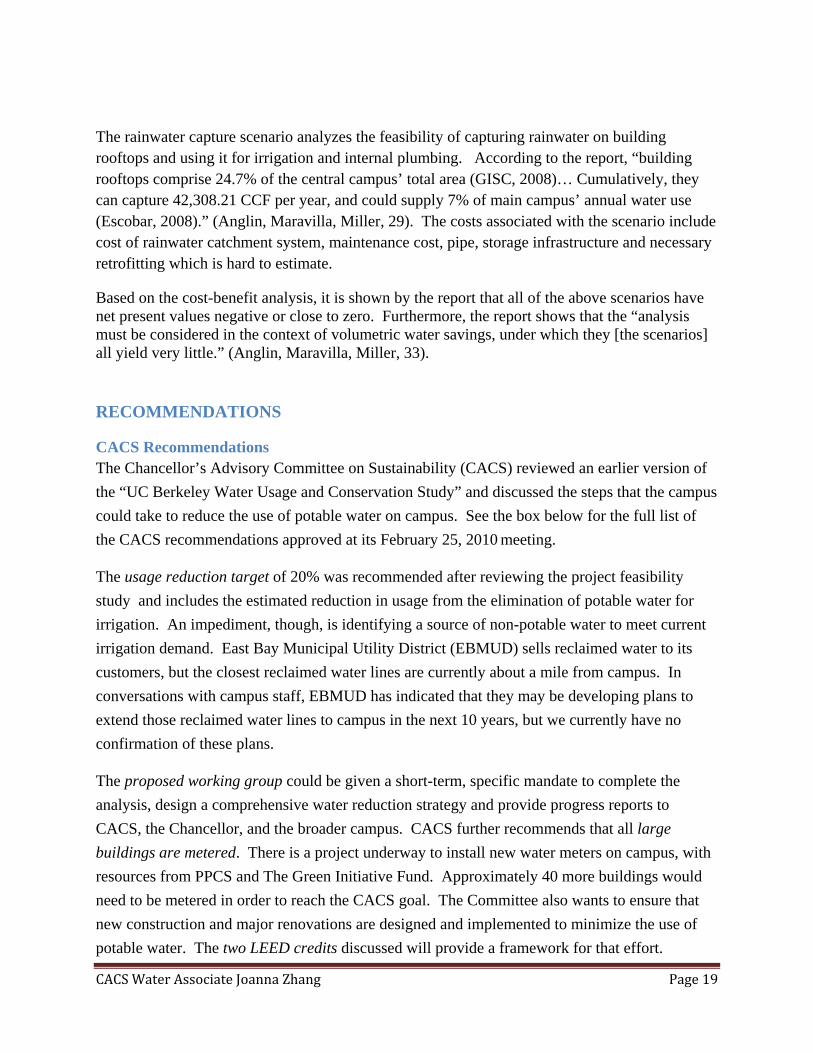
Grey water from dorms and campus buildings for subsurface irrigation scenario studies the “potential for greywater to be collected, screened and stored for subsurface irrigation use” (Anglin, Maravilla, Miller, 22). Construction costs include costs for tanks, pumps, lines and plumbing parts and estimated operation costs included consists of parts replacement for drip lines, landscape filter fabric, tank adaptors and pumps (Anglin, Maravilla, Miller, 25).
Figure 15: Greywater Schematic for Irrigation (Anglin, Maravilla, Miller, 2008)
CACS Water Associate Joanna Zhang Page 19
The rainwater capture scenario analyzes the feasibility of capturing rainwater on building rooftops and using it for irrigation and internal plumbing. According to the report, “building rooftops comprise 24.7% of the central campus’ total area (GISC, 2008)… Cumulatively, they can capture 42,308.21 CCF per year, and could supply 7% of main campus’ annual water use (Escobar, 2008).” (Anglin, Maravilla, Miller, 29). The costs associated with the scenario include cost of rainwater catchment system, maintenance cost, pipe, storage infrastructure and necessary retrofitting which is hard to estimate.
Based on the cost-benefit analysis, it is shown by the report that all of the above scenarios have net present values negative or close to zero. Furthermore, the report shows that the “analysis must be considered in the context of volumetric water savings, under which they [the scenarios] all yield very little.” (Anglin, Maravilla, Miller, 33).
RECOMMENDATIONS
CACS Recommendations The Chancellor’s Advisory Committee on Sustainability (CACS) reviewed an earlier version of
the “UC Berkeley Water Usage and Conservation Study” and discussed the steps that the campus
could take to reduce the use of potable water on campus. See the box below for the full list of
the CACS recommendations approved at its February 25, 2010 meeting.
The usage reduction target of 20% was recommended after reviewing the project feasibility
study and includes the estimated reduction in usage from the elimination of potable water for
irrigation. An impediment, though, is identifying a source of non-potable water to meet current
irrigation demand. East Bay Municipal Utility District (EBMUD) sells reclaimed water to its
customers, but the closest reclaimed water lines are currently about a mile from campus. In
conversations with campus staff, EBMUD has indicated that they may be developing plans to
extend those reclaimed water lines to campus in the next 10 years, but we currently have no
confirmation of these plans.
The proposed working group could be given a short-term, specific mandate to complete the
analysis, design a comprehensive water reduction strategy and provide progress reports to
CACS, the Chancellor, and the broader campus. CACS further recommends that all large
buildings are metered. There is a project underway to install new water meters on campus, with
resources from PPCS and The Green Initiative Fund. Approximately 40 more buildings would
need to be metered in order to reach the CACS goal. The Committee also wants to ensure that
new construction and major renovations are designed and implemented to minimize the use of
potable water. The two LEED credits discussed will provide a framework for that effort.
CACS Water Associate Joanna Zhang Page 20
A
these recomm
conservation
LEED process for new construction and m
should have goals for water cons
e
RBc
these recomm
conservation
LEED process for new construction and m
should have goals for water cons
e
RBc
t the 7th Annual Sustainability Summit on April 21, Chancellor Birgeneau addressed several of
endations. He indicated that funding is being sought to pay for the identified
projects, and indicated that the campus will address water conservation through the
ajor renovations. He also stated that “we ultimately
ervation that are commensurate with the goals we have already
stablished for carbon production.”
t the 7th Annual Sustainability Summit on April 21, Chancellor Birgeneau addressed several of
endations. He indicated that funding is being sought to pay for the identified
projects, and indicated that the campus will address water conservation through the
ajor renovations. He also stated that “we ultimately
ervation that are commensurate with the goals we have already
Commit the University to reduce potable water usage by 20% (from 2008 levels) and to use no potable water for irrigation by 2020.
Establish a working group to oversee the analysis and implementation of reduction projects, drawing membership from faculty, staff, students, auxiliaries, and utilities.
By 2020, ensure all buildings larger than 50,000 ft2 have water meters that allow real-time monitoring of usage and are web enabled.
Beginning June 1, 2010, maximize the number of LEEDTM credits achieved under Water Use Reduction Credits #3 and #4 by all new construction and major renovation projects.
esearch Recommendation esearch Recommendation ased on the findings of this research report, a few additional recommendations are made to the ampus. ased on the findings of this research report, a few additional recommendations are made to the ampus.
Table 5: Research Recommendations Table 5: Research Recommendations
Research Recommendations
Setting a reduction target with specific planned projects.
Installing water meters on major campus buildings that allow real-time monitoring of usage and are web enabled.
Promoting education and awareness campaigns.
Investigating more recycle and re-use options.
CACS Water Associate Joanna Zhang Page 21
SPECIAL THANKS Thanks to multiple stakeholders without whom the report would have been possible.
Lisa McNeilly: for guiding the entire research and providing valuable inputs.
Chancellor’s Advisory Committee on Sustainability: for providing useful data and important comments.
Kira Stroll, Judy Chess, Lisa Bauer, Irene Seliverstov
East Bay Municipal Utility District: for providing vital residence hall usage data.
Charles Bohlig, Maureen O'Toole, James Carmody
Past Research and Projects: for providing valuable research findings.
Jubilee Daniels, Bojana Anglin, Kristin Maravilla, Lindsay Miller
Physical Plant-Campus Service: for providing essential campus account usage data.
Sara Shirazi, Gilbert Escobar, Ben Palaima
Residence & Student Service Programs: for providing central information on projects and initiatives.
Jeff Urdahl, Larry Taylor
REFERENCE LIST
1. Amy Vickers. “Handbook of Water Use and Conservation”. 2002. 2. EnergyCAP Online. <http://web.energycap.com/energycap/> 3. Jubilee Daniels. “A Sustainable Water Plan for University of California Berkeley.” 2005. 4. California Department of Water Resources. 2009 Comprehensive Water Package.