VOLUME 15 - ISSUE 1 - JUNE, 2013 SCIENTIFIC JOURNAL OF SPORT AND PHYSICAL EDUCATION UDC 796.011 FACULTY OF SPORT AND PHYSICAL EDUCATION UNIVERSITY OF SARAJEVO FACULTY OF SPORT AND PHYSICAL EDUCATION UNIVERSITY OF SARAJEVO
Transcript
VOLUME 15 - ISSUE 1 - JUNE, 2013
SCIENTIFIC JOURNAL OF SPORT AND PHYSICAL EDUCATION
UDC 796.011
FACULTY OF SPORT ANDPHYSICAL EDUCATIONUNIVERSITY OF SARAJEVO
FACULTY OF SPORT ANDPHYSICAL EDUCATIONUNIVERSITY OF SARAJEVO
FACULTY OF SPORT ANDPHYSICAL EDUCATIONUNIVERSITY OF SARAJEVO
Grgantov Zoran, Krstulović Saša and Jurko DamirMETRIC CHARACTERISTICS OF SOME JUMPING ABILITIY TESTS IN BOYS – DIFFERENCES BETWEEN VOLLEYBALL AND NON-VOLLEYBALL PLAYERS
Antonio Perić, Goran Marković, Asim Bradić and Dražan DizdarTHE WEIGHTED EXPERT SYSTEM FOR THE EVALUATION OF ACTUALQUALITY OF TOP-LEVEL SOCCER PLAYERS
Srđan Pavlović, Munir Talović, Besalet Kazazović, Elvir Kazazović and Rasim LakotaDIFFERENCES IN BASIC MOTOR AND SITUATIONAL MOTOR ABILITIES OF FEMALE HANDBALL PLAYERS AT VARYING LEVELS OF COMPETITION
Igor Vučković, Aleksandar Kukrić, Borko Petrović and Radenko DobrašSELECTION OF YOUNG BASKETBALL PLAYERS: ARE PHYSICAL CHARACTERISTICS THE MOST IMPORTANT?
Siniša Kovač, Rasim Lakota and Monika KapetanovićKINEMATIC RESEARCH OF IMPROVEMENT THE FACT THAT SHORTER AND DIRECT SKIING LINE ACHIEVED HIGHER SPEED WHILE PASSING THOUGHT SLALOM GATES
Martina Mavrin JeličićTRANSFORMATIONAL EFFECTS OF THE MBS YOGA PROGRAM ON TREATED MOTOR STATUS
Jelaska Igor, Grgantov Zoran and Lukas TajnaPREVALENCE AND TOPOLOGY OF PAIN IN PROFESSIONAL MALE AND FEMALE TEN-NIS PLAYERS
Zorislava Bajić, Nenad Ponorac, Nela Rašeta and \orđe BajićBODY COMPOSITION CHANGES UNDER THE INFLUENCE OF AEROBIC PHYSICAL ACTIVITY
Safet KapoPERFORMANCE ANALYSIS OF THE FINALISTS OF THE K-1 GRAND PRIX TOURNA-MENTS 1993-2004
Eldan KapurVARIATIONS IN DIAPHYSEAL NUTRIENT FORAMINA IN HUMAN LOWER LIMB LONG BONES
Instructions for Autors
5
10
20
26
31
36
42
47
53
57
62
Volume 15 – Issue 1 – June, 2013
HOMO SPORTICUS ISSUE 1 20134
HOMO SPORTICUS ISSUE 1 2013 5
Grgantov Zoran1, Krstulović Saša1 and Jurko Damir1
Metric Characteristics of some Jumping Abilitiy Tests in Boys – Differences between Volleyball and Non-Volleyball Players1 Faculty of Kinesiology, University of Split, Croatia
Original scientific paper
AbstractThirty-nine boys (28 non-volleyball players and 11 volleyball players) were tested by the Powertimer machine with the aim of analyzing the metric characteristics of jumping ability tests. Squat jump tests (SJ) were used on the examinees, as well as counter-movement jump (CJ) and approach jump tests (AJ). Good met-ric characteristics of all tests have been established (reliability, sensitivity, homogeneity and validity). Both groups of examinees showed very little difference of jump height in the CMJ test, in re-lation to the SJ test (less than 1 cm). Inefficient transition from the eccentric to the concentric muscle action, as well as the usage of preparatory movements, even in the static position test (SJ), was the possible cause of these results. The differences of the results in AJ and CMJ tests are 6 cm in non-volleyball players and 11 cm in volleyball players. The volleyball players achieved significantly higher results in all tests in relation to the non-volleyball play-ers, especially in AJ test. In SJ and CMJ tests volleyball players jumped on average 4 cm higher than the non-volleyball players, while the difference in the AJ test was 9 cm. The applied tests can be used in lower body strength evaluation in the non-volleyball players sample, but bearing in mind that in young volleyball play-ers strength differentiation sets in – the elastic and the explosive components appear, that should be tested separately.
SažetakS ciljem analiziranja metrijskih karakteristika testova skočnosti, kao i značajnosti razlika između neodbojkaša i odbojkaša, 39 dječaka (28 neodbojkaša i 11 odbojkaša) testirano je na Powerti-mer uređaju. Ispitanici su izmjereni s testovima squat jump (SJ). countermovement jump (CJ) i approach jump (AJ). Utvrđene su dobre metrijske karakteristike svih testova (pouzdanost, osjetlji-vost, homogenost i valjanost). Kod obje grupe ispitanika utvrđene su vrlo male razlike u visini skoka u testu CMJ u odnosu na test SJ (manje od 1 cm). Neučinkovit prelaz iz ekscentrične u koncen-tričnu mišićnu akciju, kao i korištenje pripremnih pokreta i u testu iz statične pozicije (SJ) mogući su razlozi takvih rezultata. Razlike između rezultata u testovima AJ i CMJ su 6 cm kod neodbojkaša i 11 cm kod odbojkaša. Odbojkaši su u svim testovima postigli značajno bolje rezultate u odnosu na neodbojkaše, a naročito u testu AJ. U testovima SJ i CMJ odbojkaši u prosjeku više skaču od neodbojkaša 4 cm., a u testu AJ 9 cm. Primjenjeni testovi mogu se koristiti za procjenu snage nogu na uzorku neodbojka-ša, ali kod mladih odbojkaša početnika dolazi do diferencijacije snage na elastičnu i eksplozivnu komponentu koje treba zasebno testirati.
Power is one of the most important biomotor abilities in volleyball, and vertical jumping ability is its most important manifestation (Jurko et al. 2008, Borras et al. 2011, Grgan-tov et al. 2013, Milić et al. 2013). For a long time, jumping ability in volleyball was estimated exclusively by standing vertical jump or from a volleyball approach from wall or vertec measuring scales. The advantage of such tests is their specificity, and the disadvantage is the impossibility of analyzing certain jumping ability components (concentric component, elastic component, arms attribution, volleyball approach influence etc.). These are the reasons why during the last few decades different diagnostic apparatus are be-ing increasingly used (ergo jump, just jump, power timer,
opto jump, IR-mat etc.), which can also estimate the verti-cal jumping ability (Hoffman and Kang 2002, Bosquet et al. 2009, Enoksen et al. 2009, Glattthorn et al. 2011, Nuzzo et al. 2011). Tests for estimation of certain jumping ability components have been constructed using these systems (squat jump, counter movement jump with and without arm swing, drop jump, etc.). Past research had also con-firmed good metric characteristics of the mentioned tests (Marković et al. 2004, Caruso et al. 2010). Most of the past volleyball research have analyzed certain jumping ability components and metric characteristics of the evaluation test, using the sample of senior players. However, jump-ing ability evaluation is not important only in adult athletes. Very useful information for the training process and the pro-cess of selection can be obtained by the analysis of certain
HOMO SPORTICUS ISSUE 1 20136
jumping ability components in youth volleyball players, as well as in children who are not in volleyball training yet, while their volleyball potential should be estimated by tests. The available references show that the authors did not find a single research that analyzed the metric characteristics of the vertical jumping ability tests (squat jump, countermove-ment jump and approach jump) on the population of young volleyball players and non-volleyball players.
Therefore, the basic aim of this research was to analyze metric characteristics of the vertical jumping ability esti-mation tests on the Powertimer device using the sample of young boys. The special aim was to analyze the differ-ences of these tests results in young volleyball players and non-volleyball players.
Materials and Methods
Participants: The research was conducted on the sample of 39 boys, aged 11 to 13, participants of Kaštela mini vol-leyball championship. From the total number of examinees, 28 boys have never practiced volleyball (non-volleyball players), while the remaining 11 boys have actively prac-ticed volleyball in Mladost volleyball club in Kaštela (volley-ball players), 3-4 times a week in the period of 2-3 years.
Apparatus: The examinees were tested on the Powertimer portable device, made by a Finnish sports testing devices manufacturer Newtest. The device consists of a mat with sensors, a data collecting console, and a program pack-age on the portable computer that automatically processes and saves data. The device measures the time from the moment the examinee leaves the mat until the next con-tact with the ground. Prior to the test, the examinee`s body mass was entered into the program, so that the device was able to calculate the height and the power of the jump.
The results of the following tests were measured:1. Squat jump: The examinee was standing on the con-
tact mat in a squat position (the angle between the lower body and thigh was 90 degrees, the trunk was as erect as possible, and the hands were akimbo). Af-ter 3 seconds in that position the examinee attempted to jump as high as possible by straightening his lower body. The landing was performed with lower body as straight as possible.
2. Countermovement jump (CMJ): The examinee was standing on the contact mat with his lower body straight and arms akimbo. From this position he low-ered himself to a squat position (position described in the first test) and immediately jumped upwards by straightening his lower body. The landing was per-formed as described in the first test.
3. Approach jump (AJ): After performing a take-off fol-lowing a three steps approach the examinee jumped onto the contact mat with two feet and jumped as high as possible using the arms swing as well. The landing was performed as described in the first two tests.
More detailed instructions on the correct performance of the test can be found in a research by Acera et al. (2011). Each examinee performed a standardized 15-minute warm-up consisting of general movements and dynamic and static stretching, prior to the testing. Each test was performed three times with 2-3 minutes pauses between the repetitions.
Procedures: The reliability of the measuring instruments was analyzed based on the test items intercorrelation ma-trix. Also, an inter-item correlation and Cronbach alpha coefficients have been calculated. The homogeneity of the measuring instruments was confirmed based on the analy-sis of variance between the items. Distribution normality was tested by applying the Kolmogorov-Smirnov test (KS). Basic descriptive statistic indicators have been calculated on the condensed variables (the best results in three test repetitions have been chosen): mean (M), standard devia-tion (SD) and maximum result (MIN and MAX).
Factor validity of the jumping ability estimation measuring instruments was established using the factor analysis of the principal components, according to Guttman – Kaiser criterion, and by correlation analysis - the degree of rela-tion between the jumping ability estimation variables. Prag-matic value of the measuring instruments was established by using variance analysis of the observed groups (non-volleyball players - volleyball players).
Results
The results displayed in Table 1 show that all the variables were highly reliable, based on the Cronbach alpha value and inter-item correlation. The jumping ability evaluation tests were somewhat more reliable in the volleyball players sample than in the non-volleyball players. The lowest cor-relations between the items were observed in the CMJ test on the sample of non-volleyball playing boys.
Table 1. Item intercorrelation and values of reliability coefficients for all the applied variables in male non-volleyball players (N=28) and male volleyball players (N=11)
SJ – squat jump; CMJ – counter movement jump; AJ – approach jump; CA - Cronbach alpha coefficient ; IIR-average inter-item correlation
VariablesNON-VOLLEYBALL
PLAYERSVOLLEYBALL
PLAYERS
CA IIR CA IIR
SJ 0,87 0,73 0,93 0,88
CMJ 0,81 0,59 0,97 0,93
AJ 0,92 0,81 0,97 0,94
HOMO SPORTICUS ISSUE 1 2013 7
Table 2 shows the average results of certain test items. The significance of the result difference between the mea-suring items in certain tests was tested by the analysis of variance.
Based on the gained results, a conclusion can be made – all jumping ability tests in both subsamples showed good homogeneity.
The obtained results of the KS test (table 3) were lower than the limit values, leading towards the conclusion that the tested variables distribution did not differ significant-ly from the normal distribution. Since this was the case, further analysis could use parametric methods of data analysis. The T-test determined significant differences be-tween the volleyball players and the non-volleyball players. Both groups of examinees showed very little difference in jump height in the CMJ test in relation to the SJ test (less than 1 cm). The difference in jump height between the AJ and CMJ test was higher; in non-volleyball players it was somewhat less than 6 cm, and in volleyball players it was above 11 cm. The volleyball players achieved significantly better results than the non-volleyball players in all tests, and especially in AJ test. The SJ and CMJ tests showed
that volleyball players on average jump more than 4 cm higher, and in the AJ test more than 9 cm higher than the non-volleyball players.
Relatively high correlations between the tests on the non-volleyball players subsample showed that these tests prob-ably measured the same latent dimension (motor ability), which was also confirmed by factor analysis. This factor can be called lower body strength. However, squared val-ues of the correlation coefficient showed that less than 30% of variance of one variable had been explained by another variable, which was not sufficient for a claim that they had a mutual object of measuring. High correlation was obtained between the AJ and the CMJ test in the sample of volleyball players, as well as low correlation between the SJ test and the CMJ and AJ tests. Therefore, it was no surprise that fac-tor analysis resulted in two factors. High projections onto the first factor, explaining the 58% of the overall variance of the system, were noticed in the CMJ and AJ tests. Both tests showed a transition from the eccentric to the concen-tric muscle action, so this factor can be called lower body reactive power. Only the SJ test, characterized by concen-tric contraction, had a high projection onto the second fac-tor, and can be called lower body explosive power.
Table 2. Analysis of variance for the test items in male non-volleyball players (N=28) and male volleyball players (N=11)
M1-M3 –means of certain test items; F-F test; p- significance level
Table 3. Descriptive indicators, sensitivity and significance of differences of the applied tests between the non-volleyball players and the volleyball players
M –mean; MIN – minimum result; MAX – maximum result; SD – standard deviation; KS – Kolmogorov-Smirnov distribution normality test; * - limit value of the KS-test for N=28 is 0.25; **- limit value of the KS-test for N=11 is 0.39
Table 4. Correlation between the tests and their latent structure on the subsamples of non-volleyball players and volleyball players
F1 and F2 – components obtained by factor analysis; EKSPL: VAR.- explained component variance; PRP.TOTL.- proportion of the explained component variance.
HOMO SPORTICUS ISSUE 1 20138
Discussion
The basic aims of this research were: to establish metric characteristics of the jump ability tests using the power-timer device, and to determine the significance of differ-ences between junior male volleyball players and junior male non-volleyball players. Good metric characteristics of all tests have been established (reliability, sensitivity, ho-mogeneity and validity). Good test homogeneity indicated the fact that the learning process and fatigue did not in-fluence the results. The authors assumed that they would observe a trend of result growth in non-volleyball players from the first item to the third one in the AJ test, however, this never occurred. It is not to be expected for the junior male non-volleyball players to stabilize their performance after only several trial attempts. It is more probable that, due to the complexity of the performance, such a low num-ber of attempts did not result in intermuscular coordination improvement. Therefore, future research should dedicate 1-2 training sessions to the perfection of the two foot take-off performance after the volleyball approach in junior male non-volleyball players. This way, the possibility of the per-formance technique affecting the tests results would be significantly lowered.
Based on the results obtained by correlation and factor analysis a conclusion can be made that the applied tests can be used in lower body strength evaluation on the sample of non-volleyball players, but also that strength dif-ferentiation occurs even in young volleyball players, result-ing in elastic and explosive components, which should be separately tested. The pragmatic validity of the test was confirmed by their ability of distinguishing volleyball play-ers from the non-volleyball players.
The comparison of the results of the tests applied on young volleyball players and non-volleyball players showed that young volleyball players had significantly better results in the tests. This is probably a consequence of the selection process, and partially of the influence of the training pro-cess, which develops vertical jumping ability by perform-ing a great number of repetitions. In relation to the data obtained on the sample of adult athletes (Hara et al. 2008, Borras et al. 2011), young volleyball players and non-vol-leyball players in this research had a less expressed result growth in the CMJ test, in relation to the SJ test. Mastelić et al. (2012) obtained a very similar results growth trend on the sample of young female volleyball players. Harman et al. (1990) explained better jumps after the preparation (CMJ) in contrast to the jumps from the fixed position (SJ) by a higher level of lower leg stretching muscles activation and a higher level of force generated in the eccentric phase, fully expressed in the concentric phase. This eccentric component is not present in the jump from a fixed position (development of high values of ground reaction force de-mands certain amount of time and path). The consequence of the above stated is a higher acceleration during take-off, also meaning a higher jump in the CMJ test, in relation to
the SJ test. The inefficient transition from the eccentric to the concentric muscle action, as well as the usage of the preparatory movements even in the static position test (SJ) might have been the reasons of the lower difference of the SJ and CMJ tests in young volleyball players. Harman et al. (1990) indicated the minor preparatory movements which are often unnoticed but can be observed through the mini-mum forces of ground reaction, somewhat lower than the body mass. It can be assumed that those movements are even more noticeable in young athletes, indicating a need of previous practice of the SJ test. The approach and the arm swing also had a positive influence on the jump height (Lees et al. 2004). This influence is based on the greater number of factors that jointly enable storage of a higher amount of energy during the eccentric phase of the jump, as well as during the first part of the concentric (propul-sive) phase. This energy enables greater body accelera-tion and higher jump in the finishing part of the propulsive phase. The AJ test is very similar to the spike, performed by young volleyball players during training sessions. It is much more demanding in coordination than the previous tests, and a great number of repetitions are necessary so as to master the performance technique of the test. This is probably the most important reason why young volleyball players use the approach and the arm swing much better than the non-volleyball players (the difference of the results in the AJ and CMJ tests was 11 cm in volleyball players and 6 cm in non-volleyball players).
Conclusion
Although the specificity principle should be accepted in sports training, it is also very important to analyze the ba-sic abilities and knowledge of the young athletes. Vertical jumping ability is surely one of the most important mo-tor abilities in volleyball. Therefore, it is very important to find the tests that would have good measuring character-istics in evaluating this ability. The results of this research showed that the SJ, CMJ and AJ tests performed on the Powertimer device fulfill those demands. Those tests can be used not only in observing the development of certain jumping ability in young volleyball players, but also in the process of selection of young boys who never played vol-leyball. Significantly better results achieved by young vol-leyball players in all the jumping ability tests indicated their importance in volleyball success. A very low difference in the CMJ test results, in relation to the SJ test, indicated the need of exercises within training sessions which use own body weight and minimum outer weights, and especially plyometric low intensity exercise. These exercises should emphasize the correct performance technique. Future re-search should even out the number of examinees of the subsamples, and define the group of non-volleyball play-ers more clearly (e.g. consider only boys who practice the same sport or boys who do not practice any sport), with the aim of obtaining more reliable information on the differences between volleyball players and non-volleyball
HOMO SPORTICUS ISSUE 1 2013 9
players in jumping ability tests. Also, it is important to men-tion that during the AJ test performance the examinees had trouble with the insufficient contact take-off and landing surface. The author assumes that the examinees could not perform maximum approach and take-off. To determine this, the author suggests future research should compare the results obtained via Powertimer device with the results obtained from jumps performed from vertec or wall mea-suring scale.
References
Acero RM. Fernández-del Olmo M, Sánchez JA, Otero XL, Aguado X, Rodríguez FA. (2011). Reliability of squat and countermovement jump tests in children 6 to 8 years of age. Pediatr Exerc Sci. 23:151-160.
Bobbert MF, Casius L JR. (2005). Is the Effect of a Coun-termovement on Jump Height due to Active State Deve-lopment? Med Sci Sports Exerc. 37:440–446.
Borras X, Balius X, Drobnic F, Galilea P. (2011). Vertical jump assessment on volleyball: A follow-up of three sea-sons of a high-level volleyball team. J Strength Cond Res. 25: 1686–1694.
Bosquet L, Berryman N, Dupuy O. (2009). A comparison of 2 optical timing systems designed to measure flight time and contact time during jumping and hopping. J Strength Cond Res. 23:2660-2665.
Caruso JF, Daily JS, Mclagan JR, Shepherd CM, Olson NM, Marshall MR, Taylor ST . (2010). Data reliability from an instrumented vertical jump platform. J Strength Cond Res. 24:2799–2808.
Enoksen E, Tønnessen E, Shalfawi S. (2009). Validity and reliability of the Newtest Powertimer 300-series testing system. Journal of Sports Sciences. 27:77-84.
Glatthorn JF, Gouge S, Nussbaumer S, Stauffacher S, Im-pellizzeri FM, Maffiuletti NA. (2011).Validity and reliability of Optojump photoelectric cells for estimating vertical jump height. J Strength Cond Res. 25:556–560.
Grgantov Z, Milić M, Katić R. (2013). Identification Of Ex-plosive Power Factors As Predictors Of Player Quality In Young Female Volleyball Players. Collegium Antropologi-cum. 2:61-69.
Harman E, Rosenstein AMT, Frykman PN, Rosenstain RM. (1990). The effects of arms and countermovement on ver-tical jumping. Med Sci Sports Exerc.22:825-833.
Hoffman JR and Kang J. (2002). Evaluation of a new anaerobic power testing system. J Strength Cond Res. 16:142–148.
Jurko D, Grgantov Z, Čular D. (2008). Razlike u visini tijela, te visini dohvata za smeč i blok kod vrhunskih juniorskih odbojkašica različite situacijske uspješnosti U B. Maleš (ur.), Zbornik radova međunarodnog znanstvenog kongre-sa „Suvremena kineziologija“, Mostar. 127–131.
Lees A, Vanrenterghem J, Clercq DD. (2004). Understand-ing how an arm swing enhances performance in the verti-cal jump. Journal of Biomechanics. 37:1929-1940.
Markovic G, Dizdar D, Jukic I, Cardinale M. (2004). Reli-ability and factorial validity of squat and countermovement jump tests. J Strength Cond Res.18:551–555.
Milić M, Grgantov Z, Katić R. (2013). Impact of Biomotor Dimensions on Player Quality in Young Female Volleybal Players. Collegium Antropologicum. 37:93-99.
Nuzzo JL, Anning JH, Scharfenberg JM. (2011). The reli-ability of three devices used for measuring vertical jump height. J Strength Cond Res.25:2580–2590.
Submitted: June 01, 2013Accepted: June 19, 2013
Correspondence to:Zoran Grgantov, PhDFaculty of KinesiologyUniversity of SplitTeslina 6, 21000 - Split, CroatiaPhone number: +385 91/169-8852E-mail: [email protected]
HOMO SPORTICUS ISSUE 1 201310
Antonio Perić1, Goran Marković2 Asim Bradić2 and Dražan Dizdar2
The Weighted Expert System for the Evaluation of ActualQuality of Top-level Soccer Players1 3rd Comprehensive Grammar Secondary School, Zagreb, Croatia2 Faculty of Kinesiology, University of Zagreb, Croatia
Original scientific paper
AbstractDue to the high complexity of the game of soccer match, official match statistics as well as physiological and performance parameters are insufficient to provide information for a comprehensive evaluation of the actual quality of soccer players. In the present study, a new criterion system is proposed for the expert evaluation of actual quality of soccer players in both phases of the game. The proposed criterion system consists of 19 criteria for the evaluation of player’s actual quality - 7 for play in the phase of defense and 12 for play in the phase of possession (attack). Six soccer experts assessed relative importance of each criterion for particular outfield playing positions (i.e., central defenders, full-backs, midfielders, and attackers) with a high degree of objectivity (objectivity coefficients rang-ing from 0.89 to 0.97). The proposed criterion system, aimed at the subjective evaluation of actual quality of top-level soccer players, could be a useful tool for coaches and sport managers in selection and profiling of young soccer players, as well as in management of elite soccer teams.
Key words: performance, subjective evaluation, expert system
Introduction
Successful performance in top-level soccer depends on a myriad of factors, including physical, physiological, psycho-social, and technical-tactical factors (Bangsbo, 1994). Most previous studies on soccer were focused on physical and physiological characteristics of players (for a review, see Stollen, Chamari, Castagna, & Wisloff, 2005). In contrast, studies that evaluate soccer performance from the perspective of technical-tactical skills and knowledge are lacking. This is surprising, given that technical-tactical skills represent key elements of player’s actual quality and his/her competitive performance (Reilly, Bangsbo, & Franks, 2000). As a consequence, knowledge about ev-idence-based selection and profiling in soccer is mainly related to the players’ physical fitness and their game sta-tistics (Mujika, Santisteban, Impellizzeri, & Castagna 2009; Reilly, et al., 2000; Stroyer, Hansen, & Klausen, 2004; Vaeyens, Malina, Janssens, Van Renterghem, Vrijens, & Phillippaerts, 2006). Hence, there is an evident need for creating an unbiased, as much as possible objective, sci-entifically-based system for the evaluation of actual qual-ity of soccer players that integrates technical-tactical and psychosocial factors.
In a series of studies completed, some of the present au-thors have participated in the process of developing and evaluating the criteria systems for the evaluation of actual
quality of athletes in team sports games (Trninić, Perica, & Dizdar, 1999; Trninić & Dizdar, 2000; Hraste, Dizdar, & Trninić, 2008). However, to our best knowledge, no such attempts have been made in soccer. Hence, the aim of this study was to develop a criterion system for the expert evaluation of actual quality of soccer players, and to deter-mine importance coefficients of every particular criterion for each playing position in top-level soccer.
Methods
Set of criteria for the evaluation of actual quality of top-level soccer players
The most pronounced characteristic of association football or soccer is a constant quick ball possession interchan-ge, consequently, a quick switch of play in either defense or attack. For many reasons it is indispensable to discern clearly between quality of play in the phase of defense and in the phase of attack. Thus, 7 criteria for the evaluation of actual quality of play in defense and 12 criteria for the eva-luation of actual quality of play in attack have been designed (Table 1). It should be noted here that these criteria are ge-neralized to make them valid as regards particular playing positions’ specific requirements (e.g., playing full-back or side midfielder position requires position specialization, that is, it is not the same whether a player is playing side-
HOMO SPORTICUS ISSUE 1 2013 11
lane position in the rear, defensive third or in the mid third of the field of play) and tactical variations (to be adequate to both systems with either two or three backs in the mid-lane of the back defensive line). Apart from the abovementio-ned differences, many others can also occur in the playing position arrangements of midfielders and in the number of attackers, but they are considered just nuances that do not attenuate the value of the entire criterion system.
Set of the criteria for the evaluation of actual player’s quality in the phase of defense
1. Applying pressure on-ball — ability to aggressively hinder any action of the opposing player with the ball. It consists of a correct positioning of the defending player on an imaginary straight-line connecting the centre of his/her goal and the position of the ball, and of constant attacking the possession, thus forcing the direct attacker with the ball to move towards less dangerous field zones (towards the side lines), or to encourage a backward pass, unprepa-red shot, crossing, or forced inaccurate long pass.
2. Tackling — a skill, ability to break the opponent’s at-tacking activities:• By performing a basic standing tackle — it is an ef-
ficacious defensive action during which a defender runs in front of the attacker a fragment of a second prior to or in the moment of his/her opponent receiv-
ing the ball, that is, before his/her first touch with the ball. Players who frequently use this defensive tactic create constant pressure on the attackers, thus slow-ing down or breaking up their continuous attempts to attack. This technique should be used only when a defender is sure in successful outcome of the action, that is, in gaining possession; otherwise, he/she will be outplayed and defensive formation will be over-whelmed (the technique is most often utilized by the players from the back defensive line), and the oppo-nent will get an open scoring chance.
• By regaining ball possession — a defensive action usually undertaken when the ball-handler tries to em-ploy any individual technique to free himself/herself from his/her guard. His/her defensive counterpart, by playing with controlled aggressiveness (fair charges), employs every defensive technical-tactical element to tackle the ball no matter in which position he/she is in relation to the attacker, that is, either if he/she is in front of the attacker, beside him/her, or behind the opposing player.
3. Clearance and interception — a skill, ability of a player to kick the ball far away from the danger area or to intercept the attackers’ passes in order to slow down the attack of the offensive team, or to break it up. After the ball has been cleared, it may be directed to:• outside the field boundaries — a defender powerfully
kicks the ball away by which he/she manages to “ste-al” a few seconds, needed for a throw-in or corner performance, thus enabling his/her teammates to assume a proper defending formation;
• deep into the field — a defender powerfully kicks the ball away as far as possible in order to clear, break up a dangerous scoring opportunity in front of his/her goal after he/she has estimated there has been no time for a technically sophisticated performance;
• into the field to a teammate — the most efficacious way of clearing with which not only a defending player stops the rivals’ attack, but he/she enables a quick transition into a fastbreak, that is, into a counterat-tack in the situation of numerical advantage over the defenders who have to struggle hard to fill in defensive lines.
• Interception of the opponent’s passes is a special case of clearing the dangerous scoring situations. Effective performance of interceptions is a result of good ability to “read the game”. A defender antici-pates which communication channel the attacker with the ball will use in a precise moment and covers the lane immediately prior to or in the moment of a pass being performed.
4. Duels in the air — a skill, ability of a player to intervene on time on the air ball whether it is coming from either sides or from the central lanes of the playfield. These are usually long passes, meaning that the ball covers a certain dis-tance while flying, therefore, this skill depends directly on
Table 1. Set of criteria for the evaluation of actual quality of top-level soccer players.
CRITERIA FOR THE EVALUATION OF ACTUAL QUALITY OF SOCCER PLAYERS
ACTUAL QUALITY OFPLAY IN DEFENSE
ACTUAL QUALITY OFPLAY IN ATTACK
Applying pressure on-ball Ball control
Tackling Dribbling
Clearance and interceptionPlay with the fewest touches possible
Duels in the air Long passing
Positioning in a zone Crossing the ball
Taking over and help Heading
Positioning after the possession lost
Visual control over playfield and creativity
Shots on target
Play with the inferior leg
Finishing effectiveness
Cooperativeness
Play off-ball
HOMO SPORTICUS ISSUE 1 201312
following abilities of a player: visual perception of the ball flight trajectory, accurate estimation of its velocity, ability to fight for space and to secure the area of the supposed ball landing, and on a good skill of heading or receiving the ball before it touches the ground. Quality of play in duels in the air is manifested in the following activities:• taking space for the ball reception and play, as well
as impeding the attacker in his/her attempts to receive and pass the oncoming ball;
• fair charge against the opponent (body, shoulders) presents an opportunity for successful interference with the opponents attacking actions;
• good clearance technique with the head or foot, mean-ing, the ball should be hit away to the least dangerous area of the playfield, that is, to the side lines, deep into the field, or out the playfield.
5. Positioning in a zone — a skill and ability of a player manifested as consistency in keeping the distance among teammates playing in the same line-up. When a team plays with three or four players in the back defensive line, it is of utmost importance that they maintain proper distance among themselves throughout the game to secure the strong side (area where the ball is), but such an arrange-ment of players allow also a quick transformation, switch of the defensive zone from one end or side of the playfield to the other, depending on the position of the ball and ball-handler, other attackers and other teammates. This skill is most pronounced in the offside trap setting, when the entire defensive line should move forward, thus reducing play space for the offensive team. The most important detail in this tactical shift is the inter-player distance ma-intenance, which requires high concentration of players, good teamwork, good communication, and commitment of players to respect style of play, assigned tasks and du-ties. In instances of unfavourable space interrelations (if one player lags behind), a scoring chance for the opposing team may occur. Positioning in the defensive formation of all the players in a line up is manifested in the following activities:• marking, covering certain part of the playfield with re-
gard to the position of the ball;• marking the direct ball-handler and quick returning to
one’s own position in the defensive formation;• help to his/her teammates by closing space, slots be-
hind their backs.
6. Taking over and help — a skill, ability of a defender to take over the opposing attacker on time. Namely, in the zone defense the defenders guard certain playfield area and mark players who enter that space. On the attackers’ penetration through the defensive zone, these space inter-relations among defenders change indispensably to adjust to the moves of the attackers. This defensive adaptation requires maximally coordinated reaction of the entire de-fensive line. Their aim is to minimize time during which attackers are not closely marked, especially the ball-han-dler, by any of the defenders. The success in taking over
and helping depends not only on abilities, skills and com-mitment of individual players, but also to a great deal on teamwork and team cohesion, and even also on qualities of attackers, especially the ball-handlers:• taking over the responsibility for the ball-handler – ag-
gressive but fair charge against the attacker who has managed to pass by his/her primary guard by employ-ing dribbling or using his/her teammates (the second or the third attacker). That is the way of averting the direct scoring danger from one’s goal. The defender who is taking over the responsibility for the ball-han-dler must perform it on time by positioning himself/herself precisely between the attacker and own goal;
• taking over an attacker without the ball – the defender should approach to the attacker and follow his/her moving in the area of the defender’s responsibility. This manoeuvre, like the previously described one, must also be performed precisely to maintain distance among the teammates. Taking over an attacker with-out the ball is connected with the task of the defender to return to his/her position in the defensive formation (after helping on ball). Namely, attackers frequently charge against the set defensive lines (from one side of the playfield to the other), especially using slots be-tween defenders, with the aim to break up the defen-sive zone and open space for a pass (through ball) or cut-in behind the defense. Therefore, the attackers on weak side must also be watched and any attempt to penetrate defense must be impeded in the beginning.
7. Positioning after the possession lost — ability of a player to assume defensive role and his/her quick posi-tioning in the defensive formation upon the very moment of the ball possession conversion. The team that has lost possession is in the distinctive unfavourable situation, mainly due to the position, arrangement of its players on the playfield who were building their attack just a tenth of a second ago. This particularly regards the back defensive line players who may be far away from their usual play-ing positions in the defensive formation, especially if they have gone forward to join their team’s attacking actions in the attacking third. The players who are in the moment of possession conversion in front of the ball must promptly make a decision how to react and move quickly to assume a new position with regard to the ball, their rivals and teammates. That means a player positions himself/herself on the nearest defending position, no matter whether it is an area he/she usually covers in the defensive formation or not, and performs every defensive action needed, that is, any action he/she considers to be most effective at the moment. A special case describing this quality feature is when the goalkeeper has left his/her usual position in front of his/her goal posts, outside 5-meter box, or even out-side penalty box. Then the nearest teammate, usually one of the defensive players, should substitute his/her goalie and cover his/her playing position within the goal posts (however, he or she would not be allowed to play with his/her hands).
HOMO SPORTICUS ISSUE 1 2013 13
Set of the criteria for the evaluation of player’s actual quality in the offensive game phase
1. Ball control — a skill of a player to control the ball and direct it to the communication channels optimal to the at-tack development. It is manifested in efficacious covering of various distances while simultaneously advancing the ball and controlling it in the possession in duels with the opponents (positioning between the ball and the opponent – protective positioning), the skills extremely important in the transition from defense to attack and in the ball pos-session regaining and clearing the own defensive third. The skill is manifested in good performance of short and medium (up to 20 m) balls receiving and passing. Receiv-ing technique regards stopping the ball with any part of the foot, knee, chest or head. Quality reception of the ball implies a receiver takes only one touch to assume control over it; it would be ideally if that one touch is also the first touch of advancing or passing the ball. Passing technique over short (up to 10 m) and medium (10-20 m) distances implies ball passes performed with all foot parts and head-ers. Good pass performance is characterized by high ac-curacy, optimal ball rotation and its optimal speed, all of which should facilitate the ball reception.
2. Dribbling — a skill of an offensive player to outplay his/her direct defender in one-on-one play as to create time and space advantage over him/her. There are two basic types of dribbling:• dribbling with the face to the goal — a player receives
the ball facing the opponent’s goal, or he/she has enough time to turn around prior or upon the ball re-ception, which enables him/her success against his/her direct defender. This dribbling is performed in most zones of the playfield since such match situa-tions do not usually occur in the scoring critical zone, that is, outside the core of the defensive third;
• dribbling with the back to the goal — a player receives the ball with his/her back to the opponent’s goal, most often in the finishing or scoring critical zone (in vicinity or inside the penalty area). Successful dribbling per-formance creates open finishing opportunity. Such a dribbling is typically performed within tight area and very quickly because of a high concentration of de-fenders in the heart of defense.
3. Play with the fewest touches possible — a skill, ability characterized by a quick reaction of a player when receiv-ing and passing the ball. It is manifested as the minimum touches with the ball — the ideal would be one touch play. Two touch passes (recieveing and then passing the ball) and first touch passes enable quick switch of strong sides, that is, a quick transition of the centre of play (the ball) from one end or side of the field to the other, which cre-ates preconditions for quality and, probably, successful at-tack since the defensive counterparts have not managed to adapt to the new match situation. This presents an opportu-nity to penetrate the closest scoring zone by a quality pass
to an open teammate or by an individual skill (dribbling, ball advancing and shooting). The skill to control the ball with minimum touches is very important in vertical movements of the ball (through balls passed up and down the playfield). Skillful ball-handlers are able to transfer the ball in a very short time from their penalty area to the opponent’s scoring critical zone and create a scoring opportunity.
4. Long passing — a skill to perform good passes to a team-mate over the distances greater than 20 metres. Depend-ing on the arrangement of the players on the playfield, long passes may be ground or air passes (pass to space, through ball). Quality of a long pass is manifested in the following: accuracy, softness (right speed and ball rotation to facilitate the teammate’s reception), part of the foot with which a pass is performed (trajectory and rotation of the ball depends on it), and perception of the gross movements of teammates and rivals when passing through ball on space. This criterion does not embrace the skill of crossing (a separate criterion).
5. Crossing — a skill to perform, most often long and di-agonal or square (meaning, crosses are usually performed from the side lane positions) passes into the box in order to create scoring opportunity for teammates from the first touch. A cross is a special type of long passes which is, as a rule, performed with the inside of the foot thus providing the ball with the powerful rotation and desirable trajectory. Only exceptionally this kick is performed with the other part of the foot. A quality cross is characterized by the afore-mentioned parameters of quality long passes. Generally, there are two types of crosses:• a cross bent round away from the goal — is per-
formed from a side lane position with the inside of the foot. The kick is powerful and the ball has a fast rotation which kinetic energy a teammate can utilize to enhance his/her shot force. The ball trajectory is bent away from the goal, so the possibility for goalkeeper’s interception is thus reduced;
• a cross bent round to the goal — is performed with the inside of the foot from various positions in the final third. The ball has a fast rotation, but this time it is bent toward the goal. This is a very scoring promising, that is, dangerous cross because the slightest touch or flick, or attempt of these, from any player will be enough to direct the ball onto the target.
6. Heading — a skill, ability of control play, that is, ball handling with the head, either if it regards powerful and accurate hits (shots on target), or just accuracy of passing (passes to teammates). Quality heading is characterized by the following:• shot accuracy — a skill to perform a shot on target,
either from the ground or air, from a duel or without a contact with the rival player;
• pass accuracy — a skill to perform a pass to a team-mate from a duel or with no contact with the oppos-ing player; these passes are usually backward passes (back passes) in the penalty area of the final third;
HOMO SPORTICUS ISSUE 1 201314
• flick — a skill to switch the ball behind one’s back or sideways, most often after a long cross or pass.
All the listed characteristics can be most easily recognized in a move of grounding the ball on the pass or shot on target performance. Namely, the most usable header is the one played low on the teammate’s foot, as is a header on target most efficient if it is low.
7. Visual control over the playfield and creativity — abi-lity manifested in good perception of the positioning of players of both teams on the playfield and in capitalizing on the observed momentary arrangement of players by the performance of the most efficient action. The players with the pronounced combination of these abilities are capable, at any moment of a match, to perform an unexpected pass or individual skill (shot or dribbling) with which they usually manage to outplay the counterparts and create favourable scoring opportunity, either for themselves or their teamma-tes. Quality perception and visual control over the playfield allows a player to see which teammate of his/her is in the best scoring position or which defender is poorly positi-oned so he/she would be able to switch the play quickly to the spotted area. Under the term “creativity“ the ability of a player is understood to cover a great distance of the playfield or to open space to himself/herself or to his/her teammate for a finish by an unexpected move (passing, shooting, dribbling).
8. Shots on target — a skill to perform effectively when taking a shot at the goal. In this actual quality component one should differentiate between two basic types of foot shots:• Drive / Powerful kick — a shot hit performed with the
centre of the instep; it is characterized by a straight or swaying flight trajectory and a high speed of the ball. Most often it is used for goal kicks taken from the po-sitions outside the penalty box. The kick performance technique depends on the zone of the playfield from where the shot is taken and on the match situation. It can be utilized under various tactical conditions: from the individual ball advancing, by kicking the backward ball, a kick upon the forward pass received, volley kick and when kicking the stationary ball (free kick).
• Placed shot — is most frequently used for free kicks’ performance from the distance of about 25 metres, but it may also be used as a shot hit out of ball advanc-ing. The technique is characterized by a high rotation, a somewhat lower speed and accurate placement of the ball at any of the four goal corners’ squares with 1m long sides. Inside of the foot is the most frequent kicking part of the body; only exceptionally it may be executed with the outside of the foot also. The basic difference between the powerful and placed shot on target is in the ball trajectory shape — shape of the trajectory of the placed ball, kicked either by the in-side or outside of the foot, is arch-like. Such a shape ensures avoiding obstacles, like wall on free kick per-formance.
9. Play with the inferior leg — ability to perform techni-cal elements efficiently with the non-preferred leg. Persons are born with side preference in motor performance, but that innate feature can limited quality enough development of soccer players. Trained ambidexterity, that is, quality enough performance of soccer technique with both legs enables a player to resolve match situations on both sides of his/her body, giving him/her a huge advantage over de-fenders.
10. Finishing effectiveness — a skill, ability to realize, capitalize on scoring opportunities. It can be described by a ratio between the number of scoring opportunities and the number of goals scored. Finishing effectiveness unifies all elements of technique and tactics as well as theoretical knowledge which can be useful in achieving the supreme aim of the game of soccer — scoring. This skill is most easily monitored since goals are counted in soccer; it is the most important item in the game statistics. Which kick-ing or hitting technique would be optimal? It depends on numerous factors, but immediate one is the way in which the attack has been prepared, that is, the selection of kick-ing technique depends on whether it should be performed after:• a cross from either side lanes;• a through ball received which has come through a slot
into space between the back defensive line and the goalkeeper;
• individual penetration and dribbling past one or sev-eral opponents;
• short and quick passes through the middle of the de-fensive formation;
• the ball reception with one’s back to the goal;• low or ground back ball from the side lane positions;• a distance shot opportunity created (outside the pen-
alty area);• set pieces (free kicks, corners, side throw-ins).The high standard attackers, mostly centre forwards, should be quick in their reactions in the instances of one-on-one with the opposing goalkeeper. These match situ-ations are the so called 100% scoring opportunities, but they occur rarely, therefore, no failure is acceptable.
11. Cooperativeness — ability and commitment to co-work with teammates. Cooperation is super-positioned to individual actions. It is a distinctly appreciated ability in the phases of the attack opening and transition (fastbreak and counter-attack) when the ball should be as soon as pos-sible removed from the own goal danger zone and the own attack should be started. Ability to cooperate with team-mates is manifested in unselfishness even in the penalty area actions like:• a double pass or back ball;• a pass to a teammate in a better scoring position.Optimal cooperation among teammates is frequently a crucial deciding factor on winning and losing. The final outcome will not be decided by the mathematical sum of individual qualities or individual performance, but by their
HOMO SPORTICUS ISSUE 1 2013 15
synergy effect, that is, by common efforts that pump their power from their collectiveness. The difference in synergy power is the difference in winning and losing.
12. Play off-ball — a skill of using motion lanes in order to draw away the opposing players’ attention (e.g. decoy running); the aim is to open or take space. It is manifested in the following:• short, quick ambulatory movements the aim of which
is area taking and opening for the ball reception;• space opening for teammates by employing outrun-
ning and drawing the defender away from the part of the playfield which is a target of attack penetration; it is emphasized in a fast break;
• slots perception for through balls or balls to space and timely stepping into the area behind the defenders.
A special case of this skill is letting the ball pass through to the trailer who is coming after the attacker. If timing on letting-through-ball is good, then the entire defensive formation is decoyed and it does not have enough time to respond by closing slots and approaches to its goal. Thus, a very good scoring chance is created. This skill is closely related to cooperativeness and good teamwork. Every purposeful letting the ball through occur when the actual receiver is quite prepared to receiving it properly and securely. At such a moment the first player changes quickly either the direction or speed of his/her movement, or both, and lets the ball through to his/her teammate, who is in a better scoring position. So, optimal cooperation of two teammates is a basic precondition for this instance of off-ball play to be efficacious. Initiative and commitment to participate in any action of his/her team is the main char-acteristic of a good off-ball player.
Playing positions in contemporary soccer
The basic difference between soccer and other team sports is that soccer players in different lines of a line-up do not have the same roles nor importance in play when in pos-session (in attack) of the ball and without it (in defense). Players from the back defensive line rarely participate in finishing, closing parts of their team’s attacking actions - similarly as strikers or forwards do find themselves in front of their own goal hardly ever. As a result of position-specific demands, primarily due to the rather large dimen-sions of the playing field, the following player specializa-tions have become common over the decades of soccer development:• Central defenders• Full backs• Midfielders• AttackersPlayers specialized to play in a particular formation line dif-ferentiate among themselves by their aerobic characteris-tics (Santos & Soares, 1998) and intermittent endurance (Oliveira, et al., 1998). The differences have been docu-
mented also in players’ anthropometric characteristics, anaerobic capacities and muscular force (Reilly, Bangsbo, & Franks, 2000). The aforementioned classification facili-tates quality monitoring during the development of young soccer players as well as training programs for all age and quality categories of soccer players. The expert judges, who participated in the current research, were familiarized with the classification prior to their evaluation of how much was each criterion important to the delineation of actual quality of soccer players.
Data collection and data processing methods
A group of six Croatian top-level soccer coaches (or man-agers) participated in the research. Each of them met at least one of the following three preconditions:• a first coach (manager) of the national championship
winner club;• a selector or a coach of the Croatian national team
participating in the final tournament of the European Championships;
• a selector or a coach of the Croatian national team participating in the final tournament of the World Championships (FIFA World Cup).
Every soccer expert assessed relative importance of each criterion by using pairwise comparison for every type of soccer player (any particular criterion has been compared to every other one; for example, if the criterion “A” was thought to be twice as much important as the criterion “B”, then the criterion “A” was attributed in the comparison ma-trix of pairwise comparisons, in the place AB with the value 2, and in the place BA with the value 1/2, etc.). In this way each soccer expert produced reciprocal square matrix of grades for every type of four soccer players, out of which one vector of importance coefficients was computed by the Geometric Mean Method (vectors of arithmetic means and standard deviations) also for each type of player. The result was 4 vectors for defense and 4 vectors for attack which were then rescaled to obtain the sum that equalled one. The Cronbach’s coefficient (a) was used to assess the reliability (objectivity) level of the established impor-tance coefficients.
Results
In Table 2, very high values of the objectivity coeffici-ents can be seen for fullbacks (0.965), central defenders (0.964) and attackers (0.931), whereas values of the same coefficients for midfielders are somewhat lower but still high (0.890). Hence, the conclusion is viable that the criteria are applicable to all types of soccer players. A so-mewhat lower inter-judges agreement values were expec-ted in relation to the actual quality criteria importance for the players who primarily play the midfield positions, due to the most complex nature of these playing positions.
HOMO SPORTICUS ISSUE 1 201316
19 In contemporary soccer, midfield players cover the gre-atest area of the field of play, constantly participating in play either in defense or in attack (Barros, et al., 2007; Di Salvo, et al., 2007). Besides, the experts suggested further differentiation of midfielders into: defensive midfiel-ders, side midfielders, forward (offensive) midfielders and classical midfielders. Therefore, the level of inter-judges agreement was expectedly lower with these player types. The obtained results indicate the need for further research based on the proposed additional classification of midfield players.
Discussion and conclusions
Based on the determined importance coefficients attributed to the criteria for the evaluation of actual quality of soccer players in defense (Table 2) it is viable to describe particu-lar types of soccer players as follows:• Central defenders. The role of central defenders is
almost entirely defensive, which is in accord with the obtained importance coefficients of the criteria for the evaluation of play in defense (0.85) as opposed to the ones evaluating play in attack (0.15). The most important actual quality evaluation criterion for central defenders is clearance and interception, followed by tackling. The experts evaluated the marked criteria as the most important probably due to the fact that the primary task of central defenders is to impede forward attackers, and the most efficient way to do so is in the moment of the ball reception, that is, until the receiver has not gained complete control over the ball and spa-ce (clearance and basic tackling), or even before the attacker even receives the ball (passes intercepted). A high level of tactical skills and theoretical knowledge is extremely important for the players playing in the back defensive line because the described tactical to-ols are very effective, but they are also very risky if
not performed properly, leaving no space for mistake in estimation and anticipation. Next in the importance ranking is the criterion duels in the air, because cen-tral defenders have the responsibility to clear crosses and all air balls from their penalty area due to their central position in the defensive formation.
• Full backs. Importance coefficient for the criteria eva-luating actual quality of their play in defense is con-siderably higher (0.65) than the one for the criteria evaluating actual quality of their play in attack (0.35), meaning that their primary role in soccer game is de-fensive actions performance. The most important cri-teria for these player types are, expectedly, tackling, pressure on-ball and clearance and interception. All three criteria describe defensive tactical tools in in-stances where the defensive player is facing his/her attacker, which is the most common space relation between full backs and their opponents. Full backs are most frequently in the back defensive line and their task is to prevent the attackers from penetration into the penalty area or from crossing the ball from the sideways position. Since their actions are usually per-formed outside the penalty area, that is on the positi-ons from which crosses are executed, it is clear why duels in the air got the least important criterion grade.
• Midfielders. The participating soccer experts evalu-ated importance of quality of play in defense and in attack as being equal for midfielders (importance ra-tio of the defensive criteria to the attacking criteria is 0.492, whereas the reverse ratio quotes 0.508). The result was not surprising, due to the most complex playing role of midfielders emerging from them being the bridge between defensive and attacking forma-tions. On defense, they are the first defensive forma-tion. Positioning of midfielders in the defensive forma-tion is not static; on the contrary, that line is extremely elastic on defense. It is each player’s responsibility to
Central defenders Full backs Midfielders Attackers
Duels in the air 0.122 0.042 0.055 0.013 0.041 0.009 0.035 0.019
Positioning in a zone 0.115 0.040 0.087 0.019 0.077 0.022 0.027 0.004
Taking over and help 0.113 0.021 0.089 0.018 0.072 0.013 0.026 0.009Positioning after the pos-session lost
0.119 0.043 0.098 0.023 0.076 0.012 0.027 0.006
α 0. 964 0.965 0. 890 0. 931
D/A 0.85/0.15 0.65/0.35 0.49/0.51 0.20/0.80
Table 2. Means (Mean) and standard deviations (SD) of importance coefficients attributed to the criteria for the evaluation of actual quality of soccer players in defense, Cronbach’s objectivity coefficient (α) and importance ratio of the defensive criteria to the attacking criteria (D/A)
HOMO SPORTICUS ISSUE 1 2013 17
apply pressure on his/her direct attacker in the mo-ment of ball possession conversion and when the at-tacker has the ball. After his/her direct attacker has passed the ball, the defender returns to the defensive formation where he/she assumes the assigned posi-tion from which he/she takes over and help on the player’s off-ball and covers space under his/her re-sponsibility. Therefore, it was obtained that the most important criterion was applying pressure on-ball. If the midfielders are successful on this task, the op-ponent’s attack should slow down because the tun-nel or through balls have not been allowed, and the entire attack has been forced to wide or side positions (less dangerous). Second and third by importance are the criteria positioning in a zone and positioning after possession lost. High values attributed to these criteria confirm importance of zone positioning in the defensive formation, in which every player covers a particular segment of the playfield. Zone defense is the only possible defense in soccer since the game is played on a vast playfield which has to be covered. Cooperation of players in the zone, that is, good timing of their actions and keeping the distance among the players are crucial because the wrong positioning of only one player may result in opening space, creating easy scoring opportunity for the rivals.
• Attackers. The basic role of attackers is scoring. It is also the rationale of the sports game of soccer. The-refore, the ratio of 0.8 for the importance of criteria
evaluating actual quality of play in attack to 0.2 for the criteria for play in defense is not surprising at all. However, no player is in contemporary soccer free from defensive tasks. Therefore, according to the evaluation of the expert group, attackers have more important role in defense than the central defenders in the phase of attack. Our experts set applying pre-ssure on-ball and quality of play in duels in the air as the two most important criteria. Namely, upon po-ssession lost, attackers should immediately transform into the first defensive players whose task is to apply pressure on the ball-handler, thus slowing him/her down, postponing forward passes and slowing down ball flow in general. In that way attackers can buy se-veral seconds for their defenders to set the defensive formation and organize. The second criterion refers to play in the air. This skill is most often manifested after game stoppage when the opposing attackers perform throw-ins, corners or free kicks to the penalty area. Then our attackers serve as defenders who employ their height and skill to win control over a particular area, thus helping their defensive formation in clearing the penalty area.
The results displayed in Table 3 make the description of certain types of soccer players possible due to importance coefficients attributed to the criteria for the evaluation of actual quality of play in the phase of attack:
Table 3. Means (Mean) and standard deviations (SD) of importance coefficients attributed to the criteria for the evaluation of actual quality of soccer players in attack, Cronbach’s objectivitycoefficient (α) and importance ratio of the attacking criteria to the defensive criteria (D/A)
Central defenders Full backs Midfielders Attackers
Criterion Mean SD Mean SD Mean SD Mean SD
Ball control 0.016 0.003 0.033 0.012 0.045 0.012 0.064 0.019
Dribbling 0.006 0.001 0.026 0.006 0.041 0.009 0.074 0.012Play with the fewest touches possible
0.014 0.004 0.026 0.010 0.038 0.015 0.047 0.013
Long passing 0.017 0.004 0.025 0.010 0.042 0.015 0.036 0.008
Play off-ball 0.010 0.002 0.029 0.009 0.036 0.008 0.063 0.017
α 0. 964 0.965 0. 890 0. 931
A/D 0.15/0.85 0.35/0.65 0.51/0.49 0.80/0.20
HOMO SPORTICUS ISSUE 1 201318
• Central defenders. If they ever participate in the attacking actions, it is after the stoppage of the game, on free kicks and corners, when they join their teammates in the opponents’ penalty area. Therefo-re, heading is expectedly the most important criterion for actual quality evaluation of central defenders’ play in attack. The next criteria by importance are techni-cal-tactical tools ball control and long passing. They frequently deliver balls to midfielders (short passes) or even to forward attackers (long passes, more than 30 m) when the opposing defense plays aggressively and marks the midfielders closely so they are not in a position to receive the ball; in that instance the phase of transition must be omitted to reduce the possibility of losing possession in the middle of the field of play.
• Full backs. According to the experts participating in the research, crossing the ball is the most important technical-tactical tool for this type of soccer players. In the phase of attack, full backs strive to get to the position most favourable to crossing the ball into the penalty area, thus creating scoring opportunities for teammates. Besides crossing the ball, the criteria fi-nishing effectiveness, cooperativeness and ball con-trol are also important for the evaluation of full backs’ play in attack. The criterion of finishing effectiveness got a somewhat surprisingly high value of importan-ce. Namely, full backs participate rarely in the closing parts of attacks or they are seldom in a position to score. The other two highly evaluated criteria are in accordance with the expectations since cooperation with teammates and ball control are important skills for assuming control over the area from which a good cross can be performed. The criteria play with the in-ferior leg and heading have been evaluated as the less important for full backs’ actual quality of play in attack because they have few opportunitiesto head the ball on target and they decide seldom to dribble and pene-trate to the middle third and middle lane.
• Midfielders. Visual control over playfield and crea-tivity is the most important criterion according to the evaluation of the group of experts. Namely, the primary role of midfielders is to transfer the ball from their de-fensive third to the final, attacking third and to deliver it to their attackers. In this transition they must employ all their technical and tactical skills and knowledge in order to detect weak points in the opponents’ defen-sive formation and capitalize on it by directing their attacking actions to the poorly guarded areas. Well trained and set defensive formation is hardly to be out-played by schematic moves, so creative midfielders, with good visual perception, must perform unexpec-ted moves to create good scoring opportunity. The criteria finishing effectiveness, cooperativeness and shots on target are also important in the evaluation of actual quality of play of midfielders in attack. They frequently enter the offensive third and finish. Therefo-re, high effectiveness in the closing phases of attack is also important to midfield players, because one
cannot expect too many scoring opportunities in the matches against high standard rivals. Further, these players usually attack from the background, as a se-cond wave, and they frequently have an opportunity to take a shot at the goal from the distances of about 20 metres, which is a decent and promising scoring opportunity. Heading is less important for midfielders as well since they are seldom in a position to finish with a header. Besides, due to their primary roles, they are not very tall.
• Attackers. As expected, soccer experts regarded fin-ishing effectiveness to be the most important criterion for the attackers’ actual quality evaluation. Namely, the primary task of attackers is to score; so the even-tual match outcome depends considerably upon their scoring efficiency. A quality attacker is expected to create scoring opportunities and finish. When play-ing against high standard teams, one cannot expect many scoring opportunities, therefore, each and ev-ery chance should be used; high shooting efficiency is then the only chance for favourable outcome. The following criteria on the importance scale for the at-tackers were shots on target, heading and coopera-tiveness. High level of technical skill and knowledge is indispensable, whereas accurate shots and headers from any position should be their specialty. In addi-tion, if he/she is good in assisting as well, it makes him/her even more dangerous and enhances his/her effectiveness in the closing parts of attack.
The main aim of this study was to create an expert system for the reliable evaluation of actual quality of top-level soc-cer players. Altogether, 7 criteria for the defensive game phase and 12 criteria for the attacking game phase were proposed and described. With the high level of inter-ob-server agreement (0.89-0.97), six soccer experts defined the coefficients of importance of each particular criterion for the following four playing positions in soccer: central defenders, full backs, midfielders, and attackers. These coefficients of importance allowed us to define specific characteristics and skills necessary to play soccer at the highest competitive level for each playing position. The proposed weighted criterion system for the subjective eval-uation of actual quality of top-level soccer players could be a useful tool for coaches and managers in selection and profiling of young soccer players, as well as in manage-ment of elite soccer teams. Future studies are needed to determine the validity of the proposed criterion system in top-level trained soccer players.
References
Bangsbo, J. (1994). The physiology of soccer - with spe-cial reference to intense intermittent exercise. Acta Physi-ologica Scandinavica Supplement, 619, 1-155.
(2007). Analysis of the distances covered by first division Brazilian soccer players obtained with an automatic track-ing method. Journal of Sports Science and Medicine, 6, 233-242.
Di Salvo, V., Baron, R., Tschan, H., Calderon Montero, F.J., Bachl, N., & Pigozzi, F. (2007). Performance characteris-tics according to playing position in elite soccer. Interna-tional Journal of Sports Medicine, 28, 222-227.
Di Salvo, V., & Pigozzi, F. (1998). Physical training of foot-ball players based on their positional rules in the team. Effects on performance related factors. Journal of Sports Medicine and Physical Fitness, 38, 294-297.
Dizdar, D. (2002). Vrednovanje skupa metoda za procjenu stvarne kvalitete košarkaša. Evaluation of a group of meth-ods for the evaluation of actual quality of basketball play-ers. In Croatian. (Unpublished doctoral dissertation, Uni-versity of Zagreb). Zagreb: Faculty of Kinesiology.
Hraste, M., Dizdar, D., & Trninić, V. (2008). Experts’ opin-ion about system of the performance evaluation criteria weighted per positions in the water polo game. Collegium Antropologicum, 32, 851-861.
Mujika, I., Santisteban, J., Impellizzeri, F.M., & Castagna, C. (2009). Fitness determinants of success in men’s and women’s football. Journal of Sports Science, 27, 107-114.Oliveira, J., Magalhaes, J., Rebelo, A.N., Duarte, J., Gon-calves, J.P., & Soares J.M.C. (1998). The endurance capacity of soccer players evaluated by the Yo–Yo inter-mittent endurance test. In Proceedings of Third Annual Congress of the European College of Sport Science „From Community Health to Elite Sport“, Manchester (p. 358).
Reilly, T., Bangsbo, J., & Franks, A. (2000). Anthropomet-ric and physiological predispositions for elite soccer. Jour-nal of Sports Sciences, 18, 669–683.
Reilly, T., & Thomas V. (1976). A motion analysis of work rate in different positional roles in professional football match–play. Journal of Human Movement Studies, 2, 87- 97.
Santos, P.J., & Soares, J.M.C. (1998). Aerobic capacity differences among elite soccer players concerning their game positions. In Proceedings of Third Annual Congress of the European College of Sport Science „From Commu-nity Health to Elite Sport“, Manchester (p. 456).
Stolen, T., Chamari, K., Castagna, C., & Wisloff, U. (2005). Physiology of soccer: an update. Sports Medicine, 35, 501-536.
Stroyer, J., Hansen, L., & Klausen, K. (2004). Physiolo-gical profile and activity pattern of young soccer players
during match play. Medicine and Science in Sports and Exercise, 36, 168-174.Trninić, S., Perica A., & Dizdar, D. (1999). Set of criteria for the actual quality evaluation of the elite basketball players. Collegium Antropologicum, 23(2), 707-721.
Trninić, S., & Dizdar, D. (2000). System of the performance evaluation criteria weighted per positions in the basketball game. Collegium Antropologicum, 24(1), 217-234.
Vaeyens, R., Malina, R.M., Janssens, M., Van Renterghem, B., Vrijens, J., & Phillippaerts, R.M. (2006). A multidisci-plinary selection model for youth soccer: the Ghent Youth Soccer Project. British Journal of Sports Medicine, 40, 928-934.
Srđan Pavlović1, Munir Talović1,Besalet Kazazović1,Elvir Kazazović1 and Rasim Lakota1
Differences in Basic Motor and Situational Motor Abilities of Female Handball Players at Varying Levels of Competition1 Faculty of Sport and Physical Education,University of Sarajevo, Bosnia and Herzegovina
Original scientific paper
AbstractThe aim of this study was to confirm the difference in basic motor and situational motor abilities of female handball players. Studies were conducted on 79 adult female handball players playing in the BIH Premier League and the BiH First Federal League . For ba-sic-motor abilities, 18 variables were used which covered factors for estimating segmental speed, flexibility, coordination, power, repetitive power and balance. Situational motor capabilities were tested using five hypothetical latent factors which are responsible for situational efficiency in handball: speed of ball handling, preci-sion, throwing strength, speed without the ball, and ball handling.Independent T-test analysis of quantitative differences showed that statistically significant differences exist between the capabili-ties of players from the BIH Premier League and the BiH First Fed-eral League. Our results can aid in better understanding, tracking, analyzing and perfecting conditioning and tactical preparation for female handball players at various levels of competition, all in the aim of achieving better quality of competition for senior handball players in BIH
Key words: differences, basic motor and situational motor abilities, handball
SažetakOsnovni cilj ovog istraživanja bio je utvrditi razlike u bazično mo-toričkim i situaciono motoričkim sposobnostima rukometašica. Istraživanje je urađeno na 79 rukometašice,seniorskog uzrasta iz Premijer lige BIH i Prve federalne lige BIH.U prostoru bazično-mo-toričke sposobnosti korišteno je 18 varijabli koje su obuhvatale faktore za procjenu segmentarne brzine, fleksibilnosti, koordina-cije, eksplozivne snage, repetitivne snage, ravnoteža. Situaci-ono-motorički prostor je posmatran i obuhvata pet hipotetskih latentnih faktora koji su odgovorni za situacionu efikasnost u ru-kometu: Brzina baratanja sa loptom, preciznost, snaga izbačaja lopte, brzina kretanja bez lopte, baratanje loptom.U analiza kvantitativnih razlika na univarijantnom nivou, T- te-stom za nezavisne uzorke, između Premijer lige BiH i Prve fe-deralne lige BiH u situaciono-motoričkim i bazično-motoričkim sposobnostima dobili smo da se nivoi takmičenja razlikuju od-nosno da postoji statistička značajnost između tretiranih nivoa takmičenja. Dobiveni rezultati mogu doprinijeti boljem razumije-vanju praćenja,analiziranja te boljem usavršavanju kondicijske i tehničko-taktičke pripreme rukometašica na različitim nivoima takmičenja, a sve u cilju postizanja većeg kvaliteta takmičenja rukometašica za seniorke u Bosni i Hercegovini.
Ključne riječi: razlike, bazična motorika i situaciona motorika, rukomet
Introduction
Modern handball is exceptionally quick and explosive and is made up of varying physically intense movements which require high level motor skills, both basic and specific. (\ug, 2005; Czerwinski, 1995).
Basic motor abilities form the basis for further development of specific motor abilities which are directly responsible for achieving quality results (Brčić et al. 1997; Demir, 2000).
The existence of five latent situational motor dimensions in handball has been confirmed by various authors and they are as follows: accuracy, ball handling, speed of move-ment with the ball, speed of movement without ball and throwing strength.
Kules and Simenc (1983) researched the impact of basic motor abilities on the success of players in handball, and they found that explosive strength (both horizontal and ver-tical leaping ability and the type of throw), accuracy, speed of movement (with and without the ball) and co-ordination define the quality of the player.
Handball is increasingly dominated by action and reaction speed, strength, and aggresiveness, as well as the versa-tility of the player as reflected by how many different po-sitions he/she can play (Rogulj, 2000; Srhoj et al. 2001; Vuleta et al. 2003; Delija et al. 1995).
HOMO SPORTICUS ISSUE 1 2013 21
Players are required to improve their ability to perform ele-ments of technique with maximum intensity and develop their agility and explosive-reactive movement both in of-fense and defense
Due to the number of powerful shots, attacks on goal, taxing duels between players, and leaps in defence and offense, players consume large amounts of energy dur-ing the game. As such, a handball game demands much energy (Vuleta et al. 1999; Mujezinović, 2008; ). The aim of this study is to determine the differences and magnitude of differences at different levels of competition based on basic motor and situational motor indicators. The subjects studied were 79 adult female handball players from the BIH Premier League and the BiH First Federal League.
Method
SubjectStudies were conducted on 79 physically fit, adult female handball players. All were players from the BIH Premier League and BiH First Federal League, who were registered with the BiH Handball Federation. Definition of motor model in this study was done in accordance with Kurelic et al (1975).
Source of VariablesTo measure basic motor abilites, we used 18 variables. To measure situational motor capabilites we used five vari-ables.
Variables for determining basic motor capablitiesHand tapping – MSBTAP; leg tapping – MSBTAN; Bend, body twist, touch – MSBPZD; flex movement with a stick – MFLISK; full extensions on a benchs – MFDPK; splits – MFSPA: Standing on one leg crosswise on a bench with eyes closed – MRRAV; standing on a turned bench – MRSOK, balancing on a narrow beam– MRSUK; back ex-tensions – MRSIST; 30 second sit ups – MRSD30; push-ups – MRSSK; coordination with pole – MKKOP; slalom with three medicine balls – MKS3M; 20 steps with pole – MK2IP; long jump from stationary position – MESDM; throwing a medicine ball from a lying position – MFEBML; vertical leap – MESVS.
Variables for determining situational motor capabilitiesBall handling in a slalom – SMVLS; shooting at a target – SMGLC; shooting at a distance from a walk – SMSLD; run-ning in a triangle in a basic defensive position – SMTTOS; shooting against a wall for 20 seconds – SMSZ20.
Data processing methodsDifferences between Premier League and Federal League players, for each applied variable, were confirmed by a T-test for independent causes.
Results and Discussion
Analysis of the results of basic motor ablity tests be-tween female handball players of the Premier and First Federal League.
In Table 1. looking at the arithmetic parameters we can see that players in the Premier League achieved better results in hand tapping, bend, body twist, touch – both of which judge segmented speed – the mechanism for synergistic regulation and regulation of muscle tone duration. Players from the Premier League achieved better results in the full extensions on a bench and splits – both judge flexibility and are also mechanisms for synergistic regulation and regulation of muscle tone duration. Players at the highest level of competition in BIH – in the scope of judging ex-plosive strength and mechanisms for regulating intensity – achieved better results in the long jump from a stationary position and throwing a medicine ball from a lying position. Players from the Premier League showed better results in push-ups, back extensions and 30 second situps – vari-ables that judge explosive strength.
Players of the BiH First Federal League showed better re-sults over Premier League players in foot tapping, which judges segmented speed, and flex movement with a stick pole, which measures flexibility. Players of the First Fed-eral League showed better results in standing on one leg crosswise on a bench with eyes closed, standing on a turned bench, and balancing on a narrow beam, all of which judge balance. Players of the First Federal League BIH showed better results in coordination with pole, slalom with three medicine balls and 20 steps with pole – vari-ables which measure coordination.
Results of the T-test (table 2.) show significant differences for the following variables: hand tapping – MSBTAP, Bend, body twist, touch – MSBPZD, balancing on a narrow beam – MRSUK, 20 steps with pole – MK2IP, throwing medicine ball from a lying position – MFEBML, push-ups – MRSSK.
Analysis of results of situational motor capabilities between players of Premier League and First Federal League.
In table 3. we can see that female handball players of BIH Premier League achieved better results in shooting at a tar-get, a judge of accuracy accuracy. This is of extreme im-portance because it is responsible for situational precision in shooting at a given target in goal. This aids accuracy in game conditions. Better results in shooting a ball at a distance while walking were achieved by players from the BiH Premier League. Shooting the ball at a distance while walking measures ball throwing strength which is respon-sible for stationary explosive strength of throwing a ball. Throwing a ball for passing and shooting is one of the most common elements of handball technique. Regarding the relatively small dimensions of handball court, strength of ball throwing comes into account only in the organization
HOMO SPORTICUS ISSUE 1 201322
of counter-attacks with long passes and to some extent in quick throwing of balls from one wing to another over the goal-keeper’s space. Throwing strength is much more important in shooting on goal. Since shooting on goal is the method by which goals are scored, and subsequently what decides the result of the match, it is obvious that along with accuracy, the strength with which a handball player can throw the ball is very important Lakota (2006). Players of the BiH Premier League showed better results in shooting against a wall for 20 seconds, which judges ball handling. This represents players’ abilities to make fine adjustments with the ball while in one spot and in motion. Ball han-dling ability should be regarded as a basic precondition in achieving desired success in handball.
Players of the BiH First Federal League showed better results in slalom with a ball, which judges the speed of movement of players with the ball and their ability to cover
ground with a ball in attack. Given the fact that ground is won more quickly in attack when the ball is safely passed, the task of handling the ball during the game is restricted, except in situations where for tactical reasons the ball is handled, for example in an individual counter-attack, in a counter-attack in which the attacking side has one more player than the defense, in a breakthrough between two de-fenders, and in some other attacking combinations. Better results by the players of the Federal League were obtained in running in a triangle in basic defense position, which measures players’ speed of movement without the ball. This is a style of movement which is characteristic of the style of play expected by players in defense. In attack this translates to winning territory and running into space while in defense this translates to covering ground in preventing counter-attacks in different ways, including marking and distracting opposing forwards.
Table 1. Difference in variables for basic motor movements between PremierLeague BIH and First Federal League players.
Table 3. Difference in variables of situational motor parameters between BiH Premier League and BiH First Federal League players.
HOMO SPORTICUS ISSUE 1 201324
Conclusion
Results of this study show that female handball players in different levels of competition differ significantly statisti-cally in basic and situational motor abilities.
The existence of these differences between female hand-ball players of different levels of competition is primarily due to the differences in level of competition. BIH premier league players have significantly more motivation because they have better help and support from RSBiH, and there-fore have seriously defined careers. As is recognized, the psychological aspect is very important in sport. Premier League players have a better and more organized system of competition, significantly more league games during the season as well as international matches, while players in the Federal League compete in a lesser level of competi-tion.
The second reason for the existence of these differences can be attributed to the training regime. A third reason for the difference is in the level of mental, physical and tech-nical tactical training of the Premier League players. The obtained results can contribute to better understanding, tracking and analyzing and perfecting conditioning and tac-tical training in various levels of competition, with the aim of improving the quality of competition in BIH.
References
Brčić, B., Viskić Štalec, N., & Jaklinović Fressl, Ž. (1997). Predictive value of variables for the evaluation of technical-tactical elements in handball. Kinesiology, 1(29), 60–70.
Czerwinski, J. (1995.). The influence of technical abilities of players on the tactical selection in the handball game. European Handball, 2:16-19.
Delija, K., Šimenc, Z. i Vuleta, D. (1995). Differences in some general and situation tests of motor abiiities in hand-ball player and those not play handball. Kinesiology 27(1): 57 – 61
Demir, M. (2000). Canonic relation between morphologi-cal dimensions and situational-motion abilities with young handball players. Master’s thesis, Sarajevo: Faculty of Sport and Physical Education.
\ug, M. (2005). Efficiency of different methods for im-provement of handball players jumping ability. Master the-sis, Tuzla: Faculty of physical education and sport.
Kuleš, B. & Šimenc, Z. (1983). Relationship between dif-ferent motor abilities and efficiency in handball.. Kinesiol-ogy, 15 (2): 153-163
Tabel 4.
Values of T-test between players of the BiH Premier League and the BiH First Federal League.
Results of T-test (table 4.) show significant differences for the following variables: shooting the ball at a distance while walking – SMSLD, running in a triangle in basic defense position – SMTTOS, shooting the ball against wall for 20 seconds – SMSZ20.
HOMO SPORTICUS ISSUE 1 2013 25
Kurelić N., Momirović K., Stojanović M., Šturm J., Radojević., Viskić-Štalec N. (1975). The Structure and Evolution of Morphological and Motor Dimensions of youngs. Institute for Scientific Research, Faculty of Physi-cal Education of the University of Belgrade.
Lakota, R. (2006). Effects of programmed work on trans-formation of basic-motor and situationalmotor abilities of handball players. Master thesis, Sarajevo: Faculty of Sport and Physical Education
Mujezinović, M. (2008). Effects of programmed training on special and basic motor abilities in handball. Master thesis, Sarajevo: Faculty of sport and physical education
Rogulj, N. (2000). Differences in situation-related indica-tors of the handball game in relation to the achieved com-petitive results of teams at 1999 World Championship in Egypt. Kinesiology, 32 (2), 63-74. Srhoj,V., Rogulj, N. Padovan, M., Katić R. (2001). Influ-ence of the attack end conduction on match result in hand-ball. Collegium antropologicum, 25(2):611-617
Vuleta, D., Milanović, D., Sertić, H. (1999). Latent structure of the spatial, phasic, positional and movement character-istics of the handball game. Kinesiology, 31(1), 37-53.
Vuleta, D., Milanović, D., Sertić, H. (2003). Relations among variables of shooting for a goal and outcomes of the 2000 Men’s European Handball Championship match-es. Kinesiology, 35(2), 168-183.
Submitted: May 25, 2013Accepted: June 18, 2013
Correspondence to: Srđan Pavlović, MAFaculty of Sport and Physical Education, University of SarajevoPatriotske lige 41, 71 000 SarajevoBosnia and HerzegovinaPhone: +38765 646-163E-mail: [email protected]
HOMO SPORTICUS ISSUE 1 201326
Igor Vučković¹, Aleksandar Kukrić¹, Borko Petrović¹ and Radenko Dobraš1
Selection of Young Basketball Players: Are Physical Characteristics the Most Important?1 Faculty of physical education and sport, University in Banja Luka, Bosnia and Herzegovina
Original scientific paper
AbstractThirty-The aim of the study was to examine whether physical characteristics have influence on the status of 13-year-old basketball players in the team. (First team or substitutions, starters or non-starters). The sample participants was made of 20 basketball players (HT=177.35cm±6.73, BM=61.42kg±8.98, average age 13 years and 7 months ±.28, average basketball training experience 4 years and 6 months ±1.15). The sample was divided into 2 groups: 10 players, 5 players from each of two best regional teams, had status of starters. The other 10 players, from same teams respectively, were not from the first team. Using One-way ANOVA, the differ-ences between starters and nonstarters, were examined in the set of anthropometric variables (body height arm span, standing reach height, body weight and percentage of body fat), motor variables (velocity of neuromuscular reaction time, vertical jump, 5 meters sprint, 10 meters sprint, 20 meters sprint, T-test, Zig-zag test, Ball throw from sitting position, Sit-ups for 30 seconds and standing forward bend) and one functional variable (20-M shuttle run test). Starters had better results in the majority of measured and tested variables. It has been concluded that coaches of these two teams chose, taller players for starters who are more agile, explosive, with stronger arms and shoulder girdle as well. Coaches of younger categories of basketball players could use results of the present study as a certain model of physical characteristics for talented 13-year-old basketball players.
Key words: puberty/ physical characteristics and abilities/ basketball coaches
Introduction
One of the basic characteristics of the puberty is child’s body accelerated development. Within the first and sec-ond year of puberty, annual growth in body height is 8-12 cm (Marković and Bradić, 2009, pp. 80). This period is known as an adolescent accelerated growth. The begin-ning of the adolescent accelerated growth and the year of the biggest height growth are indicators of biological age or child›s maturation level. Children who enter puberty earlier than average child does are called accelerants. Opposite to them, there are children who enter puberty later than aver-age child does. Among 13-year-olds, there are boys whose height and body weight is entirely adequate to age of 15 or 11. That is a characteristic of their biological age, although every one of them is 13 (Karalejić and Jakovljević, 2001, pp. 84). Accelerants, in that period, have significantly more developed motor and functional abilities than their peers have, therefore potential advantage in the selection pro-cess. Coaches often give advantage to such children rather than to children who mature late. Even though these advan-tages will disappear in the adulthood, it can result in loss of certain number of talented basketball players. Namely, favouring of biologically older children leads to their big-ger progress compare to biologically younger peers, who consequently leave basketball (Delorme et al., 2011). Just described problem is called Relative age effect (RAE).
Barnsley, Thompson and Bamsley (1985) have discovered it during their data analysis of Canadian-American profes-sional hockey league (NHL) – season 1982/1983. During that season, players who where born in the first quarter of the year (32% from January to March), almost two times outnumbered players who were born in the last quarter of the year (16.2% from October - December). Further analy-sis confirmed that biologically older (mature) children, who were favoured by coaches since their puberty, have been continuously favoured until their senior team promotion! RAE was even more dramatic in Canadian hockey leagues for younger players, where players who were born in the first quarter of the year outnumbered those from the last quarter by three times. There are numerous evidences of the existence of the RAE phenomenon (according to: Malina et al., 2004; Gil et al., 2007; Delorme & Raspaud, 2009; Torres-Unda et al., 2013). Quite interesting for analysis are data of basketball Euro league (http://www.euroleague.net/competition/players). RAE is noticeable in season 2012/2013: analysis of players shorter than 200 cm indicates that more players were born in the first half of the year (113), than in the second half of the year (69). The difference was less evident for players taller than 200 cm: 94 players were born in the first half of the year and 79 in the second half of the year. Hence, RAE is more prevalent among shorter players. Similar results were found in the other studies on the population of young football players
HOMO SPORTICUS ISSUE 1 2013 27
(Musch, & Hay, 1999; Helsen et al., 2005; Carling et al., 2009) and hockey players (Sherar et al., 2007; Bruner et al., 2011).
The second problem in early talent identification is test bat-tery used in that process. There are number of valid tests for assessment of basketball players’ motor-functional abilities. However, motor-functional status is being very important segment of required abilities for top class bas-ketball, certainly is not the only one! In prepubertal and pu-bertal period, careful interpretation of the results of these tests is necessary, regarding players’ different biological status at the same age. The lack of sufficiently informative test battery seems to be one of the main problems consid-ering talent identification.
Coaches who prepare team for a competition need to chose “the first team” or starters. The majority of stud-ies involving starters and nonstarters, analyzed statistical parameters from games, and impact of each group of play-ers on the final score was compared. The present study considered influence of “basketball specific” morphologi-cal characteristics, motor and functional abilities of young basketball players onto their team status (starter or non-starter).
The purpose of the study was to examine differences in morphological, motor and functional characteristics of 13-year-old basketball players – starters and nonstarters. It has been assumed that starters would achieve better re-sults in all measured and tested variables. The acquired results were used for exact presentation to colleagues/coaches of physical characteristics and abilities that have major impact on selection of young basketball players.
Method
ParticipantsThe sample was consisted of 20 basketball players born in the same year (average age 13 years and 7 months ±.28, average basketball practice experience 4 years and 6 months ±1.15). All participants were members of 2 best teams in “pioneer” category (Basketball club “Šampion-Alfom” and Basketball club “Basket 2000”) in region (“Are-al basketball board Banjaluka”) with population of 500.000 inhabitants. Last year and a half they train one hour four times a week on the average. Apart from training ses-sions, they play around twenty games in season. Coaches of these two teams suggested their 10 best players each and chose starters and nonstarters. Boys gave their formal consent for measuring and testing procedures.
VariablesFrom anthropometric domain, 5 measures were taken: body height, arm span, standing reach height, body weight and percentage of body fat. Motor abilities were tested by: velocity of neuromuscular reaction time, vertical jump, 5
meters sprint, 10 meters sprint, 20 meters sprint, T-test, Zig-zag test, ball throw from sitting position, Sit-ups for 30 seconds and standing forward bend. Stamina was assessed by 20-M shuttle run test. Relative oxygen con-sumption was calculated by indirect method.
All measurements and tests were recommended by Rei-man and Manske (2009), and body height was measured by body height measuring apparatus (SECA 210), arm span and standing reach height (centimetre tape on wall), body weight and percentage of body fat (TANITA BC 418A), velocity of neuromuscular reaction time, vertical jump, 5 meters sprint, 10 meters sprint, 20 meters sprint, T-test, Zig-zag test (Physical Ability Test PAT 02, Uno Lux), ball throw from sitting position (centimetre tape), Sit-ups for 30 seconds (electronic stopwatch) and standing forward bend (Swedish bench with attached ruler).
ProcedureMeasurements and testing were performed during two mornings. First day subjects had body height, arm span, standing reach height, body weight and percentage of body fat measured and one-half of motor tests. On the second day, the rest of the motor tests and test of aerobic endur-ance were finished. Statistical computations were done by statistical software SPSS 11 (SPSS Inc., Chicago, IL, USA). Kolmogorov-Smirnov test was utilized to confirm normal distribution. Descriptive statistics were done after that. At the end, One-way ANOVA was used in order to establish the differences between the groups.
Results
Kolmogorov-Smirnov (K-S) test confirmed that all vari-ables had normal distribution. In Table 1, there are present-ed means, standard deviation and established significant difference between the groups.
Based on mean values (Mean) it is noticeable that start-ers (group 1) had better results in most of measured and tested variables (Table 1). Although the difference is sta-tistically significant only in Body height, Arm span, Stand-ing reach height, Vertical jump, T-test and Ball throw from sitting position. The result was identical in test Sit-ups for 30 seconds. Starters had higher values of Body mass and Percentage of body fat.
Quite interesting is comparison of average values for 13-year-olds from 6 European countries (’’Physical devel-opment and physical abilities of primary school children’’, 2009). Table 2 represents that children from Serbia are taller and heavier than children from 5 European countries, while their abdominal repetitive strength was quite poor. On the other hand, basketball players included in this study were taller, heavier and have better abdominal repetitive strength than their peers have from earlier mentioned 6 Eu-ropean countries. That was expected with regard they were subjects actively engaged in sports.
HOMO SPORTICUS ISSUE 1 201328
Discussion
The present study was an effort to explore physical charac-teristics of 13-year-old basketball players that differentiate starters and nonstarters. Results indicate that starters have better results in all measured and tested variables. How-ever, the difference is statistically significant only at mea-
sures Body height, Arm span and Standing reach height and Vertical jump, T-test and Ball throw from sitting posi-tion tests. Both groups made identical result in the test Sit-ups for 30 seconds. It seems that Karalejić and Jakovljević (2001, str. 52) were right claiming height was the most im-portant selection factor at this age. It is perfectly clear that body height proportionally determines basketball players› arm span and standing reach height. Evidently, coaches of
Table 2
Table 1. Descriptive statistics and differences between the groups
Variable Group Mean SD Min. Max. F Sig.
Body height (cm)12
181.01173.68
5.715.76
173.10166.40
189.50183.30
8.170 .010*
Arm span (cm)12
184.90177.30
6.874.95
175.00170.00
194.00183.00
8.060 .011*
Standing reach height (cm)12
235.50226.60
6.757.82
226.00217.00
244.00238.00
7.419 .014*
Neuromuscular reaction time (s)
12
.50
.528.67E-026.51E-02
.29
.45.59.64
.532 .475
Vertical jump (cm)12
40.1234.80
5.991.57
29.0032.00
49.0037.00
7.388 .014*
Sprint 5 meters (s)12
1.771.82
6.36E-028.59E-02
1.671.69
1.902.00
1.853 .190
Sprint 10 meters (s)12
2.632.69
8.94E-029.88E-02
2.502.59
2.792.94
2.028 .172
Sprint 20 meters (s)12
4.084.16
.16
.153.834.00
4.334.54
1.303 .269
T-test (s) 12
11.3612.07
.60
.6910.3711.16
12.2213.32
5.930 .026*
Zig-zag test (s) 12
7.407.64
.43
.456.937.24
8.108.72
1.499 .237
Ball throw from sitting position (m)
12
8.617.25
1.04.49
7.406.20
11.108.00
14.008 .001**
Sit-ups for 30 seconds (number of repetitions)
12
27.6027.60
4.304.12
23.0021.00
35.0033.00
.000 1.000
Standing forward bend (cm) 12
15.0011.80
6.777.71
1.001.00
23.0022.00
.973 .337
20-M shuttle run test(ml·min ˉ¹·kgˉ¹)
12
42.8642.74
5.675.04
35.1235.48
52.9350.55
.003 .960
Body mass (kg) 12
64.7358.11
5.7210.65
59.7045.50
77.9084.20
3.000 .100
Percentage of body fat (%) 12
16.1815.55
2.452.84
12.9011.40
20.0020.40
.282.602
Serbia Belgium Spain Slovakia Lithuania Estonia
Body height (cm) 166.07 159.50 159.20 163.10 163.20 160.30
Body mass (kg) 56.80 48.60 51.60 50.50 49.40 48.10
Sit-ups for 30 seconds 23.77 24.10 22.80 25.80 25.70 24.50
HOMO SPORTICUS ISSUE 1 2013 29
these two teams for starters have not only taller but players with more explosiveness, agility, stronger arms and shoul-der girdle. Considering physical qualities only, it could be said that coaches made good choice of starters. However, some authors (Jakovljević, 1996; Kioumourtzoglou et al., 1998; Karalejić, Jakovljević and Mandić, 2009; Faubert, & Sidebottom, 2012) state that one of the key differences between good and poor young basketball players is abil-ity to understand the game, moreover application of their cognitive skills in finding solutions to complex tasks in all phases of basketball game. Therefore, apart from physical predispositions, good basketball player must have above average “so called” basketball intelligence.
According to the authors, very few articles explore rela-tionships between physical qualities of pubertal basketball players and their team status. Comparing our findings with those from Torres-Unda et al. (2013), it could be said there are some similarities. Spanish authors’ analysis showed that selected elite basketball players, aged between 13 and 14, had better scores in all measured and tested variables than their non-elite peers had. Young elite basketball play-ers were taller, heavier, more muscular, faster in 20 meters run, more explosive, agile with better stamina. According to Karalejić and Jakovljević (2009; pp. 88, 91, 105) best 13-year-old basketball players from Serbia had following results in motor tests: Vertical jump – 40.60cm, Sprint on 20 meters – 3.60s, T-test – 11.03s and Zig-zag test – 7.10s. Results of 13-year-olds from Serbia are better than results of basketball players included in the present study. However, in a later study, conducted with the best 13-year-old basketball players from Serbia, results were somewhat different: participants› average body height was 171.06 cm, body mass 56.91 kg, average time on test Sprint on 20m – 3.79s (Jakovljević, Pajić, Gardašević and Višnjić, 2011). In relation to Vučković, Kukrić, Petrović and Dobraš›s (2013) study conducted on the same sample of participants, it is interesting that the present study did not register significant relationship (χ²=.202; C=.100; p=.653) between the Relative age effect and players› team status (starter or nonstarter).
In general, authors who studied particular characteristics and abilities of young basketball players draw same old common conclusion: the success in basketball depends on multiple factors.
Conclusion
Considering only physical characteristics of basketball players included in the present study, it could be stated that their coaches made right choices of starters for their teams. However, this study represents just one “early in-dicator of the state” of young basketball players’ physical characteristics. Recent scientific studies indicate that an athlete should spend around 10 years of continuous prac-tise in order to fulfil his genetic maximum. It is of great importance to pass this peace of information as a scientific
fact to parents and coaches, in the first place, who often their entire coaching philosophy, methods, means and training intensity place in the context of the current results. For the purpose of quality assessment of talented basket-ball players, it would be useful to apply battery of psychol-ogy specific and basketball specific tests! However, such tests practically do not exist due to serious methodologi-cal issues concerning standardisation and validity. Direct consequence of this problem goes in coaches’ favour – the practise showed that coach’s feeling, in segment of basketball players’ tactical-cognitive-character traits has higher predictive value than, at this moment, moderate scientifically proven test battery! Nevertheless, it should be emphasised that best results in talent identification are made in interactive efforts of coaches and sport scientists. Based on aforementioned facts it could be concluded that talent identification faces serious problems, firstly at young age selection.
The coaches of younger categories of basketball players could use the results of the present study as an indicative model of physical characteristics of talented 13-year-olds. Comparison of their team members with this model could provide further knowledge they could use in creation of team’s development program.
References
Barnsley, R.H., Thompson, A.H., & Bamsley, RE. (1985). Hockey success and birthdate: The relative age effect. Canadian Association for Health, Physical Education, and Recreation, 51(1), 23-28.
Bruner, M., Macdonald, D., Pickett, W., & Côté, J. (2011). Examination of birthplace and birthdate in world junior ice hockey players. Journal of Sports Sciences, 29(12), 1337-1344.
C. Carling, C., F. Le Gall, F., T. Reilly, T., & A. M. Williams, A., M. (2009). Do anthropometric and fitness characteris-tics vary according to birthdate distribution in elite youth academy soccer players? Scandinavian Journal of Medi-cine and Science in Sports, 19(1), 3–9.
Delorme, N., & Raspaud, M. (2009). The relative age effect in young French basketball players: a study on the whole population. Scandinavian Journal of Medicine & Science in Sports, 19(2), 235-242
Delorme, N., Chalabaev, A., & Raspaud, M. (2011). Rela-tive age is associated with sport dropout: evidence from youth categories of French basketball. Scandinavian Jour-nal of Medicine & Science in Sports, 21(1), 120-128
Physical development and physical abilities of primary school children (2009). Belgrade: The Republic institute for sports. Available 19. 2. 2013. from www.rzsport.gov.rs.
HOMO SPORTICUS ISSUE 1 201330
Faubert, J. & Sidebottom, L. (2012). Perceptual-Cognitive training of athletes. Journal of Clinical Sport Psychology,6, 85-102.
Gil, S., Ruiz, F., Irazusta, A., Gil, J., & Irazusta, J. (2007). Selection of young soccer players in terms of anthropo-metric and physiological factors. Journal of Sport Medi-cine and Physical Fitness, 47(1), 25-32.
Helsen, W., Van Winckel, J., & Williams, A. (2005). The relative age effect in youth soccer across Europe. Journal of Sports Sciences, 23(6), 629-636.
Hoare, D. (2000). Predicting success in junior elite bas-ketball players - the contribution of anthropometic and physiological attributes. Journal of Science and Medicine in Sport, 3(4), 391-405.
http://www.euroleague.net/competition/players; preuzeto 9. januara 2013. godine
Jakovljević, S. (1996). Simultaneous influence of the spe-cific basketball motoric and cognitive abilities on success of basketball. Facta universitatis, 1(3), 91-98.
Jakovljević, S., Pajić, Z., Gardašević, B., Višnjić, D. (2011). Particular anthropometric and strength character-istics of basketball and football players aged 12 and 13. In S. Simović (Ed.). Proceedings of International scientific conference ’Anthropological aspects of sports, physical education and recreation’’ (str. 42-48). Banjaluka: Faculty of physical education and sport.
Karalejić, M., Jakovljević, S. (2001). The basics of bas-ketball. Faculty of sport and physical education, Belgrade, Serbia.
Karalejić, M., Jakovljević, S. (2009). Diagnostics in bas-ketball. College of sports and health Belgrade, Serbia.
Karalejić, M., Jakovljević, S., Mandić, R. (2009). Relation-ships between basketball skills and certain cognitive abil-ites of junior basketball players. Physical culture, 63(1), 60-67.
Kioumourtzoglou, E. Derri, V., Tzetzis, G., & Theodora-kis, Y. (1998). Cognitive, perceptual, and motor abilities in skilled basketball performance. Perceptual and Motor Skills, 86, 771-786.
Malina, R. M., Bouchard, C., & Bar-Or, O. (2004). Growth, maturation, and physical activity (2nd ed.). Champaign, IL: Human Kinetics.
Marković, G., Bradić, A. (2009). Football – integral condi-tioning training. Foto Art d.o.o. Sarajevo, Bosnia and Her-zegovina.
Musch, J., & Hay, R. (1999). The relative age effect in soccer: Cross-cultural evidence for a systematic discrimi-nation against children born late in the competition year. Sociology of Sport Journal, 16(1), 54 – 64.
Reiman, M., & Manske, R. (2009). Functional Testing in Human Performance. Human kinetics.
Sherar, L., Baxter-Jones, A., Faulkner, R., & Russell, K. (2007). Do physical maturity and birth date predict talent in male youth ice hockey players? Journal of Sports Sci-ences 25(8), 879-886
Torres-Unda, J., Zarrazquin, I., Gil, J., Ruiz, F., Irazusta, A., Kortajarena, M., Seco, J., & Irazusta, J. (2013). Anthro-pometric, physiological and maturational characteristics in selected elite and non-elite male adolescent basketball players, Journal of Sports Sciences, 31(2), 196-203.
Vučković, I., Kukrić, A., Petrović, B., Dobraš, R. (2013). Relative age effect and selection of young basketball play-ers. Physical culture, 67(2), In press.
Submitted: May 25, 2013Accepted: June 21, 2013
Correspondence to:Igor Vučković, PhDFaculty of physical education and sport, University of Banja LukaBosnia and HerzegovinaPhone number: 00387-65-485-902E-mail: [email protected]
HOMO SPORTICUS ISSUE 1 2013 31
Siniša Kovač1, Rasim Lakota1 and Monika Kapetanović1
Kinematic Research of Improvement the Fact that Shorter and Direct Skiing Line Achieved Higher Speed While Passing Thought Slalom Gates1 Faculty of sport and physical education, University of Sarajevo, Bosnia and Herzegovina
Original scientific paper
AbstractKinematic analyzes in this research is aimed to determine are the competitors with shorter skiing line achieved higher speed while passing thought slalom gates. In the first part of research it was discovered that the competitors who had the shorter skiing lines in the first curve, as a rule, had the longest skiing lines, in the second turn. Based on the analysis improved in here, is possible to see that it is very hard, maybe even impossible, to ski in a way where the skiing line is very short during the next few curves in row. The second part of research is aimed on making correlation be-tween skiing path and the skiing speed on the chosen sample in the measured space (two slalom curves).
SažetakKinematičkom analizom pokušalo se utvrditi jesu li natjecatelji s kraćom linijom skijanja postizali veće brzine pri prolasku kroz slalom vrata.U prvom dijelu istraživanja otkriveno je da su natjecatelji, koji su u prvom zavoju imali najkraće linije skijanja, kao po pravilu, u dru-gom zavoju imali najduže linije skijanja i obrnuto. Na temelju tih, dobivenih, analiza, može se utvrditi da je vrlo teško, možda čak i nemoguće, skijati na takav način da je linija skijanja vrlo kratka u nekoliko uzastopnih zavoja. Drugi dio istraživanja usmjeren je na uspostavljanje korelacije iz-među putanja kod skijanja i brzine skijanja na izabranom uzorku u mjerenom prostoru (dva slalom zavoja).
Ključne riječi: alpsko skijanje, kinematika, brzina skijanja, tra-jekorij skijanja.
Introduction
American biomechanics’ professor, ski instructor and coach, Le Master (by:Lesnik at al.1999) says: alpine ski-ing is sensory sport. We like what we feel when we see another skier performing a big turn on skis. And what is it you feel? Force. The force of the earth’s gravity and the momentum given by snow, allow skiing. For these forces, shaped skis as they are formed, and our body moves and turns as you move. When a skier realizes the effects of these forces on him and skis, and placing it in specific positions learn to use the influence of forces in conjunction with the skiing gets more sense.
The assumption is that the best skiers who decide and de-termine guidelines for the development of techniques of al-pine skiing, the best define the methods and apply opinions given by ski instructors. Task of skiing experts is to form new settings offered by the top competitors. The manner in which they skied led to the best results.
Typical characteristics of the position in the competitive skiing are in order: open ski position, knees pushed for-ward, the upper body is partially bent and arms pushed
forward. Only candidates who are physically very well pre-pared, they are able to ski in this position at high speed. Good distribution of weight on the skis in turn the entire length of force depends on the balance of the center of body gravity in relation to the skis center (relative to the front, rear and edges of skis). In the competitive alpine ski-ing slightest possibility shifts the center of weight in the vertical direction is of great importance (Kovač 2004). Consequence is adequate, displacement as well as the possibility of maintaining prolonged pressure on the skis sliding surface.
Speed skiing in slalom competitionBy changing the direction of movement on the edges and achieve the same length of turns, speed skiing increases from curve to curve. Because of fear and insecure, skier attempts to control the speed by the lateral deflections as it is allowed by doing vertical and lateral movements.
Authors such Rajtamajer and Gartner, are convinced that the high quality standards of turn are based on the importance of the last part of the turn. Turn length is ex-pressed rapidly as skier sets skis on edge. Speed skiing must be regulated by skis rotation along or across the fall
HOMO SPORTICUS ISSUE 1 201332
line. Shorter skis phase rotation is better controlled skiing speed. During skis rotation along or across the fall line, sliding sideways still takes place in some turns.
Skiing line choice between the gatesAs noted above, several factors affect the success in alpine skiing. Among them is the line of skiing that is more or less direct, with maximum speed and that has to be under load. In every sport, athletes develop as individuals did not base on pre-developed and established program, nor alpine ski-ing is no exception. Of course, it often happens that the established work program and its effective implementation are separated. In this case, the program must be modified and adapted to new circumstances dictated by the relation-ship of the program and participants. First, young athletes need to learn proper technique that improves over time until they reach a peak performance (Hintermeister et al.,1995). Later, the priority of training techniques in the first place should be the development of the best possible ways of skiing while maintaining the highest possible speed ski-ing. During the skiing speed is changed, and the task of competitors is to maintain an optimal balance between the increase and decrease speed (Kugovnik, Nemec, and Su-pej, 2005).
The problem in this study represents a dilemma whether shorter line provides skiing and skiing fast through the gates? Does skiers whose ski more in direct line to the entrance of the gate keeps the speed skiing or even in-creases. Are the shorter and more direct lines of skiing requiring achieving higher speed and better results? Is this way of skiing is possible throughout the length slalom races or just in certain segments, remains an open ques-tion for analysis.
Methods
Respondents were alpine skiers who were actively com-peting in alpine skiing, Ski World Cup - Slalom. Charac-teristics of slalom techniques have been studied based on kinematic measurements recorded during the 2004 season at the World Cup slalom in Kranjska Gora sample consisted of 18 competitors at the door numbers from 2 to 69, only those who are, according to experts, skied through the gate without any visual or obvious differences that could affect the result in the measured area, are included in the final kinematic analysis. This allows the consideration of all the competitors from the slalom rankings, which competed 2004 at the FIS World Cup. Data for this research is par-tially taken from research by Lešnik (2007) And the given information are reanalyzed and further clarified.
Data AnalysisThe images were analyzed with the program for kinemat-ics - biomechanical analysis (APAS system for kinematic analysis). After kinematic analysis, data were analyzed by statistical program SPSS, using the Description statistics
to calculate the average speed and the average gradient of the slope in the measured area, as well as Pearson corre-lation analizes.
This way of processing data provided the coordinates of the points that mark the ends of the segments in the mea-surement space - X and Y.
Based on the distance of a point position of the right and left ankle (stat. mean) for each contestant calculated the average distance of the fall line skiing line (y = 0) in the measuring area, and measuring the space consists of two slalom turns. Analysis to determine whether there is a similarity between the skiing lines at poles (gates) first and second poles of each competitor, or whether there is a difference within the skiing trajectory lines.
According to the experiences of other scientists came a conclusion that the assessment of the performance of skiers is successful only if analyzed two turns in row of slalom race.
Slalom competitor trajectories variablesStart a new turn and the end of the previous turn is defined by the measured area for each competitor by the time or place of transition skis path (mean left and right ankle) and orbits the center of gravity of the skier’s body. Crossing skis path represents the mean of the path of the left and right ankle in two phases, which are part of the full scale space positioned in the first run. The average distance of a skiing line from the point y = 0 (fall line) is calculated based on the distance of all points in the skis path..
Calculating slalom competitors average speed variables Calculate the average speed of competitors (mean ankle) is measured in the measured area in slalom course during the competition. Average rate calculated is based on the abso-lute velocity of competitors - from the first poles, located in the measuring area, crossing the path of the skis and the center of the body (change of the edges), and to the other end of the stake. Based on the absolute velocity in the above paragraphs, calculated the average speed for each contestant measured segment (Vavg). The average gradi-ent of the slope in the measured area was 21.46% ± 2%.
Results and discussion
It should be noted that the data obtained for each line skiing slalom result of the arithmetic mean of the position - the ankles distance position, when a skier starts to turn to the stake, which is located in the measuring segment. (Supej at.al.2004).Different distances between both skis are more or less distant outside ski, too often can have an impact on it. The above mentioned data therefore can serve as
HOMO SPORTICUS ISSUE 1 2013 33
support in the further analysis. The relationship between the distance to the poles and away from the other poles, it was established whether the distance line skiing individual competitors from the first stake, and the second stake of approximately equal (Božič,2005). This means that the competitors whose lines were closer to the first ski pole were generally more away from the second pole. It should be noted that the competitor bib number 2 has skied at a minimum distance from both poles in relation to all the competitors who represent a sample of this research. Its average distance from the y-axis to the first and second stake is 3.05 m, the average is calculated based on the re-sults of kinematic measurements. Competitor bib number 32, who skied nearest the first pole and furthest second stake, has an average distance from the y-axis (fall line) slightly higher and it is 3.13 m this average is also calcu-lated on the basis of the results obtained.
After examining the results visible is negative correlation (Pearson correlation coefficient of -0.256). This means that the competitor who have been away from the y-axis on the first pole, in most cases, were much closer to the y-axis on the other pole, and vice versa. A typical example is the competitor bib number 32, whose line was the closest to first ski pole and farthest from the second pole. At the same time, it should be noted that there is no competitor who had a very short line of skiing to both poles in the mea-surement space. No one competitor is not very far from the point 0 (y-axis), as compared to both poles. The question that is posed in the problem of that, is it possible to ski that way about several consecutive gates is somewhat or so appropriate. It can be argued that means in the slalom is impossible to talk about the ideal skiing line and that the optimal skiing line is one that guarantees the minimum loss of racer’s speed.
Table 1. The correlation (relationship) between the distance from the line of competitor’s skis from y– axis at the first and second pole calculation.
Distance to the stake and the stake of the second distance from the middle of the ankle length axis - y in the first and second pole (meters) Pearson correlation coefficients cor-relation Sig. (2 - tailed) statistical significance of the cor-relation coefficients N is the number of respondents
Explanation of the table:Speed / AVG calculated values of correlation coefficients and statistical significance of speed skiing in measuring segment
Line / AVG calculated values of correlation coefficients and statistical significance of the lines of skiing in the measur-ing segment Pearson correlation coefficients of correlation value
Sig. (2 - tailed) statistical significance of the correlation coefficients
N number of respondents
Table 2. Average speed and average length of two turns in the measuring segment correlations
On the objectives basis set out in the paper or whether competitors who choose the shortest line between the ski gates of higher speeds, it slips away or ski faster between the slalom gates and achieve the better result at the end of the race.
In addition, the aim of this paper is to determine the kine-matic analysis of the difference in speed skiing for athletes with a shorter skiing line trajectory track and longer lines of skiing, or to possibly prove that it is not necessary that the shorter trajectories through the course and the fastest path skiers move the speediest in the slalom competition.
Skier whose ski more direct line to the entrance of the gate keeps the speed of skiing or even increases. In this case, the optimum orientation of slip can be preserved by only physically strong competitors with perfect technique. Fast-changing angles of direction and entering the gates on properly installed skis enables the creation of a short line at the next gate. (Matijevec, 2003). Consequently, the speed and the short line of skiing cause increased pressure at skis when creating curves. When the specified pressure is too strong, the competitor must reduce skiing speed (Lešnik, Žvan 2010).
Shorter trajectory lines of skiing a smaller distance or short path skiers from one gate (in the measured area) represent an important parameter in the study of ski technique. A condition that must be met is that the competitor must, if it wants to do a proper turn, a change of angle - direction of movement, weight transfer and set “new” skis to turn. It should be noted that they will achieve greater centripetal acceleration if we have a short trajectory line of skiing at the same speed. Modern competitive techniques, shorter skis with pronounced lateral curve enabling these require-ments. So all need to be aware that when making such
Correlation
Distance from the first and
second pole
Distance from the first and second pole
Pearson correlation - 0.256
Sig. (2-tailed) 0.304
N 18
CorrelationDistance from the
first and second pole
speed/ AVGand
skiing line / AVG
Pearson correlation
-0.551
Sig. (2 – tailed) 0.018
N 18
HOMO SPORTICUS ISSUE 1 201334
turns achieves elevated pressure between skis and snow, resulting in a higher reduction rate at the exit of the turn. Therefore, we are faced with the dilemma of how we need to set the skis in a curve to achieve speed and consequent success in competitive alpine skiing. The focus of the work on the part of the movement included in the training pro-cess is closely related to the tactics used in the competi-tion (Supej and Černigoj, 2006) and skiing these param-eters, as well as likely in other sports.
Different studies tell that several factors affect the success in alpine skiing, in this case the slalom race. Among them is the ski trajectory line and skiing speed. Skiing line is more or less direct, with maximum speed, which must be under full load on curved skis. In every sport, athletes develop as individuals based on pre-developed and established pro-grams, nor alpine skiing is no exception. Of course, it often happens that the established work program and its effec-tive implementation are separated. In this case, the pro-gram must be modified and adapted to new circumstances dictated by the relationship of the program and individual participants. By changing the direction of movement on the ski edges and achieving the same length of turns, skiing speed increases from turn to turn. (Lesnik, Žvan, 2007).
As already mentioned, the small differences can decide the success of each contestant. It is essential to have the nec-essary knowledge of the tactical elements that need to be in every competition to allow an opportunity to achieve a good result. Tactics is probably the least explored in alpine skiing and approaches should be on to pay more attention. The difference in the perception of coaches and competi-tors, on the one hand and measure the skiing speed, on the other, often resulting in improper choice of developing ski technique and tactics. All of the above, later becoming a critical factor in the differentiation of good and top racers. Part of the authors believes that more space gives the pos-sibility of development techniques of skiing, if you analyze, in details, previously mentioned facts (Lesnik, Žvan, 2007).
Conclusion
Commenting on the fall line, speed control on the edges of skis depends on the ideal length of the turn and turn lines that skier make. If there fall lines apparent same for two skiers, turn radius will be smaller for skiers who’s mak-ing the shorter turns. The results would probably be a lot more objective it was possible to measure the entire race in these conditions, and not only its segments. Unfortunately, it is not possible at the moment due to technical and orga-nizational problems. However, these results demonstrate the possibility of at least a better orientation training slalom technique, seeking a better way to select skiing turn lines. Due to the fact that the aim of all the techniques is to achieve the highest speed, the speed achieved by groom-ing technical skills has little to do with skier’s courage. This leads surely at the reason on risk of several falls so the skier’s fear was prominent in reducing of skiing speed.
It is important that the competitor learns to recognize when to ski really fast or when it should speed up skiing on a particular part. Therefore, the selection of skiing lines in a particular segment like the subject of this analysis is con-sidered as an important factor that is often crucial when you need to decide who is good and who is the best skier.Developing good ski technique has long been based on experimenting with different positions, useful in ski at-titudes and the option of skiing as well as the tactics of competitors. Therefore, to achieve good results in modern, competitive alpine skiing, among the other psychomotor potentials, depending primarily on good technical and tac-tical parameters. These parameters are based on detailed planning and transformation process management, which denies knowledge base without individual age groups in alpine skiing. In the analysis of the processed segment of skiing parameters is perhaps the most important and equivalent to success. Specifically, it is a special tech-nique and tactical aspects of modern slalom turns, some of which are directly linked to greater or lesser efficiency in the top of the alpine skiing techniques. When solving problems in sport is difficult or even impossible to divide the different aspects, included in the training process is closely related to the tactics used in the competition and skiing these parameters, as well as likely in other sports, is of crucial importance.
References
Božič, B. (2005). Correlation between the length of a line of skiing and the achievement of velocities of top alpine skiers in slalom – tactics used in competitions. (Unpublished BA thesis). Ljubljana: University of Ljubljana, Faculty of Sport.
Hintermeister, R.A., O’Connor, D.D., Dillman, C.J., Suplizio, C.L., Lange, G.W., & Steadman, J.R. (1995). Muscle activ-ity in slalom and giant-slalom skiing. Medicine and Science in Sports Exercise, 27(3), 315-322.
Kovač, S. (2004). Basic Characteristics and Alpine Ski-ing Biomechanical Analyzes prof. paper. Internat. Course ZUTS-a BiH, Ski Fed. BiH, Sarajevo.
Kugovnik, O., Nemec, B., & Supej, M. (2005). Time advan-tage using an improved slalom technique. In E. Muller, D. Barcharach, R. Klika, S. Lindiger & H. Schwameder (Eds.), Science and Skiing III (pp. 87–95). Oxford: Meyer & Meyer Sport.
Lešnik B., Žvan M. (2010). A turn to move on, ZUST Slo-venia, Ljubljina.
Lešnik B., Žvan M. (2007). The Best Slalom Competitors Kinematic Analyzes of tracks and velocities, Kinesiology 39(2007) 1:40-48, FS , Ljubljana.
Lešnik, B. (1999). Defining and comparing the effective-ness of motor structures of modern giant slalom tech-
HOMO SPORTICUS ISSUE 1 2013 35
niques. (Unpublished doctoral dissertation, University of Ljubljana) Ljubljana: Faculty of Sport.
Matijevec, V. (2003): The path of masters. Ljubljana, Mar-bona, Slovenia.
Rajtamajer,D i Gartner,F.(1986). Skiing, Theory and Me-thodics of Alpine Skiing, Maribor, Ped.Acad. Slovenia.
Supej M., O. Kugovnik, B. Nemec (2004). Modeling and Simulation of Two Competitors Slalom Techniques. Kine-siology 36 (2). University of Ljubljana.
Supej M., O. Kugovnik, B. Nemec (2005). Changing Condi-tions on the Slalom Ski Course Affect Competitors’ Per-formances. Kinesiology. 37 (2), 151-158. University of Ljubljana.
Supej, M., & Černigoj, M. (2006). Relations between dif-ferent technical and tactical approaches and overall time at men’s World Cup giant slalom racers. Kinesiologia Slo-venica, 12(2) 59-68., Ljubljana.
Submitted: May 10, 2013Accepted: June 08, 2013
Correspondence to:Siniša Kovač, PhDFaculty of Sport and Physical Education University of SarajevoPatriotske lige 41, 71 000 - Sarajevo, Bosnia and HerzegovinaPhone number: +387 33 668-768E-mail: [email protected]
HOMO SPORTICUS ISSUE 1 201336
Martina Mavrin Jeličić1
Transformational Effects of the MBS Yoga Program on Treated Motor Status1 Faculty of Transport and Traffic Sciences, University of Zagreb, Croatia
Original scientific paper
AbstractThe main objective of this research was to determine the effect of the “MBS Yoga” programme on quantitative changes in manifest dimensions of power (static and dynamic), balance and flexibility over a period of 3 months.The research was conducted on a sample of 69 first and second year female students from the Faculty of Transportation and Traffic Sciences in the 18-22 year age group, who were selected at random. The sample consisted of two groups of female students, an experimental and a control group. The experimental group comprised 33 female students who implemented the recreational “MBS Yoga” programme during three months. The control group comprised 36 female students who were involved teaching a programme of physical education courses at the faculty. A sample of manifest variables consists of twelve tests, three for each of the motor abili-ties. In summing up the obtained t-test results, we can conclude that trimonthly implementation of the “MBS Yoga” programme led to anticipated statistically significant changes between the control and experimental groups for each particular variable and subsequently it can be conclude that all the set conditions of this research had been fully confirmed. Based on the t-test results for paired samples of each variable, and especially the results of discriminant analysis, it is clearly noticeable that the tri-monthly “MBS Yoga” programme leads to a statistically significant change for each motor variable in the experimental group between the initial and final verification.
The author of this paper is also the author of the “MBS Yoga” programme, which is defined as a yoga style pos-sessing a more dynamic character. It is thought that there are approximately 840,000 yoga exercises (Birkel DA, Edgren L.1998). The programme consists of yoga exer-cises providing the program with diversity, flexibility, bal-ance and a mental focus on the body during the actual course. Though the entire programme is based on yoga exercises, it is complemented with Pilates techniques (vi-sualization), dance aerobics (moderate intensity) and kine-sitherapy (corrective exercises). A variety of props (large and small balls, weights, tyres, elastic bands ...) and a va-riety of methods, including motion correction, increasing load intensities, and motivation in class provide a greater thoroughness of impact on anthropological status and on training diversity. The “MBS Yoga” programme is largely based on yoga exercises, including breathing and relax-ation techniques.
The World Health Organization (WHO) officially recognizes yoga as one of the scientifically verified health and pre-vention systems. Yoga is a combination of natural body movements called “Asanas” which when executed are harmonised with regular and controlled breathing. Using a variety of movement forms, the goal of this type of pro-
gram is to cause a burden possessing an aerobic character at a moderate intensity (60-80% of the maximum heart rate per minute) using a variety of yoga exercises. The results of exercising at this load level is the development of basic endurance, development of the cardiovascular and respira-tory systems, aerobic muscular endurance, aerobic capac-ity, reduction of subcutaneous adipose tissue and preven-tion of metabolic diseases (Andrijašević, 2010)
Implemented method
In this research, 69 first and second-year female students from the Faculty of Transport and Traffic Sciences in the age of 18-22 year were selected at random to participate. The sample comprised two groups of female students, an experimental and a control group. The experimental group comprised 33 female students who implemented the rec-reational “MBS Yoga” programme during a three-month period. The control group comprised 36 female students who were involved in teaching a programme of physical education courses at the faculty.
A sample of manifest variables consisted of twelve tests, three for each motor ability. The choice of motor skills (Metikoš et al. 1989) analyzed in this study was based on the realization that latent dimensions (strength, flexibility,
HOMO SPORTICUS ISSUE 1 2013 37
balance) are stimulated during targeted treatment using the “MBS Yoga” programme over a duration of 3 months.
The variables selected for assessing motor abilities are de-scribed in the proposed validated series of tests used to assess motor skills (Metikoš et al. 1989) and accompanied by certain modifications. The variables are as follows: (1) Tests for assessing balance (Standing on one foot length-wise on a balance bench with eyes open - R1; Standing on two feet lengthwise; Standing on two feet crosswise on the balance bench with eyes open - R3; (2) Tests for assessing dynamic forces: (1) Raising the upper body with weights - DSEL; half squats with weights - DSP; Bench press - DSBP (Mikić, B., 1999), (3) Tests for evaluating static power: (1) Horizontal endurance face down - SSHI; (2) Horizontal endurance face up - SSIZP; (3) Load endur-ance load in a half squat position - SSIP, and tests for as-sessing flexibility: (1) bench crunches - FPLL; ( 2) astride touch-toe - FPR, (3) twists with the stick - FI.
The subjects from the experimental group conducted the “MBS Yoga” programme for a period of three months, three times a week for 60 minutes. The implemented pro-gramme included the following elements: exercises for flex-ibility, strength, balance, coordination, relaxation, as well as breathing techniques and corrections. One hour of the “MBS Yoga” programme comprised preliminary, preparatory, pri-mary and a final part providing an integral harmonious unit without pauses between parts, making it all the more dy-namic. The introductory part of the class hour lasts up to 5 minutes, which includes a brief theoretical section on anato-my, physiology, biomechanics, nutrition and breathing, with various techniques for relaxation and movement correction.
The preparatory part of the hour (15 min) consists of general preparatory exercises based on large amplitude yoga exercises in the low intensity zone and corrective exercises. Based on the effects, the exercises were me-thodically sorted in the following sequence: relaxation ex-ercises, breathing exercises, corrective exercises aimed at optimizing movement, including stretching exercises that aim to provide functional body movements (Hannaford, C., 2007). The main part of the hour covering a period of 35 min involved a continuous aerobic regimen. The main A part of the hour was performed in a standing position where movement of the lower extremities included walking, knee-lift, hip extension, leg abduction, half squats, lunges, etc., while development of the upper body required performing large amplitude yoga exercises using props, water balls.
The main B part of the hour was performed in the sitting, prone and kneeling body position with exercises focusing on developing power (Braith, RW, JE Graves, SHLeggett, ML Pollock, 1993), flexibility and balance, and if necessary were supplemented with corrective movement exercises and exercises with the eyes closed (Kosinac, Z., 2009). The final part of the hour lasted up to 5 min, and included yoga exercises that focused on stretching the muscles
and proper continuous breathing, with the goal of reducing heart rate and relaxing the entire body (Tran MD, Holly RG, Lashbrook J, Amsterdam EA, 2000).
Subjects in the control group conducted the physical ed-ucation curriculum for a period of three months, once a week for 2 hrs. The control group performed walking tours on Sljeme. It should be emphasized that walking speeds were not set for the programme subjects or for the rest periods while ascending to the destination.
Basic statistical parameters were calculated for all vari-ables and the results were presented in tables and graphs; (1) in order to determine the significance of differences between the experimental and control groups, the t-test for independent samples was applied to each variable sepa-rately; (2) in order to determine the significance of differ-ences between the initial and final verification in the experi-mental group, the t-test for paired samples was applied to each variable separately; (3) for the purpose of determining the statistical significance of changes in all observed vari-ables together and determining which variables lead to a statistically significant difference between the experimental and control groups, discriminant analysis was applied (Mi-lanovic, D., 1997).
Results and Discussion
Analysis of the obtained results, in particular using analy-sis of t-values and Sig. (2-tailed) statistical significance for each treated variable led us to observe that there is a statistically significant difference between the experimen-tal and control groups (Table 1). By analyzing the results of t-test with respect to the variables that assess flexibil-ity (Furjan-Mandic, G., Jurinec, J., Wolf-Cvitak, J. Kolar, M., 2003), we observed high statistical indicators of dif-ference in the final measuring between the experimental and control groups. This is an indicator of a well-designed and target-oriented “MBS Yoga” programme, in particular specific yoga exercises that develop flexibility. Statistically significant differences in the area of strength and balance indicate that the “MBS Yoga” programme was created with the clear intention of increasing motor status on the treated areas. (Schell FJ, Allolio B, Schoneck OW., 2001).
Figure 1. The structure of the load intensity (using Borg’s scale (Marković and Bradić, 2009) and temporal articulation of “MBS Yoga” treatment.
HOMO SPORTICUS ISSUE 1 201338
With respect to flexibility, in Table 2 we see that the t-values of transformational effects stemming from the “MBS Yoga” programme for the control group was smaller. However, in terms of statistical significance values, we conclude that there was a change between the two measurements in the experimental group for all treated motor areas.
It should be noted that the largest t-value is attributed to the variable of “flexibility in astride touch-toe” (FPR), which amounts to 8.442 at a statistical significance level of 0.00. It is actually this variable that can rightly be called a vari-able representative of changes between the two flexibility measurements in the experimental group. Based on the t-values and Sig. - statistical significance shown in Table 2, we can conclude that, between the two measurements, there occurred significant changes in the experimental and in the control group. These changes in static strength are the result of desired outcome by the tri-monthly “MBS Yoga” recreational programme.
Analysis of the results presented in Table 2 based on t-values and statistical significance shows that for all pairs of variables statistically significant changes occur between the initial and final measurements. Higher t-values were observed for pairs of variables from the experimental group of subjects, whereas the groups in the pairs of variables that assess the level of repetitive forces experienced a sta-tistically significance between the two measurements. On the basis of the results of t-values and statistical signifi-cance for the experimental group, we observe a difference in both sets of variables that define the balance of subjects. A negative sign shows the differences in changes between the initial and final measurements with a reduction of re-sults meaning a better outcome in the test itself. Results in the control group show that the variable pair group R12 - R11 has no statistically significant difference (t = 1.745, p = 0.09) and this is actually the first variable pair (balance) whereby the t-test does not show statistically significant transformational changes.
Table 1. Testing the difference between arithmetic means and standard deviations of two different groups of subjects (t-test for independent samples
Based on the interpretation of obtained t-test results for paired samples which were applied to each variable sepa-rately, and for the purpose of testing the assumption that a change will occur between the two measurements, we can conclude that the tri-monthly “MBS Yoga” programme leads to statistically significant changes in the experimental group for each variable of analyzed motor space between the initial and final measurements. A much larger signifi-cance of change under the influence of targeted training was noted in the experimental group of subjects when compared to the control group.
Discriminant analysis was applied to determine the statisti-cal significance of quantitative changes in all the observed variables, and to determine what variables lead to a statis-tically significant difference between the experimental and control group subjects.
The results of Barttlet’s Chi-square test (Table 3) shows that the obtained discriminant function is significantly dif-ferent between the groups in the final measurement with a canonical correlation of 0.806 and a statistical significance of p = 0.00. The Chi-square test confirmed a statistically significant difference between the experimental and control groups of subjects in the area of motor skills. The obtained discriminant function was used to determine which applied variable(s) led to significant differences between the ex-perimental and control groups. Such data clearly displays the guidelines covering the influence of the “MBS Yoga” recreational programme on transformation of motor space for subjects. (Schell FJ, Allolio B, Schoneck OW, 2001). It was particularly important to accurately detect the size of the variables that best define the differences, in order to more precisely determine the segmentary orientation of the particular operators in the applied “MBS Yoga” programme (Mavrin, M., 2000).
Table 2. T-test statistical significant changes between initial and final measurements for both groups of subjects
Table 3. Chi-square test of the discriminant function
Eigenvalues
Function Eigenvalue % of Variance Cumulative % Canonical Correlation1 1.857a 100.0 100.0 .806
Wilks’ LambdaTest of Function(s)
Wilks’ Lambda Chi-square Df Sig.
1 .350 64.556 11 .000
HOMO SPORTICUS ISSUE 1 201340
The structure of a discriminant function (Table 4) indicates which variables mostly differentiate these two groups of subjects in the final measurement. In this case, it is the variable “bench crunches” (FPLL) with a correlation coef-ficient indicating a discriminant function of .512. This vari-able, In synergy with other variables, which determine the area of flexibility in the best possible manner, illustrates the primary impact of the “MBS Yoga” programme (Gar-finkel M, Schumacher HR Jr., 2002). The variable FPLL, which has the greatest variability of defining the obtained discriminant function, provides insight into how the “MBS Yoga” programme mostly discriminates the level of trans-formational performance between the two groups of sub-jects with respect to developing flexibility.
This conclusion certainly justifies the programme’s actual targeted orientation, selection of carrier and the frequency of these exercises in the applied trimonthly programme (AMJ, 2004). Besides these variables, the variables in the area of static (isometric) force also associated with large statistical values (SSIP - .334, SSHI - .342 and SSIZP - 135), largely define the discriminant function that distin-guishes the experimental group from the control group in the final measurement. The data justifies the objectives of the programme, which was directed towards increasing activation of the stabilizer muscle by static contractions. ‘Endurance’ exercises were well chosen because they pro-duced transformational results that discriminate improve-ment in the motor status of subjects in the experimental group (Braith, RW, JE Graves, SHLeggett, ML Pollock, 1993). The rest of the explanation covering the discrimi-nant function is assumed by variables that determine dy-namic power and balance. (DSBP - .155, .367, and R 1-R 2 -. 313).
Interpretation and discussion of the results obtained by discriminant analysis of differences in the effects of the applied programme on groups of subjects lead to the fol-lowing conclusions: a specifically targeted trimonthly “MBS Yoga” programme leads to a statistically significant change when comparing the experimental and control groups in all treated variables used for assessing the motor status of subjects.
Concluding
The concluding observations on the transformational ef-fects of the applied programme and obtained differences between the two treated groups of subjects can be ad-dressed in several ways: (1) One of the primary objectives of this research was to determine the differences between the experimental and control group of subjects. In order to analyze the difference between the groups a t-test (for independent samples) was applied. The statistical signifi-cance in differences between the experimental and control groups for all variables was proved, except for the variable “Bench press” (DSBP) which assesses repetitive muscle strength of the upper body through a movement called press.
The differences between the experimental and control group of subjects was due to the influence of different pro-grams. The experimental group conducted the “MBS Yoga” programme that includes exercises specifically focused on the development of selected motor skills in the research (flexibility, strength and balance). The control group of subjects conducted the set physical education curriculum; (2) After analyzing t-test results for paired samples with respect to each of the variables individually, the following sub-conclusions can be drawn: there are between two measurements in all variables of the control and experi-mental groups, except for the variable “standing on one leg lengthwise on the balance bench with eyes open” (R1) in the control group of subjects, with the largest differences evident in the area of flexibility for the experimental group occurring because the “MBS Yoga” programme is based on yoga exercises (Raub JA, 2000),
(3) Statistical indicators of the positive effects on the changes in balance, especially in the variable “standing on one leg lengthwise on the balance bench with your eyes open,” confirm one of the goals of the “MBS Yoga” pro-gramme, which is improving balance. Furthermore, this difference between the two groups is attributed to exercis-ing during the programme with eyes closed, because the fact is that to maintain the body posture, a person uses information coming from the joints, skin, muscles and ten-don mechanoreceptors, from the centre of gravity (located in the middle ear) and the visual system. By eliminating the information that comes to us from the outside world, we rely more on the information we have received earlier, from our motor patterns (Fitts, RH, McDonald, KS, Schluter, JM, 1991),
(5) results from Barttlet’s Chi-square test and the results from canonical correlations prove that the obtained dis-criminant functions define quantitative changes between initial and final measurements in each experimental group for each tested motor space under the influence of the “MBS Yoga” programme. These results indicate that the experimental programme using targeted exercises pro-duced positive transformational effects in the manifest
Table 4. Structure of the discriminant function
VariableFunction
1
FI .308FPR -.048
FPLL .512
SSHI .342
SSIP .334
SSIZP .135
DSBP -.155
R1 -.367R2 -.313
HOMO SPORTICUS ISSUE 1 2013 41
space of balance, strength (repetitive and static) and flex-ibility, and (6) the conducted “MBS Yoga” recreational pro-gramme has a positive effect on the transformation of the dimensions incorporating strength, balance and flexibility in the experimental group of subjects.
However, it is important to mention, however, the great-est contribution of this program demonstrated for flexibility due to the abundance of yoga, balance area because the program in certain parts of running with your eyes closed. The value obtained results in motor strength enables even better conception of the “MBS Yoga” (Maheshwarananda PS, 2000).
Larger differences between the groups were not obtained, and perhaps would be obtained had it been done on an older population, because young, healthy women naturally have a higher level of health.
Recreational programs can achieve the desired effects only if they meet the full criteria for a well-designed program, professional staff, individualized approach, insight into the initial state of the individual, and a sense of the needs of program participants.
References
Alter, M. J. (2004). Science of flexibility. Human Kinetics, IL Champaign.
Andrijašević, M. (2010). Kineziološka rekreacija. Zagreb, Kineziološki Fakultet
Andrijašević, M.(1995), Fitness programi, Zbornik radova ZV, Zagreb
Braith, R.W., J.E. Graves, S.H.Leggett, M.L. Pollock (1993). Effect of training on the relationship between maximal and submaximal strength. Med Sci Sport Exerc. 25(1): 132-8
Fitts, R.H., McDonald, K.S., Schluter, J.M. (1991). The determinants of skeletal muscle force, and power: their adaptibility with changes in activity patterns. Journal of Biomechanics, 24(Suppl.): 111-122.
Findak, Vladimir: Metodika tjelesne i zdravstvene kulture, Školska knjiga, Zagreb,1989
Furjan-Mandić, G., Jurinec, J., Wolf-Cvitak, J., Kolare, M. (2003). Metode za razvoj fleksibilnosti u ritmičkoj gimnas-tici. Zbornik radova 12. ljetne škole kineziologa.
Gismondi, E., Alegi, M. A. (1989.): Educazione motoria nella scuola elementare. Schede didattiche per il primo ci-clo. Giunti & Lisciani Editori.
Garfinkel M, Schumacher HR Jr. «Yoga», BKS Iyengar Yoga Studio of Philadelphia, P
Hannaford, C. (2007). Pametni pokreti., Ostvarenje,Buševec, 14: 9-20
Kosinac, Z. (2005). Kineziterapija sustava za kretanje. Udruga za šport i rekreaciju djece i mladeži grada SplitaLindor, R., E. Argov, S.Daniel (1998). An exploratory study of perceptual motor abilities of women. Percept Mot Skills 86 (1): 279-288
Mahesvaranandam P.S.(2000): Joga u svakodnevnom životu, EUP, Wien
Mavrin, M. (2000): Mogućnost primjene joge u sportskoj rekreaciji. Diplomski rad. Zagreb: Fakultet za fizičku kulturu. Milanović, D.(1997): Priručnik za sportske trenere, Fakultet za fizičku kulturu, Zagreb
Mikić, B.(1999): Testiranje i mjerenje u sportu, Filozofski fakultet Univerziteta u Tuzli, Tuzla
Raub JA (2000) Psychophysiologic effects of Hatha Yoga on musculoskeletal and cardiopulmonary function, Na-tional Center for Environmental Assessment, Research Triangle Park, NC 27711, USA.
Schell FJ, Allolio B, Schonecke OW.(2001) „Physiologi-cal and psychological effects of Hatha-Yoga exercise in healthy women.“, Department of Internal Medicine, Univer-sity of Wurzburg, Germany.
Siler, B. (2000): The Pilatese Body, Broadway Books, New York
Tran MD, Holly RG, Lashbrook J, Amsterdam EA.(2000) «Effects of Hatha Yoga Practice on the Health-Related Aspects of Physical Fitness.» Department of Exercise Sci-ence, University of California at Davis, Davis, CA 95616.
Submitted: April 29, 2013Accepted: June 01, 2013
Correspondence to:Martina Mavrin Jeličić, PhDFaculty of Transport and Traffic Sciences University of ZagrebVukelićeva 4.10000 - Zagreb, CroatiaPhone number: +385 1 2380-260E-mail: [email protected]
HOMO SPORTICUS ISSUE 1 201342
Jelaska Igor1, Grgantov Zoran1 and Lukas Tajna1
Prevalence and Topology of Pain in Professional Male and Female Tennis Players1 Faculty of Kinesiology, University of Split, Croatia
Original scientific paper
AbstractThe aim of this paper was to determine and explain the preva-lence and topology of pain in professional tennis players. In ac-cordance, 42 male and 38 female tennis players, who partici-pated in the ITF tournament in Turkey (Antalya, 2012) filled out a modified SEFIP questionnaire, which was constructed with regard to the specificities of tennis. More precisely, male and female tennis players evaluated pain intensity for each of the 14 body parts on a Likert-type scale from 0 to 4. The results show that in male tennis players, 92.1% of subjects have experienced pain of average intensity of 1.60 in one or several body regions. On the other hand, 91.7% female tennis players reported pain of aver-age intensity of 1.59. The highest incidence of pain was reported in the lower back area, both in male and female tennis players. Regardless of the gender, a relatively high sum of intensity was reported for shoulder, wrist and knee pain, and somewhat lower for elbow pain. A high sum of pain intensity in the upper back is the specificity of tennis players. By analysis of differences, it has been established that female tennis players had a significantly higher sum of pain intensity in the upper and lower back areas, as opposed to male tennis players. In conclusion, gathering informa-tion about pain incidence should be just the first step towards the goal – prevention, i.e., reducing the number and gravity of tennis injuries.
Key words: pain topology, pain intensity, tennis
SažetakCilj ovog rada bilo je utvrđivanje i objašnjenje učestalosti i topo-logije boli profesionalnih tenisača. U skladu s ciljem, 42 tenisača i 38 tenisačica, sudionika ITF turnira u Turskoj (Antalya, 2012. god.) je popunilo modificirani SEFIP upitnik koji je konstruiran uvažavajući specifičnosti tenisa. Preciznije, za svaki od 14 dije-lova tijela tenisačice i tenisači su procjenjivali intenzitet boli na Likertovoj skali od 0 do 4. Rezultati pokazuju da kod tenisača, 92.1% ispitanika osjeća bol u jednoj ili više regija tijela prosječnog intenziteta 1.60. S druge strane, kod tenisačica 91.7% ispitanica su prijavile bol prosječnog intenziteta 1.59. Kod tenisačica i teni-sača najveći zbroj intenziteta boli prijavljen je u području donjeg dijela leđa. Neovisno o spolu, prijavljen je relativno visok zbroj in-tenziteta boli u ramenu, zglobu šake, koljenu i nešto manje laktu. Specifičnost tenisačica je velik zbroj intenziteta boli u gornjem di-jelu leđa, što kod tenisača nije slučaj. Analizom razlika utvrđeno je da tenisačice imaju značajno veći zbroj intenziteta boli u odnosu na tenisače u gornjem i donjem dijelu leđa. Zaključno, prikupljanje informacija o pojavi boli treba biti samo prvi korak u prema cilju – prevenciji, odnosno smanjenju broja i težine ozljeda u tenisu.
Analysis of incidence of injuries and detection of factors which cause them is certainly a distinct goal of kinesiologi-cal and medical scientific research in sports (Pluim et al., 2006; Ellenbecker et al., 2002). Progressive increase of the extent of training and number of competitions, which rep-resent the demands of contemporary professional sports, cause increasingly frequent exposure of muscle groups to microtrauma, and acute, even chronic injuries in time (Bahr & Bahr, 1997). In tennis, most injuries happen as a consequence of overexertion of tendons and ligaments due to numerous repetitions of movements and hitting with maximum power and speed (Fernandez et al., 2006). Con-sistent with the biomechanical motion complex which is characteristic to tennis, the most frequent injuries in ten-nis are: rotator cuff injury – injury of tendons which suffer highest load during serve (shoulder injury), and injury of
muscle tendons involved in hand extension during back-hand, or injury of muscle tendons involved in hand flexion during serve and forehand stroke (tennis elbow). These are followed by injuries of the wrist, trunk and lower back, ad-ductors, knee and ankle joint. It must be emphasized that tennis is a sport of unilateral loads, which means that right-handed people dominantly employ musculature of the right hand and right side of the body, and vice versa. Research studies (Bahr & Bahr, 1997) indicate that after the injury has occurred the first time, the chances are increased for the same injury to occur again, which further supports the importance of injury prevention among athletes. Besides a systematic everyday prevention programme which should be carried out, it is also important to have prompt and reli-able feedback about the topology of pain, and based on this information, a professional expert team can take ap-propriate steps in order to reduce the risk of injury or its recurrence if it had already occurred. A simple, quick and
HOMO SPORTICUS ISSUE 1 2013 43
reliable way of gathering information about pain incidence is through questionnaires of verified metric characteristics. One of such questionnaires is the SEFIP (Self-Estimated Functional Inability because of Pain), which has been used mostly among dancers. For the purposes of the present research, the questionnaire has been adapted for tennis.
It must be pointed out that some metric characteristics of the SEFIP questionnaire (Ramell et al., 1999) have been tested. SEFIP was constructed with the purpose of evaluat-ing the incidence of pain in dancers, and has been used most frequently on this population. For the purposes of evaluating pain in dancers, the questionnaire was expanded to 14 body parts (Ramell et al., 1999; Miletić et al., 2009; Miletić et al., 2011). The shortcomings of these types of research were presented by Bahr (Bahr, 2009). The author suggested that the collection of data should be conducted on various occasions, by a valid and sensitive instrument which would take into consideration not only the incidence of pain, but the incidence of both pain and other important symptoms which might precede the injury. The author also suggested that, thereafter, the gravity of the injury should not be measured by the time elapsed before the athlete resumes training, but rather until he/she regains his/her full function. The same author also pointed out the necessity of unambiguous definition of sports injuries.
In a research conducted by Roetart & Ellenbecker (2003) on a sample of 148 professional tennis players, 38% of participants stated they had missed a tournament at least once because of lower back pain, 52% of players said they had experienced a tennis elbow injury during their career, 41% of participants experienced mild or severe shoulder injury, while 18% of players experienced a knee injury dur-ing their sports career.
According to Pluim et al. (2006), the ITF (International Ten-nis Federation) conducted a two-year study which involved players included in the ITF programme for under-developed
countries. The results reveal the highest prevalence of pain in upper extremities – 21%, 10% of which refers to shoul-der pain, 12% to elbow pain, and 5% to wrist pain, while 20% of participants reported trunk (back and abdominal) pain. The largest number of participants (40%) reported pain in their lower extremities. Namely, 12% of participants reported foot pain, 8% reported ankle pain, 5% reported calf pain and 15% reported knee pain. Also, the ITF organi-zation, using a sample of elite junior athletes to investigate the question of pain prevalence, obtained the following results: back – 24%, shoulder – 21%, foot – 19%, knee – 15%, wrist – 12% and elbow – 12%. ITF pointed out that the purposes of both research studies have served a function in injury prevention, and had been intended for education of tennis coaches and their work in conditional preparation of tennis players.
Research results (Winge, Jorgensen & Lassen, 1989) indi-cate that Danish recreational athletes experienced average-ly 2.1 injuries in 1000 hours of tennis play. 45% of these were injuries of the upper extremities, 17% were shoulder injuries, 67% was overexertion (muscle inflammations, etc.), 14% were sprains and strains, 2% were fractures and 5% were blisters. On the other hand, ATP conducted a research (Bahr et al., 2004) about the injuries that make professional male and female tennis players seek medical assistance. The results indicate that 30 – 50% of all injuries occurred in the lower extremities, 20% in the upper extrem-ities, and 20% in the lower back area. In 15 – 30% cases, players just asked for a massage or stretching, but many players usually don’t even ask for help because of chronic syndromes, which presents a limitation of this research.Research studies (Nigg & Segesser, 1988) indicate that incidence of injuries in professional male and female tennis players is related to different court surfaces and specifici-ties of each match.
Table 1 shows the specificities of injuries in relation to ten-nis court surfaces.
Table 1. The specificities of tennis injuries in relation to tennis court surfaces (according to Roetert & Ellenbecker,2003; Nigg & Segesser, 1988)
Surface type Characteristics/demands on players Most probable sites of injury
Hard The most demanding court surfaceSuits players with great and fast footwork who are physically balanced and adaptable
ShoulderLower backKneeThigh
HOMO SPORTICUS ISSUE 1 201344
In accordance with the abovementioned, the aim of this research was to determine the prevalence and topology of pain in male and female tennis players. Specific goal was to determine if there were significant differences between male and female tennis players in prevalence and topology of pain.
Materials and Methods
A sample of 80 professional tennis players (42 male and 38 female tennis players) was used in this research. All subjects participated in the ITF tournament in Antalya, Tur-key (10000$) at the beginning of 2012. All participants filled out a modified SEFIP questionnaire – taking into consideration the specificities of tennis and body parts in which the incidence of pain is recorded. The participants had to answer if they experienced pain in the following 14 body parts: neck, shoulder, elbow, wrist, upper back, lower back, hip, hamstrings, quadriceps, knee, shin, calf, ankle joint and foot; and if so, of what intensity. For all body parts in arms and legs, the participants filled out separate questionnaires for the left and the right side of the body. The answers were given on a Likert-type scale from 0 to 4 (0 – it doesn’t hurt at all; 4 – I cannot train at all because of the pain).
First, basic descriptive indicators related to the charac-teristics of the sample of male and female tennis players were calculated (chronological and training age, as well as weekly hours of training). After that, by using separate his-tograms for male and female tennis players, the number of participants who experience pain in one or several body re-gions was presented. Significance of differences between the sexes in the sum of prevalence and intensity of pain in each body part was calculated by Mann-Whitney U test.
Results and Discussion
It is important to point out that male and female players in the sample used were at the beginning of the competitive season, when they are expected to have finished a quality preparation cycle and should not yet feel a negative effect of strenuous competitions. Parameters of descriptive sta-tistics for chronological age, training age and weekly hours of training are presented in Table 2.
Table 2 shows the basic data about male and female tennis players who participated in the research. It is important to note that both groups have similar mean values of chrono-logical and training age, and equal number of weekly hours of training. According to the aforementioned, it can be con-cluded that possible differences in pain prevalence and to-pology between male and female tennis players would not be caused by differences in chronological and training age, neither in the extent of training.
Histogram 1 shows that only 2 female tennis players have not reported any pain, 4 of them feel pain in 1 body part, 5 of them in 2 body parts, 3 of them in 3 body parts, 5 players feel pain in 4 body parts, and 6 players feel pain in 5 body parts. More precisely, out of the 36 female ten-nis players, 34 reported pain of average intensity of 1.59.
Table 2. Characteristics of used sample. Cronological age (AGE), years in training (TAGE), number of training hours per week (WT). (mean±standard devation - M±SD, minimal result – MIN, maximal resut – MAX, coefficient of variation - CV)
Male M±SD MIN MAX CVAGE 22.4±2.7 18.00 29.00 12.08TAGE 14.7±2.7 10.00 21.00 18.72WT 20.6±1.5 16.00 22.00 7.46
Histogram 1. Frequency of tennis players according to number of painful body regions
-2 -1 0 1 2 3 4 5 6 7 8 9 10
X <= Category Boundary
0
1
2
3
4
5
6
7
No.
of o
bs.
-2 -1 0 1 2 3 4 5 6 7 8 9 10
X <= Category Boundary
0
2
4
6
8
10
12
14
No.
of o
bs.
HOMO SPORTICUS ISSUE 1 2013 45
Furthermore, it can be seen from the histogram that three female tennis players feel pain in 10 body regions, while 3 players feel pain in 7 or 8 regions.
In male tennis players, 35 out of 38 participants feel pain in one or several body regions. The average pain intensity in those who have reported it was 1.60. As opposed to wom-en, a much smaller number of male participants reported pain in 6 or more body parts, and the highest number of participants (11) reported pain in 3 body regions.
The highest sum of pain intensity was reported in lower back area in both male and female tennis players. A rela-tively high sum of pain intensity in the shoulder, wrist, knee, and to a smaller extent, in the elbow, was also reported in both male and female tennis players. The specificity of fe-male tennis players is the high sum of pain intensity in the upper back area. Significance of differences in the sum of pain intensity in different body regions according to gender is presented in Table 4.
It is evident in Table 4 that a statistically significant dif-ference has been identified in the upper and lower back area. Even though female tennis players experienced a more frequent and intensive pain in lower back, male ten-nis players are not immune to this problem. It is probable that male tennis players, and especially female tennis play-ers, do not manage to adequately meet the rigid demands of professional tennis play (sudden direction changes, ac-celerations, stops) which are imposed on their locomotor system. This is primarily a problem of inadequate stability, which is probably confirmed by relatively high prevalence of pain incidence in the knee joint. It is very probable that stability in these joints is also hindered by insufficiently
mobile and active hips during extension movements. More precisely, not using the m. gluteus maximus in movements of hip extension must be compensated by weaker syner-gist muscles in the posterior thigh and lumbar spine area, which impairs the stability in those regions and increases the risk of injury (Cook, 2011). It must be emphasized that the body may be compensating the lack of stability in certain body parts (for example, the lower back) by in-creasing the stability of the hips and thoracic spine. Thus, the mobility in those regions is limited, which increases the risk of pain and injury. Knee pain can also be caused by bandaging the ankle joints (Boyle, 2010). Namely, by bandaging the ankle joints, their mobility is impaired, which is compensated by excessive mobility of the knee. Also, possible causes of high prevalence of pain in male and female tennis players in different body parts may be found in inadequate everyday movement patterns initiated by im-proper technique and an overly high number of repetitions of certain tennis-specific movements.
During tennis shots performance, great forces are devel-oped which load primarily the hands and the shoulders, but also the overall locomotor system. It must be pointed out that a number of shots of correct technical performance may cause pain and injuries in certain body parts, and the risk is multiplied if the shots are performed by improper technique. Keeping in mind combination of spending free time in a sedentary manner and high loads on the locomo-tor system during training and competitions, high preva-lence of pain is not surprising.
The biggest difference between male and female tennis players in pain prevalence and intensity occurs in the up-per back area (Table 4). It can be assumed that men have better stability of the scapula, which allows better control of the shot. However, such explanation is not supported by equal sum of reported pain in the shoulder joint in both sexes. Namely, it can be assumed that stabile and properly positioned scapula will protect the tendons of the rotator cuff and long head of the biceps from inflammation. Sci-entific research studies are yet to explain the phenomena of the occurrence of isolated shoulder pain in male tennis players and a combination of shoulder and upper back pain in female tennis players (\urović, 2013).
It is important to conduct a detailed analysis of the posture when the pain occurs, but also of certain movement pat-terns, with the aim of determining the real cause of the pain. Here, it is important to emphasize that the site of the pain and its cause are almost never found in the same lo-cation (Sahrmann, 2001; Cook, 2011).
The causes of dysfunction and the consequential com-pensation of the nervous and the locomotor system must be determined by good diagnostics procedures, but also (equally important) adequate therapy must be prescribed which will restore the lost function and eliminate the need for compensating movement patterns.
Table 3. Significance of differences in total pain intensity between female and male tennis playes by using Mann-Whitney U test. (U and Z – test values, p – level of significance)
U Z p
Upper Back 425 -2,8 0,00
Lower Back 506 -1,9 0,04
Shoulder 647 -0,4 0,64
Elbow 562 -1,3 0,10
Zglob šake 593 -1,0 0,25
Hip 671 0,1 0,82
Front Thigh 679 -0,1 0,93
Back Thigh 678 -0,1 0,92
Knee 633 -0,6 0,51
Lower Leg – front 679 -0,1 0,93
Lower Leg - back 660 -0,3 0,67
Ankle Joint 678 -0,1 0,92
Foot 597 0,9 0,13
HOMO SPORTICUS ISSUE 1 201346
Conclusion
Gathering information about pain incidence in athletes should be just the first step towards a minutely planned set of procedures which have the ultimate goal of affecting the decrease of prevalence and gravity of sports injuries. Each coach’s task, within the context of information about pain prevalence and topology in each athlete and in his/her sport in general, is to implement proper movement techniques, adequate alternation of work and rest, and to prevent the incidence of pain and injuries additionally by quality warm-ups and stretching.
However, coaches should only be a part of the expert team which should take care of increasing the risk of injury. A physical therapist should do preventive examinations of posture and movement patterns, with the aim of noticing the dysfunctions and compensations. He/she should also propose adequate corrective exercises to eliminate the dysfunctions and, consequently, the compensations. Cer-tainly, young athletes must be instructed to report the pain to their coaches, even pain of lowest intensity.
A relatively small subject sample and the fact that pain in-cidence was recorded only on one occasion are the limita-tions of this research study. Accordingly, future research of this type should be conducted on larger samples of ath-letes, and it should be designed as a longitudinal study. This way useful information would be obtained about whether the reaction on pain occurrence will manage to reduce the pain, eliminate it or whether it will be increased. Models between current pain incidence and possible future injuries could also be determined.
Furthermore, future research should certainly investigate the differences in pain incidence between the four major styles of play, grips for executing the forehand (the eastern, the semi-western and the western), grips for executing the backhand (one-handed or two-handed), as well as differ-ences on different levels of competitive efficiency (juniors, ITF futures, ITF challengers and ATP). The whole picture of the abovementioned information would probably structure certain profiles and models of players who are more prone to pain depending on the category to which they belong.
References
Bahr, R.. No injuries, but plenty of pain? On the methodol-ogy for recording overuse symptoms in sports. Br J Sports Med 2009;43: 966–972.
Bahr, R. & Bahr I.A.. Incidence of acute volleyball injuries: a prospective cohort study of injury mechanisms and risk factors. Scand J Med Sci Sports 1997;7: 166-171.
Bahr, R., Andersen, S.O., Loken, S., Fossan, B., Hansen, T. & Holme, I. . Low back pain among endurance athletes with and without specific back loading—a cross-sectional
survey of cross-country skiers, rowers, orienteerers, and nonathletic controls. Spine 2004;29: 449-454.
Boyle, M. Advances in functional training. On target publi-cation. Santa Cruz, California. 2010.
Cook, G..Movement. Functional movement systems: Screening, assessment and corrective strategies. On target publications. Santa Cruz, California. 2011.
\urović, N.. Combined model for estimation of actual quality of top level tennis players. Disertation, Kineziološki fakultet u Splitu. 2013.
Ellenbecker, T.S., Roetert, E.P., Bailie, D.S., Davies, G.J., Brown, S.W. Glenohumeral joint total rotation range of mo-tion in elite tennis players and baseball pitchers Med Sci Sports Exerc 2002;34:2052–2056.
Fernandez, J., Mendez-Villaneuva, A. & Pluim, B.M. Intensi-ty of tennis match play Br J Sports Med 2006;40:387-391
Miletić, A., Kostić, R., & Miletić, \. Pain Prevalence Among Competitive International Dancers. International Journal of Athletic Therapy & Training 2011;16: 13-16.
Miletić, A., Kostić, R., Božanić, A. & Miletić, \. Pain Status Monitoring in Adolescent Dancers. Medical problems of performing artists 2009;24: 119 – 124.
Nigg, B.M. & Segesser, B. The influence of playing sur-faces on the load on the locomotor system and on football and tennis injuries Sports Med 1988;5:375-385
Pluim, B.M., Staal, J.B. Windler, G.E. & Jayanthi Tennis injuries: occurrence, aetiology, and prevention, Br J Sports Med 2006;40:415-423
Ramel, E M., Moritz, U. & Jarnlo, G-B. Validation of a pain questionnaire (SEFIP) for dancers with a specially created test battery. Med Probl Perform Art 1999;14:196-203.
Roetert, P. & Ellenbecker, T. S. Complete conditioning for tennis. Gopal. 2003.
Sahrmann, S.A. Diagnosis and treatment of movement im-pairment syndromes. Mosby, St Louis. 2001.
Winge, S., Jorgensen, U. & Lassen Nielsen, A. Epidemiol-ogy of injuries in Danish championship tennis. Int J. Sports Med 10(5): 1981;368-371.
Submitted: June 01, 2013Accepted: June 19, 2013
Correspondence to:Igor Jelaska, Ph.D.Faculty of KinesiologyUniversity of SplitTeslina 6, 21000 - Split, CroatiaPhone number: 00385 (0) 21 302440E-mail: [email protected]
HOMO SPORTICUS ISSUE 1 2013 47
Zorislava Bajić1, Nenad Ponorac1, Nela Rašeta1 and \orđe Bajić2
Body Composition Changes Under the Infl uence of Aerobic Physical Activity1 Faculty of Medicine, University of Banja Luka, Bosnia and Herzegovina2 Emergency department of Health Centre Banja Luka, Bosnia and Herzegovina
Original scientific paper
AbstractDetermining body composition can be the way to estimate health risk, as well as the sports results of a person. Physical activity alters body composition, and the biggest impact on the components of body composition has aerobic exercise. The parameters of the body composition are body mass, percentage of fat mass (FM), amount of fat-free body mass (FFM), Waist-to-Hip Ratio (WHR), and Body Mass Index (BMI). Determine all parameters of body composition before and after aerobic exercise and compare them.64 healthy young female (19-25) subjects has been recruited. These were divided in two groups: control (n=32) and intervention (n=32). In the intervention group subjects followed a six week aerobic phisical activity protocol. The measurements of body composi-tion (by bioelectrical impedance analysis) in this group have been collected three times: at the baseline, after six weeks, and finally 4 weeks after the activity protocol has ended. Subjects in the control group have not been though any physical acivity protocol. Body mass, percentage of fat in the body, and BMI were the lowest at the measurement 4 week post-activity. Amount of fat-free mass had its lowest value at the second measurement in the intervention group, while it increased during the third, post-acitivy, measure-ment. Body composition of the intervention group has changed significantly in comparison to the control group (body mass, percent of fat-free mass and BMI were significanlty lower 4 week post-activity protocol).
Key words: body composition, aerobic physical activity
Introduction
Aerobic exercise is an important component of total daily energy expenditure. The amount of energy consumed dur-ing any of the aerobic exercise activities depends on the needs of the muscle mass that participates in the execution of these activities, as well as of the intensity with which aerobic exercise activity is carried out. Physical activity can increase the level of basal metabolism by means of two mechanisms: 1) increasing lean body weight and 2) changing physiological processes that affect basal metab-olism rate (BMR). Both of these mechanisms are of long duration and occur in cases where a person is exercising for a long time (Miles, 2007). Assessment of body compo-sition is important in medicine, anthropology, sports medi-cine and child development as it provides insights into the amount of fat in the body and can be used to assess health risk of a person as well as persons’ athletic performance. The body composition can be observed using chemical and anatomical model. The chemical model of body composi-tion divides a human body in different molecular entities, and the simplest form of this model is a two-component model which separates the human body fat mass (FM) and fat-free mass (FFM) component. Anatomical model
consists of adipose tissue, muscle, and bone. Top athletes have the same body fat (6-12%), regardless of the sport, but the assessing body composition by anatomical model and measurement of muscle mass can be the way we can estimate what kind of sport the person is involved in (Eston and Reilly, 2009). There are several factors that determine a person’s body composition, such as genetic predisposi-tion, age, gender, type and extent of physical activity and nutrition. Genetic predisposition and gender are the only non-modifiable factors. Women have a greater amount of body fat than men because of their physiological charac-teristics. After 30 years old the human body accumulates more fat mass. Although this change with age is normal, it can be avoided with proper diet and regular exercise. The gold standard for reducing the percentage of body fat is aerobic exercise (Benardot, 2006).
Determining body composition is a challenge as it is com-plex. Several parameters (BMI-body mass index, WHR-waist to hip ratio, FFF-fat free mass, FM-fat mass) are nor-mally used to determine body composition. Each of these parameters and its trend in an adult person is indicative of
HOMO SPORTICUS ISSUE 1 201348
health status and development of health risks. For example, BMI is associated with increase risk of osteoporosis. Body fat (FM) consists of subcutaneous fat (under the skin of the abdomen) and visceral fat(which is located between the internal organs). A percentage of fat in the body indicates person’s health status. WHR is the ratio of waist and hip circumference. This parameter shows the best distribution of body weight and body fat. The distribution of fat in the body is an important predictor of health risk for obesity. For women, body composition is of additional importance (compared to men) due to the risk of developing osteopo-rosis. Low BMI is associated with increased risk of osteo-porosis (Aghaei Mayboli i saradnici, 2011). Body fat mass (FM) consists of subcutaneous fat and visceral fat (which is located between the body organs). A percentage of body fat directly affects a person’s health. WHR is the ratio of waist and hips circumference, indicating the distribution of body fat, so WHR represents a very important risk fac-tor for the development of obesity. Determination of body composition is particularly important for women because of the risk of osteoporosis.
The aim of the research is to determine the effects of the six week aerobic exercise on the body composition, and assess whether these effects are sustained 4 weeks after the completion of activities.
Methods
The only direct way to assess body composition is by dis-section and analysis of human cadaver. All other methods are indirect (Hills, 2001). For the purposes of this study we used one the most frequently used indirect methods is bio-electrical impedance analysis (BIA). GAIA 359 PLUS was used to assess body composition, the apparatus that uses tetra-polar electrode to measure bioelectrical impedance. The estimation of body compositions based on measure-
ments of impedance, the input data (gender, age, height) and body weight. From this we obtain data on body weight (kg), percent body fat (%), fat free mass (kg), waist-to-hip ratio (WHR) and body mass index (BMI - kg/m2). Of 69 study participants, 64 of them have satisfied the condi-tions for participation. The exclusion criteria of the study were: a) actively engage in some form of physical activ-ity and b) hormonal disorders. The study began with 64 healthy young women, aged 19 to 25 years, divided into two groups: intervention (n = 32) and control(n = 32). All participants were informed about the study and gave their informed consent. Both groups underwent body com-position analysis at the beginning of the study (baseline), and then after 6 weeks (second measurement). During that time, the intervention group (IG) was subjected to a struc-tured aerobic training, whereas control group (CG) did not. Aerobic training consisted of the following activities:
• step aerobics (10 minutes), • jogging with jumping (5 minutes), • exercises for the shoulder region and lower extremity
(squats) - 10 minutes, • the floor exercise for the abdominal muscles and glu-
teus (10 minutes), and • relaxation exercises (10 minutes).
The third body composition analysis was performed only in intervention group 4 weeks after finishing the aerobic exercise program. Statistical analysis was performed with the program SPSS 17.0.1 (SPSS Inc., Chicago, IL, USA).
Results
Statistical analysis indicates that the women in the inter-vention and control group are not significantly different ac-cording to key indicators in the initial part of the test (age and body composition indicators) (Table 1).
Table 1. Baseline characteristics of all participants (n=64)
P - Mann – Whitney test; the level of statistical significance and probability of type I error (alpha)IQR - interquartile rangen - number of participants
HOMO SPORTICUS ISSUE 1 2013 49
Change of body weight, FM fat and FFM in the intervention group before and after aerobic physical activity (baseline and second measurement), and 4 weeks after the comple-tion of exercise (third measurement) are shown in Table 2. The control group only participated in the first two mea-surements, so we compared body composition parame-ters in intervention group and control group only in the first two measurements.
In the control group, bodyweight was significantly different between baseline and third measurement (tdf=31=3.869, P = 0.001), as well as between the second and third mea-surement (tdf=31= 5119, P = 0.000). Between these mea-surements, the body weight has decreased. .No statistical-ly significant differences were found for body weight be-tween the baseline and the second measurement (tdf=31= 1621, P = 0.115).
FM in the body is significantly different in the baseline and the third measurement (tdf=31= 9508, P = 0.000), as well as the second and third measurement (tdf=31= 15 749, P = 0.000). In both cases the FM decreased in the third mea-surement. Percentage of FM does not differ at baseline and second measurement (tdf=31= -0188, P = 0852).
FFM was statistically different between the baseline and the second measurement (tdf=31= 2594, P = 0.014), as well as between the second and third measurement (tdf=31= -3865, P = 0.001), with the smallest amount of FFM at the second measurement. Between baseline and the third measurement there was no statistically significant differ-ence in the amount of FFM (tdf=31= -1654, P = 0108). Given that all women in the study (i.e. in both intervention and control group) participated only in the baseline and second measuring, analysis of for the differences in se-lected parameters between the two groups were done only for the first two measurements. Mixed analysis of variance (within groups and between groups) showed that there was no significant interaction between control and inter-vention groups and time of measurement on body weight (F1.000,61.000= 0.998, P = 0322). Thus, there no statistically significant difference is observed in body weight between the groups. Also, there was no statistically significant dif-ference between the intervention and control group in the percentage of FM (F1.000,61.000= 0499, P = 0482, η2 = 0.008), as well as the amount of FFM (F1.000,61.000= 3923, P = 0.052), although the value is on the threshold of sta-tistical significance (Table 2). Table 3 shows the changes in WHR and BMI in the intervention (three measurements) and control group (two measurements).
Table 2. Body weight, FM and FFM in intervention (three measurements) and in control group (two measurements)
Third measurement60,7(7,84)* 24,4(4,62)* 42,0(3,86)**
M - the arithmetic meanSD - standard deviation* p <0.001 compared to the baseline measurement ** p ≤ 0.001 compared to second measurement *** p <0.001 compared to the third measurement † p <0.05 compared to the baseline measurementn - number of participants
Table 3. WHR and BMI in the intervention (three measurements) and the control group (two measurements)
Second measurement 0.753(0.037) *** 0.8(0.03) 21.8(2.62) *** 21.6(1.91)
Third measurement 0,737(0,040)* 21,5(2,54)*
** p <0.001 compared to baseline measurement *** p <0.001 compared to the third measurement n - number of participants
HOMO SPORTICUS ISSUE 1 201350
There was a statistically significant difference between WHR in the baseline and third measurement (tdf=31= 5861, P <0.001) and the second and third measurement (tdf=31= 6459, P <0.001), whereas WHR was the lowest in the third measurement. Between the baseline and second measurements there is no statistically significant differ-ence in the WHR (tdf=31= 0507, P = 0616).
BMI was significant different in the baseline and third mea-surement (tdf=31= 3887, P = 0.001), and the second and third measurement (tdf=31= 5222, P <0.001), with a BMI being the lowest in the third measurement. Between the first and the second measurement there was no statisti-cally significant difference in the BMI (tdf=31= 1563, P = 0128).
Discussion
In the scientific and practical purposes, the most com-monly used indicators of body composition are the body height, body weight, percentage of FM, the amount of FFM, WHR and BMI. There is no doubt that there is connection between physical activity and body composition, but a number of studies done in this field showed a diverse con-nection between these two factors. There is evidence that young people who are involved in physical activity have better body composition and improved physical perfor-mance during the execution of the activity (Ara et al, 2006). Even active video games have a positive effect on the body composition (Meddison et al, 2012). During the develop-ment of the child, there are two waves of increasing body weight. Rapid growth occurs in the first year, when the birth body weight triples, while the second one occurs between the ages of 10 and 12 years in girls and 12 to 14.5 years in boys (Ondrak and Morgan, 2007). In our study partici-pants were adolescent women aged 19 to 25 years that have passed through these two waves of increasing body weight, and in which we do not expect major physiological change in body weight. Despite this our study showed that intervention group had a variation in body weight with an increase in second and a decrease (below the baseline) in the third measurement. The biggest drop in body weight occurred after a break of four weeks after the completion of the structured exercise program. This is in contrast to Roger’s study that showed no statistically significant changes in body weight in a period after exercise program (Rogers et al, 2009). Our results were not consistent with either a three-year study conducted on young people of which has been shown to extracurricular physical activity leads to an increase in body weight (Gutin, Yin, Johnson and Barbeau, 2008). This difference can be explained by the fact that the study subjects were younger, and they are expected to eventually increase body weight according to their physiological development. Another study found that the body weight of women who exercised for four weeks significantly reduced (Guillemant, Accarie, Peres and Guil-lemant, 2004), which was not consistent with our study.
We could not find the reason why significant changes in body weight did not occur immediately after exercise.
Average value of the FM in the baseline measurement of the intervention and control group ranged within normal values (26.4% and 25.8%, respectively). Change the value of FM in intervention group had the same trend as of the body weight: there was an increase in second measure-ment, but in the third measurement value falls below the baseline value. Many studies indicate that physical activity leads to a reduction in FM (Gutin, 2008; Mullins and Sin-ning, 2005; Obradovic et al, 2009). It has been shown that athletes have a lower fat content compared to non-athletes. Adolescent girls involved in athletics have less FM, a great-er amount of FFM compared to adolescents who were not involved in sports (Lucas et al, 2003). Different types of sport lead to different changes in the body composition. For example, women who are professional boxers have lower body weight and lower FM than women of the same age who are not involved in physical activity (Trutschnigg et al, 2008). Some studies have shown that the percentage of body fat does not change after exercise (Van Langendonck et al, 2004). Our results showed that the amount of FFM in the intervention group was significantly different in all three measurements. At the second measurement, which was carried out immediately after completion of the train-ing session, showed the biggest decrease in the amount of FFM. This is in contrast to the results of a state of the research, where most studies demonstrated an increase in FFM (Gutin, Yin, Johnson and Barbeau, 2008; Nickols-Richardson et al, 2007; Trutschnigg et al, 2008; Mullins and Sinning, 2005; Wallace and Ballard 2002; Mojtahed, Snook, Motl and Evans, 2008). Our results showed that there was an increase in FFM only after four weeks after completing the training session, but increase was slightly above baseline value. Flann and colleagues conducted a study in which they compared the effects of exercise in trained and untrained persons. They found that after 3 weeks of resistance exercise on the ergometer Eccentron there has been an increase in quadriceps muscle mass in both groups, and that the biggest increase was in the un-trained group (Flann et al, 2011). The results of Ogawa et al. showed that after 12 weeks of exercise program a woman’s muscle mass increased, specifically the muscle groups involved in the exercises (Ogawa et al, 2010). WHR is calculated by the formula: WHR = waist circumference / hip circumference. Increased health risk in young popula-tion is associated with an increased WHR; WHR greater than 0.95 in young men and in young women WHR greater than 0.86 (ACSM’s Health-Related Physical Fitness As-sessment Manual, 2008). Our results showed that in the intervention group there was a statistically significant dif-ference in WHR in all three measurements (baseline 0.754, second 0.753, and third 0.737), with the lowest rate in the third measurement. The third measurement showed lower WHR, body weight, FM and BMI in the intervention group. One Finnish study examined the effect of physical activity during military service for a period of 6 months. In that
HOMO SPORTICUS ISSUE 1 2013 51
study, it was determined waist circumference, not WHR, but it is also one of the parameters of body composition, which is as important as WHR. It is shown that in par-ticipants after 6 months of exercise decreased waist cir-cumference, and that the reduction was greater in those with higher BMI compared to those with normal BMI (Mik-kola et al, 2012). A British study has also shown that with increasing physical activity waist circumference reduces (Stewart-Knox et al, 2012).
BMI value is calculated according to the formula: BMI = body weight / body height2 (kg/m2) Increased BMI indicates an increased health risk (Salinari et al, 2003). BMI subjects in the intervention group differed significantly between the baseline (21.9) and the third measurement (21.5), and be-tween the second (21.8) and third measurement, where the index was at its lowest in the third measurement. Posi-tive effect of physical activity in BMI is not visible imme-diately after the exercise. Many studies showed that the BMI increases in physical activity (Gutin, Yin, Johnson and Barbeau, 2008; Trutschnigg et al, 2008; Ondrak and Mor-gan, 2007). In our study there were no significant changes in BMI after six weeks of physical activity, but its value decreased four weeks later (after a period of relative rest). At the same time, the body weight of our participants, too, was at its lowest value. Because it is directly proportional to this index, it is understandable why BMI value reduces. Our results are consistent with the results of the study conducted by Rogers et al. In that study, the BMI and FM did not significantly change 3 months after the completion of the exercise program (Rogers et al, 2009). Our study also showed a positive correlation between the amount of FFM and BMI. Similar results were shown in other studies (Liou, 2007; Luuk and Pihl, 2003).
Conclusion
In this study we have shown that physical activity had no positive effect on body composition immediately after completing the training session, but the body composition parameters improved after 4 weeks after completion of aerobic physical activity. Hence, aerobic physical activity has a beneficial effects on body composition, but it takes more than four weeks for them to become evident.
References
ACSM’s Health-Related Physical Fitness Assessment Manual; Second Edition, 2008.
Aghaei Mayboli HR, Hemmat-abadi M, Heshmat R, Rezaei Homami M, Madani S, Ebrahimi M, Adibi H, Lorijani B. (2011). Association Between Anthropometric Measures and Bone Mineral Density: Population Based Study. Iranian J Publ Health, 40(2); 18-24.
Ara I, Vicente-Rodriguez G, Perez-Gomez J, Jimenez-Ramirez J, Serreno-Sanchez JA, Dorado C, Calbet JAL. (2006). Influence of extracurricular sport activities on body composition and physical fitness in boys: a 3-year longitu-dinal study. Internation Journal of Obesity, 30:1062-1071.
Benardot D. (2006). Advanced Sports Nutrition. Human Kinetics, p. 209-232.
Eston R, Reilly T. eds. (2009). Kinanathropometry and Exercise Physiology Laboratory Manual. Test, procedures and data. Third Edition. Antrophometry, Vol. 1.
Flann KL, LaStayo PC, McClain DA, Hazel M, Lindstedt SL. (2011). Muscle damage and muscle remodeling: no pain, no gain? The Journal of Experimental Biology, 214:674-679.
Guillemant J. Accarie C, Peres G. Guillemant S. (2004). Acute Effects of an oral Calcium Load on Markers of Bone Metabolism During Endurance Cycling Exercise in Male Athletes. Calcif Tissue Int, 74:407-414.
Gutin B, Yin Z, Johnson M, Barbeau P. (2008). Preliminary findings of the effect of a 3-year after-school physical ac-tivity intervention on fitness and body fat; Medical College of Georgia Fitkid Project. International Journal of Pediatric Obesity, 3:3-9.
Hills AP, Lyell L, Byrne NM. (2001). An Evaluation of the Methodology for the Assessment of Body Composition in the Children and Adolescents. In: Jürimäe T, Hills AP. eds. Body Composition Assessment Assessment in Children and Adolescents. Med Sport Sci. Basel, Karger, Vol. 44. pp1-13.
Liou YM. (2007). Patterns of Physical Activity and Obe-sity Indices Among White-Collar Men in Taiwan. Journal of Nursing Research, 15(2):138-144.
Lucas JA, Lucas PR, Vogel S, Gamble GD, Evans MC, Reid IR. (2003). Effect of sub-elite competitive running on bone density, body composition and sexual maturity of adoles-cent females. Osteoporos Int, 14:848-856
Luuk M-L, Pihl E. (2003). Longitudinal changes in anthro-pometric and blood pressure variables in relation to physi-cal activity in men: A 9-year follow-up. Papers on Anthro-pology,12:145-153.
Meddison R, Ni Mhurchu C, Jull A, Prapavessis H, Foley LS, Jiang Y. (2012). Active video games: the mediating effect of aerobic fitness on body composition. International Journal of Behavioral Nutrition and Physical Activity, 9:54.
Mikkola I, Keinänen-Kiukaanniemi S, Jokelainen J, Peisto A, Härkönen P, Timonen M, Ikäheimo T. (2012). Aerobic performance and body composition changes during mili-
HOMO SPORTICUS ISSUE 1 201352
tary service. Scandinavian Journal of Primary Health Care, 30:95-100.
Miles L. (2007). Physical activity and health. Journal com-pilation. British Nutrition Foundation. Nutrition Bulletin, 32:314-363.
Mojtahedi MC, Snook EM, Motl RW, Evans EM. (2008). Bone health in ambulatory individuals with multiple scle-rosis: Impact of physical activity, glucocorticoid use, and body composition. Journal of Rehabilitation Research & Development, 45(6):851-862.
Mullins NM, Sinning WE. (2005). Effects of resistance training and protein supplementation on bone turnover in young adult women. Nutrition & Metabolism, 2:19.
Nickols-Richardson SM, Miller LE, Wooten DF, Ramp WK, Herbert WG. (2007). Concentric and eccentric isokinetic resistence training similarly increases muscular stength, fat-free soft tissue mass, and specific bone mineral mea-surements in young women. Osteoporos Int, 18:789-796.
Obradović B, Madić D, Milošević Z, Maksimović N, Mikalaĉki M, Kovačev-Zavišić B. (2009). Uticaj različitih kinezoloških tretmana na tjelesnu kompoziciju i minetalni koštani sadržaj dječaka prepubertetskog uzrasta. Med Pregl, LXII(1-2):23-26.
Ogawa K, Sanada K, Machida S, Okutsu M, Suzuki K. (2010). Resistance Exercise Training-Induced Muscle Hy-pertrophy Was Associated with Reduction of Inflammatory Markers in Elderly Women. Mediators of Inflammation, 1-7.Ondrak KS, Morgan DW. (2007). Physical Activity, Cal-cium Intake and Bone Health in Children and Adolescents. Sports Med, 37(7): 587-600.
Rogers LQ, Hopkins-Price P, Vicari S, Markwell S, Pe-menter R, Courtneya KS, Hoelzer K, Naritoku C, Edson B, Jones L, Dunnington G, Verhulst S. (2009). Physical Activ-ity and Health Outcomes Three Months After kompliting a Physical Activity Behavior Change Intervention: Persistent and Delayed Effects. Cancer Epidemiology, Biomarkers & Prevention, 18(5):1410-1418.
Salinari S, Bertuzzi A, Mingrone G, Capristo E, Scarfone A, Greco AV, Heymsfield SB. (2003). Bioimpedance analysis: a useful technique for assessing appendicular lean soft tis-sue mass and distribution. J Appl Physiol, 94:1552-1556.
Stewart-Knox B, Duffy ME, Bunting B, Parr H, Vas de Al-meida MD, Gibney M. (2012). Association between obe-sity (BMI and waistcircumference) and socio-demograph-ic factors, physical acitivity, dietary habits, life events, resilience, mood, perceived stress and hopelessness in healthyolder Europeans. BMC Public Health, 12:424.
Trutschnigg B, Chong C, Habermayerova L, Kerelis AD, Komorowski J. (2008). Female boxers have high bone mineral density despite low body mass, high energy ex-penditure, and a high incidence of oligomenorrhea. Appl. Physiol. Nutr. Metab, 33:863-869.
Van Langendonck L, Claessens AL, Lysens R, Koninckx PR, Beunen G. (2004). Association between bone, body composition and strength in premenarhal girls and post-menopausal women. Annals of Human Biology, 31(2):228-244.
Wallace LS, Ballard JE. (2002). Lifetime Physical Activ-ity and Calcium Intake Related to Bone Density in Young Women. Jornal of women’s health and gender-based med-icine, 11(4):389-397.
Submitted: May 29, 2013Accepted: June 18, 2013
Correspodence to:Zorislava Bajić Department of Physiology, Faculty of Medicine78 000 Banja LukaTel. +38766191332E-mail: [email protected]
HOMO SPORTICUS ISSUE 1 2013 53
Safet Kapo1
Performance analysis of the fi nalists of the K-1 Grand Prix Tournaments 1993-20041 Faculty of sport and physical education,University of Sarajevo, Bosnia and Herzegovina
Original scientific paper
AbstractThe aim of the research is to discover parameter values that indicate the actual situational positioning of competitors who attained the grand-prix tournament in Tokyo in the period from 1993-2004, and then to identify the development through that period. The study was conducted on 12 final K-1 GP Final tournaments in which 8 fighters took part, which made up the sample of the 96 fighters who were eventually described with 96 parameters on a universal scale. The article affirms specific methodology characterized by two innovations. The first is the situational aspect of the initial collection of data through DVD footage of all fights that took place in Japan Grand Prix K-1 tournaments from 1993 to 2004. All fighters were initially described with a total of 102 variables, which brought very interesting information about the situational aspects of K-1 events. The second innovation consists in determining the development of K-1 sport on a universal scale of data that accurately determines the position of any entity in the study, and hence all the contestants together that took part in a specific year. A relational model has been used in this research that describes the actions, offering multivari-ate criterion values and locating objects within the investigated sectors within hyper ellipsoids described by selected variables. Under the clear assumption that all objects are in the same universe, it is not difficult to conclude that they must have some sort of mutual relations. These relations can be described in binary-bifurcated way, but also in any other way. If a set of variables describing these objects are representative, as is the case in this research, then relations between the objects will surely lead to a structured set of rela-tions, which in this model is simply called: actions. The study results showed that in 12 years (from 1993 to 2004) K-1 evolved toward higher and higher levels and range, which is an outstanding indicator of the global dynamics of this extremely demanding martial sport.
Key words: K-1, skills, top athletes, super heavyweight, situational efficiency, universal scale.
Introduction
History of K-1 starts a revolutionary vision of Japanese karate master Kazuyoshi Ishii. K-1 is a sport designed by clearly defined rules so that all fighters of standing mar-tial disciplines are allowed to fight in a ring to choose a champion. K-1 in the name comes from the first letters of the different styles of martial arts that make the K-1: karate, kickboxing, kung fu, kakutougi, Kemp, etc., while 1 stands for one weight class. Although it originates from Seido Karate, K-1 is designed to determine the most effec-tive martial art during the fight (Kapo and Cikatić, 2010).
Understanding development of the sport at the present time is inevitably directed toward mathematical models of iden-tification of situational parameters of which positioning the best athletes in the world competitions depends. Based on these data, it is possible to reveal important features that greatly assist us in understanding the changes occurring in sport. In martial arts, especially in the K-1, it is also inevita-ble. Martial arts, however, are particularly complex (Valera 1973, Nagamine, 1976; Hassel 1984, Murphy 1995, Shim 2003, Liao & Lui 2003). Out of these reasons, the ana-lyzes were primarily directed at identifying the parameters of success of fighters and then, if the set of such informa-
tion is valid, at monitoring development of the sport, in this case the K-1. Therefore, this article focuses on the detec-tion of the values of parameters indicating the actual situ-ational positioning of competitors who have reached the Grand Prix tournament in Tokyo from 1993 to 2004, and then on identification of development through that period.
Specifically, if the exact individual position of the best of the best is located for each year, then the simple sum-ming up of data per year gives a developmental function. In addition, the final K-1 World Grand Prix in Japan is at-tended only by the best athletes that have already passed the lower level qualifications. They are truly the best of the best, kings of the ring, and only one of them per year be-comes the king of kings. In such conditions, it is difficult to find better selection criteria for definition of success.
The aim of the research is to discover parameter values that indicate the actual situational positioning of competi-tors who attained the grand-prix tournaments in Tokyo in the period from 1993 to 2004, and then to identify the de-velopment through that period.
HOMO SPORTICUS ISSUE 1 201354
Resear ch Methodology
The sample of examineesThe sample for this study consisted of top super heavy-weight athletes (21 to 39 years old) of the final K-1 tour-nament in Japan from 1993 to 2004. In this study, the analysis of 96 (total of 34 fighters, of which some have repeatedly attained the final tournament of K-1 GP) top K-1 male fighters in 84 match and 205 rounds was car-ried out. During the year, a series of regional qualification tournaments is held in ten countries on five continents in which eight best K-1 fighters qualify to fight in the final K-1 Grand Prix tournament in Tokyo in December, fighting for the prestigious crown of the king of kings. Thus a strictly selected sample was formed, which is taken for this study. It is expected, due to the activities of K-1 fighters, that they are very highly positively selected, especially in relation to all variables important for evaluation of hypothetical per-sonality dimensions and tactical education compared to the normal population. In another sense, medically, mor-phologically and psychologically, there were no visible aberrations.
The sample of variablesIn this exploratory study, based on consultation with methodologists, coaches, competitors and other eminent experts, variables were selected that were able to be pa-rameterized within the issue in which the author was in-terested. 102 out of total 108 variables were selected, covering the areas of morphological characteristics, situational-motor skills, evaluation of tactical education, age and estimates of hypothetical personality traits that might be expected to affect the success in the K-1 (Kapo, 2006). Five variables in this study had a zero value, there-fore they were not applied in data processing, as well as one variable that concerned the original sport fighters.
Data CollectionData were collected through an extremely precise meth-odology which included meticulous inspection of DVD records. 102 types of situational events in all matches in the final tournament from 1993 to 2004 were registered. So each of the contestants who made it to the final of the annual tournament is described with each of the thus ob-tained 102 situational variables. It is obvious that such a character of the competition put accompanied fighters into a situation to show maximum achievement in extremely complex conditions, where it is a question of carrying out specific activities on the border of individual abilities of the widest range. In this way, the followed activity fully ap-proaches situational conditions of performance. It is possi-ble to state that because of purity of initial data this project approached almost strict laboratory conditions.
Methods of data processingData were analyzed with a special algorithm (Bonacin, 2006) which recalibrated initial data on a universal range from 1 to 5, which brought all entities in all variables into
the same space and the data could be compared and pro-cessed even at the level of manifest variables. For each competitor all the data were summed up and thus obtained continuous circuit that explicitly position each individual. Due to the fact that 8 competitors fought in 12 tourna-ments, 96 of those fighters are ultimately described with 96 parameters on a universal scale. The matrix of the origi-nal gross data is viewed as a left vector in case of entities or as a right vector in case of variables.
Results and Discussion
According to the data in Table 1 it is easy to conclude that the applied methodology revealed the fact that the best athletes really have the best values at the global universal scale. Out of 96 possible positions, the highest 7 positions were occupied by 7 winners. Also, all 12 winners are in the final 19 positions, and it is evident that only one among them was not a winner (Musashi who was defeated in the finals of 2004). Only two fighters (Hug and Hoost), which, however, were the winners in some other year of the com-petition were on the 6 other positions. So we can say that the top of the scale belongs only to winners, especially because the scale reveals other details. For example, only one defeated finalist is even among the lowest 60 positions (out of 96 in total). Also, among the lowest 36 positions is only one semi-finalist (Abidi), but no finalists.
Finally, as can be seen in figure 1, the total development of the data on a time distribution of the universal scale of all fighters, shows us that the highest level at the K-1 Grand Prix final tournaments has been reached in the period from 2001 to 2004, while the lowest was in the very beginning, i.e. from 1993 to 1994.
Fifth degree polynomial reveals that after an initial upward trend, a stagnation was present during the period from 1995 to 2000, but we can also see that the year 2004 was by far the year of the highest performance level. Generally it can be said that through the 12 years (1993-2004), K-1 evolved toward higher and higher levels and range, which is an outstanding indicator of the global dynamics of this extremely demanding martial sport. Instead of setting a hy-pothetical model, the subject of research in this paper is the actual status of fighters which could be registered in the part that directly relies on situational characteristics. Out of that, by appropriate procedure transformation and condensation information, a body of knowledge was cre-ated that clearly addresses the issue of modeling in a way that leaves no doubt.
By analyzing situational efficiency in kickboxing disciplines full contact and low kick, Krupalija and others (2010) found fourteen latent dimensions. Due to the fact that the K-1 sport is a sublimation of martial arts, the mentioned research has shown us the importance of latent dimen-sions and separated factors. Kuleš (1985) on a sample of 55 karate competitors in the category absolute classical
HOMO SPORTICUS ISSUE 1 2013 55
karate, found a high correlation between thirteen anthro-pometric measures and success in the sport. Karate is a sport that participates in the K-1 with technical and tactical elements, thus the analyzed anthropometric variables that indicate a correlation with success in the sport of karate suggest a possible link between the temporal distribution of the universal scale of all the fighters of the scale and the ability to influence through the training process to a higher range of the K-1 fighters in the future (Kapo, 2010).
3 T. Hays 1993. 1.81 58 S. Leko 2000. 2.6611 A. Hug 1994. 1.98 70 S. Leko 2001. 2.6835 S. Greko 1997. 1.99 74 B. Sapp 2002. 2.6920 T. Atokawa 1995. 2.00 59 P. Aerts 2000. 2.704 C. Kiatsongrit 1993. 2.09 55 M. Filipovic 1999. 2.701 T. Atokawa 1993. 2.17 46 S. Greko 1998. 2.7289 M. Mo 2004. 2.17 51 A. Hug 1999. 2.7460 A. Musashi 2000. 2.18 69 A. Ignjasov 2001. 2.7666 N. Peetas 2001. 2.19 61 F. Filho 2000. 2.7626 D. V.m.merwe 1996. 2.19 90 R. Sefo 2004. 2.7633 M. Satake 1997. 2.21 73 P. Aerts 2002. 2.7791 P. Aerts 2004. 2.25 84 A ignjasov 2003. 2.7762 C. Abidi 2000. 2.27 31 M. Bernardo 1996. 2.7885 C. Abidi 2003. 2.27 93 K. Kaoklai 2004. 2.8050 A. Musashi 1999. 2.27 79 J. Lebaner 2002. 2.8025 M. Filipovic 1996. 2.28 23 J. Lebaner 1995. 2.8142 M. Satake 1998. 2.32 63 R. Sefo 2000. 2.8276 A. Musashi 2002. 2.33 71 F. Filho 2001. 2.8236 J. Lebaner 1997. 2.35 30 A. Musashi 1996. 2.8210 M. Thompshon 1994. 2.36 94 F. Botha 2004. 2.8382 P. Graham 2003. 2.36 86 P. Aerts 2003. 2.8441 F. Filho 1998. 2.36 2 P. Aerts 1993. 2.8444 R. Sefo 1998. 2.38 87 A. Musashi 2003. 2.8568 J. Lebaner 2001. 2.38 15 M. Satake 1994. 2.8527 S. Greko 1996. 2.38 13 B. Cikatic 1994. 2.8519 J. Klein 1995. 2.39 7 E. Hoost 1993. 2.8612 R. V. Esdonk 1994. 2.40 78 M. Hunt 2002. 2.8665 P. Aerts 2001. 2.40 37 P. Aerts 1997. 2.8652 P. Aerts 1999. 2.42 38 F. Filho 1997. 2.8728 P. Aerts 1996. 2.43 80 E. Hoost 2002. 2.8817 S. Longinidis 1995. 2.47 47 A. Hug 1998. 2.9034 M. Bernardo 1997. 2.47 92 E. Hoost 2004. 2.989 A. Mannart 1994. 2.48 39 A. Hug 1997. 2.9949 R. Sefo 1999. 2.49 64 E. Hoost 2000. 2.9957 M. Filipovic 2000. 2.51 22 E. Hoost 1995. 3.0043 E. Hoost 1998. 2.52 48 P. Aerts 1998. 3.0214 P. Smith 1994. 2.52 8 B. Cikatic 1993. 3.0275 S. Leko 2002. 2.53 24 P. Aerts 1995. 3.0481 F. Botha 2003. 2.54 67 E. Hoost 2001. 3.0777 R. Sefo 2002. 2.55 95 A. Musashi 2004. 3.075 M. Smith 1993. 2.55 29 E. Hoost 1996. 3.136 M. Satake 1993. 2.55 56 E. Hoost 1999. 3.1318 M. Satake 1995. 2.58 88 R. Bonjaski 2003. 3.1345 M. Bernardo 1998. 2.59 40 E. Hoost 1997. 3.1521 M. Bernardo 1995. 2.62 16 P. Aerts 1994. 3.1583 R. Sefo 2003. 2.63 32 A. Hug 1996. 3.1653 S. Greko 1999. 2.64 72 M. Hant 2001. 3.1954 J. Lebaner 1999. 2.64 96 R. Bonjaski 2004. 3.20
Table 1. Competitors from Tokyo 1993-2004 and their positions on a universal scale (individual contestants are marked by ordinal numbers, red labeled are tournament winners, blue labeled are defeated finalists, green labeled are defeated semifinalists, white labeled are defeated in the first round):
Kačić and others (2004) reported that the preparation of athletes in general can be sorted out in four main areas of sports training - technical, tactical, physical and psycho-logical preparation that are interdependent and interrelated. They also point to the fact that in the sport, absence of one of the parts of the preparation cannot be compensated by intensifying the second half; for example, lack of physical preparation cannot be replaced by psychological prepara-tion and vice versa. Actually the upper limit of quality per-formance of an athlete is determined by the weakest link in the chain of his preparation. In other words, the player loses at the point where he is the weakest. The above re-search and analysis of the K-1 sport as well as sports that participate in the K-1 indicate that the application of scien-tific knowledge provides the opportunity for development in the direction of higher levels and range.
Conclusion
Based on the above and the obtained results, it is obvious that this approach can accurately identify the most suc-cessful fighters in the analyzed period, as well as their un-derlying global combat characteristics. Finally, particularly illustrated indicators per individual years for all fighters to-gether, provided a global development trend of K-1 sport in general. It is suggested to use the applied methodology in all situations where it is possible to analyze the situational aspects of sporting activities, especially martial arts, in or-der to obtain valuable information in terms of the develop-ment of scientific knowledge.
References
Bonacin, D. (2006). Definition of absolute basics of com-prehension continuum (In Croatian). 15th summer school of Croatian kineziologists, Proceedings. Rovinj.
Hassell, R.G. (1984). Shotokan Karate. Its History and Tra-dition: Focus Publication.
Kačić, LJ., Štimac, D., Zulić. (2004.) Psihološka priprema sportaša. Ponder.
Kapo, S. (2010). Karate, pronađi svoj put. Univerzitetski udžbenik. Sarajevo: Fakultet sporta i tjelesnog odgoja.
Kapo, S., Cikatić B. (2010). K-1, put do vrha. Sarajevo: Fakultet sporta i tjelesnog odgoja.
Kapo, S. (2006). Structural analysis and model of K-1 top level fighters. Disertation (In Bosnian). Sarajevo: Faculty of sports and physical education, University of Sarajevo.
Krupalija, E., Kapo, S., Rađo, I., Kajmović, H. (2010). Structural analaysis of the situational efficiency in the kickboxing disciplines full contact and low kick. Fakultet
sporta intjelesnog odgoja Sarajevo. Homosporticus, 12(2), 36-40.
Kuleš, B. (1985). Povezanost nekih antropometrijskih mjera i uspjeha u karate brorbi Kineziologija, 17, 2.
Liao, M.S., Lui, W.C. (2003). The study on causes of making mentality health about Tai Chi Chung. Universiade conference– Facing the chalenge, Proceedings, 468-472. Daegu: FISU.
Murphy, S. M. (1995). Sport Psychology Interventions. USA: Human Kinetics Pub.
Nagamine, S. (1976). The Essence of Okinawan Karate-Do. Tokyo: Tuttle.
Shim, S. K. (2003). History and properties of martial art in Korea. Universiade conference– Facing the chalenge, Proceedings, 71-75 . Daegu: FISU.
Valera, D. (1973). Karate la competition. Paris: Ed Serdi-rey.
Submitted: June 10, 2013Accepted: June 20, 2013
Correspondence to:Safet Kapo, PhDFaculty of Sport and Physical Education University of SarajevoPatriotske lige 41, 71 000 - Sarajevo, Bosnia and HerzegovinaPhone number: +387 33 668-768E-mail: [email protected]
HOMO SPORTICUS ISSUE 1 2013 57
Eldan Kapur1
Variations in DiaphysealNutrient Foramina in HumanLower Limb Long Bones1 Medical faculty, Department of anatomy, University of Sarajevo, Bosnia and Herzegovina
Original scientific paper
AbstractThe aim of the present study was to study the diaphyseal nutrient foramina in human lower limb long bones. The material of the this study consisted of 90 adult human long bones of the lower limbs (30 femora, 30 tibiae, 30 fibulae). For each bone, the number and position of their nutrient foramina were studied. With the exception of femur, the majority of nutrient foramina in all bones studied were single in number and were secondary in size. Most of the nutrient foramina were concentrated in the middle third of the bone with the exception of tibia in which nutrient foramina were predominantly observed in its proximal third. Nutrient foramina were mostly located on the posterior surface of the shaft of bones of lower limb. The direction of nutrient foramina followed the growing end theory, with variations in the direction observed in some fibulae. The results of the present study confirmed previous findings regarding the number and position of nutrient foramina in the long bones of the lower limbs and provided clinical information concerning the nutrient foramina which could be useful as reference for surgical procedures.
Key words: Nutrient foramina; Long bones; Lower limb; Vascularization.
Introduction
The nutrient foramina are cavities that conduct the nutrient arteries and the peripheral nerves. The major blood supply for long bones originates from the nutrient arteries, mainly during the growing period and during the early phases of ossification. During childhood, long bones receive about 80% of the interosseous blood supply from the nutrient ar-teries, and in the case of their absence, the vascularization occurs through the periosteal vessel. Bones are structures that adapt to their mechanical environment, and from a fe-tal age adapt to the presence of naturally occuring holes. These holes or nutrient foramina, allow blood vessels to pass through the bone cortex (1). The nutrient artery is the principal source of blood supply to a long bone and is particularly important during its active growth period in the embryo and fetus, as well as during the early phase of ossification (2). When this supply is compromised, med-ullary bone ischemia occurs with less vascularization of the metaphysis and growth plate (3). The diaphyseal nutri-ent arteries obliquely penetrate in the diaphysis of the long bones, their entrance point and angulations being relatively constant, dividing in ascending and descending branches, once they reach the medullary cavity. It has been suggest-ed that the direction of the nutrient foramina is determined by the growing end of the bone. A considerable interest in studying nutrient foramina resulted not only from morpho-logical, but also from clinical aspects. Nutrient foramina reflect to a certain degree the bone vascularization. Some pathological bone conditions such as developmental ab-
normalities, fracture healing or acute hematogenic osteo-myelities are closely related to the vascular system of the bone (4). Detailed data on the blood supply to the long bones and the association with the areas of bone supplied has been continued to be a major factor in the develop-ment of new transplantation and resection techniques in orthopaedics (5).
Material and Methods
We analyzed 90 long bones of lower limbs from the from the osteology collection held in the Department of Anato-my, Faculty of Medicine, University of Sarajevo. They were divided into three groups 30 bones of each (30 femora, 30 tibia and 30 fibula). The laterality of the bones was the only known data, and right side and left side bones were identi-fied; data about their age and gender were not available. The localization and number of nutrient foramina were ana-lyzed in each bone. The nutrient foramina were observed in all bones with the help of a hand-lens. They were identified by their elevated margins and by the presence of a distinct groove proximal to them. Only well-defined foramina on the diaphysis were accepted.
The following data were studied on the diaphyseal nutrient foramina of each bone: Number: Bones were examined for the number of nutrient foramina. Position: The position of the foramina was divided as follow: the foramen was in the proximal third of the bone, foramen was in the middle
HOMO SPORTICUS ISSUE 1 201358
third of the bone, and the foramen was in the distal third of the bone. The results were analyzed and tabulated us-ing the Statistical Package of Social Sciences (SPSS) 8.0 windows.
Results
Femur Number: In the whole series of 30 femora examined, 10(33.3%) had a single foramen and 16(48%) had double foramina. Position: Of the total 42 foramina, 6(14.3%) were in the proximal third and 36(85.7%) in the middle third. There were no foramina in the distal third. Of all femoral foramina, 10(23.8%) were on the medial lip of the linea aspera, 7(16.7%) on the lateral lip of linea aspera, 7(16.7%) on the posteromedial surface, 8(19%) between the two lips of linea aspera, 5(11.9%) on the gluteal tu-berosity, 3(7.1%) medial to spiral line and 2(4.8%) on the posterolateral surface.
Tibia Number: The whole series of 30 tibiae examined had a single nutrient foramen. Position: Of the total 30 foramina, 25(83.3%) were in the proximal third and 5(16.66%) were in the middle third. There were no foramina in the distal third. All foramina were located on the posterior surface of the tibiae, 17(56.66%) were closer to the interosseous border, 8(26.66%) were midway between interosseous border and soleal line and 5(16.66%) were on the posterior surface closer to the soleal line
FibulaNumber: Out of 30 fibulae examined, 23(76.66%) showed a single foramen while 7(23.33%) had double foramina. Position: The nutrient foramina of fibulae were situated in the middle third of the bone. Of the total 37 foramina, 33(89.2%) existed in the middle third and 4(10.8%) were in the distal third. There were no foramina in the proximal third. Of the whole fibular foramina, 23(62.2%) were on the medial crest of the posterior surface, 11(29.7%) on the posterior surface between medial crest and interosseous border and 3(8.1%) on lateral surface.
Discussion
In the previous literatures, a discrepancy was noticed regarding the number of nutrient foramina in the femora. Many authors stated that the majority of femora studied had double nutrient foramina (3,6,7), while others reported the presence of a single foramen in most specimens (8,9). Three nutrient foramina were observed in a small number of femora (2.19%- 10.7%) by many authors (3,6,7,8). It was interesting to find studies reporting a number of nutri-ent foramina as high as six (9) and up to nine (10), while others confirmed the absence of nutrient foramina in some femora (9,11). In this study, the whole series of tibiae examined had a single nutrient foramen. Previous stud-
ies reported the presence of a single nutrient foramen in at least 90% of the tibiae. But, in contradiction with the present results, they also reported the presence of double nutrient foramina in some of the tibiae (3,6,7,9,10). In the fibulae studied, 76.66% of the bones presented a single nutrient foramen, while 23.33% of the bones possessed double nutrient foramina. Similar data had been reported by Forriol Campos et al (3) and Sendemir and Cimen (10), while Mckee et al. (12) reported fibulae with three nutrient foramina. On the other hand, Mckee et al. (12), Gumus-burun et al. (9) and Kizilkanat et al. (13) reported fibulae with no nutrient foramina. In the present study, most of the nutrient foramina (85.7%) were located along the middle third of the femur; the rest were in the proximal third, with no foramina detected in the distal third of the femur. These results were in accordance with those of Laing (8), My-sorekar, Forriol Campos et al. (3), Sendemir and Cimen (10), Gumusburun et al. (9) and Kizilkanat et al. (7). Laing (8) attributed the lack of the nutrient foramina in the lower third of the femur to the absence of vessels entering this part of bone. In our study, 83.33% of the nutrient foramina in the tibiae were in the proximal third and 16.66% in the proximal third. There were no foramina in the distal third. Similarly, many authors reported the presence of the ma-jority of nutrient foramina in the proximal third of the tibia (6,7). On the other hand, Kizilkanat et al. (13) stated that most of nutrient foramina were located in the middle third. In the present series, all nutrient foramina studied were lo-cated on the posterior surface of the tibiae. Similar results were reported by Forriol et al. (3), Sendemir and Cimen (10), Nagel (6), Gumusburun et al. (9) and Collipal et al. (7). The rate of healing of a fracture is related to the vas-cular supply of the bone. The areas or regions with a good blood supply are more rapidly healed than those with a poor blood supply. The tibia is a good example of such process. Because of the absence of nutrient foramina in the distal third of the tibia, fractures in that region tend to show delayed union or malunion (14). In the present se-ries, most of the nutrient foramina of the fibula were situ-ated in the middle third of the bone (89.2%). The rest of the nutrient foramina (10.8%) were located in the distal third of the bone. These results were in agreement with most of the previous studies (3,9,10,12). On other hand, Guo (15) reported that the majority of foramina were located in the proximal third of the fibula. In this study, 62.2% of the fibu-lar foramina were located on the medial crest and 29.7% on the posterior surface. However, some authors observed more nutrient foramina on the posterior surface compared to those on the medial crest (3,9,12). Others, (10) reported that the majority of foramina were on the medial surface of the fibula. Knowing the variations in the distribution of the nutrient foramina is important preoperatively, especially regarding the fibula used in bone grafting. In the majority of the specimens, the nutrient foramina were located in the middle third of the fibula which is the segment that must be used for the transplant, if one desires that the implant include endosteal vascularization and peripheral vascular-ization (7,12). It is very important that the nutrient blood
HOMO SPORTICUS ISSUE 1 2013 59
supply is preserved in free vascularized bone grafts so that the osteocytes and osteoblasts in the graft survive, and the healing of the graft to the recipient bone is facilitated with the usual replacement of the graft by creeping substitu-tion (9). The present study proved that most of the nutrient foramina were observed to lie on the flexor surface of the bones. Thus, on the humerus, radius and ulna they were mostly on the anterior surface while on the femur, tibia and fibula, they were located on the posterior surface. Kizilkanat et al. (13) stated that the position of the nutrient foramina was directly related to the requirements of a continuous blood supply to specific aspects of each bone, for example where there were major muscle attachments. It might be that, being more bulky, stronger and more active, flexors need more blood supply compared to extensors of limbs.
An understanding of the position and number of the nutrient foramina in long bones is important in orthopaedic surgi-cal procedures such as joint replacement therapy, fracture repair, bone grafts and vascularized bone microsurgery (13). Longitudinal stress fractures are more commonly associated with the tibia, but occasionally occur in the fe-mur and fibula. Knowing the position of nutrient foramina is important in longitudinal stress fractures, as they can either initiate from the nutrient foramen or its superomedial aspect. The foramen may be a potential area of weakness in some patients and, when under stress because of in-creased physical activity or decreased quality of the bone, the foramen may allow development of a fracture. Posi-tion of the fracture relative to the nutrient foramen of the long bone and the patterns of edema are the secondary signs in the key of the diagnosis of this type of fracture (16). Investigations on the vascular anatomy of long bones are important to human because it is relevant to fracture treatment (11,17). There may be instances in which the vascular integrity of a long bone is vital, and knowledge of the nutrient anatomy may be of value to the orthopaedic surgeon. The surgical exposure and periosteal stripping in open reduction internal fixation procedures of diaphyseal fractures present further vascular insult to existing osse-ous injury. Depending upon the desired effect of internal fixation, its devices often require different bony surface ex-posures. Some of these extensiles exposure may involve dissection in regions of the nutrient artery. It must be borne in mind that any injury to the nutrient arteries of the bones must be avoided. This will entail careful consideration as to their origin from the main trunks and situation where they enter the bones. The healing of fractures, as of all wounds, is dependent upon blood supply, Injury to the nutrient ar-tery at the time of fracture, or at subsequent manipulation, may be a significant factor predisposing to faulty union.
Conclusion
The study confirmed previous reports regarding the num-ber and position of the nutrient foramina in the long bones of the lower limbs. It also provided important information to the clinical significance of the nutrient foramina. Exact
position and distribution of the nutrient foramina in bone diaphysis is important to avoid damage to the nutrient vessels during surgical procedures. This study recorded data related to the population of Bosnia and Herzegovina, providing ethnic data to be used for comparison and that may help in surgical procedures and in the interpretation of radiological images.
References
1. Gotzen N., Cross A., Ifju P., Rapoff A. (2003). Under-standing stress concentration about a nutrient fora-men. J. Biomech.36: 1511 - 1521.
2. Lewis O.J. (1956). The blood supply of developing long bones with special reference to the metaphyses. J. Bone Jt. Surg. 38: 928 - 933.
3. Forriol Campos F., Gomez Pellico L., Gianonatti Alias M., Fernandez-Valencia R. (1987). A study of the nu-trient foramina in human long bones. Surg. Radiol. Anat. 9: 251 - 255.
4. Skawina, A., Wyczolkowski, M. (1987). Nutrient fo-ramina of humerus, radius and ulna in Human Fetus-es. Folia Morphol. 46: 17 - 24.
5. 5. Kirschner M. H., Menck J., Hennerbichler A., Gaber O., Hofmann G.O., (1998). Importance of arterial blood supply to the femur and tibia for transplantation of vascularized femoral diaphyses and knee joints.World J. Surg. 22: 845 - 852.
6. Nagel A. (1993).The clinical significance of the nutri-ent artery. Orthop. Rev.22: 557 - 561.
7. Collipal E., Vargas R., Parra X., Silva H., Sol M. (2007). Diaphyseal nutrient foramina in the femur, tibia and fibula bones. Int. J. Morphol. 25 (2): 305 - 308.
8. Laing P. G. (1953). The blood supply of the femoral shaft. J. Bone Jt. Surg. 35: 462 - 466.
9. Gumusburun E., Adiguzel E., Erdil H., Ozkan Y., Gulec E.(1996). A study of the nutrient foramina in the shaft of the fibula. Okajimas Folia Anat. Jpn.73 (2-3): 125 - 128.
10. Sendemir E., Cimen A. (1991). Nutrient foramina in the shafts of lower limb long bones: situation and number. Surg. Radiol. Anat. 13: 105 - 108.
11. Al-Motabagani (2002). The arterial architecture of the human femoral diaphysis. J. Anat. Soc. India 51(1): 27 - 31
12. .McKee N. H., Haw P., Vettese T. (1984). Anatomic study of the nutrient foramen in the shaft of the fibula. Clin. Orthop. Rel. Res.184:141 - 144.
13. Kizilkanata E., Boyana N., Ozsahina T., Soamesb R., Oguza O. (2007). Location, number and clinical sig-nificance of nutrient foramina in human long bones. Ann. Anat. 189: 87 -
14. Trueta J. (1974). Blood supply and the rate of healing of tibial fractures. Clin. Orthop. Rel.Res. 105: 11 - 26.
HOMO SPORTICUS ISSUE 1 201360
15. Guo F. (1981). Fibular blood supply. Chin. Med. J. 94: 396 - 400.
16. Craig J.G., Widman D., van Holsbeeck M. (2003). Longitudinal stress fracture: patterns of edema and the importance of the nutrient foramen. Skeletal Ra-diol. 32: 22 - 27.
17. Bridgeman G., Brookes M. (1996). Blood supply to the human femoral diaphysis in youth and senescence. J. Anat. 188: 611 - 621.
Submitted: June 05, 2013Accepted: June 29, 2013
Correspondence to:Eldan Kapur, PhDDepartment of anatomy Medical faculty Faculty of KinesiologyUniversity of SarajevoČekaluša 90, 71 000 - Sarajevo, Bosnia and HerzegovinaPhone number: +387 33 226 478E-mail: [email protected]
HOMO SPORTICUS ISSUE 1 2013 61
HOMO SPORTICUS ISSUE 1 201362
Instruction for authors
HOMO SPORTICUS is the official publication of the Faculty of sport and physical education in Sarajevo. It publishes original scientific papers, review papers and professional papers relating to: physical education, recreation, sports, sport games, sport medicine, sport physiology, sport psy-chology, sport sociology, sport philosophy, sport history, sport coaching, biomechanics, kinesitherapy, and dance. All material is assumed to be submitted exclusively unless otherwise stated, and must not have been published pre-viously except in abstract form. Each author should have participated sufficiently in the work to take public responsi-bility for the content and authenticity.
Material should be written in MS WORD text editor, font Times Roman, 12. Paper should not exceed 16 pages with double spacing including tables, illustrations and referenc-es. It should then be printed on one side with large margins (2,5 cm).The order of the text should be as follows:
Cover page: Title page providing details for all authors in-cluding surname, first name, degrees, complete address, telephone number and e-mail.
Second page: Provide on a separate page an abstract of not more than 200 words. Abstract is brief, comprehensive summary of the contents of the article which should clearly describe the problem, purpose, participants, method, the findings, conclusions and the implications. Abstract should be written in English and Bosnian.
Key words: not more than 5, characterizing the content of the pa per, should be written in English and Bosnian.
Text: Text should be divided in following sections - head-lines: Introduction, Methods (including participants, appa-ratus and procedures), Results, Discussion, Conclusion and References. All pages should be numbered consecu-tively commencing with the title page. Do not import tables or figures in text.
Introduction: state the problem, subject, and aim of their research as well as the relevant findings of prior research.
Method section includes detailed description of research. It precisely states the: participants, phenomena or objects under observation - research as well as the apparatus and procedure. Any statistical method must be stated, and any not in common use sh o uld be fully described or supported by references.
Results: state the results of research.
Discussion: Compare results of the work with previous published references. It is necessary to connect the con-clusions with the aims of the work, but avoid statements and conclusions that do not follow from work. When the discussion is relatively brief it is preferred to combine it with the previous Result section, yielding Results and Con-clusion section.
Tables: Tables must be typed on separate pages and should be followed by the reference list. All tables must be numbered consecutively and each must have a brief heading describing its contents. Tables must be referred to in the main text. All tables must be simple and should not duplicate information given in the text.
Ilustrations: Any illustration must be amrked with number according to their location in tekst, has to be of high qual-ity, resolution and clear for further editing. Size of illustra-tions should be larger than it will be in final printed form.
References: The references in the text should be cited ac-cording to the APA system (see: Publication Manual of the American Psychological Association. 4th Edition; see also: http://www.apa.org).
Paper and floppy disksSend one printed copy of manuscript on paper and on flop-py disk. Editorial board has the final decision on publishin of the articles.Manuscripts will not be returned.Manuscripts that have not been written according to the instructions will be returned to the author for editing.Submitted materials will be evaluated through blind review by at least two referees. Assessments by the referees will be presented anonymously to the author and, in the case of substantial reservations, the article will be returned to the author for correction.
Send all materials to the folowing adrress by mail or per-sonally:Fakultet sporta i tjelesnog odgoja, 71000 Sarajevo, Patriotske lige 41 or toe-mail: [email protected]
HOMO SPORTICUS
Scientific Journal of Sport and Physical Education
Indexed in: COBISS.BH, Index Copernicus, EBSCOHost,
SPORTDiscusTM with Full Text, SPONET, getCited, CABI,
Genamics Journal Seek, NewJour, Open J-Gate, Urlichweb


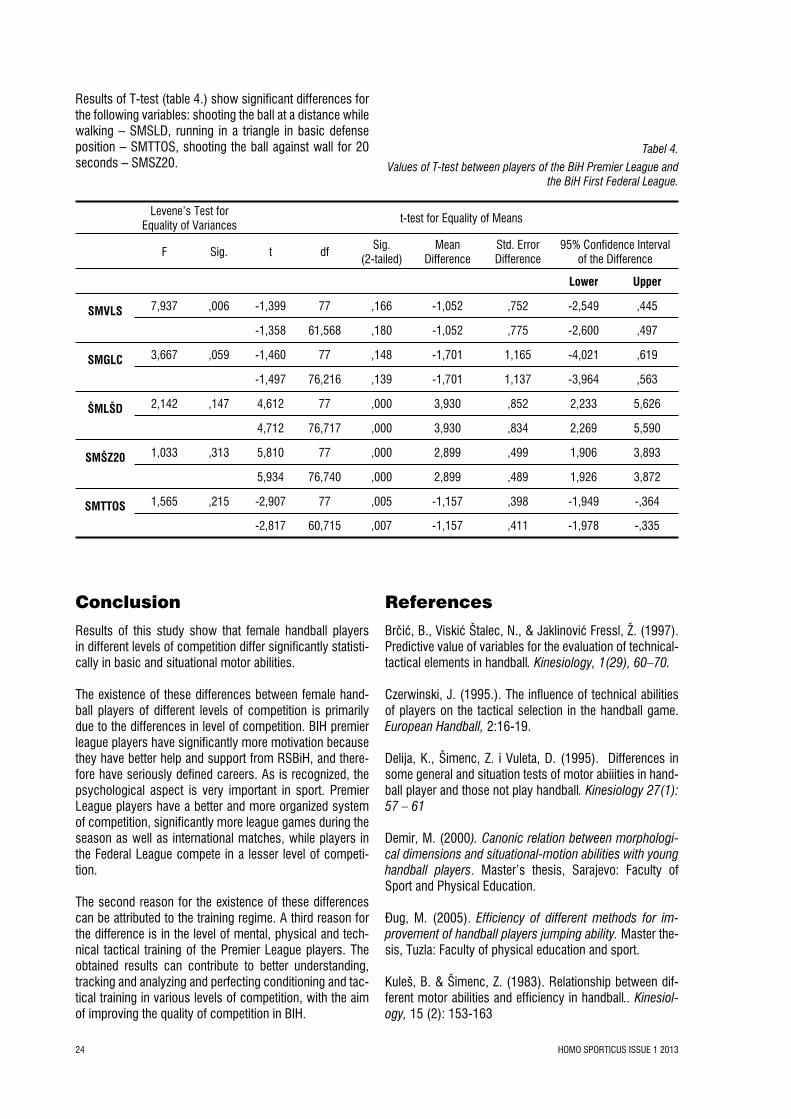


![tAymnielt-7, · 2019. 11. 28. · Amir Misirlic 3000 Anida Kapo 1000 Asim 'åHOLORYLþ 6000 Asim 0XMNLþ 1000 Belma Tvico 10000 Benjamin %DMUDPRYLþ 1500 Berin 7X]OLþ 3000 Damir](https://static.documents.pub/doc/80x56/60fe8b77205eb35ca86b5c21/taymnielt-7-2019-11-28-amir-misirlic-3000-anida-kapo-1000-asim-holoryl.jpg)


