1 UK Armed Forces Quarterly Service Personnel Statistics 1 January 2018 This publication provides information on the number of Military Personnel in (defined as the strength), joining (intake) and leaving (outflow) the UK Armed Forces. Detail is provided for both the Full-time Armed Forces and Reserves. Further statistics can be found in the Excel tables. The recent trends in personnel numbers in this report relate to the targets outlined in the Strategic Defence and Security Review (SDSR) 2015 and the Future Reserves 2020 (FR20) programme. Prior to SDSR 2015, publications reported against SDSR 2010, the Three Month Exercise (3ME), Army 2020 and the Future Reserves 2020 (FR20) programme. Some of the statistics previously published in the following publications can now be found in this release: Monthly , Quarterly and Annual Personnel Reports, UK Reserve Forces and Cadets, Service Personnel Bulletin 2.01 and Service and Civilian Bulletin 2.03. Responsible statistician: Tri-Service Head of Branch 0207 807 8896 [email protected]Further information/mailing list: [email protected]Background quality report: www.gov.uk/government/statistics/tri-service-personnel-bulletin-background-quality-reports Would you like to be added to our contact list , so that we can inform you about updates to these statistics and consult you if we are thinking of making changes? You can subscribe to updates by emailing [email protected]Key Points and Trends ▼ 194 950 Strength of UK Forces Service Personnel at 1 January 2018 a decrease of 1 460 (0.7 per cent) since 1 January 2017 ▼ 137 260 Full-time Trained Strength (RN/RM & RAF) and Full-time Trade Trained Strength (Army) at 1 January 2018 a decrease of 2 150 (1.5 per cent) since 1 January 2017 ▲ - 5.7% Deficit against the planned number of personnel needed (Liability) at 1 January 2018 an increase in the deficit from –4.2 per cent as at 1 January 2017 ▲ 32 240 Strength of the Trained Future Reserves 2020 at 1 January 2018 An increase of 1 280 (4.1 per cent) since 1 January 2017 ▼ 13 040 People joined the UK Regular Armed Forces in the past 12 months (1 January 2017 – 31 December 2017) a decrease of 400 (3.0 per cent) compared with the previous 12 month period ▲ 15 300 People left the UK Regular Armed Forces in the past 12 months (1 January 2017 – 31 December 2017) An increase of 200 (1.3 per cent) compared with the previous 12 month period ▼ 6 030 People joined the Future Reserves 2020 in the past 12 months (1 January 2017 – 31 December 2017) a decrease of 870 (12.6 per cent) compared with the previous 12 month period ▼ 5 220 People left the Future Reserves 2020 in the past 12 months (1 January 2017 – 31 December 2017) a decrease of 160 (3.1 per cent) compared with the previous 12 month period Published 15 February 2018
Transcript
1
UK Armed Forces Quarterly Service Personnel Statistics
1 January 2018
This publication provides information on the number of Military Personnel in (defined as the strength), joining (intake) and leaving (outflow) the UK Armed Forces. Detail is provided for both the Full-time Armed Forces and Reserves.
Further statistics can be found in the Excel tables.
The recent trends in personnel numbers in this report relate to the targets outlined in the Strategic Defence and Security Review (SDSR) 2015 and the Future Reserves 2020 (FR20) programme. Prior to SDSR 2015, publications reported against SDSR 2010, the Three Month Exercise (3ME), Army 2020 and the Future Reserves 2020 (FR20) programme.
Some of the statistics previously published in the following publications can now be found in this release: Monthly, Quarterly and Annual Personnel Reports, UK Reserve Forces and Cadets, Service Personnel Bulletin 2.01
and Service and Civilian Bulletin 2.03.
Responsible statistician: Tri-Service Head of Branch 0207 807 8896 [email protected]
Would you like to be added to our contact list, so that we can inform you about updates to these statistics and consult you if we are thinking of making changes? You can subscribe to updates by emailing [email protected]
Key Points and Trends
▼ 194 950 Strength of UK Forces Service Personnel at 1 January 2018 a decrease of 1 460 (0.7 per cent) since 1 January 2017
▼ 137 260 Full-time Trained Strength (RN/RM & RAF) and Full-time Trade Trained Strength (Army) at 1 January 2018 a decrease of 2 150 (1.5 per cent) since 1 January 2017
▲ - 5.7% Deficit against the planned number of personnel needed (Liability) at 1 January 2018 an increase in the deficit from –4.2 per cent as at 1 January 2017
▲ 32 240 Strength of the Trained Future Reserves 2020 at 1 January 2018 An increase of 1 280 (4.1 per cent) since 1 January 2017
▼ 13 040 People joined the UK Regular Armed Forces in the past 12 months (1 January 2017 – 31 December 2017) a decrease of 400 (3.0 per cent) compared with the previous 12 month period
▲ 15 300 People left the UK Regular Armed Forces in the past 12 months (1 January 2017 – 31 December 2017) An increase of 200 (1.3 per cent) compared with the previous 12 month period
▼ 6 030 People joined the Future Reserves 2020 in the past 12 months (1 January 2017 – 31 December 2017) a decrease of 870 (12.6 per cent) compared with the previous 12 month period
▼ 5 220 People left the Future Reserves 2020 in the past 12 months (1 January 2017 – 31 December 2017) a decrease of 160 (3.1 per cent) compared with the previous 12 month period
Introduction page 2 Supplementary tables containing further statistics can be found at: https://www.gov.uk/government/collections/quarterly-service-personnel-statistics-index
A glossary and other supporting documents are available here: https://www.gov.uk/government/publications/armed-forces-monthly-service-personnel-statistics-supplementary-documents
This publication contains information on the strength, intake and outflow for the UK Armed Forces overall and
each of the Services; Royal Navy/Royal Marines (RN/RM), Army and Royal Air Force (RAF).
The Ministry of Defence (MOD) announced on 29 June 2016 that it was changing the Army trained, disciplined manpower by changing the definition of trained strength to include those in the Army who have completed Phase 1 training. This affects some Tri-Service totals. This does not affect the Naval Service or the RAF in any way. The MOD held a public consultation on SDSR Resilience: Trained strength definition for the Army and resultant changes to Ministry of Defence Armed Forces personnel statistics, between 11 July and 21 January 2017. A consultation response was published on 7 November 2016. The changes outlined in the consultation and response have been incorporated into this publication from the 1 January 2017 edition onwards. This affects statistics in some of the accompanying Excel tables, specifically tables: 3a, 3e, 5a, 5b, 5c, 5d, 6a, 6b, 7a, 7b and 7c. Terminology has also been updated in Excel tables 3c and 4.
Detailed statistics, including unrounded figures, and historic time series can be found in the Excel tables. These include quarterly statistics on the number of Applications to each of the Services, Service and Civilian Personnel, Separated Service (the proportion of personnel breaching harmony guidelines), Applications to each of the Services and Military Salaries. Further historic statistics will be added in due course; in the meantime, historic statistics can be found in the following archived publications: Monthly, Quarterly and Annual Personnel Reports, UK Reserve Forces and Cadets, Service Personnel Bulletin 2.01, Service and Civilian Bulletin 2.03, UK Armed Forces Maternity Report, Diversity Dashboard and Quarterly Location Statistics. The glossary contains definitions of terminology used in this publication.
Following a public consultation, it was decided that the frequency of this publication will now be quarterly. This edition is the first quarterly publication, with the next edition scheduled to be published on GOV.UK at 9:30am on Thursday
17 May 2018. A calendar of upcoming MOD statistical releases can be found on GOV.UK.
A National Statistics publication The United Kingdom Statistics Authority has designated these statistics as National Statistics, in accordance with the Statistics and Registration Service Act 2007 and signifying compliance with the Code of Practice for Official Statistics. Designation can be broadly interpreted to mean that the statistics:
Once statistics have been designated as National Statistics it is a statutory requirement that the Code of Practice shall continue to be observed.
meet identified user needs;
are well explained and readily accessible;
are produced according to sound methods; and
are managed impartially and objectively in the public interest.
The main factors affecting decisions about the size of the Armed Forces required by the MOD to achieve success in its military tasks include:
An assessment of current and future threats to UK national security; The need for contingent / reactive capability – the requirement to be able to respond
immediately to domestic or international crisis; Current operational and international obligations (e.g. NATO, UN); Changes in technology, the introduction of new equipment and restructuring that leads to
equipment becoming obsolete or surplus to requirements; The need to deliver against the military tasks as efficiently as possible, maintaining a
balanced, affordable defence budget.
The Service personnel statistics in this publication are reported against the 2015 Strategic Defence and Security Review (SDSR), released in November 2015. Prior to SDSR 2015, publications reported against the planned Future Force 2020, as set out in the SDSR 2010 which planned to reduce the size of the Armed Forces.
Army Trained Strength
On 29 June 2016, the MOD announced that the Army planned to use Regular and Reserve Phase 1 trained personnel in response to crises within the UK. Following this, the term ‘Trained Strength’ would include all Army personnel trained in the core function of their Service (i.e. those who have completed Phase 1 training). The MOD has consulted on these changes and the resultant impact it will have on this publication and a consultation response were published on 7 October 2016.
From the 1 January 2017 edition onwards, Army personnel who have completed Phase 1 training (basic Service training) but not Phase 2 training (trade training), are considered Trained personnel. This change will enable the Army to meet the SDSR 15 commitment to improve support to UK resilience. The Trained Strength definition for the Royal Navy, RAF, Maritime Reserve and RAF Reserves has not changed, reflecting the requirement for their personnel to complete Phase 2 training to be able to fulfil the core function of their respective Services.
Army personnel who have completed Phase 2 training are now called ‘Trade Trained’. This population aligns with the old definition of trained personnel, therefore maintaining the continuity of the statistical time series and will continue to be counted against the liability and SDSR target for 2020.
Full-time Armed Forces personnel
In order to meet the manpower reduction targets set out in SDSR 2010, the Three Month Exercise (3ME) and Army 2020 (A2020), a redundancy programme coupled with adjusted recruiting (intake) and contract extensions were set. The redundancy programme is now complete.
On 23 November 2015, the Ministry of Defence published the National Security Strategy and Strategic Defence and Security Review 2015. SDSR 2015 outlines plans to uplift the size of the Regular Armed Forces, setting targets for a strength of 82,000 for the Army, and increasing the Royal Navy/Royal Marines and Royal Air Force by a total of 700 personnel. The SDSR 2015 Defence Key Facts booklet announced new targets for 2020 for each of the Services.
Future Reserves 2020 (FR20) Programme The Future Reserves 2020 (FR20) programme aims to increase the size of the Reserve Forces. Further information on the growth of the Reserves can be found in the Policy Background section of previous Monthly Service Personnel Statistics publications.
As a result of the changes to Army Trained Strength (referred to above) and their impact on the Army Reserve, the MOD released a Written Ministerial Statement containing revised Future Reserves 2020 strength growth profiles on 8 November 2016. Reporting of the growth of the Reserves will be based on strength profiles only.
This statement outlined trained strength targets for FY18/19 as follows: Maritime Reserve 3,100, Army Reserve 30,100 and RAF Reserves 1,860.
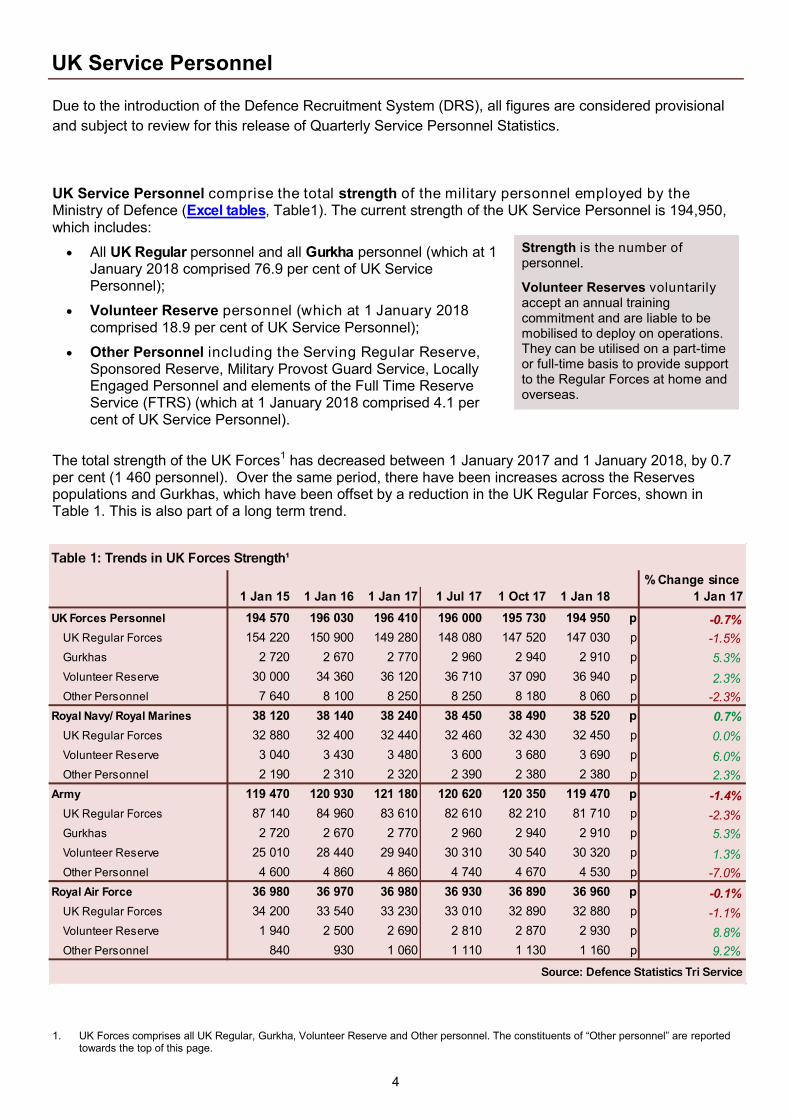
UK Service Personnel comprise the total strength of the military personnel employed by the Ministry of Defence (Excel tables, Table1). The current strength of the UK Service Personnel is 194,950, which includes:
All UK Regular personnel and all Gurkha personnel (which at 1 January 2018 comprised 76.9 per cent of UK Service Personnel);
Volunteer Reserve personnel (which at 1 January 2018 comprised 18.9 per cent of UK Service Personnel);
Other Personnel including the Serving Regular Reserve, Sponsored Reserve, Military Provost Guard Service, Locally Engaged Personnel and elements of the Full Time Reserve Service (FTRS) (which at 1 January 2018 comprised 4.1 per cent of UK Service Personnel).
The total strength of the UK Forces1 has decreased between 1 January 2017 and 1 January 2018, by 0.7 per cent (1 460 personnel). Over the same period, there have been increases across the Reserves populations and Gurkhas, which have been offset by a reduction in the UK Regular Forces, shown in Table 1. This is also part of a long term trend.
Strength is the number of personnel.
Volunteer Reserves voluntarily accept an annual training commitment and are liable to be mobilised to deploy on operations. They can be utilised on a part-time or full-time basis to provide support to the Regular Forces at home and overseas.
1. UK Forces comprises all UK Regular, Gurkha, Volunteer Reserve and Other personnel. The constituents of “Other personnel” are reported towards the top of this page.
Due to the introduction of the Defence Recruitment System (DRS), all figures are considered provisional
and subject to review for this release of Quarterly Service Personnel Statistics.
% Change since
1 Jan 15 1 Jan 16 1 Jan 17 1 Jul 17 1 Oct 17 1 Jan 18 1 Jan 17
UK Forces Personnel 194 570 196 030 196 410 196 000 195 730 194 950 p -0.7%
UK Regular Forces 154 220 150 900 149 280 148 080 147 520 147 030 p -1.5%
Full-time Trained Strength (RN/RM & RAF) and Full-time Trade
Trained Strength (Army) and Liability
The current deficit against the Liability is 5.7 per cent for the UK Armed Forces. There is a deficit of 3.7 per cent in the Royal Navy/Royal Marines (RN/RM), 6.3 per cent in the Army and 5.9 per cent in the Royal Air Force (RAF).
Full-time Trained Strength (RN/RM & RAF) and Full-time Trade Trained Strength (Army) includes all
UK Regular personnel, Gur-khas and those elements of the Full Time Reserve Service (FTRS) who are counted against the liability (see glos-sary for more detail).
Liability is the number of
Service personnel needed,
based on the Defence Plan-
ning Round, set for each of the
three Services.
The Full-time Trained Strength (FTTS) (RN/RM & RAF) and Full-time Trade Trained Strength (FTTTS) (Army) (which comprises military personnel who have completed ‘Phase 1’ and ‘Phase 2’ training) is counted against the Liability. The difference between the two is measured as either a surplus or deficit. This is one indicator of the Service’s ability to execute military tasks. Other indicators include the surplus / deficit within key trades or in specific Ranks.
As at 1 January 2018, the Tri Service FTTS (RN/RM & RAF) & FTTTS (Army) has decreased by 1.5 per cent (2,150 personnel) since 1 January 2017. The FTTS (RN/RM & RAF) and FTTTS (Army) comprises: 133,850 Regular personnel (97.5 per cent), 2,740 Gurkhas (2.0 per cent); and 670 Full Time Reserve Ser-vice personnel (0.5 per cent) who are filling Regular posts and count against the liability.
Figure 2: FTTS (RN/RM & RAF) and FTTTS (Army) against Liability
and 2020 target derived from SDSR 2015
SDSR 2020
1 Jan 15 1 Jan 16 1 Jan 17 1 Jul 17 1 Oct 17 1 Jan 18 Targets
As at 1 January 2018, the trained and untrained strength of the UK Regular Forces (which excludes Gurkhas) was 147,030. There are 9,160 untrained personnel in the UK Regular Forces. The untrained strength reflects the number of personnel who can potentially join the trained strength.
Intake and Outflow since 2011 Intake and Outflow over the past six years are presented in Figure 3. For the period shown below Tri– Service outflow has exceeded intake for each 12 month period.
In the 12 months to 31 December 2017, there was a net outflow of 2,260 personnel from the UK Regular
Forces. An increase from a net outflow of 1,660 in the 12 months to 31 December 2016.
Intake
Intake into the trained and untrained UK Regular Forces was 13,040 in the 12 months to 31 December 2017. This has decreased from 13,440 in the 12 months to 31 December 2016.
Of the current intake, 10.7 per cent was into Officers and 89.3 per cent was into Other Ranks.
Compared to the 12 months to 31 December 2016, intake to the RN/RM, Army and RAF has decreased by 2.7 per cent, 3.6 per cent and 0.9 per cent respectively.
UK Regulars are full time Service personnel, including Nursing Services, excluding FTRS personnel, Gurkhas, mobilised Reservists, Military Provost Guarding Service (MPGS), Locally Engaged Personnel (LEP), and Non Regular Permanent Service (NRPS).
Intake is defined as the number
joining the Strength, whereas
Outflow is the number leaving.
Figure 3: Intake to and Outflow from the UK Regular Forces over a 12-month period
0
7 500
15 000
22 500
30 000
Dec 11 Dec 12 Dec 13 Dec 14 Dec 15 Dec 16 Dec 17
Nu
mb
er
of P
ers
on
ne
l
12 Months Ending
All Services
Outflow
Intake
0
1 625
3 250
4 875
6 500
Dec 11 Dec 12 Dec 13 Dec 14 Dec 15 Dec 16 Dec 17
Nu
mb
er
of P
ers
on
ne
l
12 Months Ending
RN/RM
Outflow
Intake
0
4 250
8 500
12 750
17 000
Dec 11 Dec 12 Dec 13 Dec 14 Dec 15 Dec 16 Dec 17
Nu
mb
er
of P
ers
on
ne
l
12 Months Ending
Army
Outflow
Intake
0
1 675
3 350
5 025
6 700
Dec 11 Dec 12 Dec 13 Dec 14 Dec 15 Dec 16 Dec 17
Nu
mb
er
of P
ers
on
ne
l
12 Months Ending
RAF
Outflow
Intake
RN/RM 32 440 32 450 p p
of which FTTS 29 190 90.0% 28 910 p 89.1% p
Army 83 610 81 710 p p
of which FTTS 80 280 96.0% 78 450 p 96.0% p
of which FTTTS 76 260 91.2% 74 430 p 91.1% p
RAF 33 230 32 880 p p
of which FTTS 30 840 92.8% 30 510 p 92.8% p
Table 4: UK Regular Forces by Service and Training
1 Jan 17 1 Jan 18
Source: Defence Statistics Tri Service
8
UK Regular Personnel
Voluntary Outflow encompasses all
trained (RN/RM & RAF) and Trade Trained (Army) personnel who voluntarily exit before the end of their agreed engagement or commission period. Time Expiry is a term used to describe
those in the Armed Services who reach the end of their engagement or commission and then leave. Other includes outflow from the trained
(RN/RM & RAF) and trade trained (Army) strength due to, amongst others, medical reasons, misconduct, compassionate, dismissals and death.
Outflow
Outflow from the trained and untrained UK Regular Forces was 15,300 in the 12 months to 31 December 2017; up from 15,100 in the 12 months to 31 December 2016.
Across all services, VO was the most common reason for outflow of Trained and Trade-Trained personnel, accounting for 59.4% of outflow in the 12 months to 31 December 2017.
The RAF had the highest percentage of outflow accounted for by VO (66.2%) while the Army had the lowest (57.8%) in the 12 months to 31 December 2017.
In the 12 months to 31 December 2017, 7,510 trained (RN/RM & RAF) and trade trained (Army) personnel left through VO; the VO rate was 5.6 per cent. This is an increase from 7,350 in the 12 months to 31 December 2016 but the VO rate remains stable at 5.4 per cent.
In the 12 months to 31 December 2017, the VO rate
amongst Other Ranks (5.8 per cent) is higher when
compared to Officers (4.3 per cent).
Voluntary Outflow encompasses all
trained (RN/RM & RAF) and Trade Trained (Army) personnel who voluntarily exit before the end of their agreed engagement or commission period. Time Expiry is a term used to describe
those in the Armed Services who reach the end of their engagement or commission and then leave.
Other includes outflow from the trained (RN/
RM & RAF) and trade trained (Army) strength
due to, amongst others, medical reasons,
misconduct, compassionate, dismissals and
death.
There is no single reason why personnel leave on Voluntary Outflow, but the personnel who completed the Armed Forces Continuous Attitude Survey indicated reasons for leaving the Armed Forces included the impact of Service life on family and personal life and opportunities outside the Armed Forces.
Figure 4: Outflow of trained (RN/RM & RAF) and trade trained (Army) UK Regulars by exit rea-son (12 months to 31 December 2017)
Intake and outflow statistics report how many people have left or joined the trained or untrained strengths. As
well as leavers and new recruits, this can include personnel transferring to or from the Regular Forces, other
Reserve populations, or Reserve re-joiners.
Figure 10: Intake to and Outflow from the FR20 Reserves over 12 month period
The total intake rates for each service in the 12 months to
1 January 2018 are as follows:
The Maritime Reserve total intake rate was 22.5
per cent; a decrease of 4.1 percentage points
since the 12 months to 1 January 2017
The Army Reserve total intake rate was 15.3 per
cent; a decrease of 2.8 percentage points since
the 12 months to 1 January 2017
The RAF Reserves total intake rate was 24.1 per
cent; a decrease of 2.0 percentage points since
the 12 months to 1 January 2017
Figure 8: Total intake rate by Service
Figure 9: Total outflow rate by Service The total outflow rates for each service in the 12 months
to 1 January 2018 are as follows:
The Maritime Reserve total outflow rate was 16.8
per cent; a decrease of 9.1 percentage points
since the 12 months to 1 January 2017
The Army Reserve total outflow rate was 13.9 per
cent; an increase of 1.2 percentage points since
the 12 months to 1 January 2017
The RAF Reserves total outflow rate was 15.7 per
cent; a decrease of 3.1 percentage points since
the 12 months to 1 January 2017
0%
5%
10%
15%
20%
25%
30%
Mar 14 Sep 14 Mar 15 Sep 15 Mar 16 Sep 16 Mar 17 Sep 17 Mar 18
% o
f to
tal p
ers
on
nel
RAF Reserves:15.7%
MaritimeReserve: 16.8%
Army Reserve: 13.9%
12 months ending
0%
5%
10%
15%
20%
25%
30%
35%
40%
45%
50%
Mar 14 Sep 14 Mar 15 Sep 15 Mar 16 Sep 16 Mar 17 Sep 17 Mar 18
% o
f to
tal p
ers
on
nel
MaritimeReserve: 22.5%
Army Reserve: 15.3%
12 months ending
RAF Reserves: 24.1%
0
2 000
4 000
6 000
8 000
10 000
Dec-12 Dec-13 Dec-14 Dec-15 Dec-16 Dec-17
Nu
mb
er
of
Pe
rso
nn
el
12 months ending
All Services
Intake
0
2 000
4 000
6 000
8 000
Dec-12 Dec-13 Dec-14 Dec-15 Dec-16 Dec-17
Nu
mb
er
of
Pe
rso
nn
el
12 months ending
Army Reserve FR20
Outflow
Intake
0
200
400
600
800
1 000
1 200
Dec-12 Dec-13 Dec-14 Dec-15 Dec-16 Dec-17
Nu
mb
er
of
Pe
rso
nn
el
12 months ending
Maritime Reserve
Outflow
Intake
0
200
400
600
800
1 000
1 200
Dec-12 Dec-13 Dec-14 Dec-15 Dec-16 Dec-17
Nu
mb
er o
f P
erso
nn
el
12 months ending
RAF Reserves
Outflow
Intake
11
Separated Service
Separated service measures absence from normal place of duty. The time an individual experiences separated service is com-pared against each Service’s “Individual Harmony” guidelines to ensure a balance between duty and leisure for all Service Person-nel.
A breach of individual harmony guidelines occurs when Service personnel experience separated service for longer than the period outlined in individual harmony guidelines, which are based on the structures and organisation of that Service. The guidelines are measured over a 36 month period and the limits are 660 days away for the RN/RM; 498 days for the Army; and 468 days away for the RAF.
Prior to April 2014, these limits were 415 days over a 30 month period for the Army and 280 days over a 24 month period for the RAF.
Using 1 April 2017 as an example:
Trained UK Regular personnel breaching over 1 April 2014 – 31 March 2017
Trained UK Regular personnel as at 1 April 2017
Table 5 shows the rate at which individual harmony guidelines have been breached by Service.
Separated Service concerns
personnel who are serving away
from their usual place of duty or
are unable to enjoy leisure at their
normal place of duty or residence
at place of duty.
Individual Harmony is the free-
dom to enjoy leisure at the normal
place of duty or residence at place
of duty; this includes leave and
adventurous training.
Applications
Following on from the last publication in November, a new recruiting system has been in the pro-
cess of being implemented and as such no information is currently available for subsequent peri-
ods. It is presently not known when the new system will be fully available. Further information will
follow in subsequent editions of Quarterly Service Personnel Statistics as and when it becomes
available.
Note: Due to the unavailability of 1 January Separated Service data, 1 Jan 2018 and 1 Apr 2018 figures
will be published in the 1 Apr 2018 version of Quarterly Service Personnel Statistics.
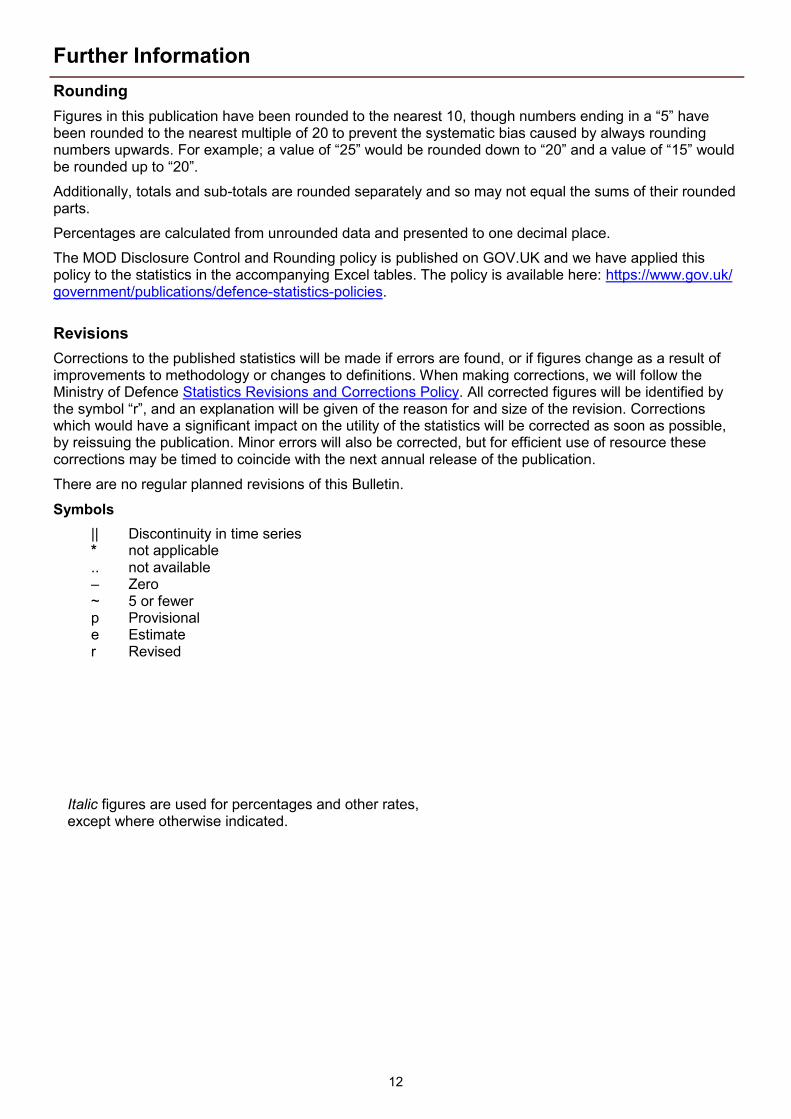
Figures in this publication have been rounded to the nearest 10, though numbers ending in a “5” have been rounded to the nearest multiple of 20 to prevent the systematic bias caused by always rounding numbers upwards. For example; a value of “25” would be rounded down to “20” and a value of “15” would be rounded up to “20”.
Additionally, totals and sub-totals are rounded separately and so may not equal the sums of their rounded parts.
Percentages are calculated from unrounded data and presented to one decimal place.
The MOD Disclosure Control and Rounding policy is published on GOV.UK and we have applied this policy to the statistics in the accompanying Excel tables. The policy is available here: https://www.gov.uk/government/publications/defence-statistics-policies.
Revisions
Corrections to the published statistics will be made if errors are found, or if figures change as a result of improvements to methodology or changes to definitions. When making corrections, we will follow the Ministry of Defence Statistics Revisions and Corrections Policy. All corrected figures will be identified by the symbol “r”, and an explanation will be given of the reason for and size of the revision. Corrections which would have a significant impact on the utility of the statistics will be corrected as soon as possible, by reissuing the publication. Minor errors will also be corrected, but for efficient use of resource these corrections may be timed to coincide with the next annual release of the publication.
There are no regular planned revisions of this Bulletin.
Symbols
|| Discontinuity in time series * not applicable .. not available – Zero ~ 5 or fewer p Provisional e Estimate r Revised
Italic figures are used for percentages and other rates, except where otherwise indicated.
If you require information which is not available within this or other available publications, you may wish to submit a Request for Information under the Freedom of Information Act 2000 to the Ministry of Defence. For more information, see: