www.pwc.co.uk/economics UK Economic Outlook July 2017 Special features on: • UK housing market outlook • A machine learning approach to estimating current GDP growth Visit our blog for periodic updates at: pwc.blogs.com/economics_in_business
Transcript
www.pwc.co.uk/economics
UK Economic Outlook
July 2017
Special features on:
• UK housing market outlook
• A machine learning approach to estimating current GDP growth
Visit our blog for periodic updates at: pwc.blogs.com/economics_in_business
2 UK Economic Outlook July 2017
Contents
Section
1. Summary 4
2. UK economic prospects 8
• Key points and introduction 8
• 2.1 Recent developments and the initial impact of Brexit 9
• 2.2 Economic growth prospects after Brexit: national, sectoral and regional 12
• 2.3 Outlookforinflationandrealearningsgrowth 16
• 2.4 Monetaryandfiscalpolicyoptions 18
• 2.5 Summary and conclusions 18
3. UK housing market outlook 19
• Key points and introduction 19
• 3.1 Recent housing market developments 20
• 3.2 House price prospects 21
• 3.3 Sub-regional housing trends 25
• 3.4 Conclusions 31
• Annex – Supplementary data on local house price trends 32
4. A machine learning approach to estimating current GDP growth 35
• Key points and introduction 35
• 4.1 What is the need for a timely view on the state of the economy? 36
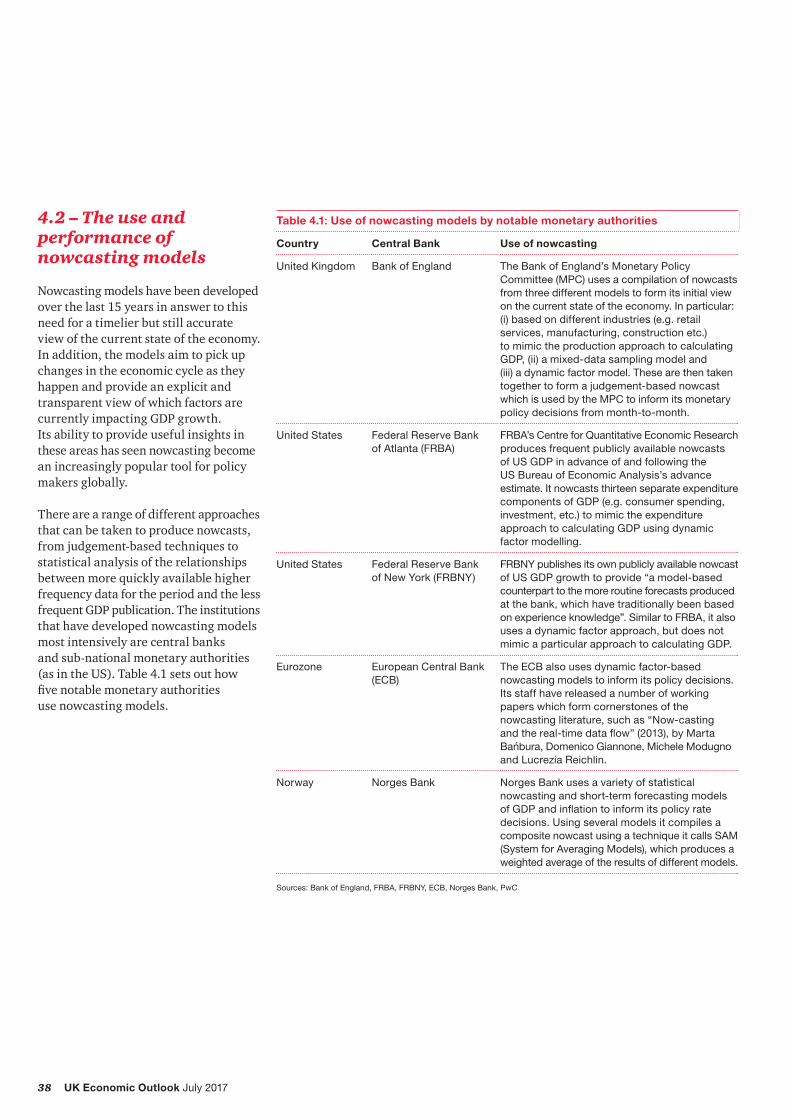
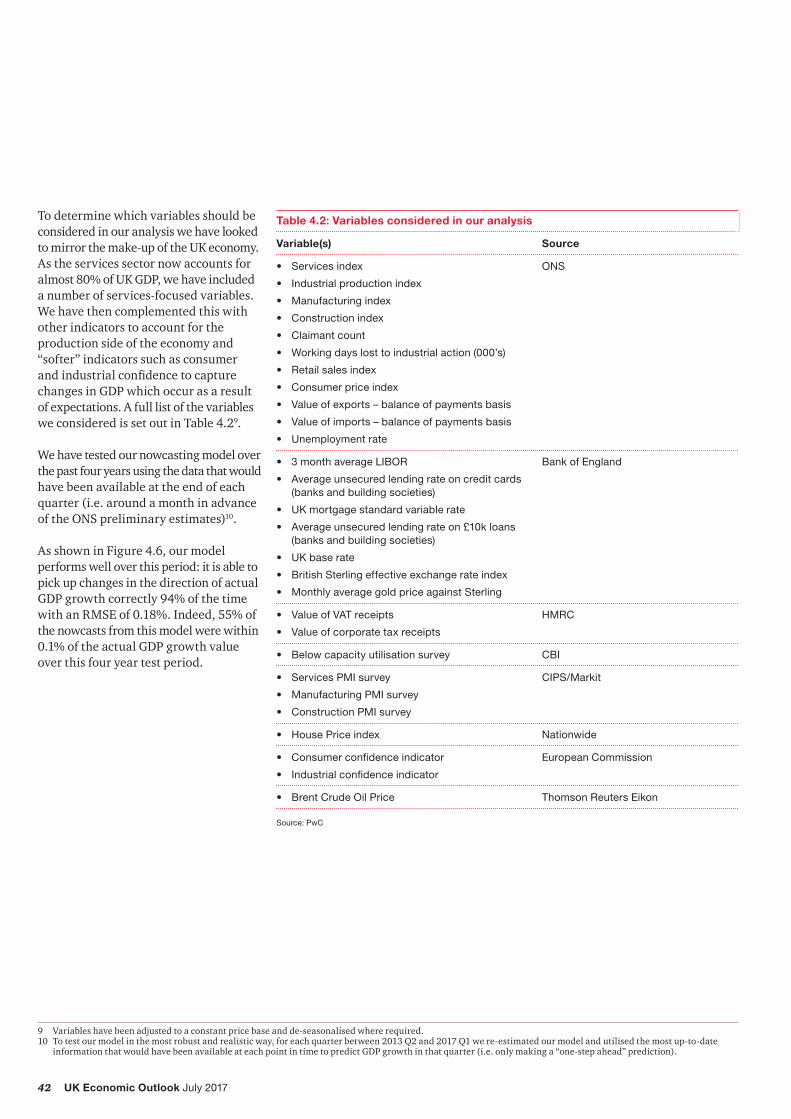
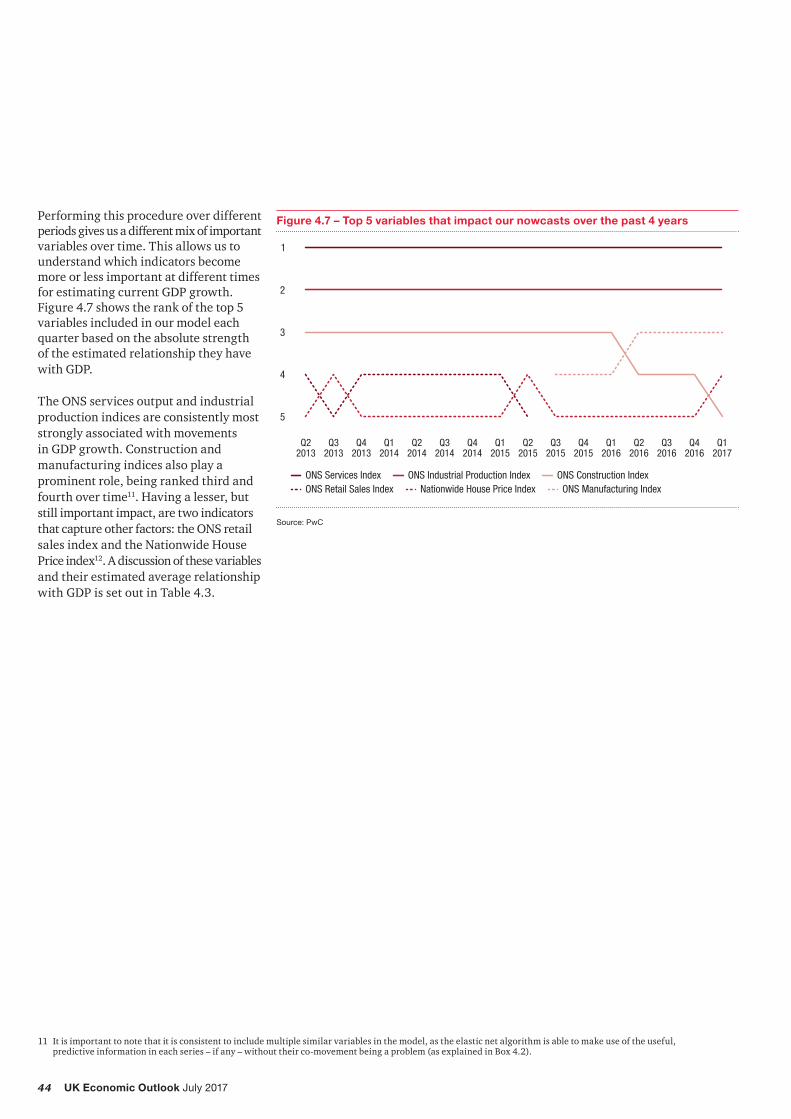
• 4.2 The use and performance of nowcasting models 38
• 4.3 Using machine learning to nowcast current GDP growth 41
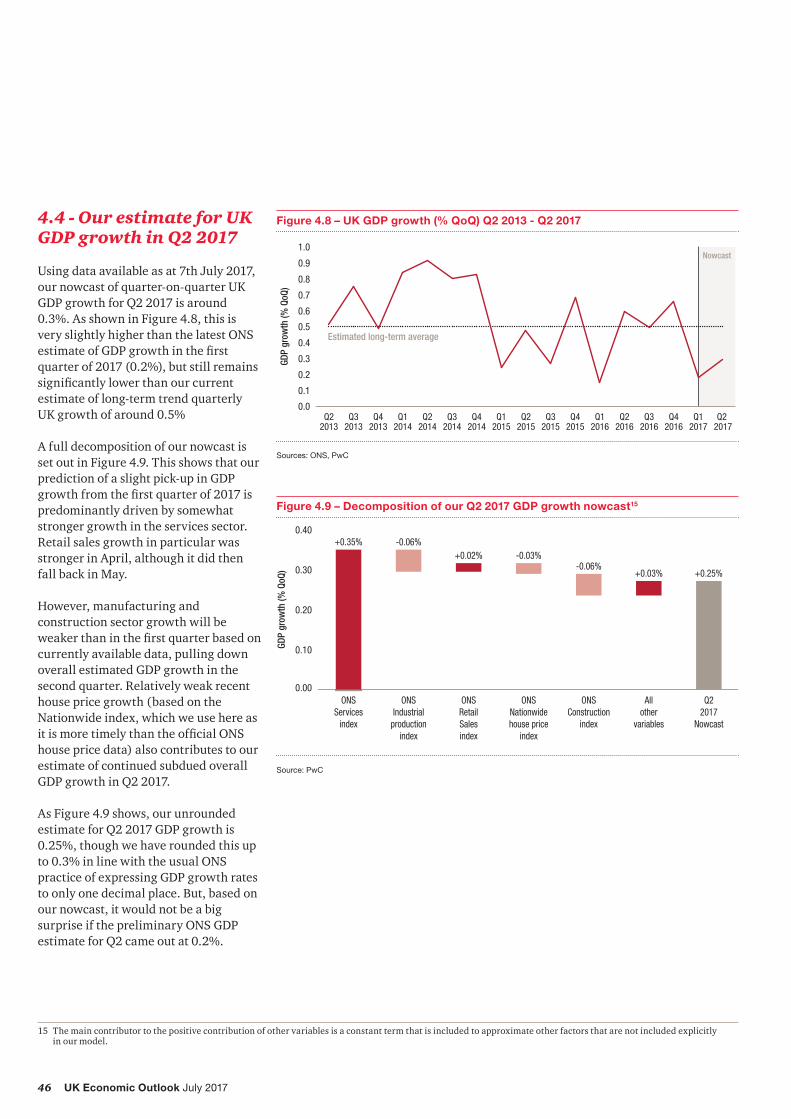
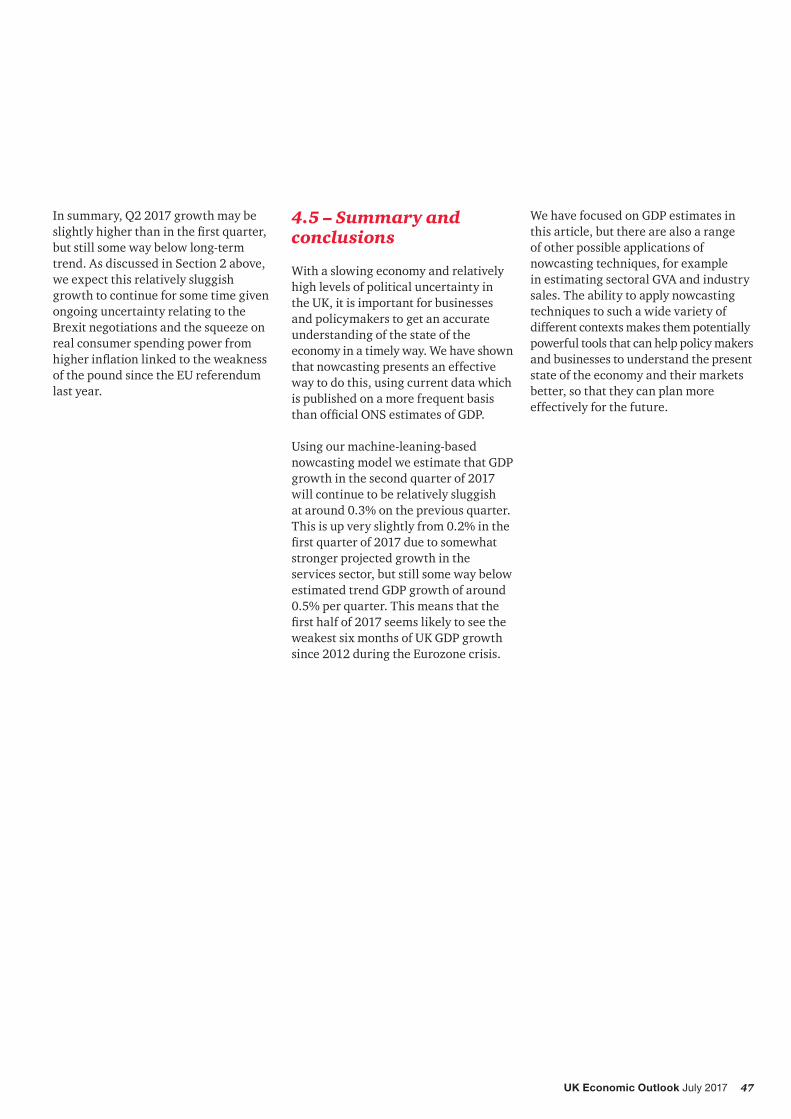
• 4.4 Our estimate for UK GDP growth in Q2 2017 46
• 4.5 Summary and conclusions 47
Appendices
A Outlook for the global economy 48
B UK economic trends: 1979-2016 49
Contacts and services 50
3UK Economic Outlook July 2017
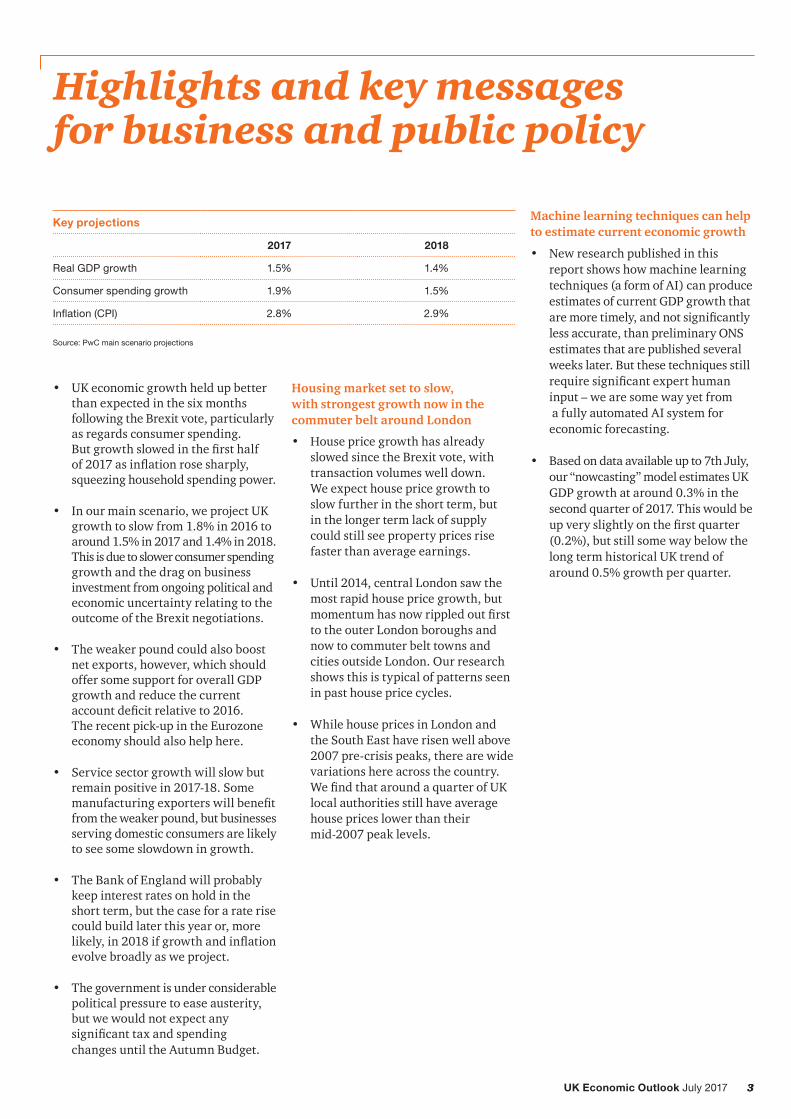
Highlights and key messages for business and public policy
• UK economic growth held up better than expected in the six months following the Brexit vote, particularly as regards consumer spending. Butgrowthslowedinthefirsthalf of2017asinflationrosesharply,squeezing household spending power.
• In our main scenario, we project UK growth to slow from 1.8% in 2016 to around 1.5% in 2017 and 1.4% in 2018. This is due to slower consumer spending growth and the drag on business investment from ongoing political and economic uncertainty relating to the outcome of the Brexit negotiations.
• The weaker pound could also boost net exports, however, which should offer some support for overall GDP growth and reduce the current accountdeficitrelativeto2016. The recent pick-up in the Eurozone economy should also help here.
• Service sector growth will slow but remain positive in 2017-18. Some manufacturingexporterswillbenefitfrom the weaker pound, but businesses serving domestic consumers are likely to see some slowdown in growth.
• The Bank of England will probably keep interest rates on hold in the short term, but the case for a rate rise could build later this year or, more likely,in2018ifgrowthandinflationevolve broadly as we project.
• The government is under considerable political pressure to ease austerity, but we would not expect any significanttaxandspending changes until the Autumn Budget.
Housing market set to slow, with strongest growth now in the commuter belt around London
• House price growth has already slowed since the Brexit vote, with transaction volumes well down. We expect house price growth to slow further in the short term, but in the longer term lack of supply could still see property prices rise faster than average earnings.
• Until 2014, central London saw the most rapid house price growth, but momentumhasnowrippledoutfirstto the outer London boroughs and now to commuter belt towns and cities outside London. Our research shows this is typical of patterns seen in past house price cycles.
• While house prices in London and the South East have risen well above 2007 pre-crisis peaks, there are wide variations here across the country. WefindthataroundaquarterofUKlocal authorities still have average house prices lower than their mid-2007 peak levels.
Machine learning techniques can help to estimate current economic growth
• New research published in this report shows how machine learning techniques (a form of AI) can produce estimates of current GDP growth that aremoretimely,andnotsignificantlyless accurate, than preliminary ONS estimates that are published several weeks later. But these techniques still requiresignificantexperthumaninput – we are some way yet from a fully automated AI system for economic forecasting.
• Based on data available up to 7th July, our “nowcasting” model estimates UK GDP growth at around 0.3% in the second quarter of 2017. This would be upveryslightlyonthefirstquarter(0.2%), but still some way below the long term historical UK trend of around 0.5% growth per quarter.
3
Key projections
2017 2018
Real GDP growth 1.5% 1.4%
Consumer spending growth 1.9% 1.5%
Inflation (CPI) 2.8% 2.9%
Source: PwC main scenario projections
4 UK Economic Outlook July 2017
1 – Summary
Recent developmentsThe UK economy held up well in the six months after the EU referendum, particularly as regards consumer spending. But growth then slowed markedly in the firstquarterof2017asbothconsumerspending and services growth moderated.
A key factor behind this recent moderation has been an increase in the rate of consumerpriceinflation(CPI)fromaround zero on average in 2015 to 2.9% in the year to May 2017, as global commodity prices have picked up somewhat from lows in early 2016, and the effects of the weak pound after the Brexit vote have fed through supply chains.Higherinflationhassqueezedreal household incomes and, despite a falling savings ratio, this has taken the edge off consumer-led growth.
On the more positive side, investment has held up reasonably well since the Brexit vote, while exports should be boosted by an upturn in global growth, notably in the Eurozone. The weaker pound, although bad for UK consumers, has been helpful to exporters and inbound tourism.
Table 1.1: Summary of UK economic growth and inflation prospects
Indicator (% change on previous year)
OBR forecasts (March 2017)
Independent forecasts
(June 2017)
PwC Main scenario
(July 2017)
2017 2018 2017 2018 2017 2018
GDP 2.0 1.6 1.6 1.4 1.5 1.4
Consumer spending 1.8 0.9 1.7 1.0 1.9 1.5
Inflation (CPI) 2.4 2.3 2.7 2.7 2.8 2.9
Source: Office for Budget Responsibility (March 2017), HM Treasury survey of independent forecasters (average value of new forecasts made in June 2017 survey) and latest PwC main scenario.
Future prospects
As shown in Table 1.1, our main scenario is for UK GDP growth to slow gradually from 1.8% in 2016 to around 1.5% in 2017 and 1.4% in 2018 as the effects of theweakerpoundoninflationandcontinued Brexit-related uncertainty feed through. Our views on growth are similar to the latest consensus forecasts but slightly lower than the last OBR forecasts in the March 2017 Budget (see Table 1.1). However, the broad pattern of gradually slowing growth in 2017-18 is common to most forecasts at present. Our views on inflationarealsosimilartotheconsensusforecast, but higher than the OBR since we can take account of more recent data.
Consumer spending growth is expected tomoderatein2017-18asinflation bites into real spending power. So far, consumers have offset this in part through higher borrowing, but there are limits to how much further this can go with the household savings ratio having already fallen to very low levels.
On the other hand, the weak pound shouldalsohavesomeoffsettingbenefitsfor net exports as will a somewhat stronger global economy. Brexit-related uncertainty may hold back business investment, but this should be partly offset by planned rises in public investment (as announced in the Autumn Statement last November). Fiscal policy could also be further relaxed in the 2017 Autumn Budget, although we have not factored this into our main scenario projection at this stage.
5UK Economic Outlook July 2017
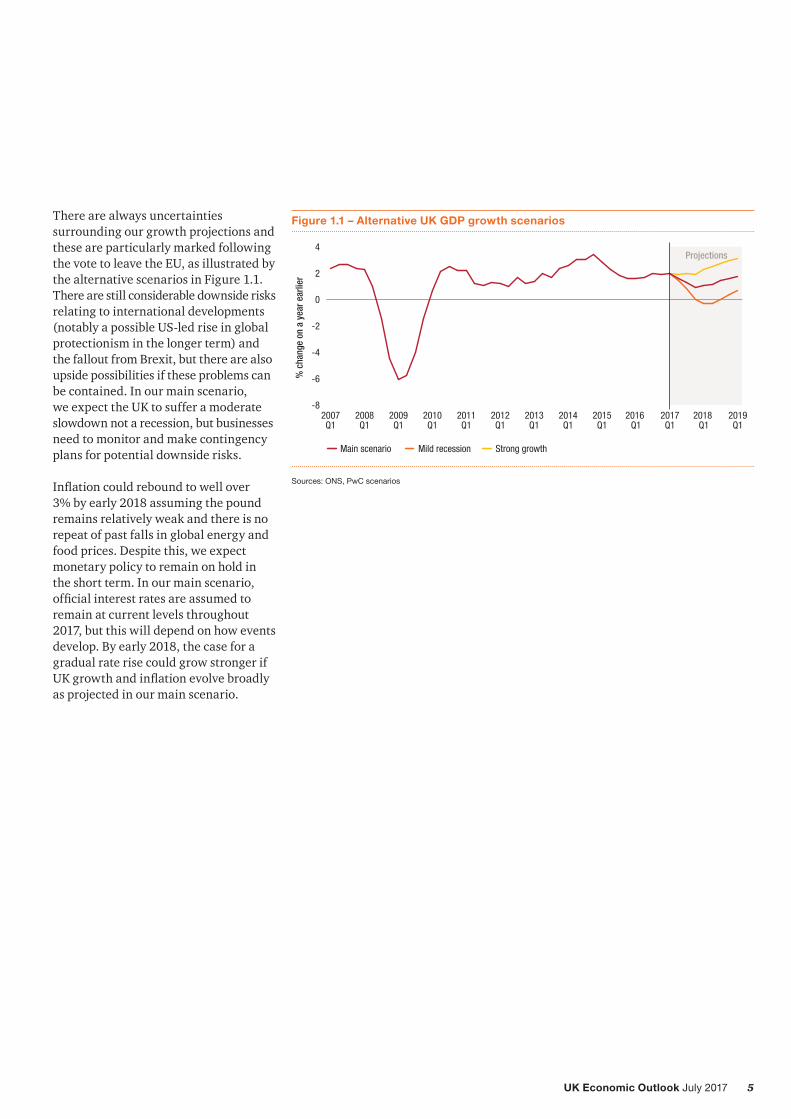
There are always uncertainties surrounding our growth projections and these are particularly marked following the vote to leave the EU, as illustrated by the alternative scenarios in Figure 1.1. There are still considerable downside risks relating to international developments (notably a possible US-led rise in global protectionism in the longer term) and the fallout from Brexit, but there are also upside possibilities if these problems can be contained. In our main scenario, we expect the UK to suffer a moderate slowdown not a recession, but businesses need to monitor and make contingency plans for potential downside risks.
Inflationcouldreboundtowellover 3% by early 2018 assuming the pound remains relatively weak and there is no repeat of past falls in global energy and food prices. Despite this, we expect monetary policy to remain on hold in the short term. In our main scenario, officialinterestratesareassumedtoremain at current levels throughout 2017, but this will depend on how events develop. By early 2018, the case for a gradual rate rise could grow stronger if UKgrowthandinflationevolvebroadlyas projected in our main scenario.
Figure 1.1 – Alternative UK GDP growth scenarios
-8
-6
-4
-2
0
2
4
2019Q1
2018 Q1
2017Q1
2016 Q1
2015Q1
2014Q1
2013Q1
2012Q1
2011Q1
2010Q1
2009Q1
2008Q1
2007Q1
Projections
% c
hang
e on
a y
ear e
arlie
r
Main scenario Mild recession Strong growth
Sources: ONS, PwC scenarios
6 UK Economic Outlook July 2017
Housing market set to slow, while momentum ripples out from London to the commuter belt
House prices were not impacted by the UK’s decision to leave the EU as quickly as some expected, but price growth has been weak in 2017 so far. Transaction volumes appear to have suffered more, but these effects are compounded by other factors such as stamp duty reform.
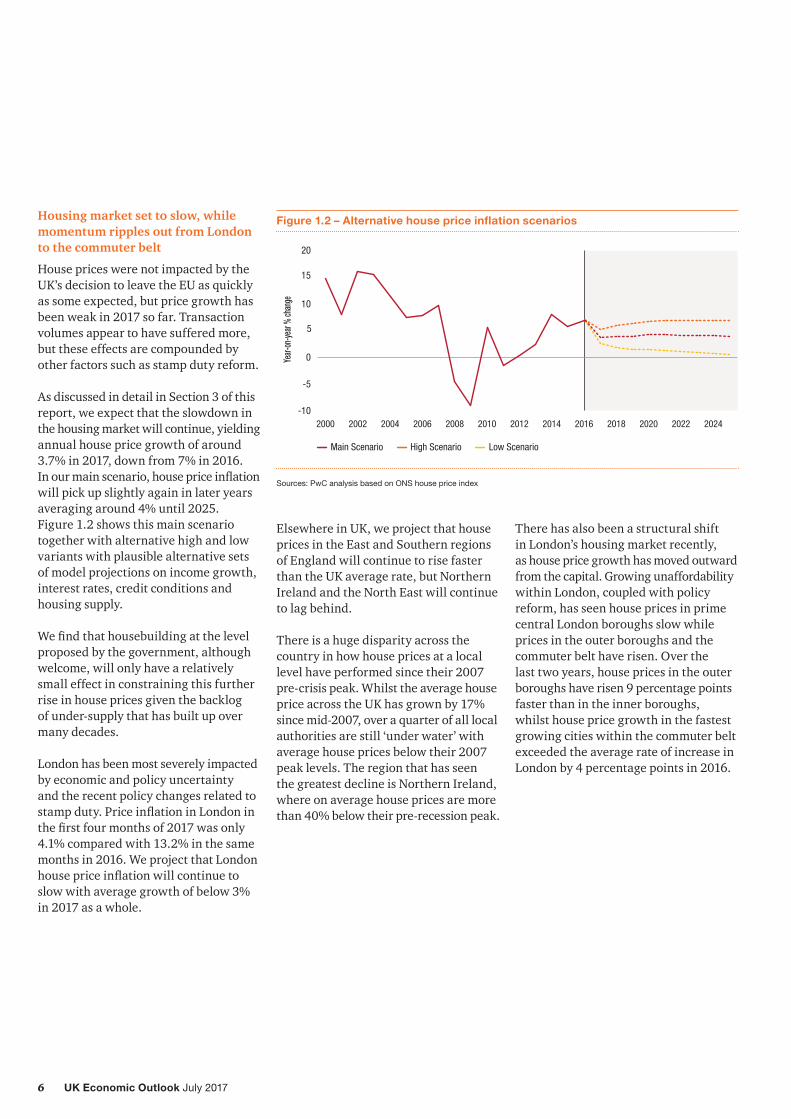
As discussed in detail in Section 3 of this report, we expect that the slowdown in the housing market will continue, yielding annual house price growth of around 3.7% in 2017, down from 7% in 2016. Inourmainscenario,housepriceinflationwill pick up slightly again in later years averaging around 4% until 2025. Figure 1.2 shows this main scenario together with alternative high and low variants with plausible alternative sets of model projections on income growth, interest rates, credit conditions and housing supply.
Wefindthathousebuildingatthelevelproposed by the government, although welcome, will only have a relatively small effect in constraining this further rise in house prices given the backlog of under-supply that has built up over many decades.
London has been most severely impacted by economic and policy uncertainty and the recent policy changes related to stampduty.PriceinflationinLondoninthefirstfourmonthsof2017wasonly4.1% compared with 13.2% in the same months in 2016. We project that London housepriceinflationwillcontinuetoslow with average growth of below 3% in 2017 as a whole.
Figure 1.2 – Alternative house price inflation scenarios
Sources: PwC analysis based on ONS house price index
Elsewhere in UK, we project that house prices in the East and Southern regions of England will continue to rise faster than the UK average rate, but Northern Ireland and the North East will continue to lag behind.
There is a huge disparity across the country in how house prices at a local level have performed since their 2007 pre-crisis peak. Whilst the average house price across the UK has grown by 17% since mid-2007, over a quarter of all local authorities are still ‘under water’ with average house prices below their 2007 peak levels. The region that has seen the greatest decline is Northern Ireland, where on average house prices are more than 40% below their pre-recession peak.
There has also been a structural shift in London’s housing market recently, as house price growth has moved outward from the capital. Growing unaffordability within London, coupled with policy reform, has seen house prices in prime central London boroughs slow while prices in the outer boroughs and the commuter belt have risen. Over the last two years, house prices in the outer boroughs have risen 9 percentage points faster than in the inner boroughs, whilst house price growth in the fastest growing cities within the commuter belt exceeded the average rate of increase in London by 4 percentage points in 2016.
7UK Economic Outlook July 2017
Machine learning techniques can help to estimate current GDP growth
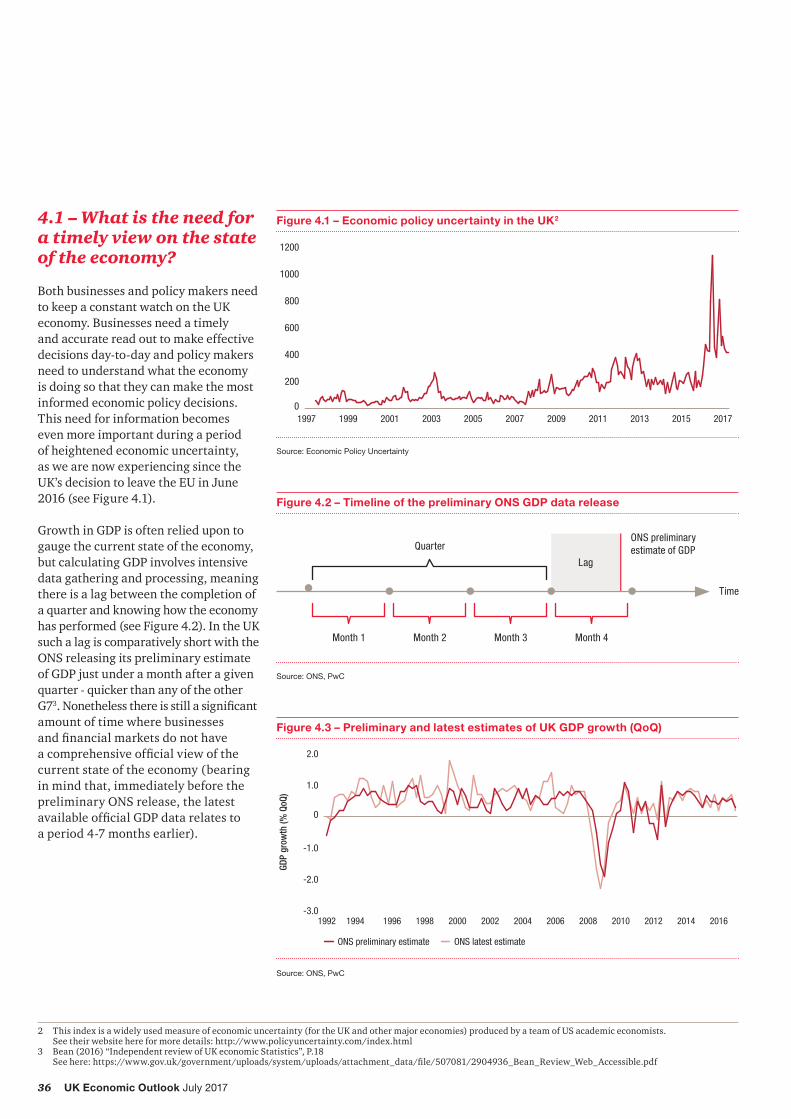
Businesses,financialmarketsandpolicymakers need to keep a constant watch on the UK economy. But the preliminary ONS estimate of GDP growth is released withasignificantlagandcanoftenbemateriallydifferenttolaterfinalestimatesof GDP growth. This creates a potential need for alternative indicators of current economic activity.
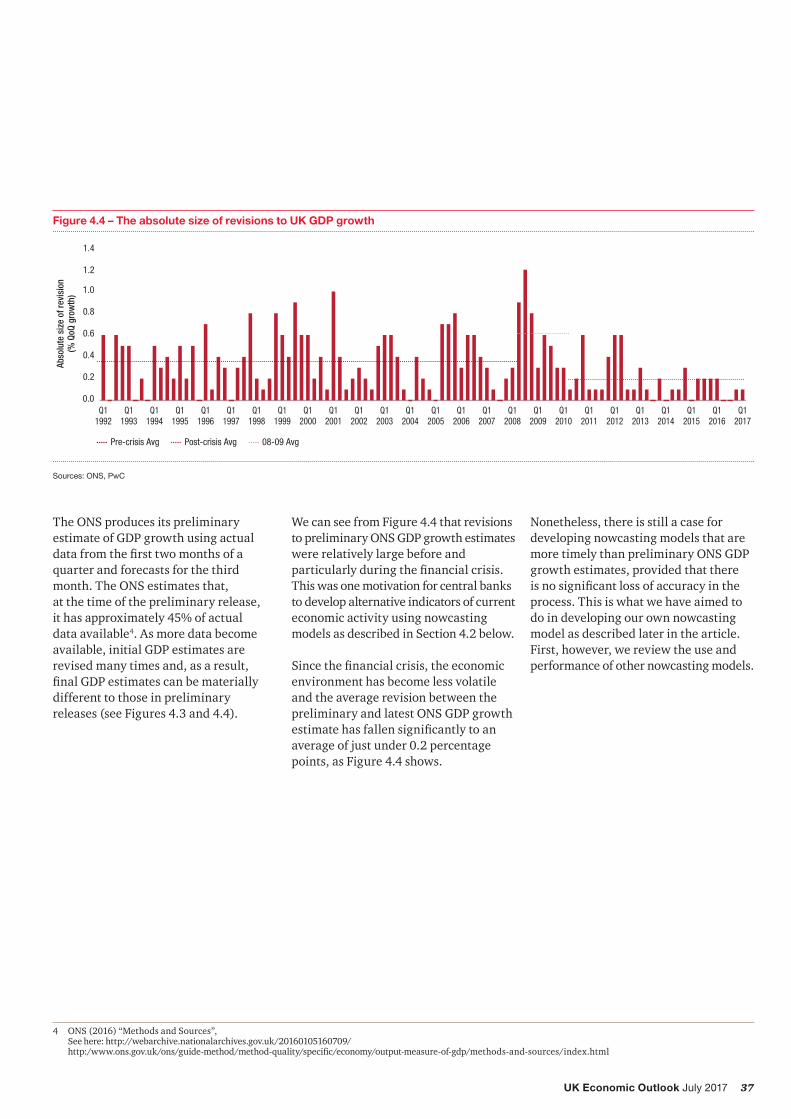
“Nowcasting” models can meet this need by utilising frequently released information to assess current economic activity. They are used across the globe, most notably by central banks in advance ofthereleaseofofficialGDPstatistics.Over certain periods in the UK (e.g. 2001-8) such models have been able to outperform preliminary GDP estimates, though the latter have become more reliable in recent years. But nowcasting models can still give more timely estimates of broadly similar accuracy.
We have therefore developed our own nowcasting model for UK GDP, which utilises machine learning techniques (a form of AI) as described in detail in Section 4 of this report. We use machine learning to augment human expertise and judgement here, not to replace it.
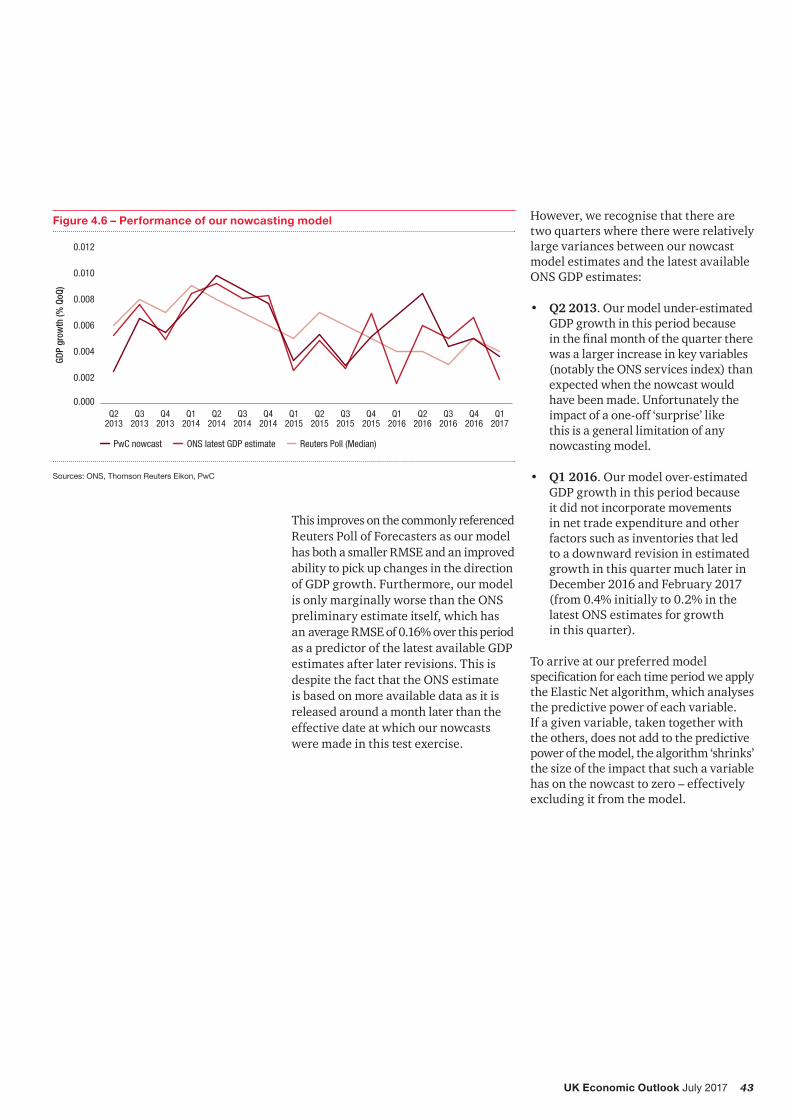
Our analysis shows that output indices used by the ONS when forming their preliminary estimates are strong predictorsoffinalGDP.However,theinclusion of other indicators, such as house prices, materially improves our ability to estimate the latest quarterly movements in GDP. For the last four years, wefindthatournowcastsaresomewhatmore accurate on average than the median estimates from the widely quoted Reuters poll of forecasters and only slightly less accurate than preliminary GDP growth estimates published several weeks later.
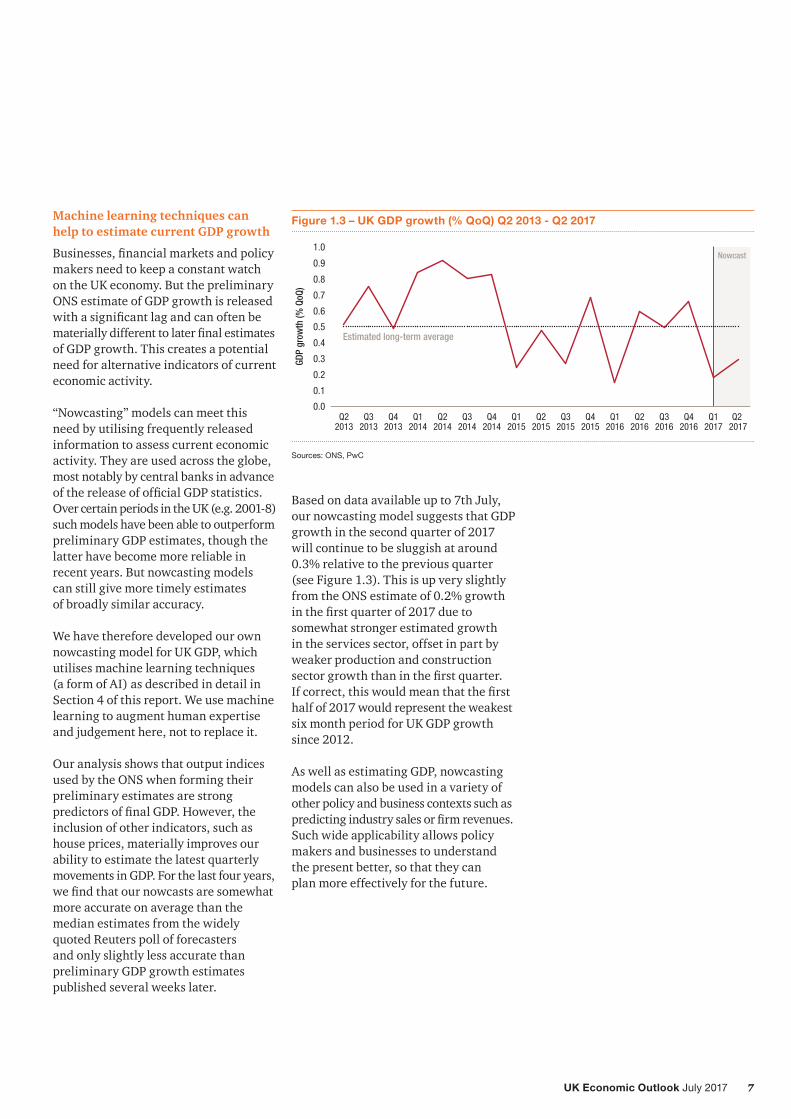
Based on data available up to 7th July, our nowcasting model suggests that GDP growth in the second quarter of 2017 will continue to be sluggish at around 0.3% relative to the previous quarter (see Figure 1.3). This is up very slightly from the ONS estimate of 0.2% growth inthefirstquarterof2017duetosomewhat stronger estimated growth in the services sector, offset in part by weaker production and construction sectorgrowththaninthefirstquarter. Ifcorrect,thiswouldmeanthatthefirsthalf of 2017 would represent the weakest six month period for UK GDP growth since 2012.
As well as estimating GDP, nowcasting models can also be used in a variety of other policy and business contexts such as predictingindustrysalesorfirmrevenues.Such wide applicability allows policy makers and businesses to understand the present better, so that they can plan more effectively for the future.
Figure 1.3 – UK GDP growth (% QoQ) Q2 2013 - Q2 2017
Nowcast
0.0
0.1
0.2
0.3
0.4
0.5
0.6
0.7
0.8
0.9
1.0
Q2 2017
Q12017
Q42016
Q32016
Q22016
Q12016
Q42015
Q32015
Q22015
Q12015
Q42014
Q32014
Q22014
Q12014
Q42013
Q32013
Q22013
Estimated long-term average
GDP
grow
th (%
QoQ
)
Sources: ONS, PwC
8 UK Economic Outlook July 2017
2 – UK economic prospects
Key points• The UK economy grew by 2% in the
year to Q1 2017, but the quarterly rate fell to 0.2%, primarily as a result of a softening in consumer expenditure and the services sector.
• In our main scenario, we forecast UK growth to slow to 1.5% in 2017 and 1.4% in 2018. The UK would avoid recession in this scenario, although risks to growth are still weighted somewhat to the downside given the uncertainties associated with Brexit.
• A key factor behind the overall slowdown is a moderation in consumer spending growth to around 2% in 2017 and 1.5% in 2018.Thisreflectsasqueezeonhousehold spending power from higherinflationandsluggish wage growth.
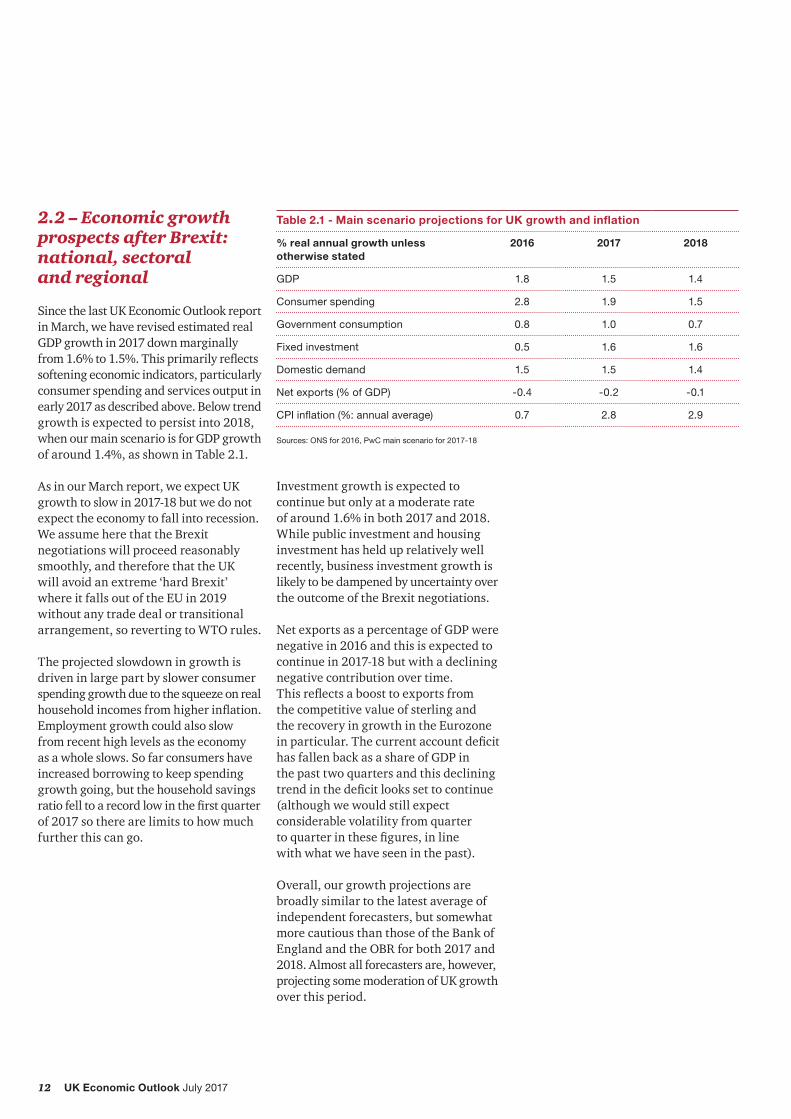
• Wage growth continues to be low despite the lowest unemployment rate since 1975. This suggests that the traditionally negative relationship between these two variables, as described in the Phillips Curve, may have broken down – a view supported by our analysis in this report.
• Investment held up relatively well inthefirstquarter,butuncertaintysurrounding Brexit may weigh on this going forward.
• We project that London could remain the fastest growing UK region in 2017-18, but its pace of expansion is expectedtoslowsignificantlyfromearlier rapid rates. Other regions are projected to see average real growth in 2017-18 of around 1-1.5%, but we do not predict negative growth in any region in our main scenario.
• Consumerpriceinflationislikely to rise above 3% later this year. This continues to be driven by the exchange rate depreciation since the Brexit vote, although this effect could start to fade later in 2018 if wage growth remains subdued.
• The Bank of England voted to hold interest rates at 0.25% in June, but three MPC members voted for an increase and we do expect a very gradual increase in rates to begin sometime over the next year unless there is a sharp deceleration of growth over this period.
IntroductionIn this section of the report we describe recent developments in the UK economy and review future prospects. The discussion covers:
Section 2.1 Recent developments and the initial impact of Brexit
Section 2.2 Economic growth prospects after Brexit: national, sectoral and regional
2.1 – Recent developments and the initial impact of Brexit
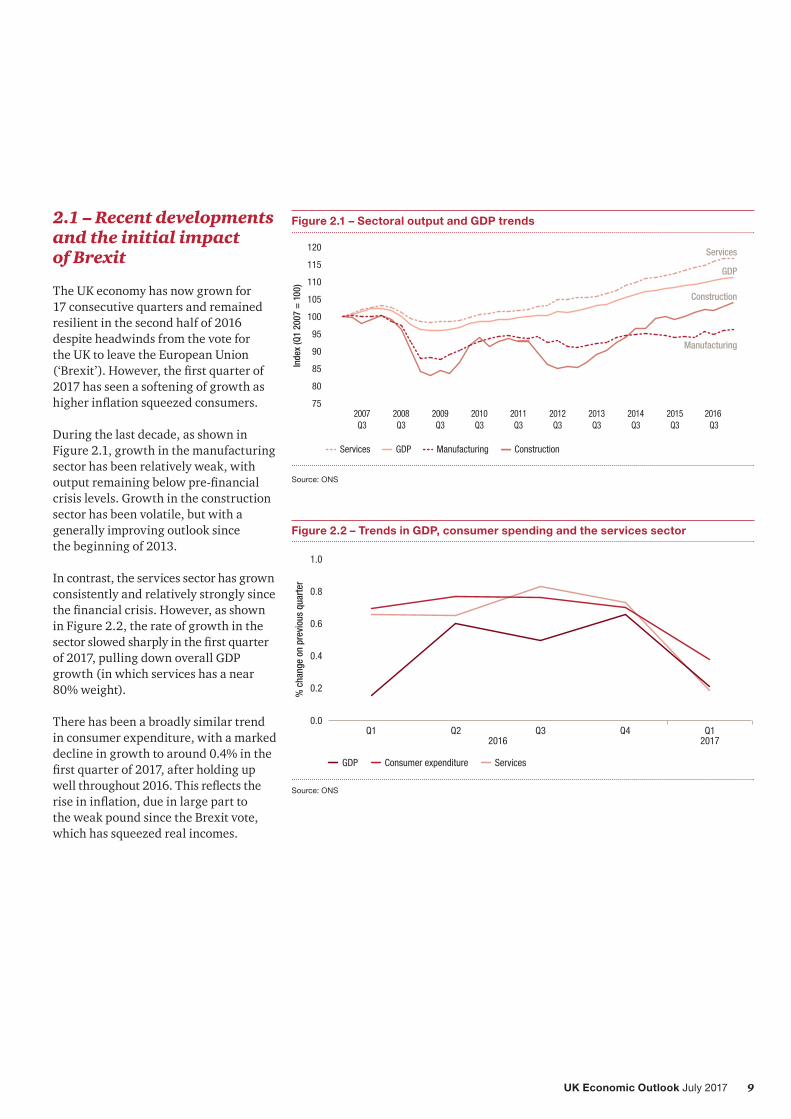
The UK economy has now grown for 17 consecutive quarters and remained resilient in the second half of 2016 despite headwinds from the vote for the UK to leave the European Union (‘Brexit’).However,thefirstquarterof2017 has seen a softening of growth as higherinflationsqueezedconsumers.
During the last decade, as shown in Figure 2.1, growth in the manufacturing sector has been relatively weak, with outputremainingbelowpre-financialcrisis levels. Growth in the construction sector has been volatile, but with a generally improving outlook since the beginning of 2013.
In contrast, the services sector has grown consistently and relatively strongly since thefinancialcrisis.However,asshown in Figure 2.2, the rate of growth in the sectorslowedsharplyinthefirstquarterof 2017, pulling down overall GDP growth (in which services has a near 80% weight).
There has been a broadly similar trend in consumer expenditure, with a marked decline in growth to around 0.4% in the firstquarterof2017,afterholdingupwellthroughout2016.Thisreflectstheriseininflation,dueinlargepartto the weak pound since the Brexit vote, which has squeezed real incomes.
Figure 2.1 – Sectoral output and GDP trends
75
80
85
90
95
100
105
110
115
120
2016 Q3
2015Q3
2014Q3
2013Q3
2012Q3
2011Q3
2010Q3
2009Q3
2008Q3
2007Q3
Inde
x (Q
1 20
07 =
100
)
Services ManufacturingGDP Construction
Services
GDP
Manufacturing
Construction
Source: ONS
Figure 2.2 – Trends in GDP, consumer spending and the services sector
Source: ONS
0.0
0.2
0.4
0.6
0.8
1.0
Q1Q4Q3Q2Q12016 2017
% c
hang
e on
pre
viou
s qu
arte
r
Consumer expenditure ServicesGDP
10 UK Economic Outlook July 2017
There was a further hit to disposable incomes from relatively high tax payments in Q1 2017, though consumers seem to have smoothed this out through higher borrowing rather than reducing their spending more markedly in that quarter. But household savings rates were at the lowest for over 50 years in Q1 2017 as a result, which does not look sustainable in the longer term. The Bank of England has also warned recently that consumer credit growth has become uncomfortably high and suggested that some banks may need to tighten up lending standards in this area.
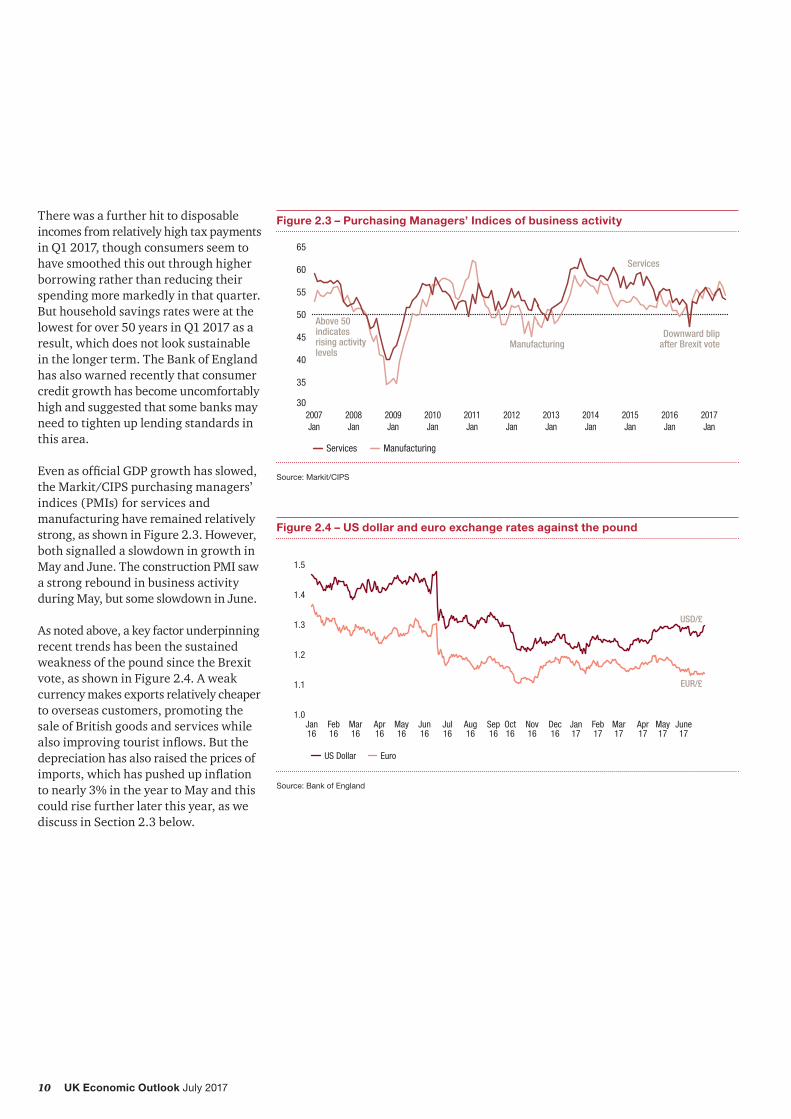
EvenasofficialGDPgrowthhasslowed,the Markit/CIPS purchasing managers’ indices (PMIs) for services and manufacturing have remained relatively strong, as shown in Figure 2.3. However, both signalled a slowdown in growth in May and June. The construction PMI saw a strong rebound in business activity during May, but some slowdown in June.
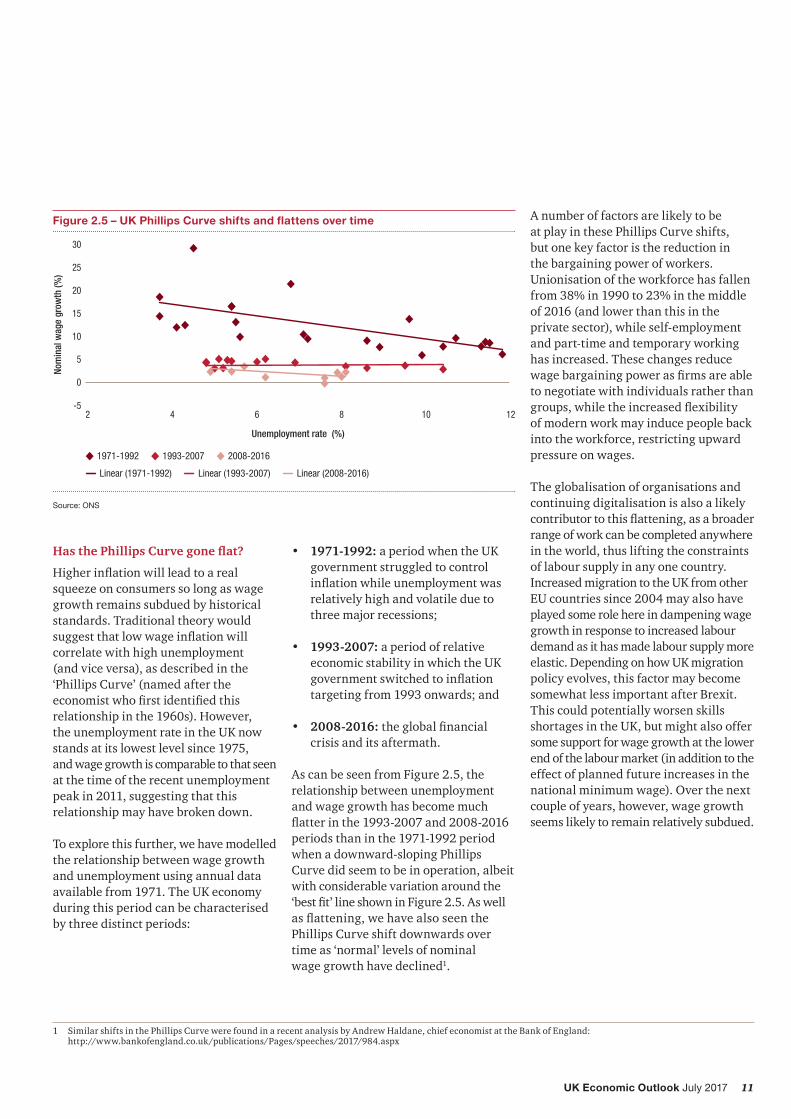
As noted above, a key factor underpinning recent trends has been the sustained weakness of the pound since the Brexit vote, as shown in Figure 2.4. A weak currency makes exports relatively cheaper to overseas customers, promoting the sale of British goods and services while alsoimprovingtouristinflows.Butthedepreciation has also raised the prices of imports,whichhaspushedupinflationto nearly 3% in the year to May and this could rise further later this year, as we discuss in Section 2.3 below.
Figure 2.4 – US dollar and euro exchange rates against the pound
1.0
1.1
1.2
1.3
1.4
1.5
June17
May17
Apr17
Mar17
Feb17
Jan17
Dec16
Nov16
Oct16
Sep16
Aug16
Jul16
Jun16
May16
Apr16
Mar16
Feb16
Jan16
US Dollar Euro
EUR/£
USD/£
Source: Bank of England
Figure 2.3 – Purchasing Managers’ Indices of business activity
30
35
40
45
50
55
60
65
2017Jan
2016Jan
2015Jan
2014Jan
2013Jan
2012Jan
2011Jan
2010Jan
2009Jan
2008Jan
2007Jan
Services Manufacturing
Services
Manufacturing
Above 50 indicates rising activity levels
Downward blipafter Brexit vote
Source: Markit/CIPS
11UK Economic Outlook July 2017
Has the Phillips Curve gone flat?
Higherinflationwillleadtoarealsqueeze on consumers so long as wage growth remains subdued by historical standards. Traditional theory would suggestthatlowwageinflationwillcorrelate with high unemployment (and vice versa), as described in the ‘Phillips Curve’ (named after the economistwhofirstidentifiedthisrelationship in the 1960s). However, the unemployment rate in the UK now stands at its lowest level since 1975, and wage growth is comparable to that seen at the time of the recent unemployment peak in 2011, suggesting that this relationship may have broken down.
To explore this further, we have modelled the relationship between wage growth and unemployment using annual data available from 1971. The UK economy during this period can be characterised by three distinct periods:
Figure 2.5 – UK Phillips Curve shifts and flattens over time
2 4 6 8 10 12-5
0
5
10
15
20
25
30
Linear (1993-2007) Linear (2008-2016)Linear (1971-1992)
1971-1992 1993-2007 2008-2016
Nom
inal
wag
e gr
owth
(%)
Unemployment rate (%)
Source: ONS
• 1971-1992: a period when the UK government struggled to control inflationwhileunemploymentwasrelatively high and volatile due to three major recessions;
• 1993-2007: a period of relative economic stability in which the UK governmentswitchedtoinflationtargeting from 1993 onwards; and
• 2008-2016:theglobalfinancialcrisis and its aftermath.
As can be seen from Figure 2.5, the relationship between unemployment and wage growth has become much flatterinthe1993-2007and2008-2016periods than in the 1971-1992 period when a downward-sloping Phillips Curve did seem to be in operation, albeit with considerable variation around the ‘bestfit’lineshowninFigure2.5.Aswellasflattening,wehavealsoseenthePhillips Curve shift downwards over time as ‘normal’ levels of nominal wage growth have declined1.
A number of factors are likely to be at play in these Phillips Curve shifts, but one key factor is the reduction in the bargaining power of workers. Unionisation of the workforce has fallen from 38% in 1990 to 23% in the middle of 2016 (and lower than this in the private sector), while self-employment and part-time and temporary working has increased. These changes reduce wagebargainingpowerasfirmsareableto negotiate with individuals rather than groups,whiletheincreasedflexibility of modern work may induce people back into the workforce, restricting upward pressure on wages.
The globalisation of organisations and continuing digitalisation is also a likely contributortothisflattening,asabroaderrange of work can be completed anywhere in the world, thus lifting the constraints of labour supply in any one country. Increased migration to the UK from other EU countries since 2004 may also have played some role here in dampening wage growth in response to increased labour demand as it has made labour supply more elastic. Depending on how UK migration policy evolves, this factor may become somewhat less important after Brexit. This could potentially worsen skills shortages in the UK, but might also offer some support for wage growth at the lower end of the labour market (in addition to the effect of planned future increases in the national minimum wage). Over the next couple of years, however, wage growth seems likely to remain relatively subdued.
1 Similar shifts in the Phillips Curve were found in a recent analysis by Andrew Haldane, chief economist at the Bank of England: http://www.bankofengland.co.uk/publications/Pages/speeches/2017/984.aspx
12 UK Economic Outlook July 2017
2.2 – Economic growth prospects after Brexit: national, sectoral and regional
Since the last UK Economic Outlook report in March, we have revised estimated real GDP growth in 2017 down marginally from1.6%to1.5%.Thisprimarilyreflectssoftening economic indicators, particularly consumer spending and services output in early 2017 as described above. Below trend growth is expected to persist into 2018, when our main scenario is for GDP growth of around 1.4%, as shown in Table 2.1.
As in our March report, we expect UK growth to slow in 2017-18 but we do not expect the economy to fall into recession. We assume here that the Brexit negotiations will proceed reasonably smoothly, and therefore that the UK will avoid an extreme ‘hard Brexit’ where it falls out of the EU in 2019 without any trade deal or transitional arrangement, so reverting to WTO rules.
The projected slowdown in growth is driven in large part by slower consumer spending growth due to the squeeze on real householdincomesfromhigherinflation.Employment growth could also slow from recent high levels as the economy as a whole slows. So far consumers have increased borrowing to keep spending growth going, but the household savings ratiofelltoarecordlowinthefirstquarterof 2017 so there are limits to how much further this can go.
Investment growth is expected to continue but only at a moderate rate of around 1.6% in both 2017 and 2018. While public investment and housing investment has held up relatively well recently, business investment growth is likely to be dampened by uncertainty over the outcome of the Brexit negotiations.
Net exports as a percentage of GDP were negative in 2016 and this is expected to continue in 2017-18 but with a declining negative contribution over time. Thisreflectsaboosttoexportsfrom the competitive value of sterling and the recovery in growth in the Eurozone inparticular.Thecurrentaccountdeficithas fallen back as a share of GDP in the past two quarters and this declining trendinthedeficitlookssettocontinue(although we would still expect considerable volatility from quarter toquarterinthesefigures,inline with what we have seen in the past).
Overall, our growth projections are broadly similar to the latest average of independent forecasters, but somewhat more cautious than those of the Bank of England and the OBR for both 2017 and 2018. Almost all forecasters are, however, projecting some moderation of UK growth over this period.
Table 2.1 - Main scenario projections for UK growth and inflation
% real annual growth unless otherwise stated
2016 2017 2018
GDP 1.8 1.5 1.4
Consumer spending 2.8 1.9 1.5
Government consumption 0.8 1.0 0.7
Fixed investment 0.5 1.6 1.6
Domestic demand 1.5 1.5 1.4
Net exports (% of GDP) -0.4 -0.2 -0.1
CPI inflation (%: annual average) 0.7 2.8 2.9
Sources: ONS for 2016, PwC main scenario for 2017-18
13UK Economic Outlook July 2017
Figure 2.6 – Alternative UK GDP growth scenarios
-8
-6
-4
-2
0
2
4
2019Q1
2018 Q1
2017Q1
2016 Q1
2015Q1
2014Q1
2013Q1
2012Q1
2011Q1
2010Q1
2009Q1
2008Q1
2007Q1
Projections
% c
hang
e on
a y
ear e
arlie
r
Main scenario Mild recession Strong growth
Sources: ONS, PwC scenarios
Alternative growth scenarios – businesses need to make contingency plans
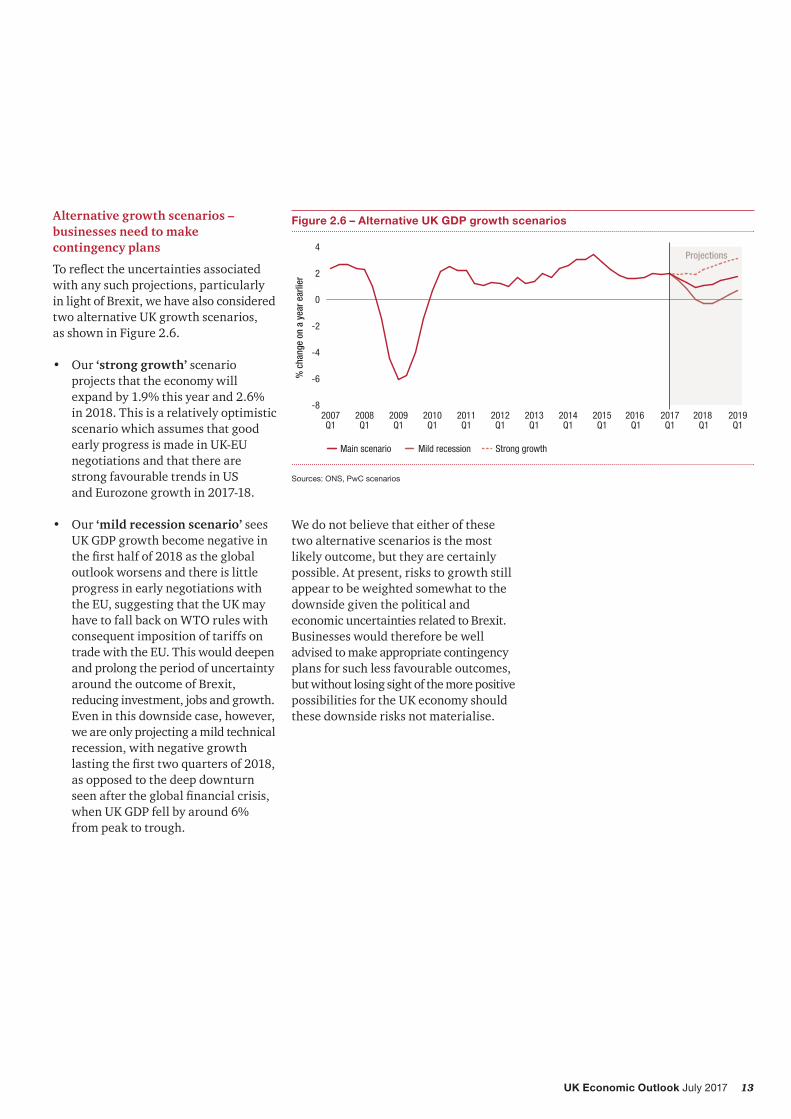
Toreflecttheuncertaintiesassociatedwith any such projections, particularly in light of Brexit, we have also considered two alternative UK growth scenarios, as shown in Figure 2.6.
• Our ‘strong growth’ scenario projects that the economy will expand by 1.9% this year and 2.6% in 2018. This is a relatively optimistic scenario which assumes that good early progress is made in UK-EU negotiations and that there are strong favourable trends in US and Eurozone growth in 2017-18.
• Our ‘mild recession scenario’ sees UK GDP growth become negative in thefirsthalfof2018astheglobaloutlook worsens and there is little progress in early negotiations with the EU, suggesting that the UK may have to fall back on WTO rules with consequent imposition of tariffs on trade with the EU. This would deepen and prolong the period of uncertainty around the outcome of Brexit, reducing investment, jobs and growth. Even in this downside case, however, we are only projecting a mild technical recession, with negative growth lastingthefirsttwoquartersof2018,as opposed to the deep downturn seenaftertheglobalfinancialcrisis,when UK GDP fell by around 6% from peak to trough.
We do not believe that either of these two alternative scenarios is the most likely outcome, but they are certainly possible. At present, risks to growth still appear to be weighted somewhat to the downside given the political and economic uncertainties related to Brexit. Businesses would therefore be well advised to make appropriate contingency plans for such less favourable outcomes, but without losing sight of the more positive possibilities for the UK economy should these downside risks not materialise.
14 UK Economic Outlook July 2017
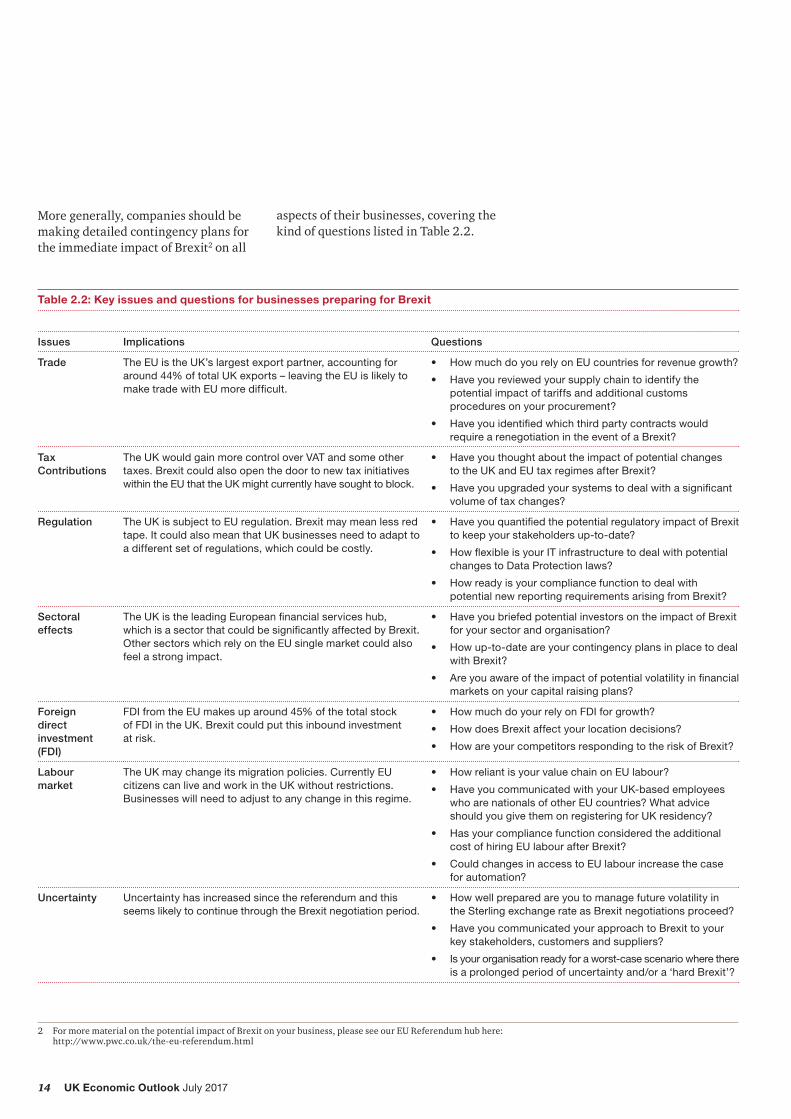
More generally, companies should be making detailed contingency plans for the immediate impact of Brexit2 on all
Table 2.2: Key issues and questions for businesses preparing for Brexit
Issues Implications Questions
Trade The EU is the UK’s largest export partner, accounting for around 44% of total UK exports – leaving the EU is likely to make trade with EU more difficult.
• How much do you rely on EU countries for revenue growth?
• Have you reviewed your supply chain to identify the potential impact of tariffs and additional customs procedures on your procurement?
• Have you identified which third party contracts would require a renegotiation in the event of a Brexit?
Tax Contributions
The UK would gain more control over VAT and some other taxes. Brexit could also open the door to new tax initiatives within the EU that the UK might currently have sought to block.
• Have you thought about the impact of potential changes to the UK and EU tax regimes after Brexit?
• Have you upgraded your systems to deal with a significant volume of tax changes?
Regulation The UK is subject to EU regulation. Brexit may mean less red tape. It could also mean that UK businesses need to adapt to a different set of regulations, which could be costly.
• Have you quantified the potential regulatory impact of Brexit to keep your stakeholders up-to-date?
• How flexible is your IT infrastructure to deal with potential changes to Data Protection laws?
• How ready is your compliance function to deal with potential new reporting requirements arising from Brexit?
Sectoral effects
The UK is the leading European financial services hub, which is a sector that could be significantly affected by Brexit. Other sectors which rely on the EU single market could also feel a strong impact.
• Have you briefed potential investors on the impact of Brexit for your sector and organisation?
• How up-to-date are your contingency plans in place to deal with Brexit?
• Are you aware of the impact of potential volatility in financial markets on your capital raising plans?
Foreign direct investment (FDI)
FDI from the EU makes up around 45% of the total stock of FDI in the UK. Brexit could put this inbound investment at risk.
• How much do your rely on FDI for growth?
• How does Brexit affect your location decisions?
• How are your competitors responding to the risk of Brexit?
Labour market
The UK may change its migration policies. Currently EU citizens can live and work in the UK without restrictions. Businesses will need to adjust to any change in this regime.
• How reliant is your value chain on EU labour?
• Have you communicated with your UK-based employees who are nationals of other EU countries? What advice should you give them on registering for UK residency?
• Has your compliance function considered the additional cost of hiring EU labour after Brexit?
• Could changes in access to EU labour increase the case for automation?
Uncertainty Uncertainty has increased since the referendum and this seems likely to continue through the Brexit negotiation period.
• How well prepared are you to manage future volatility in the Sterling exchange rate as Brexit negotiations proceed?
• Have you communicated your approach to Brexit to your key stakeholders, customers and suppliers?
• Is your organisation ready for a worst-case scenario where there is a prolonged period of uncertainty and/or a ‘hard Brexit’?
aspects of their businesses, covering the kind of questions listed in Table 2.2.
2 For more material on the potential impact of Brexit on your business, please see our EU Referendum hub here: http://www.pwc.co.uk/the-eu-referendum.html
15UK Economic Outlook July 2017
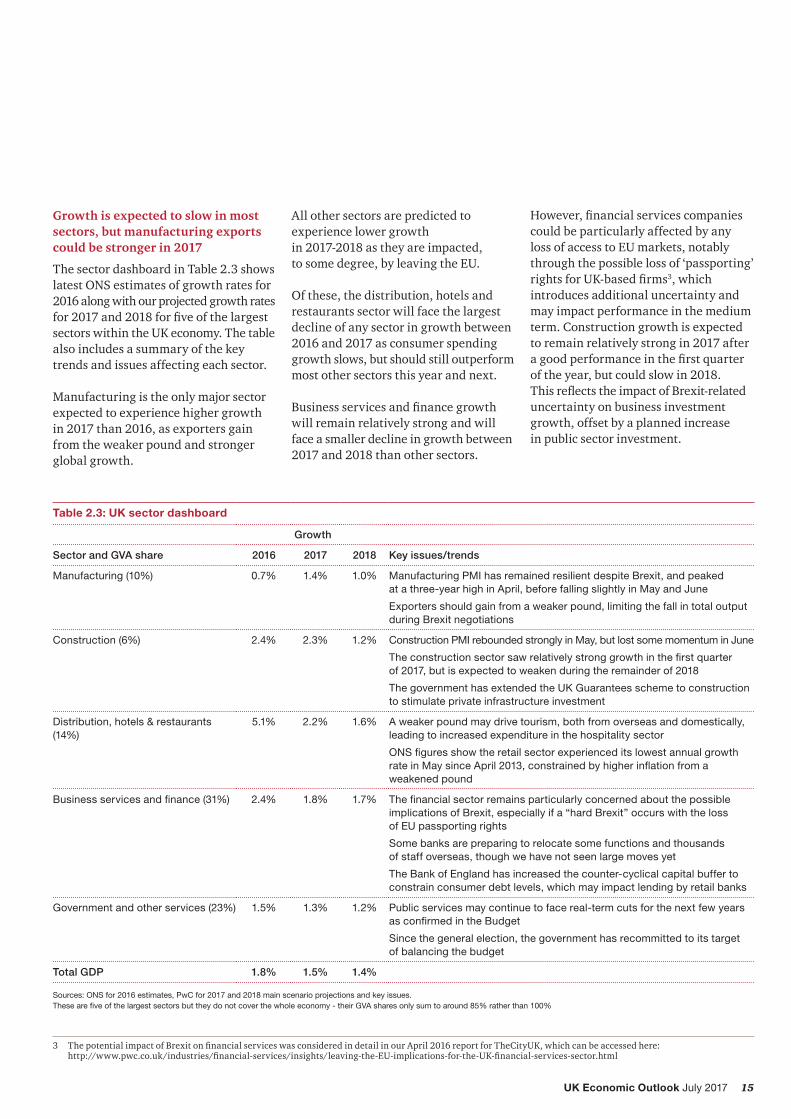
Growth is expected to slow in most sectors, but manufacturing exports could be stronger in 2017
The sector dashboard in Table 2.3 shows latest ONS estimates of growth rates for 2016 along with our projected growth rates for2017and2018forfiveofthelargestsectors within the UK economy. The table also includes a summary of the key trends and issues affecting each sector.
Manufacturing is the only major sector expected to experience higher growth in 2017 than 2016, as exporters gain from the weaker pound and stronger global growth.
All other sectors are predicted to experience lower growth in 2017-2018 as they are impacted, to some degree, by leaving the EU.
Of these, the distribution, hotels and restaurants sector will face the largest decline of any sector in growth between 2016 and 2017 as consumer spending growth slows, but should still outperform most other sectors this year and next.
Businessservicesandfinancegrowthwill remain relatively strong and will face a smaller decline in growth between 2017 and 2018 than other sectors.
However,financialservicescompaniescould be particularly affected by any loss of access to EU markets, notably through the possible loss of ‘passporting’ rightsforUK-basedfirms3, which introduces additional uncertainty and may impact performance in the medium term. Construction growth is expected to remain relatively strong in 2017 after agoodperformanceinthefirstquarterof the year, but could slow in 2018. ThisreflectstheimpactofBrexit-relateduncertainty on business investment growth, offset by a planned increase in public sector investment.
Table 2.3: UK sector dashboard
Growth
Sector and GVA share 2016 2017 2018 Key issues/trends
Manufacturing (10%) 0.7% 1.4% 1.0% Manufacturing PMI has remained resilient despite Brexit, and peaked at a three-year high in April, before falling slightly in May and June
Exporters should gain from a weaker pound, limiting the fall in total output during Brexit negotiations
Construction (6%) 2.4% 2.3% 1.2% Construction PMI rebounded strongly in May, but lost some momentum in June
The construction sector saw relatively strong growth in the first quarter of 2017, but is expected to weaken during the remainder of 2018
The government has extended the UK Guarantees scheme to construction to stimulate private infrastructure investment
Distribution, hotels & restaurants (14%)
5.1% 2.2% 1.6% A weaker pound may drive tourism, both from overseas and domestically, leading to increased expenditure in the hospitality sector
ONS figures show the retail sector experienced its lowest annual growth rate in May since April 2013, constrained by higher inflation from a weakened pound
Business services and finance (31%) 2.4% 1.8% 1.7% The financial sector remains particularly concerned about the possible implications of Brexit, especially if a “hard Brexit” occurs with the loss of EU passporting rights
Some banks are preparing to relocate some functions and thousands of staff overseas, though we have not seen large moves yet
The Bank of England has increased the counter-cyclical capital buffer to constrain consumer debt levels, which may impact lending by retail banks
Government and other services (23%) 1.5% 1.3% 1.2% Public services may continue to face real-term cuts for the next few years as confirmed in the Budget
Since the general election, the government has recommitted to its target of balancing the budget
Total GDP 1.8% 1.5% 1.4%
Sources: ONS for 2016 estimates, PwC for 2017 and 2018 main scenario projections and key issues. These are five of the largest sectors but they do not cover the whole economy - their GVA shares only sum to around 85% rather than 100%
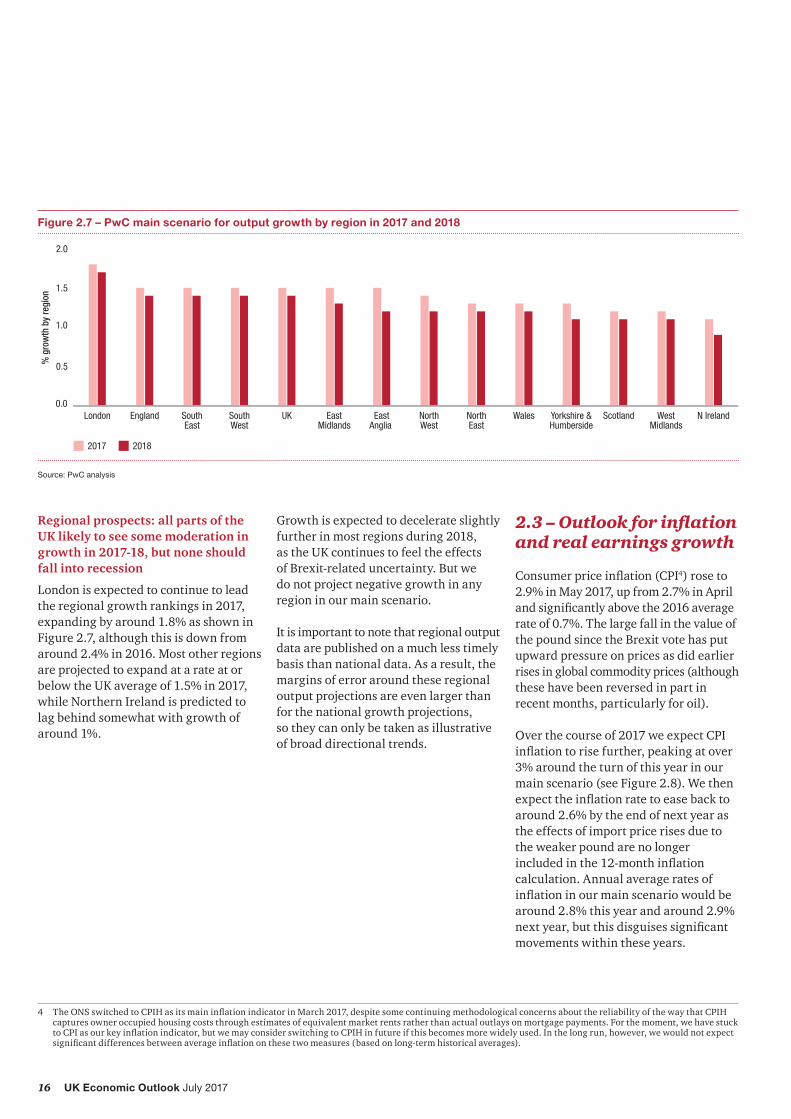
Figure 2.7 – PwC main scenario for output growth by region in 2017 and 2018
0.0
0.5
1.0
1.5
2.0
N IrelandWestMidlands
ScotlandYorkshire &Humberside
WalesNorthEast
NorthWest
EastAnglia
EastMidlands
UKSouthWest
SouthEast
EnglandLondon
% g
row
th b
y re
gion
2017 2018
Source: PwC analysis
Regional prospects: all parts of the UK likely to see some moderation in growth in 2017-18, but none should fall into recession
London is expected to continue to lead the regional growth rankings in 2017, expanding by around 1.8% as shown in Figure 2.7, although this is down from around 2.4% in 2016. Most other regions are projected to expand at a rate at or below the UK average of 1.5% in 2017, while Northern Ireland is predicted to lag behind somewhat with growth of around 1%.
2.3 – Outlook for inflation and real earnings growth
Consumerpriceinflation(CPI4) rose to 2.9% in May 2017, up from 2.7% in April andsignificantlyabovethe2016averagerate of 0.7%. The large fall in the value of the pound since the Brexit vote has put upward pressure on prices as did earlier rises in global commodity prices (although these have been reversed in part in recent months, particularly for oil).
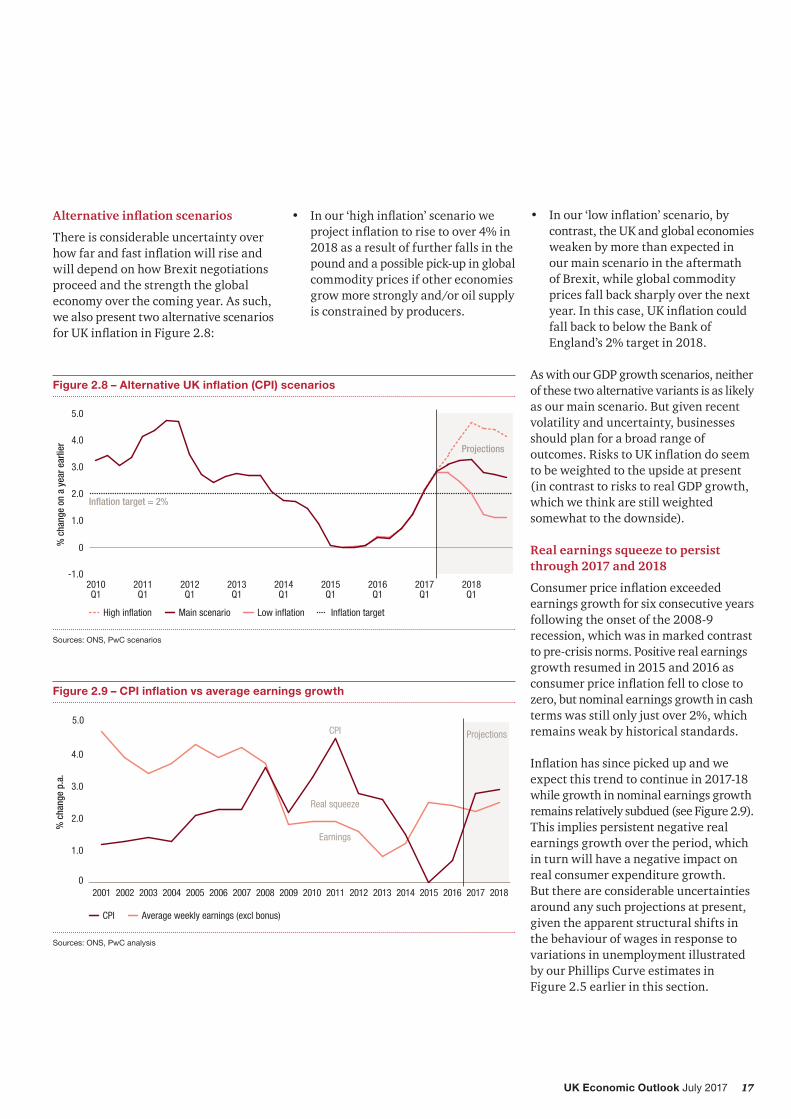
Over the course of 2017 we expect CPI inflationtorisefurther,peakingatover3% around the turn of this year in our main scenario (see Figure 2.8). We then expecttheinflationratetoeasebacktoaround 2.6% by the end of next year as the effects of import price rises due to the weaker pound are no longer includedinthe12-monthinflationcalculation. Annual average rates of inflationinourmainscenariowouldbearound 2.8% this year and around 2.9% nextyear,butthisdisguisessignificantmovements within these years.
Growth is expected to decelerate slightly further in most regions during 2018, as the UK continues to feel the effects of Brexit-related uncertainty. But we do not project negative growth in any region in our main scenario.
It is important to note that regional output data are published on a much less timely basis than national data. As a result, the margins of error around these regional output projections are even larger than for the national growth projections, so they can only be taken as illustrative of broad directional trends.
4 TheONSswitchedtoCPIHasitsmaininflationindicatorinMarch2017,despitesomecontinuingmethodologicalconcernsaboutthereliabilityofthewaythatCPIHcaptures owner occupied housing costs through estimates of equivalent market rents rather than actual outlays on mortgage payments. For the moment, we have stuck toCPIasourkeyinflationindicator,butwemayconsiderswitchingtoCPIHinfutureifthisbecomesmorewidelyused.Inthelongrun,however,wewouldnotexpectsignificantdifferencesbetweenaverageinflationonthesetwomeasures(basedonlong-termhistoricalaverages).
17UK Economic Outlook July 2017
Figure 2.8 – Alternative UK inflation (CPI) scenarios
Sources: ONS, PwC scenarios
Projections
-1.0
0
1.0
2.0
3.0
4.0
5.0
2018Q1
2017Q1
2016Q1
2015Q1
2014Q1
2013Q1
2012Q1
2011Q1
2010Q1
% c
hang
e on
a y
ear e
arlie
r
Main scenario Low inflationHigh inflation
Inflation target = 2%
Inflation target
Figure 2.9 – CPI inflation vs average earnings growth
There is considerable uncertainty over howfarandfastinflationwillriseandwill depend on how Brexit negotiations proceed and the strength the global economy over the coming year. As such, we also present two alternative scenarios forUKinflationinFigure2.8:
• Inour‘highinflation’scenarioweprojectinflationtorisetoover4%in2018 as a result of further falls in the pound and a possible pick-up in global commodity prices if other economies grow more strongly and/or oil supply is constrained by producers.
• Inour‘lowinflation’scenario,bycontrast, the UK and global economies weaken by more than expected in our main scenario in the aftermath of Brexit, while global commodity prices fall back sharply over the next year.Inthiscase,UKinflationcouldfall back to below the Bank of England’s 2% target in 2018.
As with our GDP growth scenarios, neither of these two alternative variants is as likely as our main scenario. But given recent volatility and uncertainty, businesses should plan for a broad range of outcomes.RiskstoUKinflationdoseemto be weighted to the upside at present (in contrast to risks to real GDP growth, which we think are still weighted somewhat to the downside).
Real earnings squeeze to persist through 2017 and 2018
Consumerpriceinflationexceededearnings growth for six consecutive years following the onset of the 2008-9 recession, which was in marked contrast to pre-crisis norms. Positive real earnings growth resumed in 2015 and 2016 as consumerpriceinflationfelltoclosetozero, but nominal earnings growth in cash terms was still only just over 2%, which remains weak by historical standards.
Inflationhassincepickedupandweexpect this trend to continue in 2017-18 while growth in nominal earnings growth remains relatively subdued (see Figure 2.9). This implies persistent negative real earnings growth over the period, which in turn will have a negative impact on real consumer expenditure growth. But there are considerable uncertainties around any such projections at present, given the apparent structural shifts in the behaviour of wages in response to variations in unemployment illustrated by our Phillips Curve estimates in Figure 2.5 earlier in this section.
18 UK Economic Outlook July 2017
2.4 – Monetary and fiscal policy options
The Monetary Policy Committee (MPC) voted at its meeting in June to maintain the monetary policy stance introduced last August after the Brexit result, holding interest rates at 0.25%. But three members voted to raise rates and subsequent speeches by MPC members point to an active debate on the MPC in coming meetings as to when it is appropriate to start to normalise policy as the US Fed has been doing for some time.
At present, we would expect the majority of the MPC to want to wait for longer to see how the Brexit negotiations go and how this affects UK growth. But with inflationsettoriseabove3%laterthisyear, the case for a rate rise has clearly become stronger and we are assuming a modest increase during the course of 2018 in our main scenario.
While monetary policy may gradually tighten over the next 18 months, the Chancellorhascomeundersignificantpolitical pressure to further ease austerity. A range of areas including health and social care, schools, police, social housing and public pay have emerged as priorities for additional spending following the election result. But we would expect the Chancellor to defer major decisions on recalibrating tax and spending policy until his Autumn Budget, when he can look at these issues in the round with thebenefitofanupdatedOBReconomicandfiscalforecast.
2.5 – Summary and conclusions
The UK economy grew by 2% in the 12monthstothefirstquarterof2017,but the quarterly rate slowed to 0.2%, weighed down by slowing consumer expenditure and a weaker services sector.
In our main scenario, we project UK growth to slow gradually from around from 1.8% in 2016 to around 1.5% in 2017 and 1.4% in 2018. The slowdown will be felt across most major industry sectors, although manufacturing exports may receive a short-term boost from the depreciation of the pound and stronger Eurozone growth. London will see growth slow, but could remain the fastest growing UK region as other areas of the country will also see some easing of growth in 2017-18 compared to recent years.
The slowdown in UK growth is projected to be primarily a result of a slowdown in consumer expenditure, with real spending power squeezed as consumer priceinflationincreasesfasterthanearnings growth. This continued stagnant wage growth, combined with low unemployment, suggests a breakdown of the traditional negative relationship described by the Phillips Curve.
Business investment growth is also expected to remain relatively subdued in 2017-18, driven by continued uncertainty surrounding the negotiations to leave the EU, although this will be partly offset by stronger public investment.
There are considerable uncertainties around any such projections at present, however, so businesses should stress test their business and investment plans against alternative economic scenarios and also review the potential wider implications of Brexit for all aspects of their operations.
19UK Economic Outlook July 2017
3 – UK Housing market outlook
Key points• House prices in the UK were not
impacted by the UK’s decision to leave the EU as quickly as expected, though price growth stalled in the second half of 2016 and is now showing signs of a slowdown. Transaction volumes appear to have suffered more, but these effects are compounded by other factors such as stamp duty reform.
• We anticipate that the rest of 2017 will see the slowdown in the housing market continue, yielding annual house price growth of around 3.7%, down from 7% in 2016. In our main scenario,housepriceinflationwillpick up slightly again in later years averaging around 4% until 2025. Wefindthathousebuildingatthelevel proposed by the government, although welcome, may only have a small effect in constraining house price rises in the short term.
• The London housing market has been most severely impacted by economic and policy uncertainty and the recent changestostampduty.PriceinflationinLondoninthefirstfourmonthsof2017 was around 4% compared with around 13% for the same period in 2016. We project that London’s housing market will continue to slow with only 2.8% and 3.8% house price growth on average in 2017 and 2018 respectively.
• Elsewhere in the UK, the East and Southern regions of England will continue to grow above the UK average, but Northern Ireland and the North East will continue to lag behind.
• There is a huge disparity in how sub-regional housing markets have performed since the recession. Whilst the average house price across the UK has grown by 17% since mid-2007, over a quarter of all local authorities are still ‘under water’. The region that has seen the greatest decline is Northern Ireland, where on average house prices are 44% below their pre-recession peak.
• There has also been a structural shift in London’s housing market recently, as house price growth has moved outward from the capital. Growing unaffordability within London, coupled with policy reform, has seen house price rises in prime central boroughs slow whilst price rises in the outer boroughs and the commuter belt have accelerated. Over the last two years, house prices in the outer boroughs have risen 9 percentage points faster than inner boroughs, whilst house price growth in the fastest growing cities within the commuter belt exceeded that in London by 4 percentage points in 2016.
IntroductionIn this section, we explore how the UK housing market has been performing recently and present our projections forhousepriceinflationuntil2025. We also present new analysis of regional and sub-regional trends in the market showing the shifting patterns of growth since the recession.
Thediscussionbelowbeginsbybrieflyreviewing recent housing market developments (Section 3.1) and then goes on to assess future UK and regional house price prospects in Section 3.2. Section 3.3 presents our new research into the development of sub-regional markets.
20 UK Economic Outlook July 2017
Figure 3.1 – Annual rate of house price inflation
Source: ONS
-20
-15
-10
-5
0
5
10
15
Jan2017
Jan2016
Jan 2015
Jan2014
Jan2013
Jan2012
Jan2011
Jan2010
Jan2009
Jan2008
Jan2007
Jan2006
Year-
on-ye
ar %
chan
ge
EU Referendum
Figure 3.2 – Cumulative house price inflation by year
Source: ONS
-2
0
2
4
6
8
10
DecNovOctSepAugJulJunMayAprMarFebJan
20152014 2016 2017
Cum
ulat
ive
perc
enta
ge g
row
thre
lativ
e to
pre
viou
s De
cem
ber
3.1 – Recent housing market developments
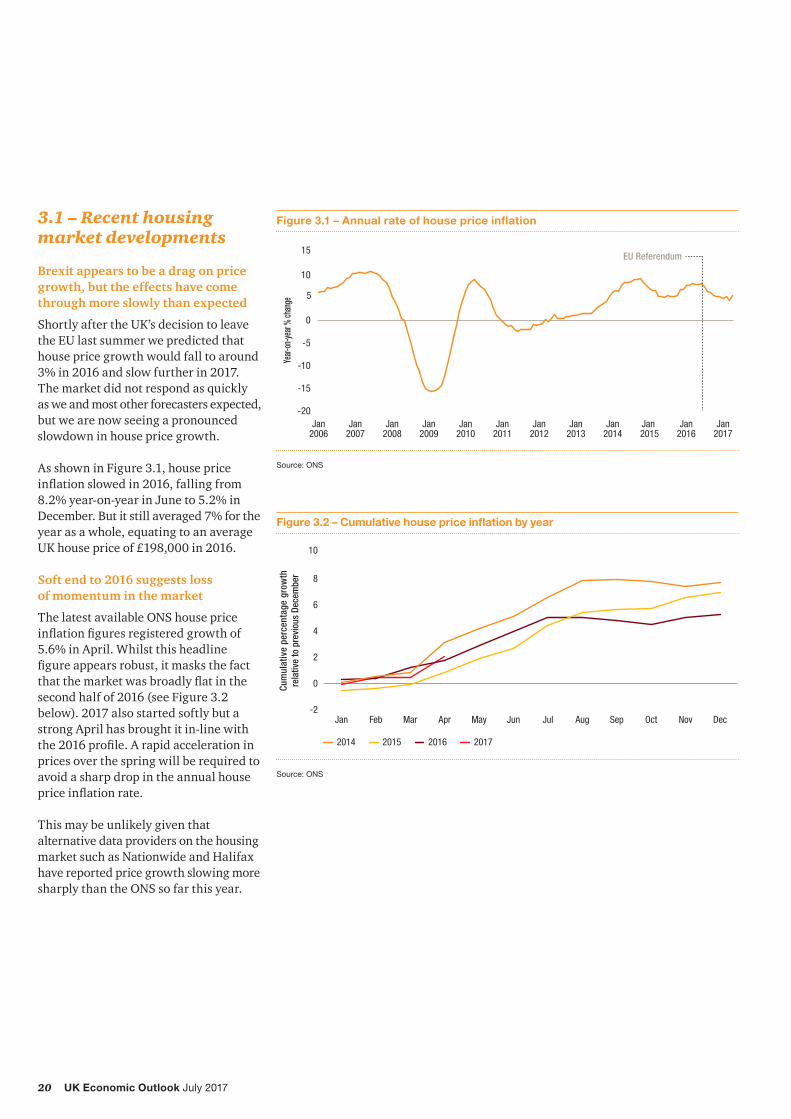
Brexit appears to be a drag on price growth, but the effects have come through more slowly than expected
Shortly after the UK’s decision to leave the EU last summer we predicted that house price growth would fall to around 3% in 2016 and slow further in 2017. The market did not respond as quickly as we and most other forecasters expected, but we are now seeing a pronounced slowdown in house price growth.
As shown in Figure 3.1, house price inflationslowedin2016,fallingfrom8.2% year-on-year in June to 5.2% in December. But it still averaged 7% for the year as a whole, equating to an average UK house price of £198,000 in 2016.
Soft end to 2016 suggests loss of momentum in the market
The latest available ONS house price inflationfiguresregisteredgrowthof5.6% in April. Whilst this headline figureappearsrobust,itmasksthefactthatthemarketwasbroadlyflatinthesecond half of 2016 (see Figure 3.2 below). 2017 also started softly but a strong April has brought it in-line with the2016profile.Arapidaccelerationinprices over the spring will be required to avoid a sharp drop in the annual house priceinflationrate.
This may be unlikely given that alternative data providers on the housing market such as Nationwide and Halifax have reported price growth slowing more sharply than the ONS so far this year.
21UK Economic Outlook July 2017
Figure 3.3 – Annual growth in UK housing transactions
Source:
-80
-60
-40
-20
0
20
40
60
80
100
Jan2017
Jan2016
Jan2015
Jan2014
Jan2013
Jan2012
Jan2011
Jan2010
Jan2009
Jan2008
Jan2007
Jan2006
Stamp duty reform effectiveEU Referendum
Year-
on-ye
ar %
chan
ge
Housing transactions are declining
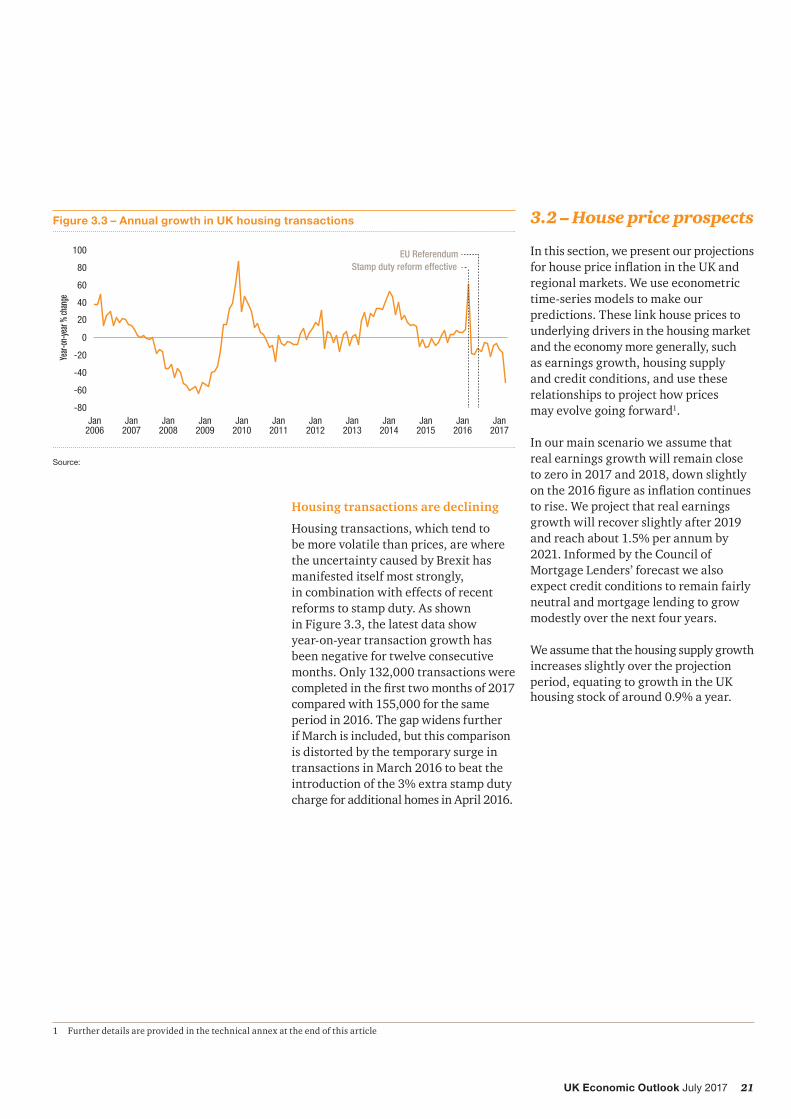
Housing transactions, which tend to be more volatile than prices, are where the uncertainty caused by Brexit has manifested itself most strongly, in combination with effects of recent reforms to stamp duty. As shown in Figure 3.3, the latest data show year-on-year transaction growth has been negative for twelve consecutive months. Only 132,000 transactions were completedinthefirsttwomonthsof2017compared with 155,000 for the same period in 2016. The gap widens further if March is included, but this comparison is distorted by the temporary surge in transactions in March 2016 to beat the introduction of the 3% extra stamp duty charge for additional homes in April 2016.
1 Further details are provided in the technical annex at the end of this article
3.2 – House price prospects
In this section, we present our projections forhousepriceinflationintheUKandregional markets. We use econometric time-series models to make our predictions. These link house prices to underlying drivers in the housing market and the economy more generally, such as earnings growth, housing supply and credit conditions, and use these relationships to project how prices may evolve going forward1.
In our main scenario we assume that real earnings growth will remain close to zero in 2017 and 2018, down slightly onthe2016figureasinflationcontinuesto rise. We project that real earnings growth will recover slightly after 2019 and reach about 1.5% per annum by 2021. Informed by the Council of Mortgage Lenders’ forecast we also expect credit conditions to remain fairly neutral and mortgage lending to grow modestly over the next four years.
We assume that the housing supply growth increases slightly over the projection period, equating to growth in the UK housing stock of around 0.9% a year.
22 UK Economic Outlook July 2017
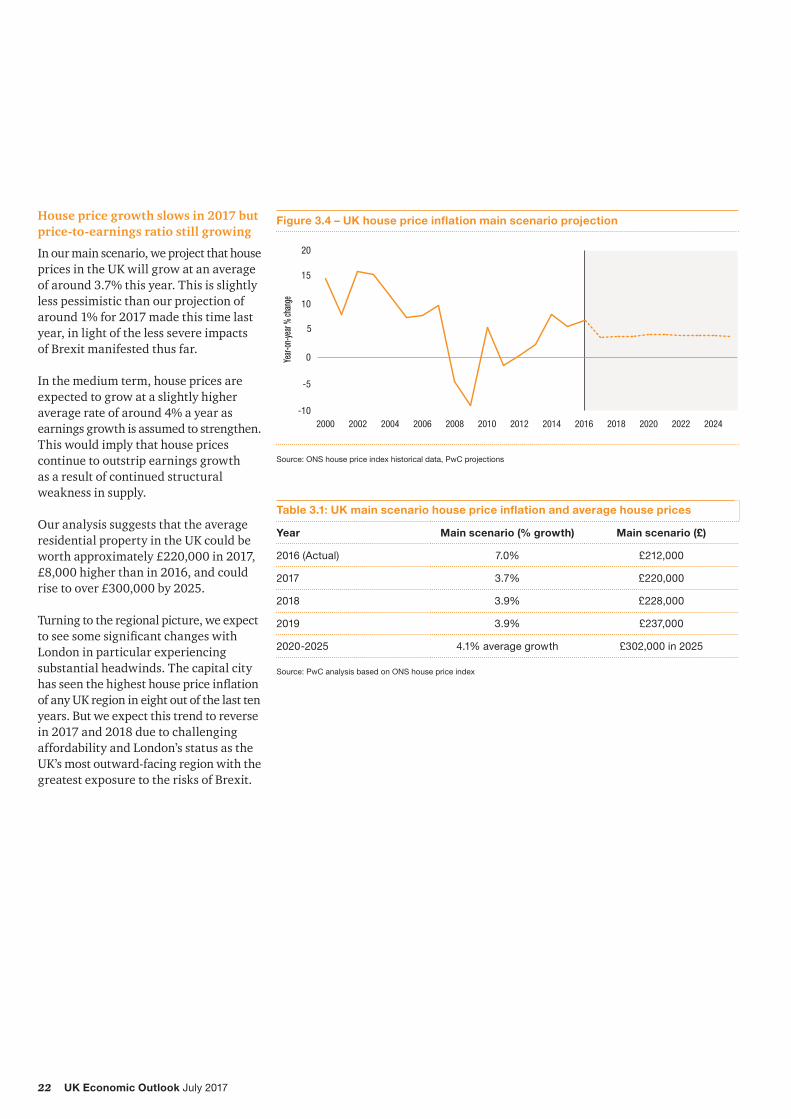
House price growth slows in 2017 but price-to-earnings ratio still growing
In our main scenario, we project that house prices in the UK will grow at an average of around 3.7% this year. This is slightly less pessimistic than our projection of around 1% for 2017 made this time last year, in light of the less severe impacts of Brexit manifested thus far.
In the medium term, house prices are expected to grow at a slightly higher average rate of around 4% a year as earnings growth is assumed to strengthen. This would imply that house prices continue to outstrip earnings growth as a result of continued structural weakness in supply.
Our analysis suggests that the average residential property in the UK could be worth approximately £220,000 in 2017, £8,000 higher than in 2016, and could rise to over £300,000 by 2025.
Turning to the regional picture, we expect toseesomesignificantchangeswithLondon in particular experiencing substantial headwinds. The capital city hasseenthehighesthousepriceinflationof any UK region in eight out of the last ten years. But we expect this trend to reverse in 2017 and 2018 due to challenging affordability and London’s status as the UK’s most outward-facing region with the greatest exposure to the risks of Brexit.
Figure 3.4 – UK house price inflation main scenario projection
Source: ONS house price index historical data, PwC projections
Table 3.1: UK main scenario house price inflation and average house prices
Year Main scenario (% growth) Main scenario (£)
2016 (Actual) 7.0% £212,000
2017 3.7% £220,000
2018 3.9% £228,000
2019 3.9% £237,000
2020-2025 4.1% average growth £302,000 in 2025
Source: PwC analysis based on ONS house price index
23UK Economic Outlook July 2017
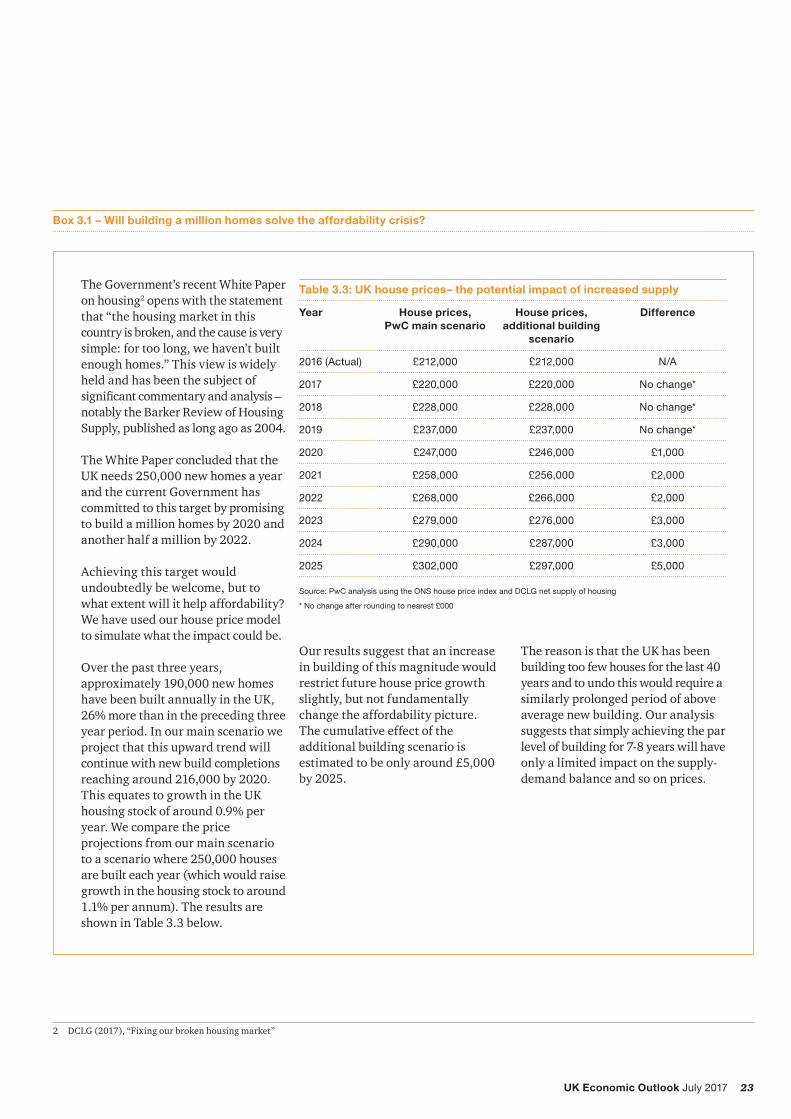
Box 3.1 – Will building a million homes solve the affordability crisis?
The Government’s recent White Paper on housing2 opens with the statement that “the housing market in this country is broken, and the cause is very simple: for too long, we haven’t built enough homes.” This view is widely held and has been the subject of significantcommentaryandanalysis–notably the Barker Review of Housing Supply, published as long ago as 2004.
The White Paper concluded that the UK needs 250,000 new homes a year and the current Government has committed to this target by promising to build a million homes by 2020 and another half a million by 2022.
Achieving this target would undoubtedly be welcome, but to what extent will it help affordability? We have used our house price model to simulate what the impact could be.
Over the past three years, approximately 190,000 new homes have been built annually in the UK, 26% more than in the preceding three year period. In our main scenario we project that this upward trend will continue with new build completions reaching around 216,000 by 2020. This equates to growth in the UK housing stock of around 0.9% per year. We compare the price projections from our main scenario to a scenario where 250,000 houses are built each year (which would raise growth in the housing stock to around 1.1% per annum). The results are shown in Table 3.3 below.
Our results suggest that an increase in building of this magnitude would restrict future house price growth slightly, but not fundamentally change the affordability picture. The cumulative effect of the additional building scenario is estimated to be only around £5,000 by 2025.
The reason is that the UK has been building too few houses for the last 40 years and to undo this would require a similarly prolonged period of above average new building. Our analysis suggests that simply achieving the par level of building for 7-8 years will have only a limited impact on the supply-demand balance and so on prices.
2 DCLG (2017), “Fixing our broken housing market”
Table 3.3: UK house prices– the potential impact of increased supply
Year House prices, PwC main scenario
House prices, additional building
scenario
Difference
2016 (Actual) £212,000 £212,000 N/A
2017 £220,000 £220,000 No change*
2018 £228,000 £228,000 No change*
2019 £237,000 £237,000 No change*
2020 £247,000 £246,000 £1,000
2021 £258,000 £256,000 £2,000
2022 £268,000 £266,000 £2,000
2023 £279,000 £276,000 £3,000
2024 £290,000 £287,000 £3,000
2025 £302,000 £297,000 £5,000
Source: PwC analysis using the ONS house price index and DCLG net supply of housing
* No change after rounding to nearest £000
24 UK Economic Outlook July 2017
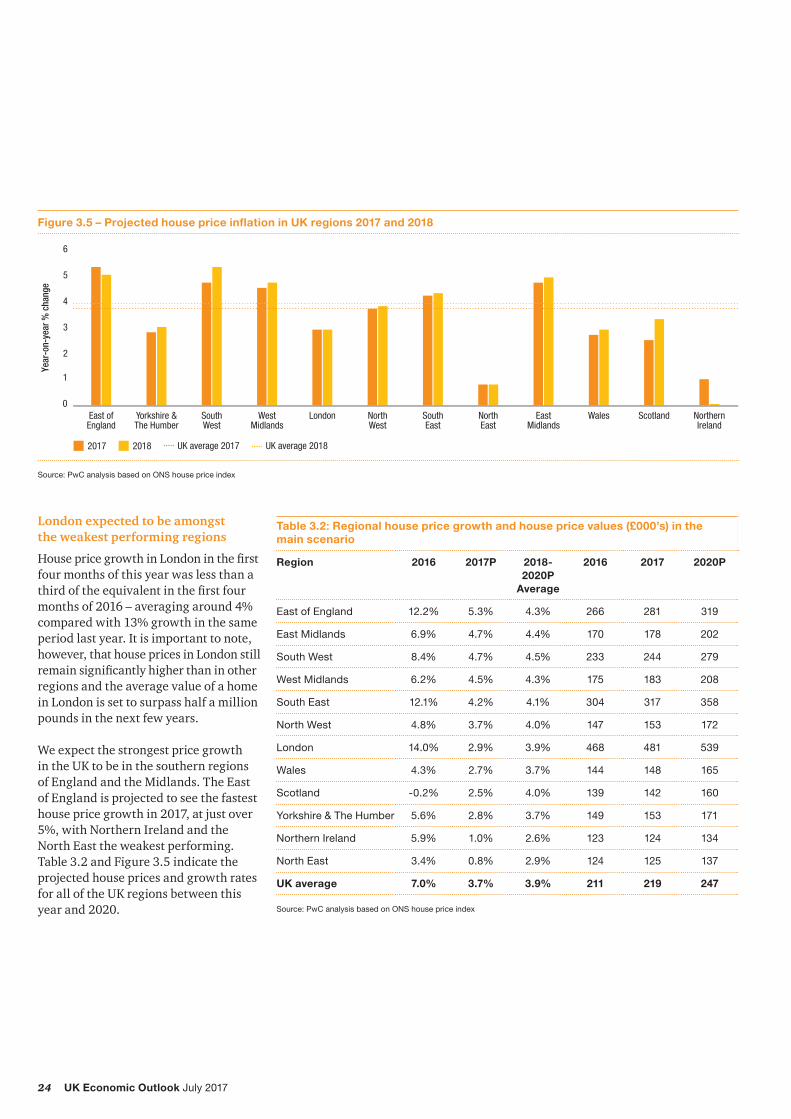
London expected to be amongst the weakest performing regions
HousepricegrowthinLondoninthefirstfour months of this year was less than a thirdoftheequivalentinthefirstfourmonths of 2016 – averaging around 4% compared with 13% growth in the same period last year. It is important to note, however, that house prices in London still remainsignificantlyhigherthaninotherregions and the average value of a home in London is set to surpass half a million pounds in the next few years.
We expect the strongest price growth in the UK to be in the southern regions of England and the Midlands. The East of England is projected to see the fastest house price growth in 2017, at just over 5%, with Northern Ireland and the North East the weakest performing. Table 3.2 and Figure 3.5 indicate the projected house prices and growth rates for all of the UK regions between this year and 2020.
Figure 3.5 – Projected house price inflation in UK regions 2017 and 2018
0
1
2
3
4
5
6
NorthernIreland
ScotlandWalesEastMidlands
NorthEast
SouthEast
NorthWest
LondonWestMidlands
SouthWest
Yorkshire &The Humber
East ofEngland
Year
-on-
year
% c
hang
e
2017 2018 UK average 2017 UK average 2018
Source: PwC analysis based on ONS house price index
Table 3.2: Regional house price growth and house price values (£000’s) in the main scenario
Region 2016 2017P 2018-2020P
Average
2016 2017 2020P
East of England 12.2% 5.3% 4.3% 266 281 319
East Midlands 6.9% 4.7% 4.4% 170 178 202
South West 8.4% 4.7% 4.5% 233 244 279
West Midlands 6.2% 4.5% 4.3% 175 183 208
South East 12.1% 4.2% 4.1% 304 317 358
North West 4.8% 3.7% 4.0% 147 153 172
London 14.0% 2.9% 3.9% 468 481 539
Wales 4.3% 2.7% 3.7% 144 148 165
Scotland -0.2% 2.5% 4.0% 139 142 160
Yorkshire & The Humber 5.6% 2.8% 3.7% 149 153 171
Northern Ireland 5.9% 1.0% 2.6% 123 124 134
North East 3.4% 0.8% 2.9% 124 125 137
UK average 7.0% 3.7% 3.9% 211 219 247
Source: PwC analysis based on ONS house price index
25UK Economic Outlook July 2017
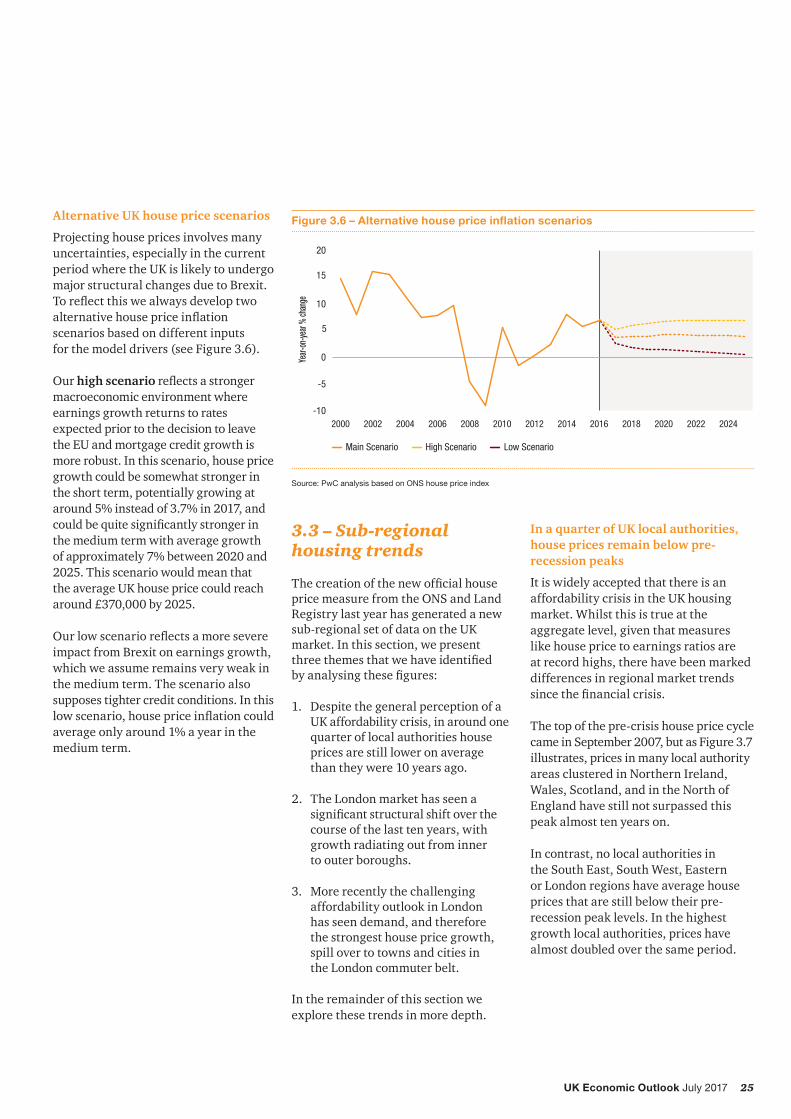
Alternative UK house price scenarios
Projecting house prices involves many uncertainties, especially in the current period where the UK is likely to undergo major structural changes due to Brexit. Toreflectthiswealwaysdeveloptwoalternativehousepriceinflationscenarios based on different inputs for the model drivers (see Figure 3.6).
Our high scenarioreflectsastrongermacroeconomic environment where earnings growth returns to rates expected prior to the decision to leave the EU and mortgage credit growth is more robust. In this scenario, house price growth could be somewhat stronger in the short term, potentially growing at around 5% instead of 3.7% in 2017, and couldbequitesignificantlystrongerinthe medium term with average growth of approximately 7% between 2020 and 2025. This scenario would mean that the average UK house price could reach around £370,000 by 2025.
Ourlowscenarioreflectsamoresevereimpact from Brexit on earnings growth, which we assume remains very weak in the medium term. The scenario also supposes tighter credit conditions. In this lowscenario,housepriceinflationcouldaverage only around 1% a year in the medium term.
Figure 3.6 – Alternative house price inflation scenarios
Source: PwC analysis based on ONS house price index
Thecreationofthenewofficialhouseprice measure from the ONS and Land Registry last year has generated a new sub-regional set of data on the UK market. In this section, we present threethemesthatwehaveidentified byanalysingthesefigures:
1. Despite the general perception of a UK affordability crisis, in around one quarter of local authorities house prices are still lower on average than they were 10 years ago.
2. The London market has seen a significantstructuralshiftoverthecourse of the last ten years, with growth radiating out from inner to outer boroughs.
3. More recently the challenging affordability outlook in London has seen demand, and therefore the strongest house price growth, spill over to towns and cities in the London commuter belt.
In the remainder of this section we explore these trends in more depth.
In a quarter of UK local authorities, house prices remain below pre-recession peaks
It is widely accepted that there is an affordability crisis in the UK housing market. Whilst this is true at the aggregate level, given that measures like house price to earnings ratios are at record highs, there have been marked differences in regional market trends sincethefinancialcrisis.
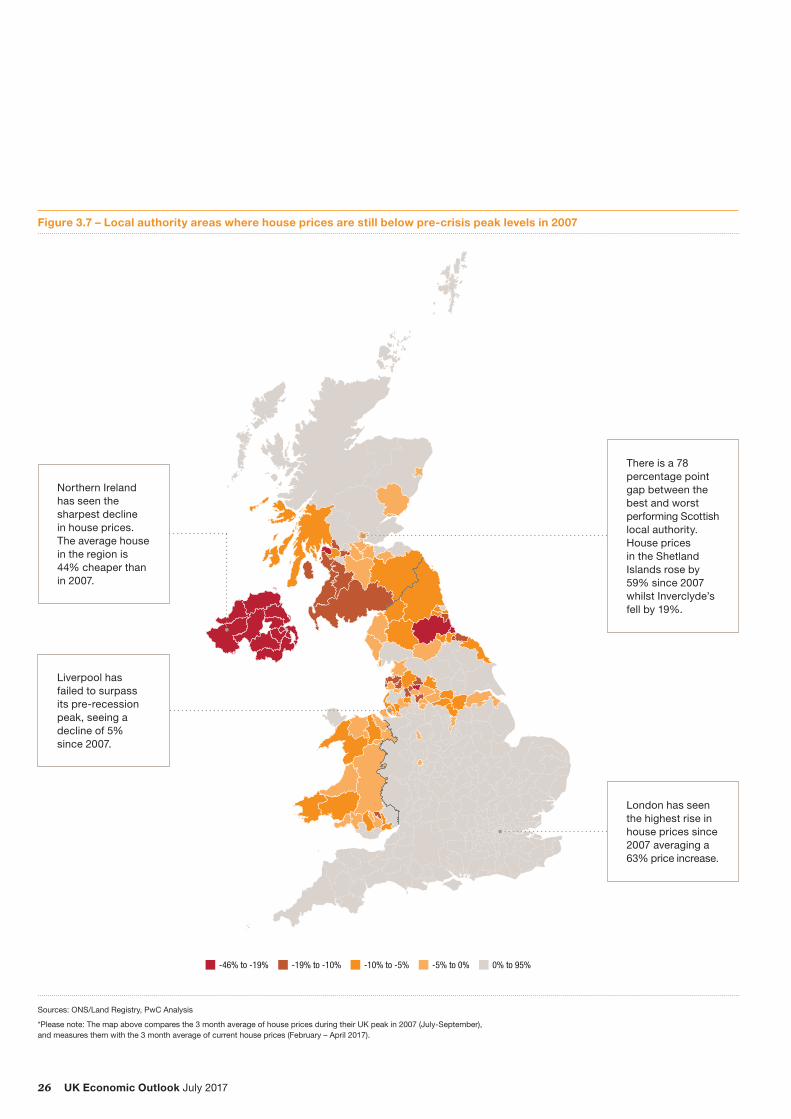
The top of the pre-crisis house price cycle came in September 2007, but as Figure 3.7 illustrates, prices in many local authority areas clustered in Northern Ireland, Wales, Scotland, and in the North of England have still not surpassed this peak almost ten years on.
In contrast, no local authorities in the South East, South West, Eastern or London regions have average house prices that are still below their pre-recession peak levels. In the highest growth local authorities, prices have almost doubled over the same period.
26 UK Economic Outlook July 2017
Figure 3.7 – Local authority areas where house prices are still below pre-crisis peak levels in 2007
Sources: ONS/Land Registry, PwC Analysis
*Please note: The map above compares the 3 month average of house prices during their UK peak in 2007 (July-September), and measures them with the 3 month average of current house prices (February – April 2017).
-46% to -19% -19% to -10% -10% to -5% -5% to 0% 0% to 95%
There is a 78 percentage point gap between the best and worst performing Scottish local authority. House prices in the Shetland Islands rose by 59% since 2007 whilst Inverclyde’s fell by 19%.
Northern Ireland has seen the sharpest decline in house prices. The average house in the region is 44% cheaper than in 2007.
Liverpool has failed to surpass its pre-recession peak, seeing a decline of 5% since 2007.
London has seen the highest rise in house prices since 2007 averaging a 63% price increase.
27UK Economic Outlook July 2017
Northern Ireland has experienced the greatest house price declines
The local authorities that have experienced the greatest falls in house prices since 2007 are all based in Northern Ireland. Part of this is due to the Irish property bubble, which spilled north of the border, stoking unsustainable house price gains of 78% between 2005 and 2007 in Northern Ireland. When the crash came it was far more severe there than in any other part of the UK. Prices still remain far below their 2007 peak: the largest gap is found in Armagh Banbridge and Craigavon, where prices remain 47% below peak levels.
The weakest house price performance beyond Northern Ireland has been in the North of England (see Table 3.4). Hartlepool has experienced the greatest price decline of any English authority (-21%), while Inverclyde has seen the largest price decline in Scotland (-19%).
These trends have boosted affordability forfirsttimebuyersintheseareasinparticular. In Blackpool, for example, the average house price to earnings ratio has fallen from 6.2 in 2008 to 4.9 in 2016. County Durham has seen a decline in this ratio from 5.1 in 2008 to 4.4 in 2016. This is in contrast to England as a whole, where the house price to earnings ratio has risen from 6.9 in 2008 to 7.7 in 2016.
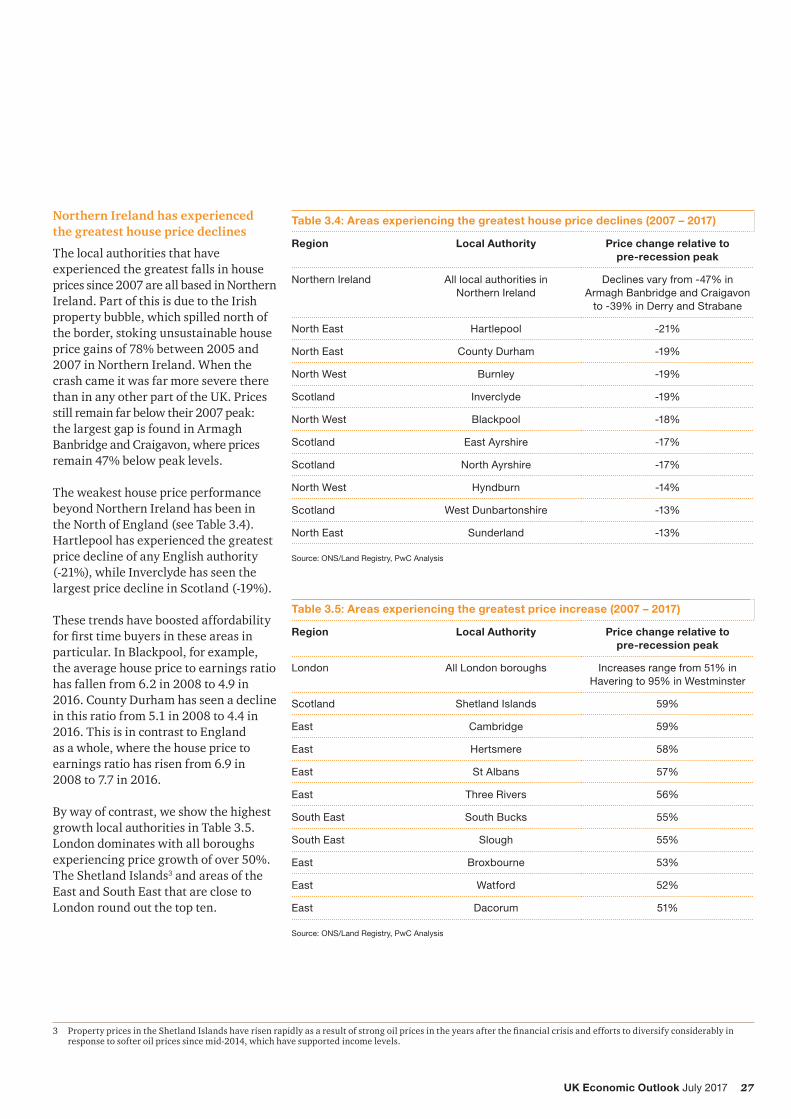
By way of contrast, we show the highest growth local authorities in Table 3.5. London dominates with all boroughs experiencing price growth of over 50%. The Shetland Islands3 and areas of the East and South East that are close to London round out the top ten.
Table 3.4: Areas experiencing the greatest house price declines (2007 – 2017)
Region Local Authority Price change relative to pre-recession peak
Northern Ireland All local authorities in Northern Ireland
Declines vary from -47% in Armagh Banbridge and Craigavon
to -39% in Derry and Strabane
North East Hartlepool -21%
North East County Durham -19%
North West Burnley -19%
Scotland Inverclyde -19%
North West Blackpool -18%
Scotland East Ayrshire -17%
Scotland North Ayrshire -17%
North West Hyndburn -14%
Scotland West Dunbartonshire -13%
North East Sunderland -13%
Source: ONS/Land Registry, PwC Analysis
Table 3.5: Areas experiencing the greatest price increase (2007 – 2017)
Region Local Authority Price change relative to pre-recession peak
London All London boroughs Increases range from 51% in Havering to 95% in Westminster
Scotland Shetland Islands 59%
East Cambridge 59%
East Hertsmere 58%
East St Albans 57%
East Three Rivers 56%
South East South Bucks 55%
South East Slough 55%
East Broxbourne 53%
East Watford 52%
East Dacorum 51%
Source: ONS/Land Registry, PwC Analysis
3 PropertypricesintheShetlandIslandshaverisenrapidlyasaresultofstrongoilpricesintheyearsafterthefinancialcrisisandeffortstodiversifyconsiderablyinresponse to softer oil prices since mid-2014, which have supported income levels.
28 UK Economic Outlook July 2017
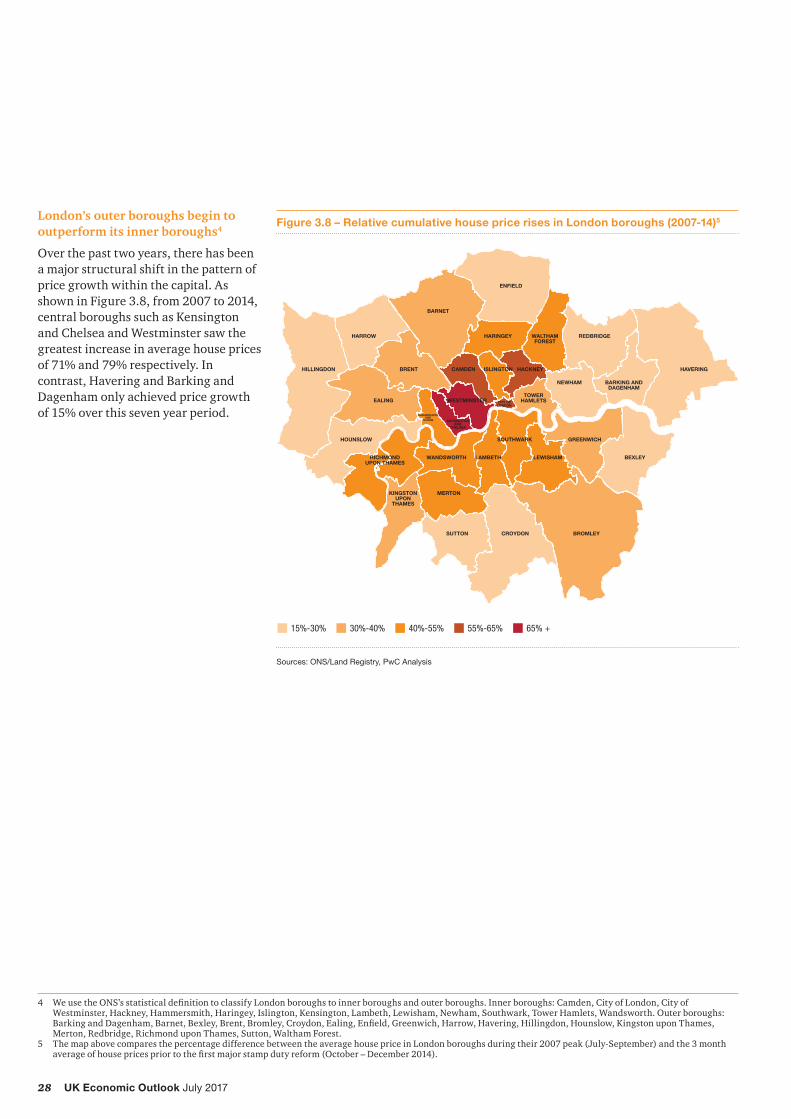
London’s outer boroughs begin to outperform its inner boroughs4
Over the past two years, there has been a major structural shift in the pattern of price growth within the capital. As shown in Figure 3.8, from 2007 to 2014, central boroughs such as Kensington and Chelsea and Westminster saw the greatest increase in average house prices of 71% and 79% respectively. In contrast, Havering and Barking and Dagenham only achieved price growth of 15% over this seven year period.
Figure 3.8 – Relative cumulative house price rises in London boroughs (2007-14)5
5 The map above compares the percentage difference between the average house price in London boroughs during their 2007 peak (July-September) and the 3 month averageofhousepricespriortothefirstmajorstampdutyreform(October–December2014).
29UK Economic Outlook July 2017
Figure 3.9 – Relative cumulative house price rises in London boroughs (2014-17)6
1%-7% 7%-12% 12%-18% 18%-24% 24% +
BROMLEYCROYDONSUTTON
KINGSTONUPON
THAMES
MERTON
RICHMONDUPON THAMES
WANDSWORTH LAMBETH LEWISHAM BEXLEY
GREENWICHSOUTHWARKHOUNSLOW
BRENT
HARROW
HILLINGDON
EALING WESTMINSTERTOWER
HAMLETS
NEWHAM BARKING ANDDAGENHAM
HAVERINGCAMDEN ISLINGTON HACKNEY
BARNET
ENFIELD
HARINGEY REDBRIDGEWALTHAMFOREST
CITY OFLONDON
KENSINGTON AND
CHELSEA
Sources: ONS/Land Registry, PwC Analysis
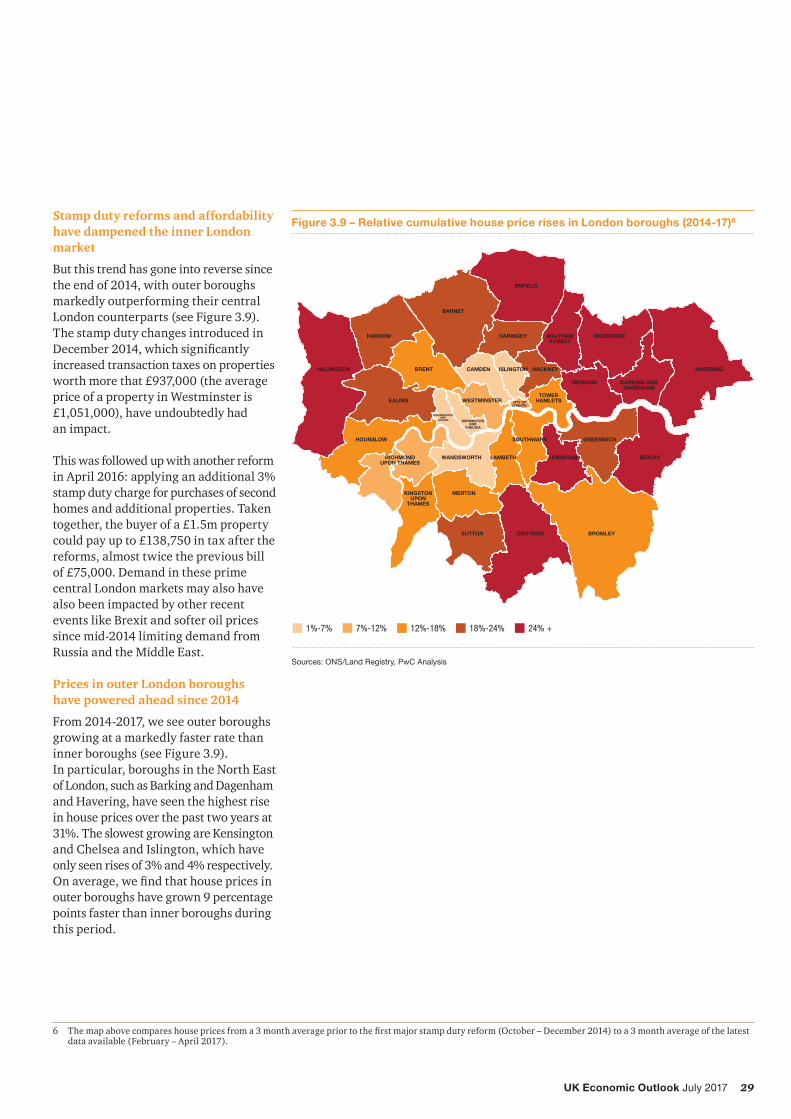
Stamp duty reforms and affordability have dampened the inner London market
But this trend has gone into reverse since the end of 2014, with outer boroughs markedly outperforming their central London counterparts (see Figure 3.9). The stamp duty changes introduced in December2014,whichsignificantlyincreased transaction taxes on properties worth more that £937,000 (the average price of a property in Westminster is £1,051,000), have undoubtedly had an impact.
This was followed up with another reform in April 2016: applying an additional 3% stamp duty charge for purchases of second homes and additional properties. Taken together, the buyer of a £1.5m property could pay up to £138,750 in tax after the reforms, almost twice the previous bill of £75,000. Demand in these prime central London markets may also have also been impacted by other recent events like Brexit and softer oil prices since mid-2014 limiting demand from Russia and the Middle East.
Prices in outer London boroughs have powered ahead since 2014
From 2014-2017, we see outer boroughs growing at a markedly faster rate than inner boroughs (see Figure 3.9). In particular, boroughs in the North East of London, such as Barking and Dagenham and Havering, have seen the highest rise in house prices over the past two years at 31%. The slowest growing are Kensington and Chelsea and Islington, which have only seen rises of 3% and 4% respectively. Onaverage,wefindthathousepricesinouter boroughs have grown 9 percentage points faster than inner boroughs during this period.
6 Themapabovecompareshousepricesfroma3monthaveragepriortothefirstmajorstampdutyreform(October–December2014)toa3monthaverageofthelatestdata available (February – April 2017).
30 UK Economic Outlook July 2017
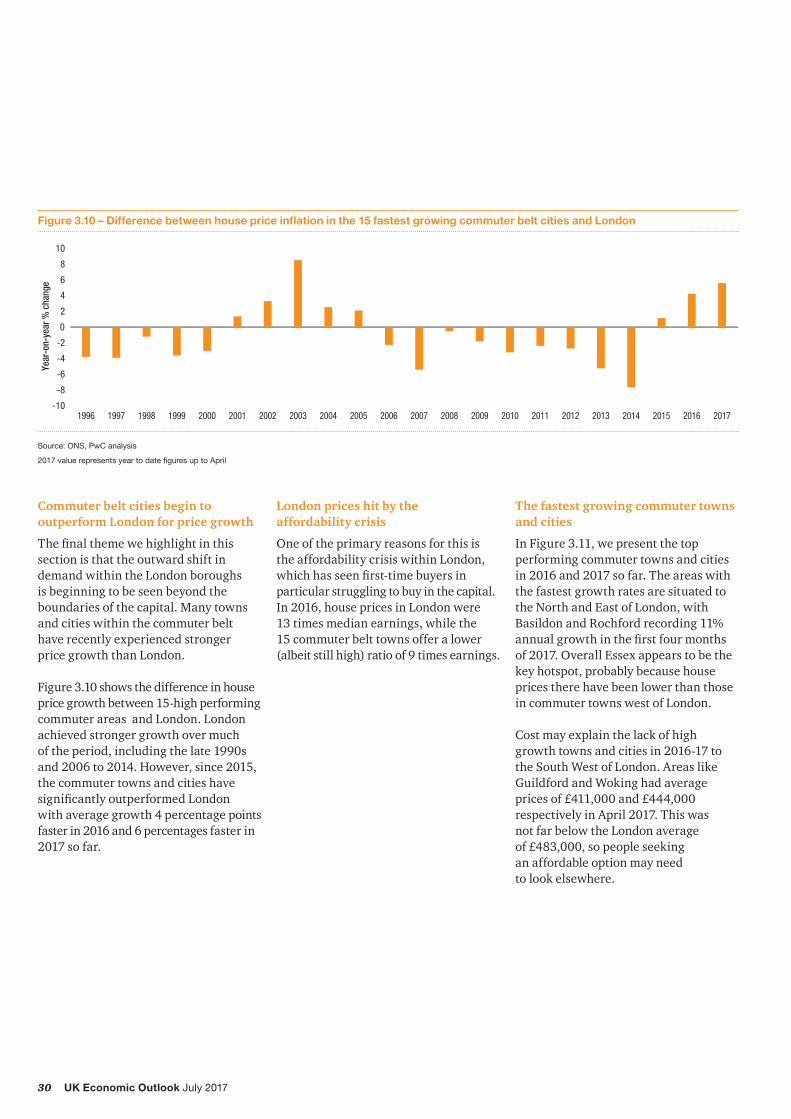
Commuter belt cities begin to outperform London for price growth
Thefinalthemewehighlightinthissection is that the outward shift in demand within the London boroughs is beginning to be seen beyond the boundaries of the capital. Many towns and cities within the commuter belt have recently experienced stronger price growth than London.
Figure 3.10 shows the difference in house price growth between 15-high performing commuter areas and London. London achieved stronger growth over much of the period, including the late 1990s and 2006 to 2014. However, since 2015, the commuter towns and cities have significantlyoutperformedLondon with average growth 4 percentage points faster in 2016 and 6 percentages faster in 2017 so far.
Figure 3.10 – Difference between house price inflation in the 15 fastest growing commuter belt cities and London
Source: ONS, PwC analysis
2017 value represents year to date figures up to April
One of the primary reasons for this is the affordability crisis within London, whichhasseenfirst-timebuyersinparticular struggling to buy in the capital. In 2016, house prices in London were 13 times median earnings, while the 15 commuter belt towns offer a lower (albeit still high) ratio of 9 times earnings.
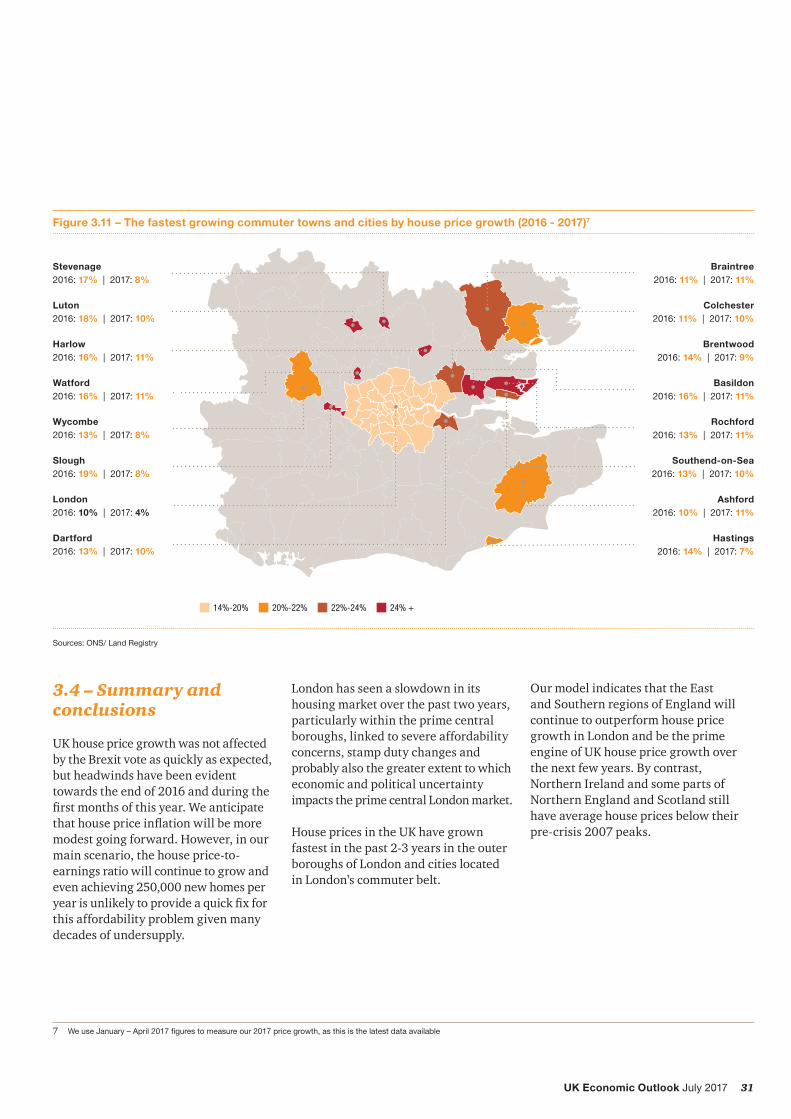
The fastest growing commuter towns and cities
In Figure 3.11, we present the top performing commuter towns and cities in 2016 and 2017 so far. The areas with the fastest growth rates are situated to the North and East of London, with Basildon and Rochford recording 11% annualgrowthinthefirstfourmonthsof 2017. Overall Essex appears to be the key hotspot, probably because house prices there have been lower than those in commuter towns west of London.
Cost may explain the lack of high growth towns and cities in 2016-17 to the South West of London. Areas like Guildford and Woking had average prices of £411,000 and £444,000 respectively in April 2017. This was not far below the London average of £483,000, so people seeking an affordable option may need to look elsewhere.
31UK Economic Outlook July 2017
Figure 3.11 – The fastest growing commuter towns and cities by house price growth (2016 - 2017)7
Sources: ONS/ Land Registry
London2016: 10% | 2017: 4%
Wycombe2016: 13% | 2017: 8%
Slough2016: 19% | 2017: 8%
Watford2016: 16% | 2017: 11%
Luton2016: 18% | 2017: 10%
Stevenage2016: 17% | 2017: 8%
Harlow2016: 16% | 2017: 11%
Dartford2016: 13% | 2017: 10%
Braintree2016: 11% | 2017: 11%
Colchester2016: 11% | 2017: 10%
Brentwood2016: 14% | 2017: 9%
Basildon2016: 16% | 2017: 11%
Rochford2016: 13% | 2017: 11%
Southend-on-Sea2016: 13% | 2017: 10%
Ashford2016: 10% | 2017: 11%
Hastings2016: 14% | 2017: 7%
14%-20% 20%-22% 22%-24% 24% +
3.4 – Summary and conclusions
UK house price growth was not affected by the Brexit vote as quickly as expected, but headwinds have been evident towards the end of 2016 and during the firstmonthsofthisyear.Weanticipatethathousepriceinflationwillbemoremodest going forward. However, in our main scenario, the house price-to-earnings ratio will continue to grow and even achieving 250,000 new homes per yearisunlikelytoprovideaquickfixforthis affordability problem given many decades of undersupply.
London has seen a slowdown in its housing market over the past two years, particularly within the prime central boroughs, linked to severe affordability concerns, stamp duty changes and probably also the greater extent to which economic and political uncertainty impacts the prime central London market.
House prices in the UK have grown fastest in the past 2-3 years in the outer boroughs of London and cities located in London’s commuter belt.
7 We use January – April 2017 figures to measure our 2017 price growth, as this is the latest data available
Our model indicates that the East and Southern regions of England will continue to outperform house price growth in London and be the prime engine of UK house price growth over the next few years. By contrast, Northern Ireland and some parts of Northern England and Scotland still have average house prices below their pre-crisis 2007 peaks.
32 UK Economic Outlook July 2017
Annex Supplementary data on local house price trends
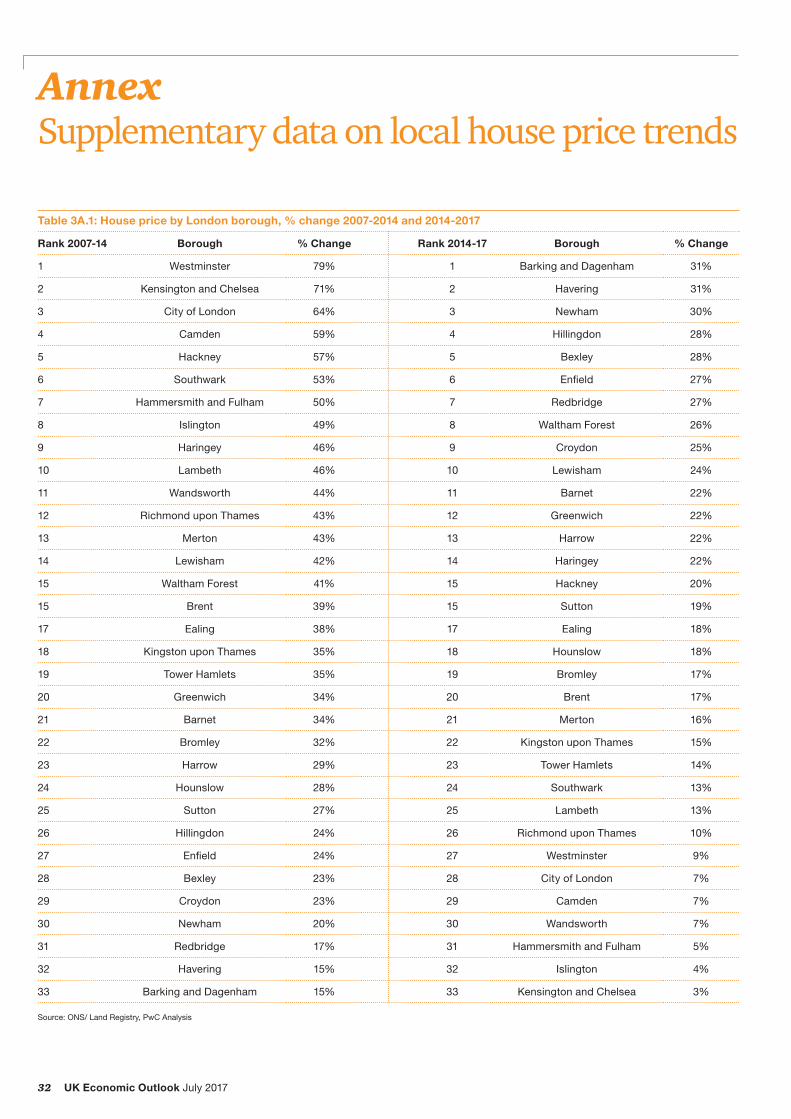
Table 3A.1: House price by London borough, % change 2007-2014 and 2014-2017
33 Barking and Dagenham 15% 33 Kensington and Chelsea 3%
Source: ONS/ Land Registry, PwC Analysis
33UK Economic Outlook July 2017
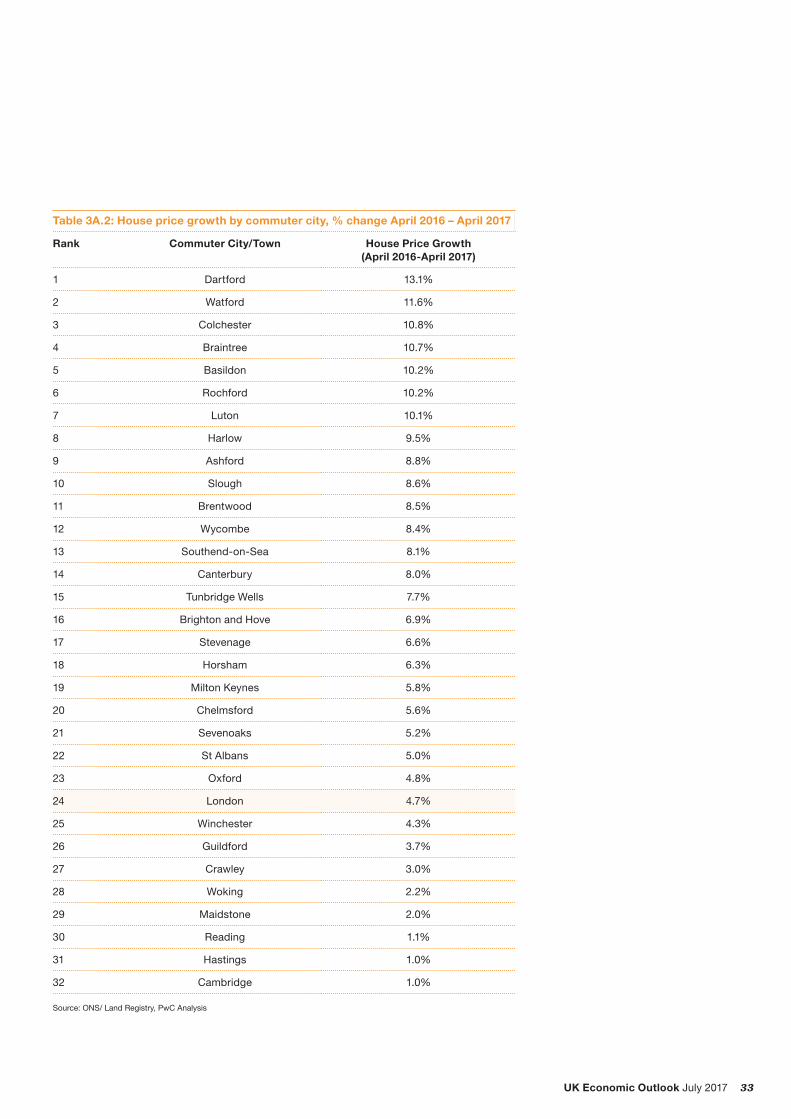
Table 3A.2: House price growth by commuter city, % change April 2016 – April 2017
Rank Commuter City/Town House Price Growth (April 2016-April 2017)
1 Dartford 13.1%
2 Watford 11.6%
3 Colchester 10.8%
4 Braintree 10.7%
5 Basildon 10.2%
6 Rochford 10.2%
7 Luton 10.1%
8 Harlow 9.5%
9 Ashford 8.8%
10 Slough 8.6%
11 Brentwood 8.5%
12 Wycombe 8.4%
13 Southend-on-Sea 8.1%
14 Canterbury 8.0%
15 Tunbridge Wells 7.7%
16 Brighton and Hove 6.9%
17 Stevenage 6.6%
18 Horsham 6.3%
19 Milton Keynes 5.8%
20 Chelmsford 5.6%
21 Sevenoaks 5.2%
22 St Albans 5.0%
23 Oxford 4.8%
24 London 4.7%
25 Winchester 4.3%
26 Guildford 3.7%
27 Crawley 3.0%
28 Woking 2.2%
29 Maidstone 2.0%
30 Reading 1.1%
31 Hastings 1.0%
32 Cambridge 1.0%
Source: ONS/ Land Registry, PwC Analysis
34 UK Economic Outlook July 2017
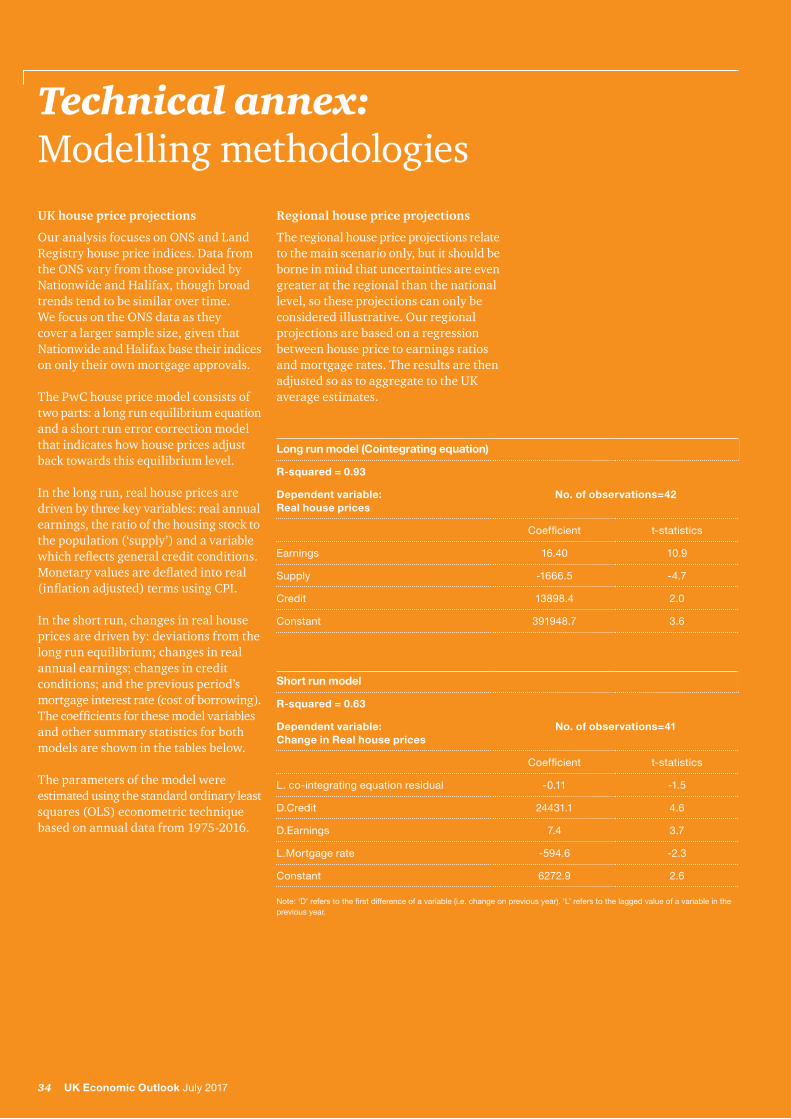
Technical annex: Modelling methodologiesUK house price projections
Our analysis focuses on ONS and Land Registry house price indices. Data from the ONS vary from those provided by Nationwide and Halifax, though broad trends tend to be similar over time. We focus on the ONS data as they cover a larger sample size, given that Nationwide and Halifax base their indices on only their own mortgage approvals.
The PwC house price model consists of two parts: a long run equilibrium equation and a short run error correction model that indicates how house prices adjust back towards this equilibrium level.
In the long run, real house prices are driven by three key variables: real annual earnings, the ratio of the housing stock to the population (‘supply’) and a variable whichreflectsgeneralcreditconditions.Monetaryvaluesaredeflatedintoreal(inflationadjusted)termsusingCPI.
In the short run, changes in real house prices are driven by: deviations from the long run equilibrium; changes in real annual earnings; changes in credit conditions; and the previous period’s mortgage interest rate (cost of borrowing). Thecoefficientsforthesemodelvariablesand other summary statistics for both models are shown in the tables below.
The parameters of the model were estimated using the standard ordinary least squares (OLS) econometric technique based on annual data from 1975-2016.
Long run model (Cointegrating equation)
R-squared = 0.93
Dependent variable: Real house prices
No. of observations=42
Coefficient t-statistics
Earnings 16.40 10.9
Supply -1666.5 -4.7
Credit 13898.4 2.0
Constant 391948.7 3.6
Short run model
R-squared = 0.63
Dependent variable: Change in Real house prices
No. of observations=41
Coefficient t-statistics
L. co-integrating equation residual -0.11 -1.5
D.Credit 24431.1 4.6
D.Earnings 7.4 3.7
L.Mortgage rate -594.6 -2.3
Constant 6272.9 2.6
Note: ‘D’ refers to the first difference of a variable (i.e. change on previous year). ‘L’ refers to the lagged value of a variable in the previous year.
Regional house price projections
The regional house price projections relate to the main scenario only, but it should be borne in mind that uncertainties are even greater at the regional than the national level, so these projections can only be considered illustrative. Our regional projections are based on a regression between house price to earnings ratios and mortgage rates. The results are then adjusted so as to aggregate to the UK average estimates.
34 UK Economic Outlook July 2017
35UK Economic Outlook July 2017
4 – A machine learning approach to estimating current GDP growth1
Key points• Businesses and policy makers need
to keep a constant watch on the UK economy. However, the ONS’s preliminary estimate of GDP growth isreleasedwithasignificantlagandcan often be materially different to laterfinalestimatesofGDPgrowth.This creates the need for alternative indicators of current economic activity.
• Nowcasting models can meet this need by utilising frequently released information to assess current economic activity. They are used across the globe, most notably by central banks in advance of the release ofofficialGDPstatistics.Overcertainperiods in the UK such models have been able to outperform preliminary GDP estimates.
• To provide an earlier estimate of GDP in the UK we have built our own nowcasting model utilising machine learning techniques. Our analysis shows that output indices used by the ONS when forming their preliminary estimatearestrongpredictorsoffinalGDP. However, the inclusion of other indicators, such as house prices, materially improves our ability to predict movements in GDP.
IntroductionWhat is the state of the UK economy right now? Is it expanding or shrinking and by how much? These are questions thatofficialGDPstatisticstrytoanswer,but they take time to be published – can we obtain a quicker answer using other data sources?
In this article we explain the importance of having a timely view of the state of the UK economy for both businesses and policy makers and review methods available to do this. We then describe the analysis that we have undertaken to understand the relationships between frequently released economic indicators and GDP, building our own model which “nowcasts” UK GDP growth.
We use our nowcasting model to estimate GDP growth for the second quarter of 2017, in advance of the preliminary ONS estimate being published later in July, and discuss what this means for businesses and policy makers.
The discussion is structured as follows:
Section 4.1 What is the need for a timely view on the state of the economy?
Section 4.2 The use and performance of nowcasting models
Section 4.3 Using machine learning to estimate current GDP growth
Section 4.4 Our estimate for UK GDP growth in Q2 2017
Section 4.5 Summary and conclusions.
• Our nowcasting model suggests that GDP growth in the second quarter of 2017 will continue to be sluggish at around 0.3% relative to the previous quarter. This is up very slightly from theONSestimateof0.2%inthefirstquarter of 2017 due to somewhat stronger growth in the services sector, offset in part by contracting industrial production and construction sector output.Thismeansthatthefirsthalfof 2017 represents the weakest two consecutive quarters of UK GDP growth since 2012 during the Eurozone crisis.
• Nowcasting models can also be used in a variety of policy and business contexts. For example, in predicting sectoralGVA,industrysalesorfirmrevenues. Such wide applicability allows policy makers and businesses to understand the present better, so that they can plan more effectively for the future.
1 This article was written by Sam Hinds, Lucy Rimmington, Hugh Dance, Jonathan Gillham, Andrew Sentance and John Hawksworth of PwC’s economics practice.
36 UK Economic Outlook July 2017
4.1 – What is the need for a timely view on the state of the economy?
Both businesses and policy makers need to keep a constant watch on the UK economy. Businesses need a timely and accurate read out to make effective decisions day-to-day and policy makers need to understand what the economy is doing so that they can make the most informed economic policy decisions. This need for information becomes even more important during a period of heightened economic uncertainty, as we are now experiencing since the UK’s decision to leave the EU in June 2016 (see Figure 4.1).
Growth in GDP is often relied upon to gauge the current state of the economy, but calculating GDP involves intensive data gathering and processing, meaning there is a lag between the completion of a quarter and knowing how the economy has performed (see Figure 4.2). In the UK such a lag is comparatively short with the ONS releasing its preliminary estimate of GDP just under a month after a given quarter - quicker than any of the other G73.Nonethelessthereisstillasignificantamount of time where businesses andfinancialmarketsdonothave acomprehensiveofficialviewofthecurrent state of the economy (bearing in mind that, immediately before the preliminary ONS release, the latest availableofficialGDPdatarelatesto a period 4-7 months earlier).
2 This index is a widely used measure of economic uncertainty (for the UK and other major economies) produced by a team of US academic economists. See their website here for more details: http://www.policyuncertainty.com/index.html
3 Bean (2016) “Independent review of UK economic Statistics”, P.18 Seehere:https://www.gov.uk/government/uploads/system/uploads/attachment_data/file/507081/2904936_Bean_Review_Web_Accessible.pdf
Figure 4.1 – Economic policy uncertainty in the UK2
0
200
400
600
800
1000
1200
20172015201320112009200720052003200119991997
Source: Economic Policy Uncertainty
Figure 4.2 – Timeline of the preliminary ONS GDP data release
Source: ONS, PwC
Time
Lag
ONS preliminary estimate of GDP
Month 1 Month 2 Month 3 Month 4
Quarter
Figure 4.3 – Preliminary and latest estimates of UK GDP growth (QoQ)
The ONS produces its preliminary estimate of GDP growth using actual datafromthefirsttwomonthsofaquarter and forecasts for the third month. The ONS estimates that, at the time of the preliminary release, it has approximately 45% of actual data available4. As more data become available, initial GDP estimates are revised many times and, as a result, finalGDPestimatescanbemateriallydifferent to those in preliminary releases (see Figures 4.3 and 4.4).
4 ONS (2016) “Methods and Sources”, See here: http://webarchive.nationalarchives.gov.uk/20160105160709/ http:/www.ons.gov.uk/ons/guide-method/method-quality/specific/economy/output-measure-of-gdp/methods-and-sources/index.html
We can see from Figure 4.4 that revisions to preliminary ONS GDP growth estimates were relatively large before and particularlyduringthefinancialcrisis.This was one motivation for central banks to develop alternative indicators of current economic activity using nowcasting models as described in Section 4.2 below.
Sincethefinancialcrisis,theeconomicenvironment has become less volatile and the average revision between the preliminary and latest ONS GDP growth estimatehasfallensignificantlytoanaverage of just under 0.2 percentage points, as Figure 4.4 shows.
Figure 4.4 – The absolute size of revisions to UK GDP growth
Sources: ONS, PwC
0.0
0.2
0.4
0.6
0.8
1.0
1.2
1.4
Q12017
Q12016
Q12015
Q12014
Q12013
Q12012
Q12011
Q12010
Q12009
Q12008
Q12007
Q12006
Q12005
Q12004
Q12003
Q12002
Q12001
Q12000
Q11999
Q11998
Q11997
Q11996
Q11995
Q11994
Q11993
Q11992
Abso
lute
siz
e of
revi
sion
(% Q
oQ g
row
th)
Pre-crisis Avg Post-crisis Avg 08-09 Avg
Nonetheless, there is still a case for developing nowcasting models that are more timely than preliminary ONS GDP growth estimates, provided that there isnosignificantlossofaccuracyintheprocess. This is what we have aimed to do in developing our own nowcasting model as described later in the article. First, however, we review the use and performance of other nowcasting models.
38 UK Economic Outlook July 2017
4.2 – The use and performance of nowcasting models
Nowcasting models have been developed over the last 15 years in answer to this need for a timelier but still accurate view of the current state of the economy. In addition, the models aim to pick up changes in the economic cycle as they happen and provide an explicit and transparent view of which factors are currently impacting GDP growth. Its ability to provide useful insights in these areas has seen nowcasting become an increasingly popular tool for policy makers globally.
There are a range of different approaches that can be taken to produce nowcasts, from judgement-based techniques to statistical analysis of the relationships between more quickly available higher frequency data for the period and the less frequent GDP publication. The institutions that have developed nowcasting models most intensively are central banks and sub-national monetary authorities (as in the US). Table 4.1 sets out how fivenotablemonetaryauthorities use nowcasting models.
Table 4.1: Use of nowcasting models by notable monetary authorities
Country Central Bank Use of nowcasting
United Kingdom Bank of England The Bank of England’s Monetary Policy Committee (MPC) uses a compilation of nowcasts from three different models to form its initial view on the current state of the economy. In particular: (i) based on different industries (e.g. retail services, manufacturing, construction etc.) to mimic the production approach to calculating GDP, (ii) a mixed-data sampling model and (iii) a dynamic factor model. These are then taken together to form a judgement-based nowcast which is used by the MPC to inform its monetary policy decisions from month-to-month.
United States Federal Reserve Bank of Atlanta (FRBA)
FRBA’s Centre for Quantitative Economic Research produces frequent publicly available nowcasts of US GDP in advance of and following the US Bureau of Economic Analysis’s advance estimate. It nowcasts thirteen separate expenditure components of GDP (e.g. consumer spending, investment, etc.) to mimic the expenditure approach to calculating GDP using dynamic factor modelling.
United States Federal Reserve Bank of New York (FRBNY)
FRBNY publishes its own publicly available nowcast of US GDP growth to provide “a model-based counterpart to the more routine forecasts produced at the bank, which have traditionally been based on experience knowledge”. Similar to FRBA, it also uses a dynamic factor approach, but does not mimic a particular approach to calculating GDP.
Eurozone European Central Bank (ECB)
The ECB also uses dynamic factor-based nowcasting models to inform its policy decisions. Its staff have released a number of working papers which form cornerstones of the nowcasting literature, such as “Now-casting and the real-time data flow” (2013), by Marta Bańbura, Domenico Giannone, Michele Modugno and Lucrezia Reichlin.
Norway Norges Bank Norges Bank uses a variety of statistical nowcasting and short-term forecasting models of GDP and inflation to inform its policy rate decisions. Using several models it compiles a composite nowcast using a technique it calls SAM (System for Averaging Models), which produces a weighted average of the results of different models.
Sources: Bank of England, FRBA, FRBNY, ECB, Norges Bank, PwC
39UK Economic Outlook July 2017
In the UK, in addition to public bodies, research organisations such as the National Institute for Economic and Social Research (NIESR), private consultancies and investment banks also produce nowcasts of UK GDP.
Nowcasting techniques have also been used in several different contexts in addition to predicting movements in GDP, as described in Box 4.1.
Box 4.1 – Other applications of nowcasting
Nowcasting techniques provide a general framework for trying to predict the current level of a data point which is released infrequently orwithasignificantlag.
In the UK there are a number of sectoral or industry statistics that are usuallyreleasedwithasignificantlag by the ONS and nowcasting can beusedtoestimatesuchfiguresbefore they are released to help “bridge the gap” between the completion of a time period and the release of data. The ONS is currently exploring the potential for this, having consulted on nowcasting methods to approximate public service productivity estimates and having produced its own nowcasts of household income throughout 2016.
The Economic Statistics Centre of Excellence (ESCOE) in association with the ONS has also recently begun work to nowcast regional estimates of Gross Value Added (GVA).
Its aim is to (i) “produce and disseminate timely model-based quarterly regional estimates of nominal GVA to the same timetable as the UK’s first estimates of quarterly GVA for the UK as a whole” and (ii) “produce historical quarterly estimates of regional GVA, if feasible, at greater levels of regional and sectoral levels of disaggregation”. Such data would greatly improve the ability to analyse sub-national economic impacts of particular events or policies.
Nowcasting can also be used to exploit so-called “Big Data” to predict sectoral statistics. This is something that has been investigated by Hyunyoung Choi and Hal Varian of Google who have used search trends to predict monthly automobile sales in the US (see Choi and Varian (2009) for more information). Use of such innovative data could be taken potentially further, helping businesses to understand their sales, revenues and other KPI’s on a much more frequent basis than ever before.
40 UK Economic Outlook July 2017
Figure 4.5 – Performance of UK nowcasting models
Relative topreliminary GDP
0.0
0.1
0.2
0.3
0.4
0.5
0.6
Bank of England, 2014(2004 Q1 - 2013 Q4)
ONS preliminary estimate(2001 Q2 - 2008 Q4)
Mitchell, 2009(2001 Q2 - 2008 Q4)
NIESR, 2009(2001 Q2 - 2008 Q4)
Relative tofinal GDP
RMSE
(% Q
oQ)
Sources: Mitchell (2009), Bank of England (2017), ONS, PwC
So, how accurate are nowcasting models at predicting current GDP growth in the UK? Evidence for the UK is somewhat limited, but Figure 4.5 summarises the relative performance of models from a selection of three sources: NIESR, Professor James Mitchell of Warwick Business School (who surveyed alternative nowcasting approaches in 2009) and the Bank of England5. Furthermore, the performance of NIESR and Mitchell’s nowcasts are compared to the ONS’s preliminary estimate (which for this purpose is treated as a forecast of the finalGDPestimate).Suchacomparisonis not made for the Bank of England’s figureasitsnowcastingmodelsarecalibrated to predict preliminary ratherthanfinalestimatesofGDP.
The performance of each model is based upon information available before the ONS preliminary data release and is summarised by each model’s Root Mean Squared Error (RMSE) - a standard measure used to evaluate predictive power. The RMSE is typically larger than the average size of the gap between the model’s prediction and actual GDP growth, but is a more reliable measure which helps select models with a lower likelihood of occasional extreme misses. This explains why the RMSE for the ONS is somewhat larger than the average forecast error over the same period.
Perhaps surprisingly, both NIESR and Mitchell’s nowcasts outperform the ONS preliminaryestimateinpredictingfinalGDP. NIESR’s model performs particularly well with a RMSE of 0.29%. However, as we noted above, the ONS preliminary estimates have improved considerably sincethefinancialcrisis(asshowninFigure 4.4) and it remains to be seen if these models could outperform the ONS today.
5 Figures for NIESR are quoted in the same paper as those of Mitchell – Mitchell (2009) “Where are we now? The UK recession and nowcasting GDP growth using statistical models”, National Institute Economic Review, No. 209 July 2009
6 Castle, J.L., Hendry, D.F. and Kitov, O.I. (2013) “Forecasting and Nowcasting macroeconomic variables: A methodological Overview”, University of Oxford Dept. of Economics Discussion paper Series, No. 674, September 2013
We also note that the Bank of England’s ability to nowcast is also impressive with a RMSE of around 0.3%. However, comparison should not be drawn between its RMSE and that of NIESR or Mitchell as RMSEs are only comparable when they consider the same variable (i.e.finalorpreliminaryGDP)overthesame time period. The Bank of England’s figurediffersfromtheothersinboththese respects. RMSEs depend upon on how volatile GDP was in a given period. This explains why, during a period of volatile growth such as 2007-2008, estimates of current GDP growth become more inaccurate (for example in 2007-08 the RMSE for the ONS preliminary estimate increased to 0.62%).
RMSEs of around 0.3% may seem fairly large to some, but it is important to note that the factors that drive growth in different periods materially alter as the economy evolves and the shocks affecting it change. So being able to predict GDP growth with an RMSE of 0.3% is relatively impressive (recall the average error is smaller than the RMSE and likely to be around 0.2-0.25%).
Overall, the evidence suggests that nowcasting models can provide a broadly similar degree of accuracy to the ONS preliminary estimates of GDP growth, despite the nowcasting estimates being more timely. Academic research also shows that the nowcasts represent a significantimprovementonstandardstatistical forecasting models that only make use of past data, in some cases at least halving the size of the RMSE6.
41UK Economic Outlook July 2017
7 For more details please see Zou and Hastie (2005) “Regularization and Variable Selection via the Elastic Net”, Journal of the Royal Statistical Society. Series B (Statistical Methodology), Vol 67, No. 2
8 For example, the IMF has recently applied the Elastic Net methodology to nowcast Lebanese GDP (see: IMF (2016) “Seeing in the dark: A Machine-Learning Approach to nowcasting in Lebanon” for more details) and has shown that this outperforms another prevalent machine-learning technique known as ‘Random Forests’ in terms of predictive power. The Deutsche Bundesbank also recently published a working paper titled “Macroeconomic now- and forecasting based on the factor error correction model using targeted mixed frequency indicators” which uses Elastic Net and associated methods to nowcast German GDP.
Box 4.2 – Technical summary of the Elastic Net nowcasting approach
The Elastic Net Regularisation and Variable Selection (‘Elastic Net’) technique is a machine learning algorithm that augments standard statistical techniques (such as Ordinary Least Squares regression) by introducing a ‘penalty factor’ in the regression model that constricts the size of the impact between different variables and GDP. This helps to prevent the modelfrom‘over-fitting’pastdata,and improves predictive power when being used in conjunction with new, unseendata.Morespecifically,theprogram “learns” the right penalty size to optimise the model’s out of sample performance using a well-known method called “K-fold cross-validation”.
The technique’s name – the elastic net – comes from the fact that using this particular algorithm allows the use of highly similar variables in the same model, which each help to predict GDP, rather than forcing the modeller to have to choose between them. It creates an invisible ‘net’ around such groups of variables which can stretch to accommodate additional variables (hence the name ‘elastic’).
Thekeybenefitsofusingtheelasticnet method are its ability to:
• account for the co-movement between different variables over time;
• choose the variables (out of those we had initially selected) worth keeping in the model by learning which are useful for predicting GDP over different time periods and excluding those that are not; and
• predict GDP more accurately using unseen data through K-fold cross-validation (which involvesfittingthemodeloverdifferent sub-sets of the data) tofigureouttheoptimalpenalty factor.
4.3 - Using machine learning to nowcast current GDP growth
In an effort to further improve on the already relatively impressive predictive power of existing models, we have built a nowcasting model using a machine learning technique known as Elastic Net Regularisation and Variable Selection (“Elastic Net”)7. This is a form of predictive modelling introduced in 2005 that has only recently started to be used to nowcast GDP8. See Box 4.2 for details.
We would stress, however, that applying this technique still involves a lot of expert human input to frame the problem, evaluate alternative modelling approaches and interpret results. Machine learning techniques are being used here to augment not replace the expertise and judgement of human economists.
42 UK Economic Outlook July 2017
To determine which variables should be considered in our analysis we have looked to mirror the make-up of the UK economy. As the services sector now accounts for almost 80% of UK GDP, we have included a number of services-focused variables. We have then complemented this with other indicators to account for the production side of the economy and “softer” indicators such as consumer andindustrialconfidencetocapturechanges in GDP which occur as a result of expectations. A full list of the variables we considered is set out in Table 4.29.
We have tested our nowcasting model over the past four years using the data that would have been available at the end of each quarter (i.e. around a month in advance of the ONS preliminary estimates)10.
As shown in Figure 4.6, our model performs well over this period: it is able to pick up changes in the direction of actual GDP growth correctly 94% of the time with an RMSE of 0.18%. Indeed, 55% of the nowcasts from this model were within 0.1% of the actual GDP growth value over this four year test period.
9 Variables have been adjusted to a constant price base and de-seasonalised where required.10 To test our model in the most robust and realistic way, for each quarter between 2013 Q2 and 2017 Q1 we re-estimated our model and utilised the most up-to-date
information that would have been available at each point in time to predict GDP growth in that quarter (i.e. only making a “one-step ahead” prediction).
Table 4.2: Variables considered in our analysis
Variable(s) Source
• Services index
• Industrial production index
• Manufacturing index
• Construction index
• Claimant count
• Working days lost to industrial action (000’s)
• Retail sales index
• Consumer price index
• Value of exports – balance of payments basis
• Value of imports – balance of payments basis
• Unemployment rate
ONS
• 3 month average LIBOR
• Average unsecured lending rate on credit cards (banks and building societies)
• UK mortgage standard variable rate
• Average unsecured lending rate on £10k loans (banks and building societies)
• UK base rate
• British Sterling effective exchange rate index
• Monthly average gold price against Sterling
Bank of England
• Value of VAT receipts
• Value of corporate tax receipts
HMRC
• Below capacity utilisation survey CBI
• Services PMI survey
• Manufacturing PMI survey
• Construction PMI survey
CIPS/Markit
• House Price index Nationwide
• Consumer confidence indicator
• Industrial confidence indicator
European Commission
• Brent Crude Oil Price Thomson Reuters Eikon
Source: PwC
43UK Economic Outlook July 2017
This improves on the commonly referenced Reuters Poll of Forecasters as our model has both a smaller RMSE and an improved ability to pick up changes in the direction of GDP growth. Furthermore, our model is only marginally worse than the ONS preliminary estimate itself, which has an average RMSE of 0.16% over this period as a predictor of the latest available GDP estimates after later revisions. This is despite the fact that the ONS estimate is based on more available data as it is released around a month later than the effective date at which our nowcasts were made in this test exercise.
Figure 4.6 – Performance of our nowcasting model
PwC nowcast ONS latest GDP estimate Reuters Poll (Median)
0.000
0.002
0.004
0.006
0.008
0.010
0.012
Q12017
Q42016
Q32016
Q22016
Q12016
Q42015
Q32015
Q22015
Q12015
Q42014
Q32014
Q22014
Q12014
Q42013
Q32013
Q22013
GDP
grow
th (%
QoQ
)
Sources: ONS, Thomson Reuters Eikon, PwC
However, we recognise that there are two quarters where there were relatively large variances between our nowcast model estimates and the latest available ONS GDP estimates:
• Q2 2013. Our model under-estimated GDP growth in this period because inthefinalmonthofthequartertherewas a larger increase in key variables (notably the ONS services index) than expected when the nowcast would have been made. Unfortunately the impact of a one-off ‘surprise’ like this is a general limitation of any nowcasting model.
• Q1 2016. Our model over-estimated GDP growth in this period because it did not incorporate movements in net trade expenditure and other factors such as inventories that led to a downward revision in estimated growth in this quarter much later in December 2016 and February 2017 (from 0.4% initially to 0.2% in the latest ONS estimates for growth in this quarter).
To arrive at our preferred model specificationforeachtimeperiodweapplythe Elastic Net algorithm, which analyses the predictive power of each variable. If a given variable, taken together with the others, does not add to the predictive power of the model, the algorithm ‘shrinks’ the size of the impact that such a variable has on the nowcast to zero – effectively excluding it from the model.
44 UK Economic Outlook July 2017
Figure 4.7 – Top 5 variables that impact our nowcasts over the past 4 years
ONS Services Index ONS Industrial Production Index ONS Construction Index
5
4
3
2
1
Q12017
Q42016
Q32016
Q22016
Q12016
Q42015
Q32015
Q22015
Q12015
Q42014
Q32014
Q22014
Q12014
Q42013
Q32013
Q22013
Nationwide House Price Index ONS Manufacturing IndexONS Retail Sales Index
Source: PwC
Performing this procedure over different periods gives us a different mix of important variables over time. This allows us to understand which indicators become more or less important at different times for estimating current GDP growth. Figure 4.7 shows the rank of the top 5 variables included in our model each quarter based on the absolute strength of the estimated relationship they have with GDP.
The ONS services output and industrial production indices are consistently most strongly associated with movements in GDP growth. Construction and manufacturing indices also play a prominent role, being ranked third and fourth over time11. Having a lesser, but still important impact, are two indicators that capture other factors: the ONS retail sales index and the Nationwide House Price index12. A discussion of these variables and their estimated average relationship with GDP is set out in Table 4.3.
11 It is important to note that it is consistent to include multiple similar variables in the model, as the elastic net algorithm is able to make use of the useful, predictive information in each series – if any – without their co-movement being a problem (as explained in Box 4.2).
45UK Economic Outlook July 2017
The estimated relationships represent the average percentage point change in GDP growth that our model associates with a one percent increase in a given indicator13. For example, our model estimates that, on average from 2013-2016, a one percent increase in the ONS services index would be associated with a 0.6 percentage point increase in GDP growth.
We think that this analysis is important for two reasons: (i) it allows businesses and policy makers to gain further clarity on which indicators and announcements matter most when trying to understand the current level of GDP growth; and (ii) it allows us to give a more precise estimate of what GDP growth is at any given point in time.
Table 4.3: Discussion of key variables which impact our nowcasts
Variable Estimated relationship with GDP growth
Discussion
ONS Services index
0.60 This is a monthly indicator of output growth in the services sector, which is the dominant element in total GDP and so, as expected, has the highest weight in our nowcasting model.
ONS Industrial production index
0.13 The ONS Industrial production index is another monthly indicator of output growth but has a smaller weight in our nowcast as it does in total GDP.
ONS Manufacturing index
0.04 Typically a modeller might discard the ONS Manufacturing output index and only use the Industrial production index in compiling a nowcast, since there is a high degree of overlap between the two variables. However, elastic net regularisation allows the model to learn whether there is any residual usefulness to allowing Manufacturing and Industrial production to predict GDP simultaneously and our testing shows that there is.
ONS Construction index
0.03 The ONS Construction index is a quarterly indicator of output growth in the construction sector14. As expected, this is positively associated with GDP growth.
Nationwide House Price Index
0.02 House price growth tends to be associated with GDP growth as increases in house prices stimulate confidence and consumer spending by increasing effective wealth. Rises in house prices also stimulate construction output.
ONS Retail sales index
0.02 The ONS Retail sales index measures changes in the volume of retail sales per month and is available on a relatively timely basis compared to other service sector data. This would be expected to be positively associated with GDP growth.
Other variables
<0.01 Other different variables are included in our model over different time periods, but of these the factor that has the most persistent and largest impact is the number of people claiming unemployment benefits. As you would expect, the relationship it has with GDP is negative.
Sources: Bank of England, FRBA, FRBNY, ECB, Norges Bank, PwC
12 WhilenotfeaturedinFigure4.9,thenumberofpeopleclaimingunemploymentbenefits(i.e.theClaimantCount)alsohadalargeimpact,butmarginallylowerthanthe impact of retail sales or the Nationwide House Price index. This is particularly noteworthy as the Claimant Count represents the variable which tends to have the strongest negative relationship to GDP rather than the positive relationships associated with the other indicators listed in Figure 4.9.
13 Such relationships are presented as an average over 2013Q2-2017Q114 The ONS also has a monthly construction index, but this has only been available from 2010 onwards, whereas the quarterly version of the indicator has been available
since 1997. We used both when building our model, but found the longer dataset that we could use with the quarterly dataset allowed us to nowcast more accurately.
46 UK Economic Outlook July 2017
4.4 - Our estimate for UK GDP growth in Q2 2017
Using data available as at 7th July 2017, our nowcast of quarter-on-quarter UK GDP growth for Q2 2017 is around 0.3%. As shown in Figure 4.8, this is very slightly higher than the latest ONS estimateofGDPgrowthinthefirstquarter of 2017 (0.2%), but still remains significantlylowerthanourcurrentestimate of long-term trend quarterly UK growth of around 0.5%
A full decomposition of our nowcast is set out in Figure 4.9. This shows that our prediction of a slight pick-up in GDP growthfromthefirstquarterof2017ispredominantly driven by somewhat stronger growth in the services sector. Retail sales growth in particular was stronger in April, although it did then fall back in May.
However, manufacturing and construction sector growth will be weakerthaninthefirstquarterbasedoncurrently available data, pulling down overall estimated GDP growth in the second quarter. Relatively weak recent house price growth (based on the Nationwide index, which we use here as itismoretimelythantheofficialONShouse price data) also contributes to our estimate of continued subdued overall GDP growth in Q2 2017.
As Figure 4.9 shows, our unrounded estimate for Q2 2017 GDP growth is 0.25%, though we have rounded this up to 0.3% in line with the usual ONS practice of expressing GDP growth rates to only one decimal place. But, based on our nowcast, it would not be a big surprise if the preliminary ONS GDP estimate for Q2 came out at 0.2%.
Figure 4.8 – UK GDP growth (% QoQ) Q2 2013 - Q2 2017
0.0
0.1
0.2
0.3
0.4
0.5
0.6
0.7
0.8
0.9
1.0
Q2 2017
Q12017
Q42016
Q32016
Q22016
Q12016
Q42015
Q32015
Q22015
Q12015
Q42014
Q32014
Q22014
Q12014
Q42013
Q32013
Q22013
Nowcast
Estimated long-term average
GDP
grow
th (%
QoQ
)
Sources: ONS, PwC
Figure 4.9 – Decomposition of our Q2 2017 GDP growth nowcast15
0.00
0.10
0.20
0.30
0.40
Q22017
Nowcast
Allother
variables
ONSConstruction
index
ONSNationwidehouse price
index
ONSRetailSalesindex
ONSIndustrial
productionindex
ONSServices
index
GDP
grow
th (%
QoQ
)
+0.35%
+0.03% +0.25%
-0.06%+0.02% -0.03%
-0.06%
Source: PwC
15 The main contributor to the positive contribution of other variables is a constant term that is included to approximate other factors that are not included explicitly in our model.
47UK Economic Outlook July 2017
In summary, Q2 2017 growth may be slightlyhigherthaninthefirstquarter,but still some way below long-term trend. As discussed in Section 2 above, we expect this relatively sluggish growth to continue for some time given ongoing uncertainty relating to the Brexit negotiations and the squeeze on real consumer spending power from higherinflationlinkedtotheweaknessof the pound since the EU referendum last year.
4.5 – Summary and conclusions
With a slowing economy and relatively high levels of political uncertainty in the UK, it is important for businesses and policymakers to get an accurate understanding of the state of the economy in a timely way. We have shown that nowcasting presents an effective way to do this, using current data which is published on a more frequent basis thanofficialONSestimatesofGDP.
Using our machine-leaning-based nowcasting model we estimate that GDP growth in the second quarter of 2017 will continue to be relatively sluggish at around 0.3% on the previous quarter. This is up very slightly from 0.2% in the firstquarterof2017duetosomewhatstronger projected growth in the services sector, but still some way below estimated trend GDP growth of around 0.5% per quarter. This means that the firsthalfof2017seemslikelytoseetheweakest six months of UK GDP growth since 2012 during the Eurozone crisis.
We have focused on GDP estimates in this article, but there are also a range of other possible applications of nowcasting techniques, for example in estimating sectoral GVA and industry sales. The ability to apply nowcasting techniques to such a wide variety of different contexts makes them potentially powerful tools that can help policy makers and businesses to understand the present state of the economy and their markets better, so that they can plan more effectively for the future.
48 UK Economic Outlook July 2017
Appendix A Outlook for the global economy
Table A.1 presents our latest main scenario projections for a selection of economies across the world.
World economic growth strengthened through 2016 and this is expected to continue, increasing the global weighted average real growth rate to 2.9% in 2017 and 3% in 2018 (using GDP at market exchange rates as weights). This growth is expected to be driven by the large emerging economies with continued strong growth of around 7-7.5% in India and around 6-6.5% in China projected for 2017 and 2018. The outlook for emerging markets has also brightened as a result of improving economic conditions in Russia and Brazil, which are now moving gradually out of recession.
Steady but moderate growth of around 1.5-1.6% is projected for the Eurozone in 2017 and 2018. Relative to the rest of the G7, quite strong growth is projected fortheUSeconomyin2017-18asfiscalstimulus strengthens an already recovering economy. But this could be offset by gradual rises in US interest ratestokeepinflationundercontrol.
These projections are updated monthly in our Global Economy Watch publication, which can be found at www.pwc.com/gew
Table A.1: Global economic growth and inflation prospects
Share of world GDP
Real GDP growth (%) Inflation (%)
2016 at MERs 2017 2018 2017 2018
US 24.5% 2.2 2.4 2.3 2.5
China 15.2% 6.5 6.1 1.8 2.5
Japan 5.6% 1.0 0.7 1.3 1.5
UK 3.9% 1.5 1.4 2.8 2.9
France 3.3% 1.5 1.4 1.2 1.3
Germany 4.6% 1.5 1.5 1.8 1.9
Greece 0.3% 1.6 2.0 0.8 1.2
Ireland 0.4% 3.6 3.2 1.0 1.2
Italy 2.5% 1.0 0.9 1.1 1.2
Netherlands 1.0% 1.6 1.7 1.5 1.5
Portugal 0.3% 1.4 1.2 1.0 1.0
Spain 1.6% 2.3 2.1 1.3 1.5
Poland 0.6% 3.2 3.4 1.7 1.7
Russia 1.8% 1.1 1.4 4.7 4.5
Turkey 1.0% 2.6 3.1 9.6 8.0
Australia 1.7% 2.7 2.8 2.5 2.2
India 2.8% 7.3 7.4 5.0 4.9
Indonesia 1.2% 5.1 5.3 4.5 4.4
South Korea 1.9% 2.6 2.8 1.6 2.8
Argentina 0.9% 2.3 2.6 25 -
Brazil 2.4% 0.4 1.5 5.0 4.5
Canada 2.1% 2.0 2.1 2.1 2.1
Mexico 1.6% 1.5 2.0 4.0 3.5
South Africa 0.4% 0.9 1.5 6.2 5.8
Nigeria 0.7% 0.8 1.8 15.8 14.1
Saudi Arabia 0.9% 0.8 1.5 3.5 4.4
World (PPP) 3.4 3.5 3.1 3.0
World (Market Exchange Rates) 100% 2.9 3.0 2.7 2.7
G7 46.4% 1.8 1.8 2.0 2.2
Eurozone 15.8% 1.6 1.5 1.4 1.5
Source: PwC main scenario for 2017 and 2018; IMF for GDP shares in 2016 at market exchange rates (MERs).
49UK Economic Outlook July 2017
Appendix B UK economic trends: 1979 – 2016
Annual averages GDP growth Household expenditure
growth
Manufacturing output
growth*
Inflation (CPI**)
3 month interest rate (% annual
average)
Current account balance
(% of GDP)
PSNB*** (% of GDP)
1979 3.7 4.8 13.7 -0.6 4.3
1980 -2.0 0.1 16.6 0.5 3.9
1981 -0.8 0.3 13.9 1.5 3.1
1982 2.0 1.2 12.2 0.6 2.3
1983 4.2 4.4 10.1 0.2 3.0
1984 2.3 2.5 10.0 -0.5 3.3
1985 4.2 5.1 12.2 -0.3 2.6
1986 3.2 6.1 10.9 -1 2.0
1987 5.4 5.1 9.7 -1.6 1.3
1988 5.8 7.4 10.4 -3.6 -0.6
1989 2.6 3.9 5.2 13.9 -4.1 -0.6
1990 0.7 1.0 7.0 14.8 -3.1 0.6
1991 -1.1 -0.6 7.5 11.5 -1.3 2.6
1992 0.4 0.9 4.3 9.6 -1.5 5.6
1993 2.5 2.8 2.5 5.9 -1.3 6.8
1994 3.9 3.2 2.0 5.5 -0.5 5.8
1995 2.5 2.1 2.6 6.7 -0.7 4.7
1996 2.5 3.9 2.5 6.0 -0.6 3.3
1997 3.1 4.5 1.8 6.8 -0.2 1.6
1998 3.2 3.9 0.4 1.6 7.3 -0.4 -0.1
1999 3.3 4.9 0.6 1.3 5.4 -2.4 -1.1
2000 3.7 4.9 2.2 0.8 6.1 -2.1 -1.8
2001 2.7 3.5 -1.5 1.2 5.0 -1.9 -0.6
2002 2.4 3.7 -2.2 1.3 4.0 -2 1.6
2003 3.5 3.8 -0.6 1.4 3.7 -1.7 2.6
2004 2.5 3.3 1.8 1.3 4.6 -1.8 2.7
2005 3.0 3.0 0.0 2.1 4.7 -1.2 2.9
2006 2.5 1.8 2.2 2.3 4.8 -2.2 2.6
2007 2.6 3.0 0.6 2.3 6.0 -2.4 2.4
2008 -0.6 -0.8 -2.8 3.6 5.5 -3.5 5.2
2009 -4.3 -3.5 -9.4 2.2 1.2 -3 10.1
2010 1.9 0.7 4.6 3.3 0.7 -2.7 9.1
2011 1.5 -0.7 2.2 4.5 0.9 -1.8 7.1
2012 1.3 1.9 -1.5 2.8 0.8 -3.7 7.7
2013 1.9 1.6 -1.0 2.6 0.5 -4.4 5.9
2014 3.1 2.1 2.9 1.5 0.5 -4.7 5.6
2015 2.2 2.5 -0.2 0.0 0.6 -4.3 4.2
2016 1.8 2.8 0.8 0.7 0.5 -4.4 2.9
Average over economic cycles****
1979 - 1989 2.8 3.7 12.2 -0.8 2.2
1989 - 2000 2.3 3.0 3.3 8.3 -1.5 2.3
2000 - 2014 1.8 1.9 -0.2 2.2 3.3 -2.6 4.2
* After the revisions to the national accounts data, pre-1998 data is not currently available ** Pre-1997 data estimated *** Public Sector Net Borrowing (calendar years excluding public sector banks) **** Peak-to-peak for GDP relative to trend Sources: ONS, Bank of England
50 UK Economic Outlook July 201750
Contacts and services
EconomicsOur macroeconomics team produce the UK Economic Outlook three times a year.
The present report was written by John Hawksworth, Richard Snook, Lucy Rimmington, George Mason, Sam Hinds, Hugh Dance, Jamie Durham, Jonathan Gillham and Andrew Sentance.
For more information about the technical content of this report please contact:
In addition, we provide a range of macroeconomic consulting services for clients, including:
• Revenue forecasting
• Stress testing
• Economic impact analysis (including Brexit)
For enquiries concerning these services, please contact Jonathan Gillham on 07714 567 297 or Richard Snook on 020 7212 1195.
Our UK economics team is part of Strategy& PwC’s strategy consulting practice. Strategy& is a global team of practical strategists committed to helping you seize essential advantage.
Our economics practice offers a wide range of services, covering competition and regulation issues, litigation support, bids and business cases, public policy and projectappraisals,financialeconomics,the economics of sustainability and macroeconomics.
For more information about these services please visit our website (www.pwc.co.uk/economics) or contact the relevant person from the list to the right.
Competition Economics Tim Ogier +44 (0)20 7804 5207
Daniel Hanson +44 (0)20 7804 5774
Luisa Affuso +44 (0)20 7212 1832
Economic Regulation David Armstrong +44 (0)28 9041 5716
Dan Burke +44 (0)20 7212 6494
Alastair Macpherson +44 (0)20 7213 4463
Stuart Cook +44 (0)20 7804 7167
Economic Appraisal Nick Forrest +44 (0)20 7804 5695
Jonathan Gillham +44 (0)7714 567 297
Andrew Sentance +44 (0)20 7213 2068
Total impact measurement and management Mark Ambler +44 (0)20 7213 1591
Health industries Kalee Talvite-Brown +44 (0)20 7213 4372
Dan Burke +44 (0)20 7212 6494
Andy Statham +44 (0)20 7213 1486
Education and skills Michael Kane +44 (0)28 9041 5303
Peter Norriss +44 (0)7525 298 726
Sean Hughes +44 (0)20 7212 4194
International development David Armstrong +44 (0)28 9041 5716
Sheetal Vyas +44 (0)7730 146 352
Zlatina Loudjeva +44 (0)20 7213 4815
Financial services Nick Forrest +44 (0)20 7804 5695
Media and entertainment David Lancefield +44 (0)20 7213 2263
Water Richard Laikin +44 (0)20 7212 1204
Power and utilities Stuart Cook +44 (0)20 7804 7167
Transport Daniel Hanson +44 (0)20 7804 5774
To receive future editions by e-mail please sign up on our website www.pwc.co.uk/economy or e-mail [email protected]
51UK Economic Outlook July 2017
www.pwc.co.uk/economics
At PwC, our purpose is to build trust in society and solve important problems. PwC is a network of firms in 157 countries with more than 223,000 people who are committed to delivering quality in assurance, advisory and tax services. Find out more and tell us what matters to you by visiting us at www.pwc.com/UK.
This publication has been prepared for general guidance on matters of interest only, and does not constitute professional advice. You should not act upon the information contained in this publication without obtaining specific professional advice. No representation or warranty (express or implied) is given as to the accuracy or completeness of the information contained in this publication, and, to the extent permitted by law, PricewaterhouseCoopers LLP, its members, employees and agents do not accept or assume any liability, responsibility or duty of care for any consequences of you or anyone else acting, or refraining to act, in reliance on the information contained in this publication or for any decision based on it.