24
UK Future Energy Scenarios Richard Smith Future Transmission Networks Manager January 2012

UK Future Energy Scenarios
Richard Smith
Future Transmission Networks Manager
January 2012

Cautionary Statement
This presentation contains certain statements that are neither reported financial results nor other historical information. These
statements are forward-looking statements within the meaning of Section 27A of the Securities Act of 1933, as amended, and Section
21E of the Securities Exchange Act of 1934, as amended. These statements include information with respect to National Grid’s
financial condition, its results of operations and businesses, strategy, plans and objectives. Words such as ‘anticipates’, ‘expects’,
‘intends’, ‘plans’, ‘believes’, ‘seeks’, ‘estimates’, ‘targets’, ‘may’, ‘will’, ‘continue’, ‘project’ and similar expressions, as well as statements
in the future tense, identify forward-looking statements. These forward-looking statements are not guarantees of National Grid’s future
performance and are subject to assumptions, risks and uncertainties that could cause actual future results to differ materially from
those expressed in or implied by such forward-looking statements. Many of these assumptions, risks and uncertainties relate to factors
that are beyond National Grid’s ability to control or estimate precisely, such as changes in laws or regulations and decisions by
governmental bodies or regulators; breaches of, or changes in, environmental, climate change and health and safety laws or
regulations, including breaches arising from the potentially harmful nature of its activities; network failure or interruption, the inability to
carry out critical non network operations and damage to infrastructure, due to adverse weather conditions, including the impact of
Hurricane Irene and other storms; performance against regulatory targets and standards and against National Grid’s peers with the aim Hurricane Irene and other storms; performance against regulatory targets and standards and against National Grid’s peers with the aim
of delivering stakeholder expectations regarding costs and efficiency savings, including those related to investment programmes,
restructuring and internal transformation projects; and customers and counterparties failing to perform their obligations to the Company.
Other factors that could cause actual results to differ materially from those described in this presentation include fluctuations in
exchange rates, interest rates and commodity price indices; restrictions in National Grid’s borrowing and debt arrangements, funding
costs and access to financing; National Grid’s status as a holding company with no revenue generating operations of its own; inflation;
seasonal fluctuations; the funding requirements of its pension schemes and other post-retirement benefit schemes; the loss of key
personnel or the ability to attract, train or retain qualified personnel and any disputes arising with its employees or the breach of laws or
regulations by its employees; accounting standards, rules and interpretations, including changes of law and accounting standards and
other factors that may affect National Grid’s effective rate of tax; and incorrect or unforeseen assumptions or conclusions relating to
business development activity. For a more detailed description of some of these assumptions, risks and uncertainties, together with
any other risk factors, please see National Grid’s filings with and submissions to the US Securities and Exchange Commission (the
‘SEC’) (and in particular the ‘Risk factors’ and ‘Operating and Financial Review’ sections in our most recent Annual Report on Form 20-
F). The effects of these factors are difficult to predict. New factors emerge from time to time and National Grid cannot assess the
potential impact of any such factor on its activities or the extent to which any factor, or combination of factors, may cause results to
differ materially from those contained in any forward-looking statement. Except as may be required by law or regulation, National Grid
undertakes no obligation to update any of its forward-looking statements, which speak only as of the date of this presentation. The
content of any website references herein do not form part of this presentation.
2

The UK energy landscape is changing
Sustainability
Existing power station closures
~25%
3
Gas from UK sources
~25%of total supplies by 2020
Affordability
Security of
supply
~25%of total capacity by 2020

The future: efficiency, decarbonisation
and electrification
TransportElectricity Heat
4
new homes & retrofit
Heat pump
Decarbonised electricity…
and decarbonisetransport
Efficiency and innovationInsulate and reduce
Smart Meters & Appliance efficiency
De-carbonise heat
Biomethane
CNG
Gas backup& embeddedgeneration

Our scenarios
Electricity generation capacity (GW)
100
125
150
Our scenarios are designed to explore a range of possible outcomes
Gone Green:
Renewable and
carbon targets are hit
Slow Progression:
Electric cars (m)
5
10
15
5
75
2010 2015 2020 2025 2030
Slow Progression:
2020 targets are not
hit until after 2025
Accelerated Growth*:Faster deployment of
offshore wind than in
Gone Green
* Accelerated Growth only varies from Gone Green in the mix of power generation –
all other variables e.g. demand, EV’s, heat pumps etc are the same as for Gone Green.
0
2010 2015 2020 2025 2030
Domestic heat pumps (m)
0
5
10
15
2010 2015 2020 2025 2030
Annual gas demand (TWh)
0
200
400
600
800
1,000
1,200
2010 2015 2020 2025 2030

Gone Green: total UK energy requirements
1,500
2,000
2,500
En
erg
y r
eq
uir
em
en
t (T
Wh
)
Wind
Renewable
Nuclear
6
0
500
1,000
1,500
2010
2011
2012
2013
2014
2015
2016
2017
2018
2019
2020
2021
2022
2023
2024
2025
2026
2027
2028
2029
2030
En
erg
y r
eq
uir
em
en
t (T
Wh
)
Nuclear
Gas-CCS
Gas
Coal-CCS
Coal
Oil
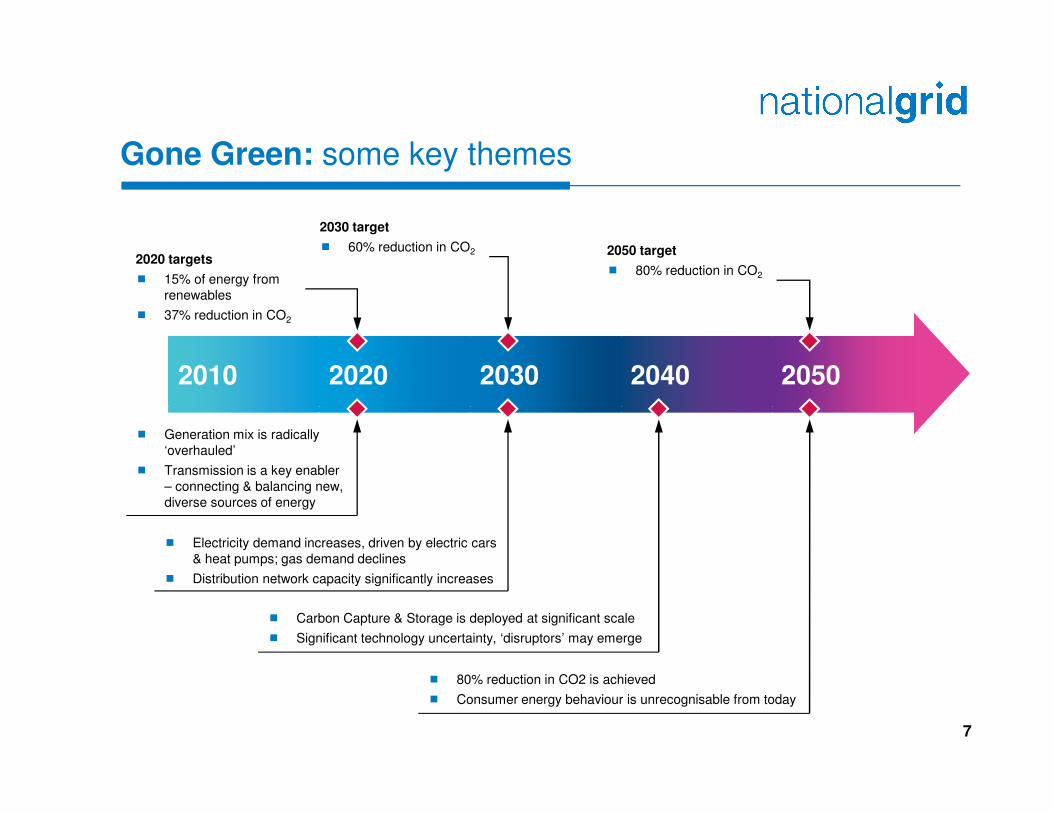
Gone Green: some key themes
2010 2020 2030 2040 2050
2020 targets
� 15% of energy from
renewables
� 37% reduction in CO2
2050 target
� 80% reduction in CO2
2030 target
� 60% reduction in CO2
7
� Generation mix is radically
‘overhauled’
� Transmission is a key enabler
– connecting & balancing new,
diverse sources of energy
� Electricity demand increases, driven by electric cars
& heat pumps; gas demand declines
� Distribution network capacity significantly increases
� Carbon Capture & Storage is deployed at significant scale
� Significant technology uncertainty, ‘disruptors’ may emerge
� 80% reduction in CO2 is achieved
� Consumer energy behaviour is unrecognisable from today

When do you switch to electric?
Emissions intensity pre appliance (g/kWh)
400
600
800
1,000 ‘Window’ for transport
‘Window’ for heat
8
Appliance efficiency will also determine the optimum transition pointand may extend the ‘window’
0
200
2010 2015 2020 2025 2030 2035 2040 2045 2050
Electricity (total grid) Marginal electricty for transport Marginal electricty for heat
Natural Gas Gas-Biogas mix Oil
Oil-Biofuel mix
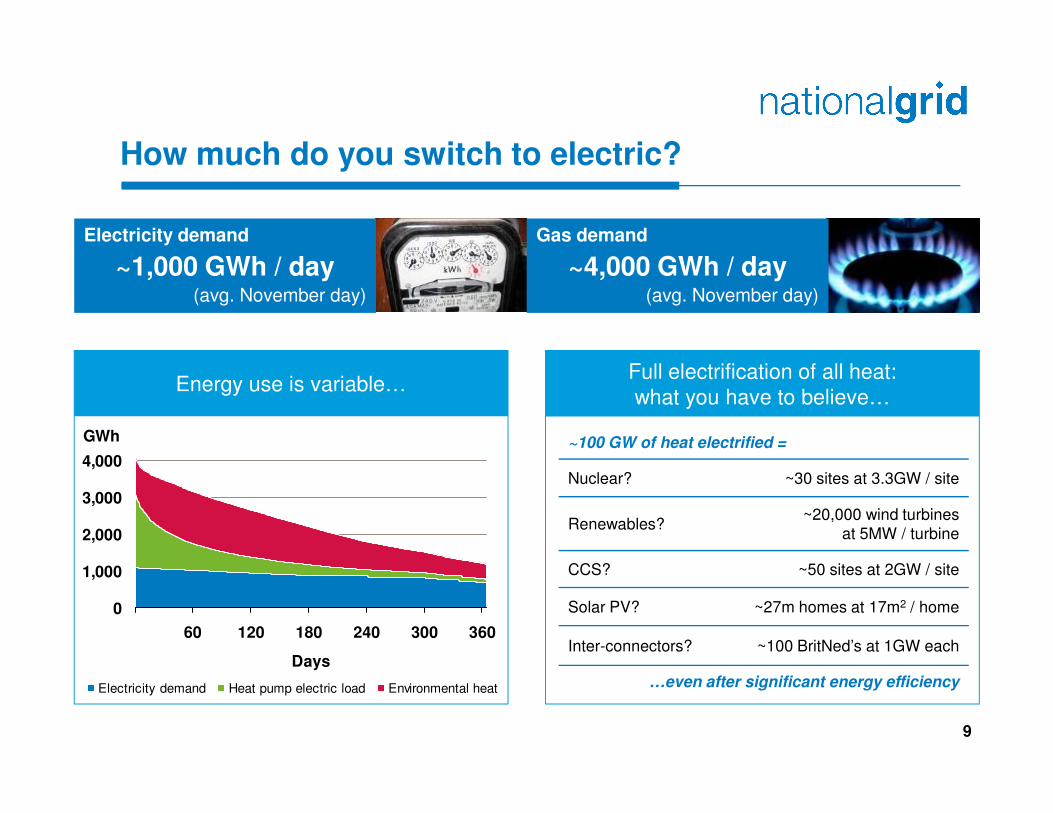
How much do you switch to electric?
~1,000 GWh / day
Electricity demand
(avg. November day)
~4,000 GWh / day
Gas demand
(avg. November day)
Energy use is variable…Full electrification of all heat:
what you have to believe…
9
what you have to believe…
~100 GW of heat electrified =
Nuclear? ~30 sites at 3.3GW / site
Renewables?~20,000 wind turbines
at 5MW / turbine
CCS? ~50 sites at 2GW / site
Solar PV? ~27m homes at 17m2 / home
Inter-connectors? ~100 BritNed’s at 1GW each
…even after significant energy efficiency
GWh
0
1,000
2,000
3,000
4,000
60 120 180 240 300 360
Days
Electricity demand Heat pump electric load Environmental heat
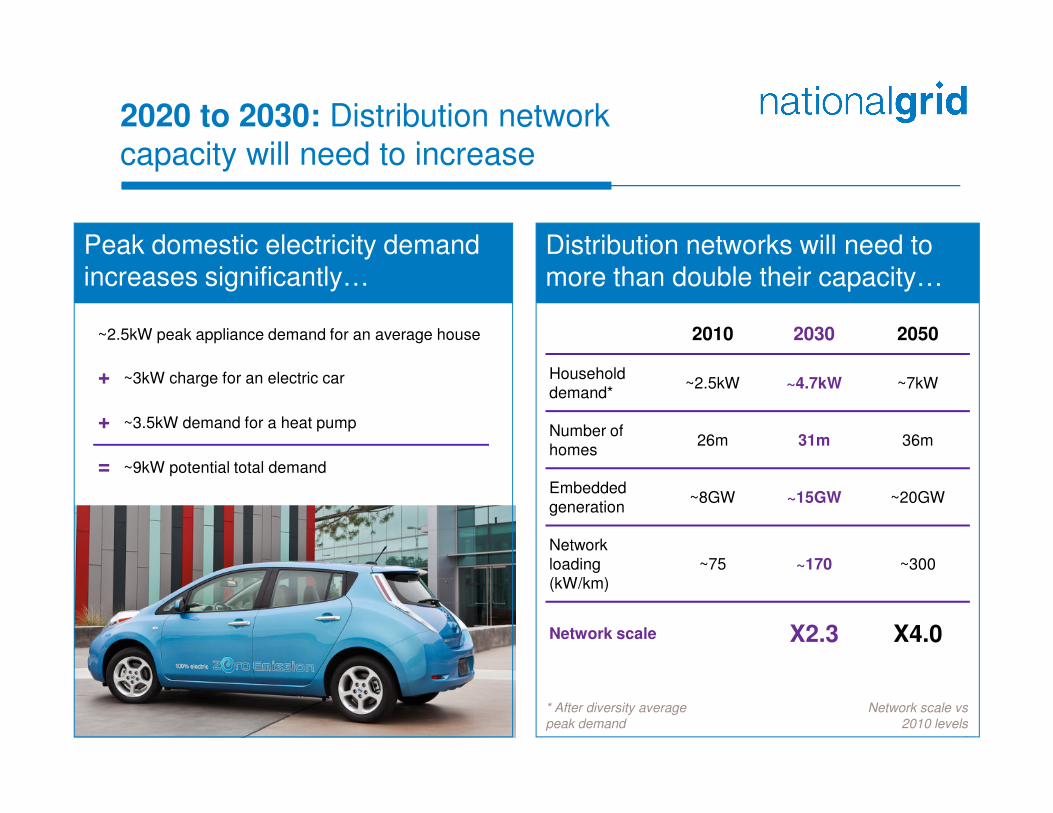
2020 to 2030: Distribution network
capacity will need to increase
Peak domestic electricity demand increases significantly…
Distribution networks will need to more than double their capacity…
2010 2030 2050
Household
demand*~2.5kW ~4.7kW ~7kW
~2.5kW peak appliance demand for an average house
+ ~3kW charge for an electric car
10
Number of
homes26m 31m 36m
Embedded
generation~8GW ~15GW ~20GW
Network
loading
(kW/km)
~75 ~170 ~300
Network scale X2.3 X4.0
Network scale vs
2010 levels
* After diversity average
peak demand
+ ~3.5kW demand for a heat pump
= ~9kW potential total demand
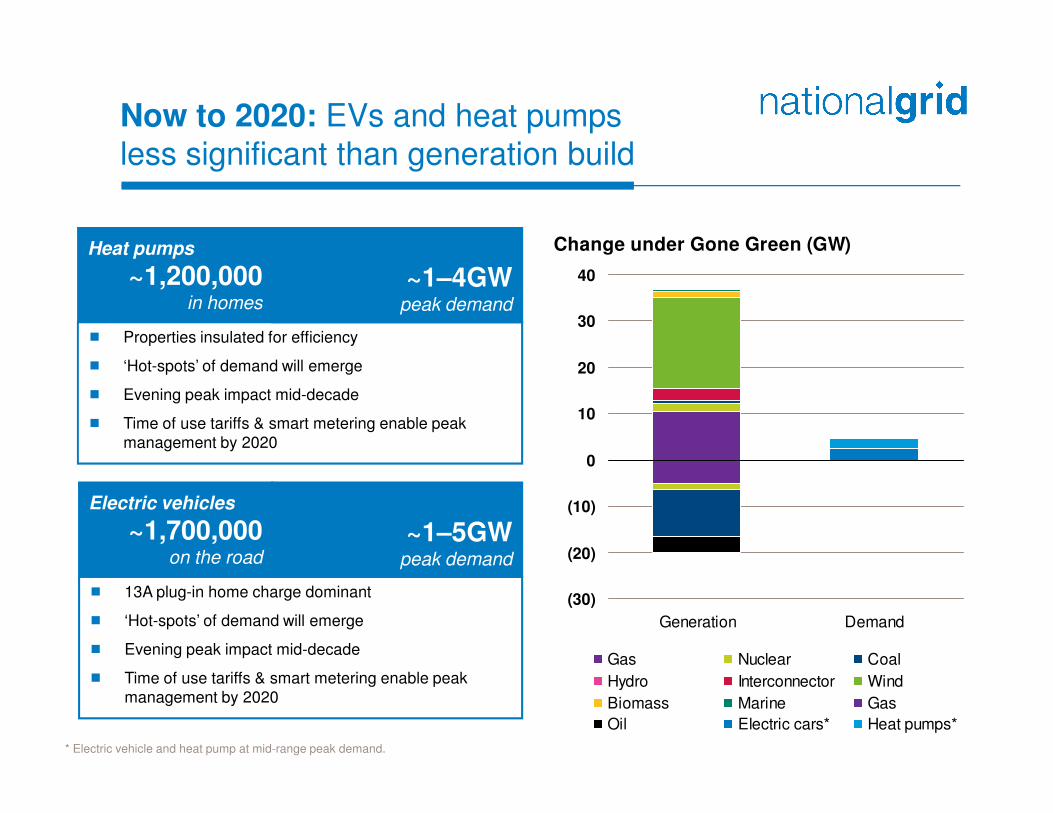
Now to 2020: EVs and heat pumps
less significant than generation build
Change under Gone Green (GW)
10
20
30
40
� Properties insulated for efficiency
� ‘Hot-spots’ of demand will emerge
� Evening peak impact mid-decade
~1–4GWpeak demand
Heat pumps
~1,200,000in homes
11
(30)
(20)
(10)
0
10
Generation Demand
Gas Nuclear Coal
Hydro Interconnector Wind
Biomass Marine Gas
Oil Electric cars* Heat pumps*
~1–5GWpeak demand
Electric vehicles
~1,700,000on the road
� 13A plug-in home charge dominant
� ‘Hot-spots’ of demand will emerge
� Evening peak impact mid-decade
� Time of use tariffs & smart metering enable peak
management by 2020
� Time of use tariffs & smart metering enable peak
management by 2020
* Electric vehicle and heat pump at mid-range peak demand.
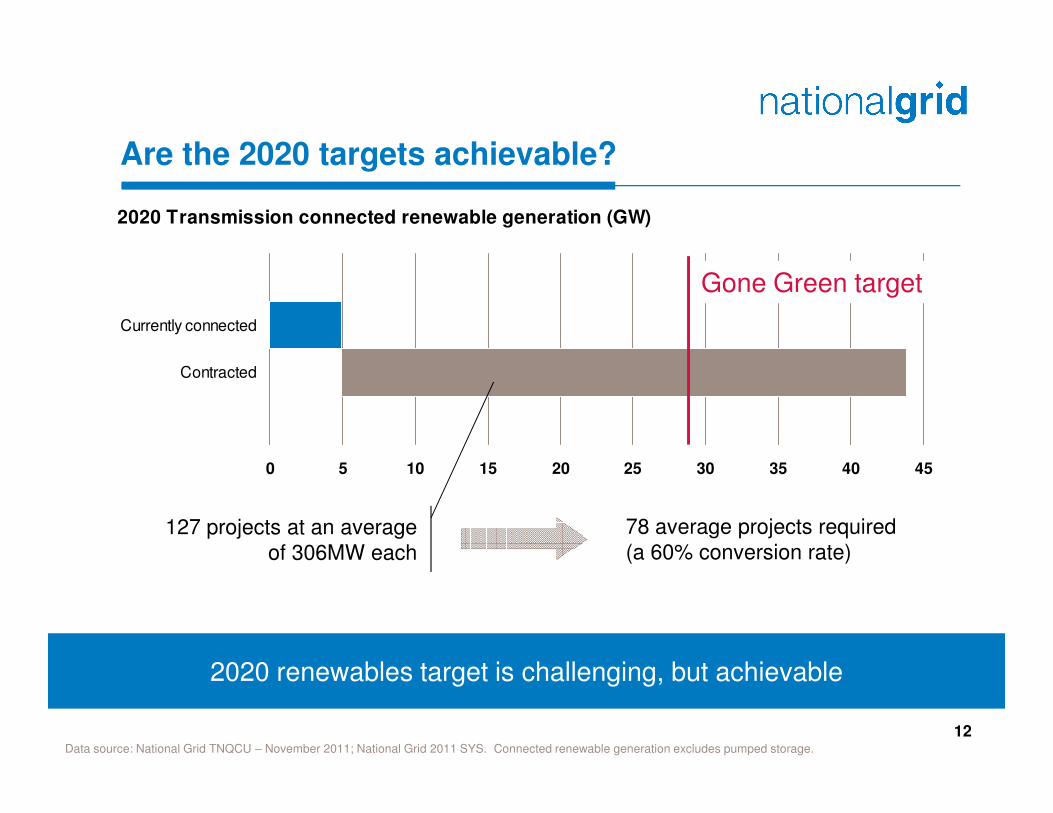
Are the 2020 targets achievable?
2020 Transmission connected renewable generation (GW)
Contracted
Currently connected
Gone Green target
12Data source: National Grid TNQCU – November 2011; National Grid 2011 SYS. Connected renewable generation excludes pumped storage.
0 5 10 15 20 25 30 35 40 45
127 projects at an average
of 306MW each
2020 renewables target is challenging, but achievable
78 average projects required
(a 60% conversion rate)
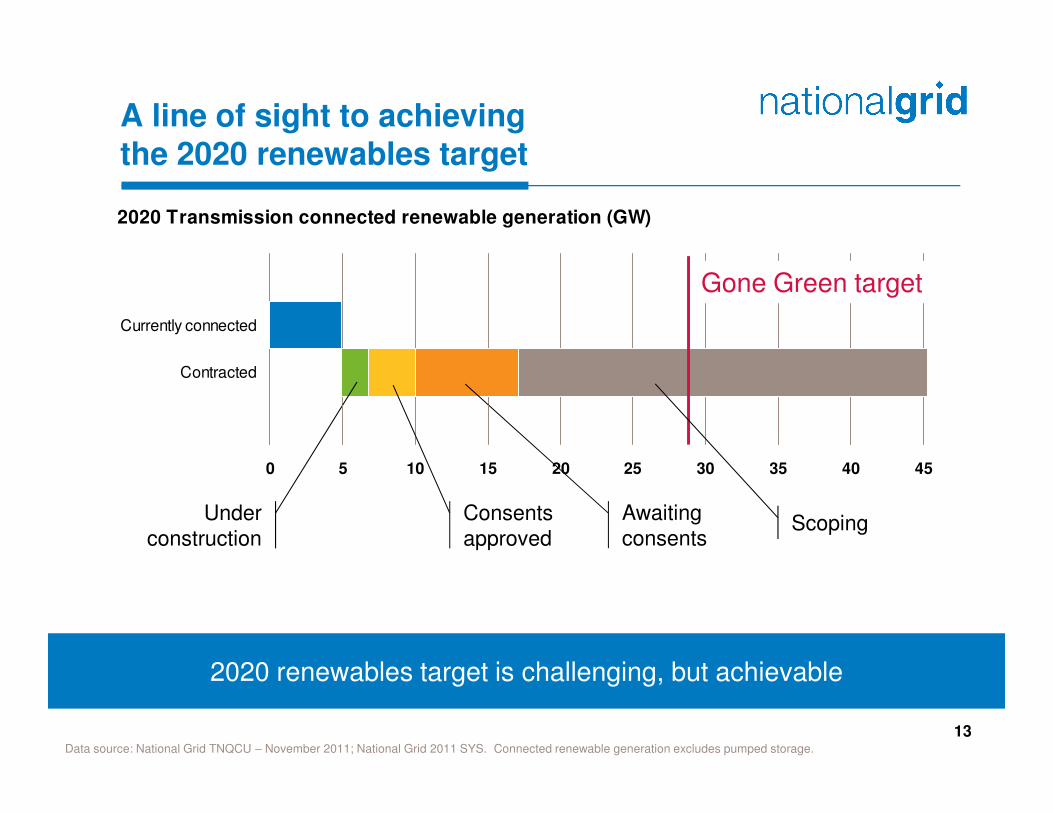
A line of sight to achievingthe 2020 renewables target
2020 Transmission connected renewable generation (GW)
Contracted
Currently connected
Gone Green target
13Data source: National Grid TNQCU – November 2011; National Grid 2011 SYS. Connected renewable generation excludes pumped storage.
0 5 10 15 20 25 30 35 40 45
Under
construction
Awaiting
consentsConsents
approvedScoping
2020 renewables target is challenging, but achievable
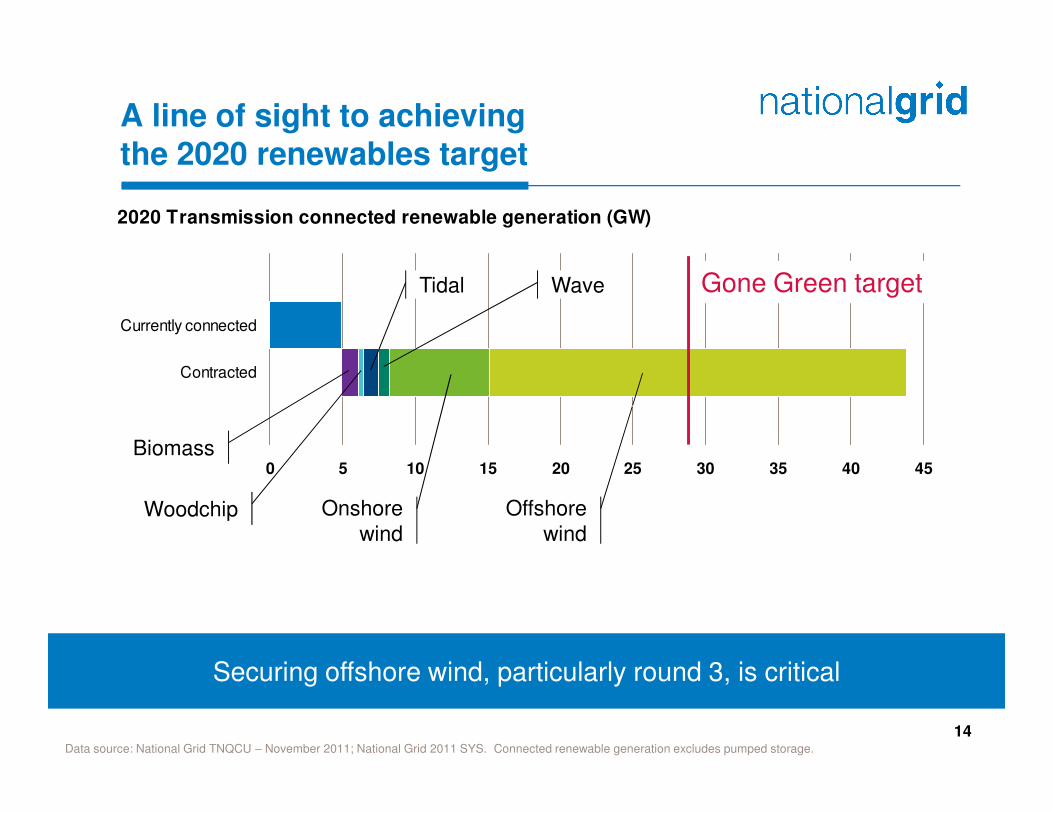
A line of sight to achievingthe 2020 renewables target
2020 Transmission connected renewable generation (GW)
Contracted
Currently connected
Gone Green targetTidal Wave
14Data source: National Grid TNQCU – November 2011; National Grid 2011 SYS. Connected renewable generation excludes pumped storage.
0 5 10 15 20 25 30 35 40 45Biomass
Securing offshore wind, particularly round 3, is critical
Onshore
windWoodchip Offshore
wind
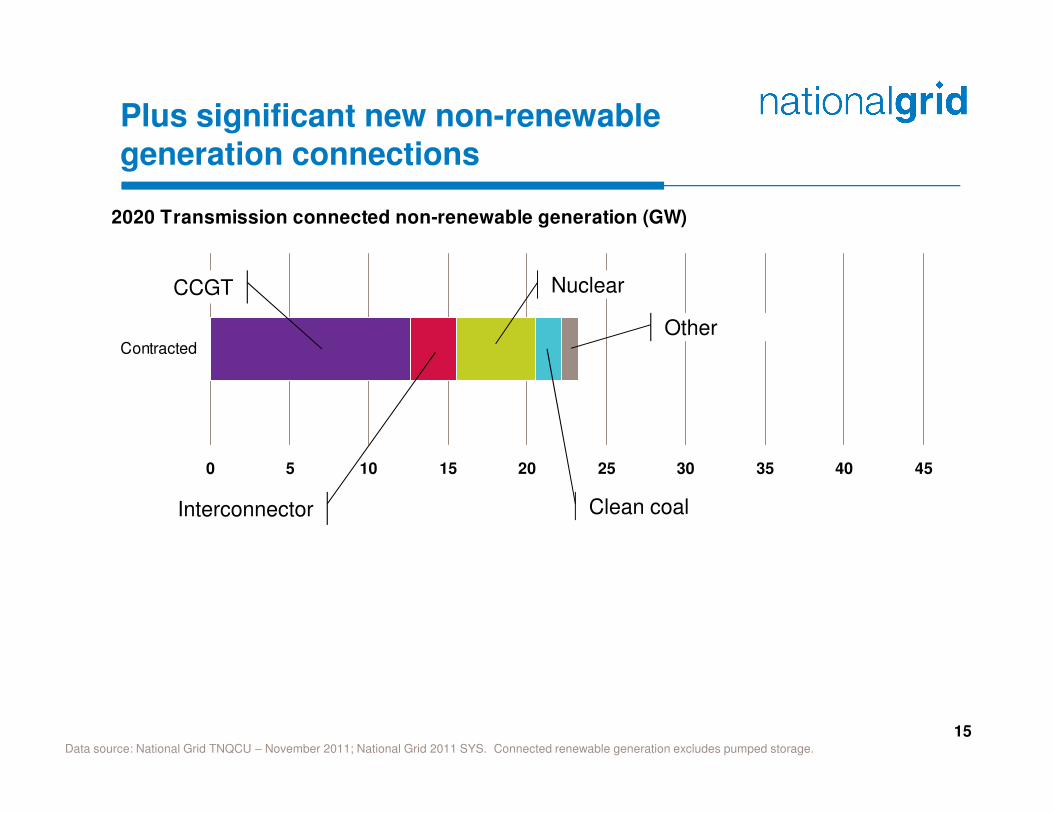
Plus significant new non-renewable generation connections
2020 Transmission connected non-renewable generation (GW)
Contracted
CCGT Nuclear
Other
15Data source: National Grid TNQCU – November 2011; National Grid 2011 SYS. Connected renewable generation excludes pumped storage.
0 5 10 15 20 25 30 35 40 45
Interconnector Clean coal

Cost implications
3,500
4,000
4,500
5,000
5,500
6,000
Me
an
un
dis
co
un
ted
re
al p
ou
nd
s
pe
r p
ers
on
pe
r ye
ar
DECC “do nothing” scenario
16
DECC calculator suggests a number of low carbon scenarios are broadly comparable with a “do nothing” scenario for total energy costs
3,000
3,500
Markal High energy
reduction /High
renewables
High
nuclear /Less
energy
efficiency
Higher CCS
/ more bio-energy
National
Grid (GoneGreen)
Friends of
the Earth
CPRE Mark
Brinkley
Atkins
Me
an
un
dis
co
un
ted
re
al p
ou
nd
s
DECC scenarios Stakeholder scenarios
Data source: DECC 2050 cost calculator: www.decc.gov.uk. Markal is DECC’s economic optimisation tool.
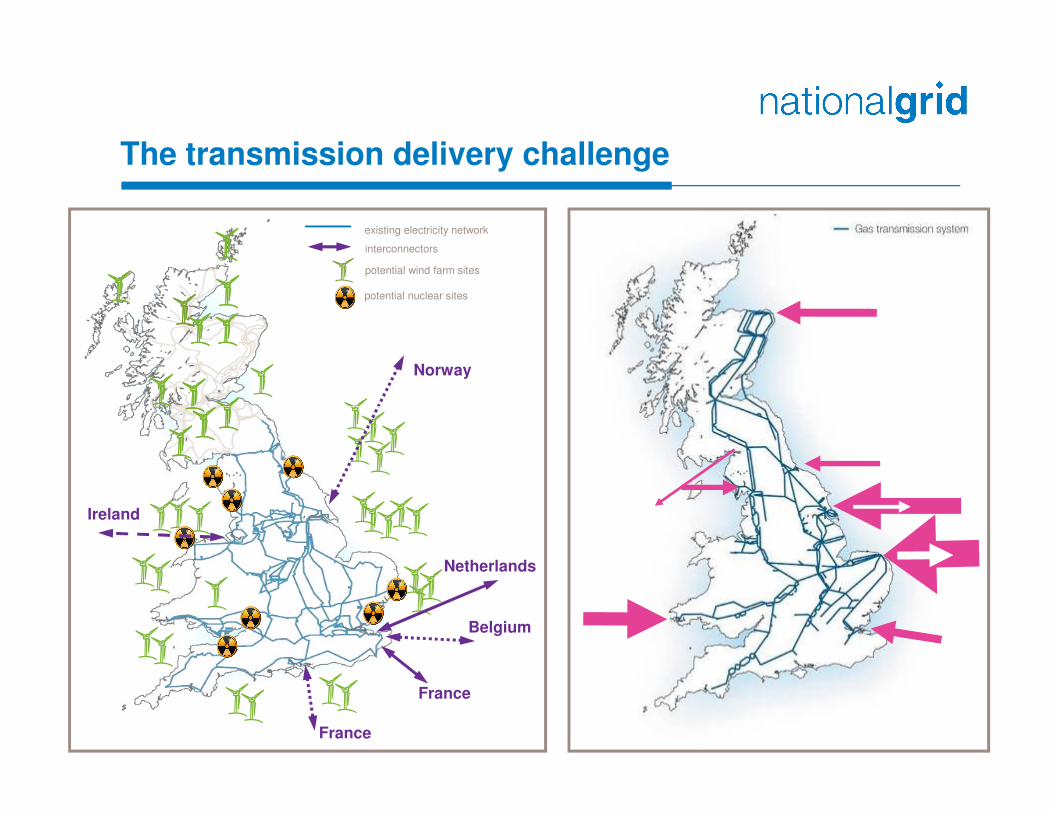
The transmission delivery challenge
existing electricity network
potential wind farm sites
potential nuclear sites
interconnectors
Norway
17
France
France
Netherlands
Belgium
Ireland
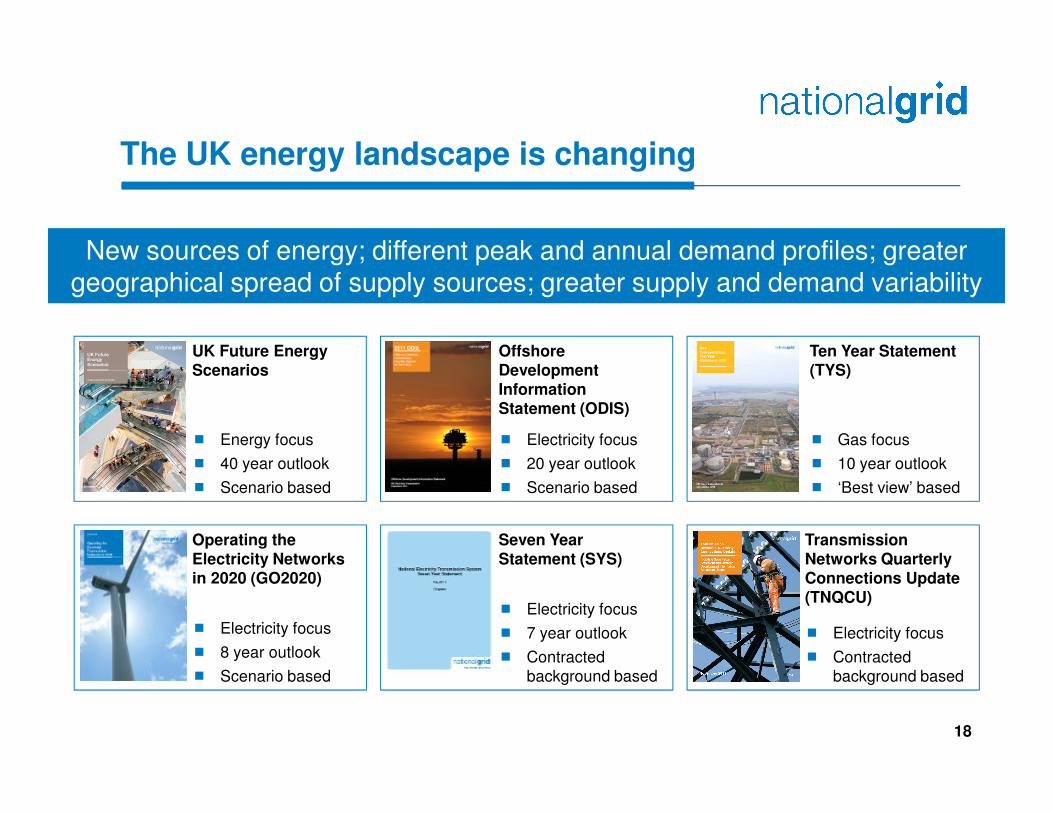
The UK energy landscape is changing
Offshore Development Information Statement (ODIS)
Ten Year Statement (TYS)
New sources of energy; different peak and annual demand profiles; greater geographical spread of supply sources; greater supply and demand variability
UK Future Energy Scenarios
18
Seven Year Statement (SYS)
� Electricity focus
� 7 year outlook
� Contracted
background based
Statement (ODIS)
� Electricity focus
� 20 year outlook
� Scenario based
Transmission Networks Quarterly Connections Update (TNQCU)
� Electricity focus
� Contracted
background based
� Gas focus
� 10 year outlook
� ‘Best view’ based
Operating the Electricity Networks in 2020 (GO2020)
� Electricity focus
� 8 year outlook
� Scenario based
� Energy focus
� 40 year outlook
� Scenario based
Appendix

Our scenarios: Gone Green
Gone Green is constructed such that the renewable energy and carbon emissions targets are always achieved. A ‘bottom-up’ approach is used starting with the finest level of detail practical.
2020 2030
Generation capacity (Tx / Total)* 101GW / 115GW 128GW / 147GW
Renewable generation capacity 36GW 64GW
Low carbon generation capacity** 48GW 94GW
Electric vehicles 1.8m (4TWh) 13.5m (40TWh)
Heat pumps (domestic households) 1.2m (6TWh) 8m (60TWh)
20* Total capacity includes transmission connected generation plus embedded generation** Low carbon generation capacity includes renewable generation capacity plus nuclear and CCS
Transmission connected generation (GW)
0
20
40
60
80
100
120
140
2011
2012
2013
2014
2015
2016
2017
2018
2019
2020
2021
2022
2023
2024
2025
2026
2027
2028
2029
2030
Nuclear Coal Gas Offshore Wind
Onshore Wind Other Renew able Interconnector Other
Summary:
� AGR nuclear plant receives 5yr life extensions beyond the closure
dates in Slow Progression
� First new nuclear plant connects in 2019/20
� The majority of existing coal plant closes by 2023 due to a combination
of the IED and the age of the plant
� 4GW of coal with CCS connects post 2023 in addition to the
Government funded pilot project
� Existing gas-fired plant is assumed to close at around 25 years of age
� A total of 13GW of new conventional CCGT plant connects over the
period
� 7GW of new gas plant with CCS is included in the scenario from 2023
� The build up of wind generation reaches 26GW of wind capacity in
2020 (17GW offshore) and 47GW in 2030 (37GW offshore)
� Marine generation develops more quickly than in the Slow Progression
scenario reaching 4GW in 2030
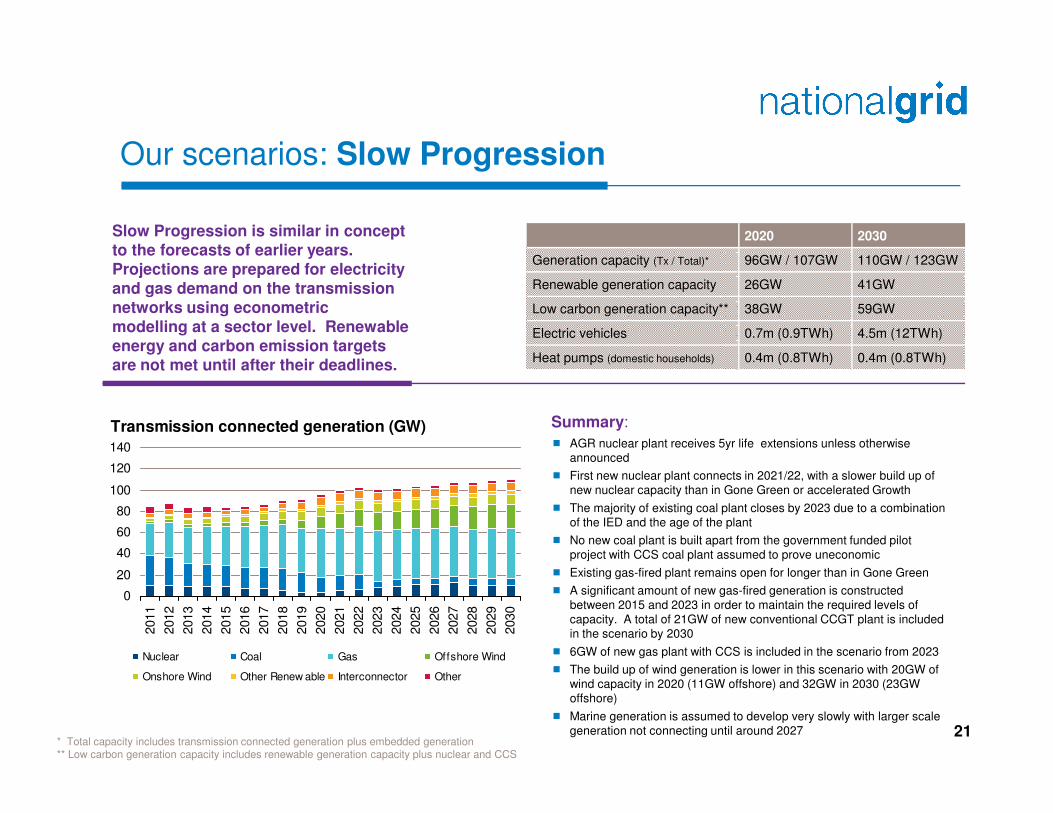
Slow Progression is similar in concept to the forecasts of earlier years. Projections are prepared for electricity and gas demand on the transmission networks using econometric modelling at a sector level. Renewable energy and carbon emission targets are not met until after their deadlines.
Our scenarios: Slow Progression
2020 2030
Generation capacity (Tx / Total)* 96GW / 107GW 110GW / 123GW
Renewable generation capacity 26GW 41GW
Low carbon generation capacity** 38GW 59GW
Electric vehicles 0.7m (0.9TWh) 4.5m (12TWh)
Heat pumps (domestic households) 0.4m (0.8TWh) 0.4m (0.8TWh)
21* Total capacity includes transmission connected generation plus embedded generation** Low carbon generation capacity includes renewable generation capacity plus nuclear and CCS
Transmission connected generation (GW)
0
20
40
60
80
100
120
140
2011
2012
2013
2014
2015
2016
2017
2018
2019
2020
2021
2022
2023
2024
2025
2026
2027
2028
2029
2030
Nuclear Coal Gas Offshore Wind
Onshore Wind Other Renew able Interconnector Other
Summary:
� AGR nuclear plant receives 5yr life extensions unless otherwise
announced
� First new nuclear plant connects in 2021/22, with a slower build up of
new nuclear capacity than in Gone Green or accelerated Growth
� The majority of existing coal plant closes by 2023 due to a combination
of the IED and the age of the plant
� No new coal plant is built apart from the government funded pilot
project with CCS coal plant assumed to prove uneconomic
� Existing gas-fired plant remains open for longer than in Gone Green
� A significant amount of new gas-fired generation is constructed
between 2015 and 2023 in order to maintain the required levels of
capacity. A total of 21GW of new conventional CCGT plant is included
in the scenario by 2030
� 6GW of new gas plant with CCS is included in the scenario from 2023
� The build up of wind generation is lower in this scenario with 20GW of
wind capacity in 2020 (11GW offshore) and 32GW in 2030 (23GW
offshore)
� Marine generation is assumed to develop very slowly with larger scale
generation not connecting until around 2027

Accelerated Growth uses the same demand projections as Gone Green but assumes that offshore generation builds up far more quickly. There is no requirement for extra life extension for nuclear AGR plant as in Gone Green. Renewable energy and carbon emission targets are met early.
Our scenarios: Accelerated Growth
2020 2030
Generation capacity (Tx / Total)* 117GW / 131GW 137GW / 156GW
Renewable generation capacity 51GW 74GW
Low carbon generation capacity** 58GW 100GW
Electric vehicles 1.8m (4TWh) 13.5m (40TWh)
Heat pumps (domestic households) 1.2m (6TWh) 8m (60TWh)
22* Total capacity includes transmission connected generation plus embedded generation** Low carbon generation capacity includes renewable generation capacity plus nuclear and CCS
Transmission connected generation (GW)
0
20
40
60
80
100
120
140
2011
2012
2013
2014
2015
2016
2017
2018
2019
2020
2021
2022
2023
2024
2025
2026
2027
2028
2029
2030
Nuclear Coal Gas Offshore Wind
Onshore Wind Other Renew able Interconnector Other
Summary:
� AGR nuclear plant receives 5yr life extensions unless otherwise
announced
� First new nuclear plant connects in 2019/2020
� Significant amount of new coal plant closes due to a combination of the
IED and the age of the plant
� 4GW of coal with CCS connects post 2023 in addition to the
Government funded pilot project
� Existing gas-fired plant remains open longer as a back-up for the
significant amount of wind capacity
� A total of 13GW of new conventional CCGT plant connects over the
period
� 5GW of new gas plant with CCS is included in the scenario from 2023
� The build up of wind generation reaches 42GW of wind capacity in
2020 (33GW offshore) and 59GW in 2030 (49GW offshore)
� Marine generation develops at a slightly quicker rate than in the Gone
Green scenario albeit reaching around the same level in 2030

Where will our gas come from?
60%
80%
100%
Sources of gaschange significantly
Day to day variabilitycould increase
60%
80%
100%
23
0%
20%
40%
60%
2010/11 2020/21
UKCS Norway LNG
Continent Unconventional
0%
20%
40%
60%
Avg. Sep. 2010 Avg. Dec. 2010
UKCS Norway LNG
Continent Unconventional Storage

The regional transmission challenge
DENMARK
NORWAY
24
Nemo
BELGIUM,
FRANCE
THE NETHERLANDS,
GERMANY


