Uncertainty in Forecasting Uncertainty in Forecasting Uncertainty in Forecasting Uncertainty in Forecasting Jeff Tayman 1 COG/MPO Modeling Conference, July 17, 2009, San Diego, CA SANDAG Emeritus and Department of Economics, UCSD
Transcript
Uncertainty in ForecastingUncertainty in ForecastingUncertainty in ForecastingUncertainty in Forecasting
Jeff Tayman
1COG/MPO Modeling Conference, July 17, 2009, San Diego, CA
2.2. Value of understanding forecast uncertaintyValue of understanding forecast uncertainty
3.3. Characteristics of forecast uncertaintyCharacteristics of forecast uncertainty
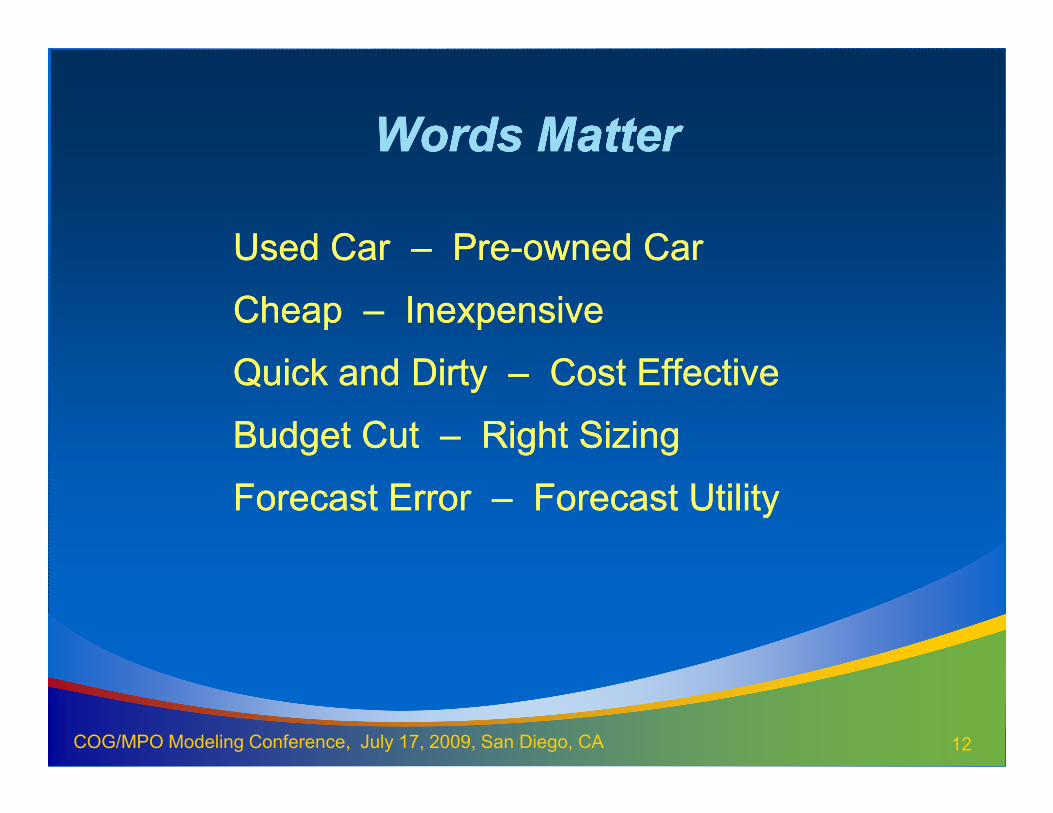
4.4. Words MatterWords Matter-- Forecast error versus utilityForecast error versus utility
2COG/MPO Modeling Conference, July 17, 2009, San Diego, CA
4.4. Words MatterWords Matter-- Forecast error versus utilityForecast error versus utility
5.5. Current approaches to forecast uncertaintyCurrent approaches to forecast uncertainty
6.6. Survey of state and regional agenciesSurvey of state and regional agencies
Key Points Key Points Key Points Key Points
•• Knowledge of the behavior of forecast Knowledge of the behavior of forecast uncertainty is important for users and uncertainty is important for users and producers of forecastsproducers of forecasts
•• Characteristics of forecast uncertainty is known Characteristics of forecast uncertainty is known for states and counties; information for for states and counties; information for subcounty areas lackingsubcounty areas lacking
3COG/MPO Modeling Conference, July 17, 2009, San Diego, CA
•• Options for incorporating uncertainty into Options for incorporating uncertainty into forecasts vary in resource requirements and forecasts vary in resource requirements and political sensitivitypolitical sensitivity
•• 96% of state and regional agencies surveyed 96% of state and regional agencies surveyed currently or plan to incorporate uncertainty into currently or plan to incorporate uncertainty into their forecaststheir forecasts
•• Forecasting is impossible yet unavoidableForecasting is impossible yet unavoidable
•• Forecasts are needed for decisionForecasts are needed for decision--making and making and must be in the form of numbersmust be in the form of numbers
•• Forecasts invariably turn out to be different Forecasts invariably turn out to be different
4COG/MPO Modeling Conference, July 17, 2009, San Diego, CA
•• Forecasts invariably turn out to be different Forecasts invariably turn out to be different than the numbers that occur than the numbers that occur
•• Users demand that forecasts meet standards Users demand that forecasts meet standards of accuracy that exceed those commonly of accuracy that exceed those commonly accepted as reasonable by forecasters accepted as reasonable by forecasters
Value of UnderstandingValue of Understanding
Forecast UncertaintyForecast Uncertainty
Value of UnderstandingValue of Understanding
Forecast UncertaintyForecast Uncertainty
•• Forecasting is an uncertain businessForecasting is an uncertain business
•• Presence of uncertainty is inherent in Presence of uncertainty is inherent in management or policy decisions management or policy decisions
•• Make forecasts more valuable to planners, Make forecasts more valuable to planners,
5COG/MPO Modeling Conference, July 17, 2009, San Diego, CA
•• Make forecasts more valuable to planners, Make forecasts more valuable to planners, policy makers, and the public policy makers, and the public
•• Better decisions regarding potential costs and Better decisions regarding potential costs and benefits that rely on forecasts benefits that rely on forecasts
•• Improve forecasting methods and processesImprove forecasting methods and processes
General Characteristics of General Characteristics of
Forecast Error and UncertaintyForecast Error and Uncertainty
6COG/MPO Modeling Conference, July 17, 2009, San Diego, CA
Forecast Error and UncertaintyForecast Error and Uncertainty
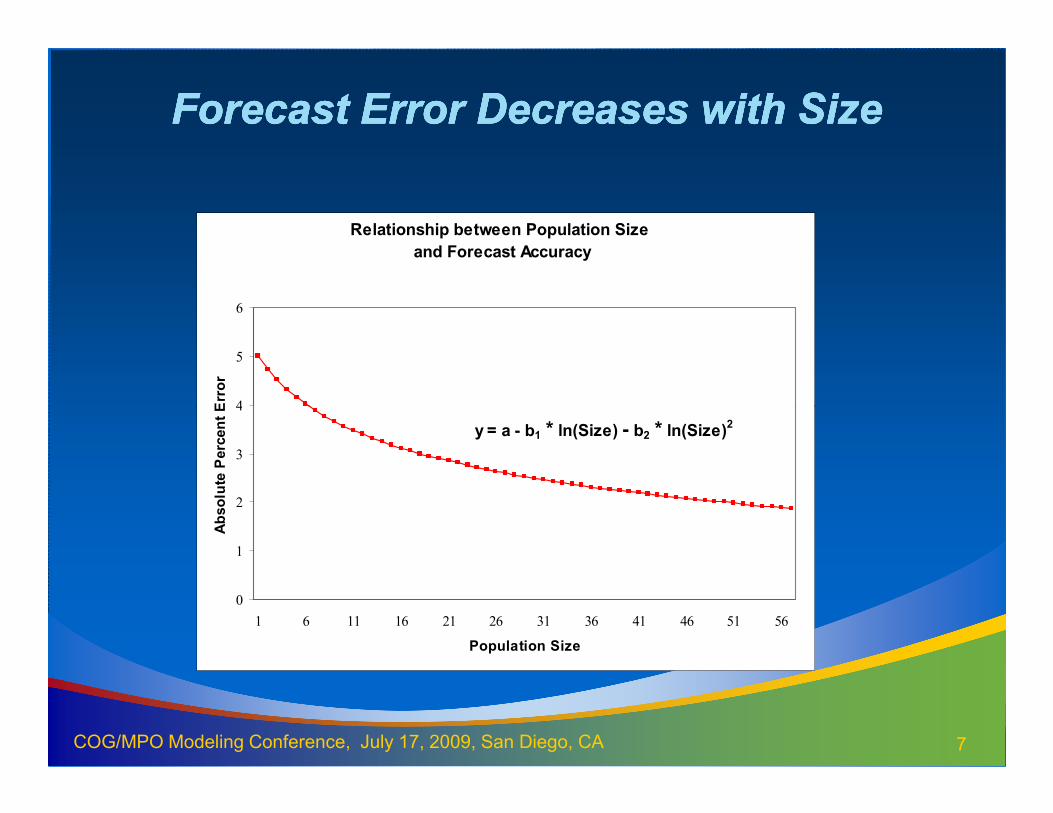
Forecast Error Decreases with SizeForecast Error Decreases with SizeForecast Error Decreases with SizeForecast Error Decreases with Size
Relationship between Population Size
and Forecast Accuracy
4
5
6
Absolute Percent Error
7COG/MPO Modeling Conference, July 17, 2009, San Diego, CA
0
1
2
3
4
1 6 11 16 21 26 31 36 41 46 51 56
Population Size
Absolute Percent Error
y = a - b1 * ln(Size) - b2 * ln(Size)2
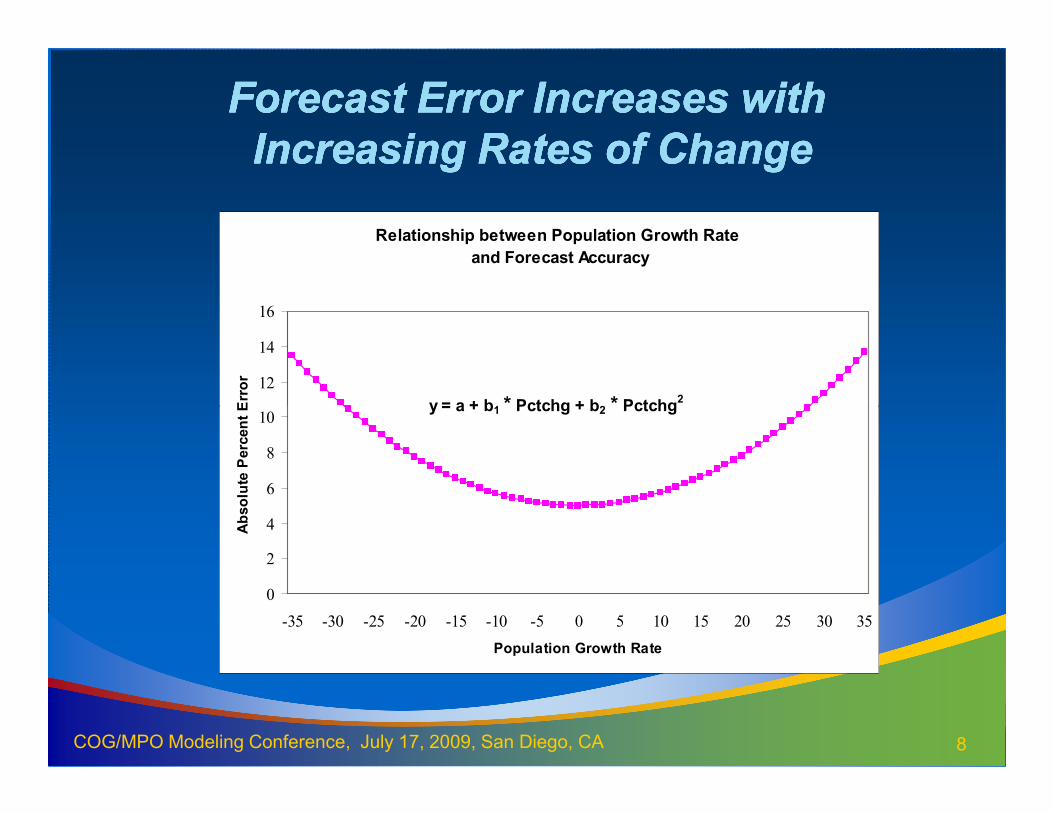
Forecast Error Increases withForecast Error Increases with
Increasing Rates of ChangeIncreasing Rates of Change
Forecast Error Increases withForecast Error Increases with
Increasing Rates of ChangeIncreasing Rates of Change
Relationship between Population Growth Rate
and Forecast Accuracy
12
14
16
Absolute Percent Error
y = a + b1 * Pctchg + b2 * Pctchg2
8COG/MPO Modeling Conference, July 17, 2009, San Diego, CA
0
2
4
6
8
10
-35 -30 -25 -20 -15 -10 -5 0 5 10 15 20 25 30 35
Population Growth Rate
Absolute Percent Error
y = a + b1 * Pctchg + b2 * Pctchg
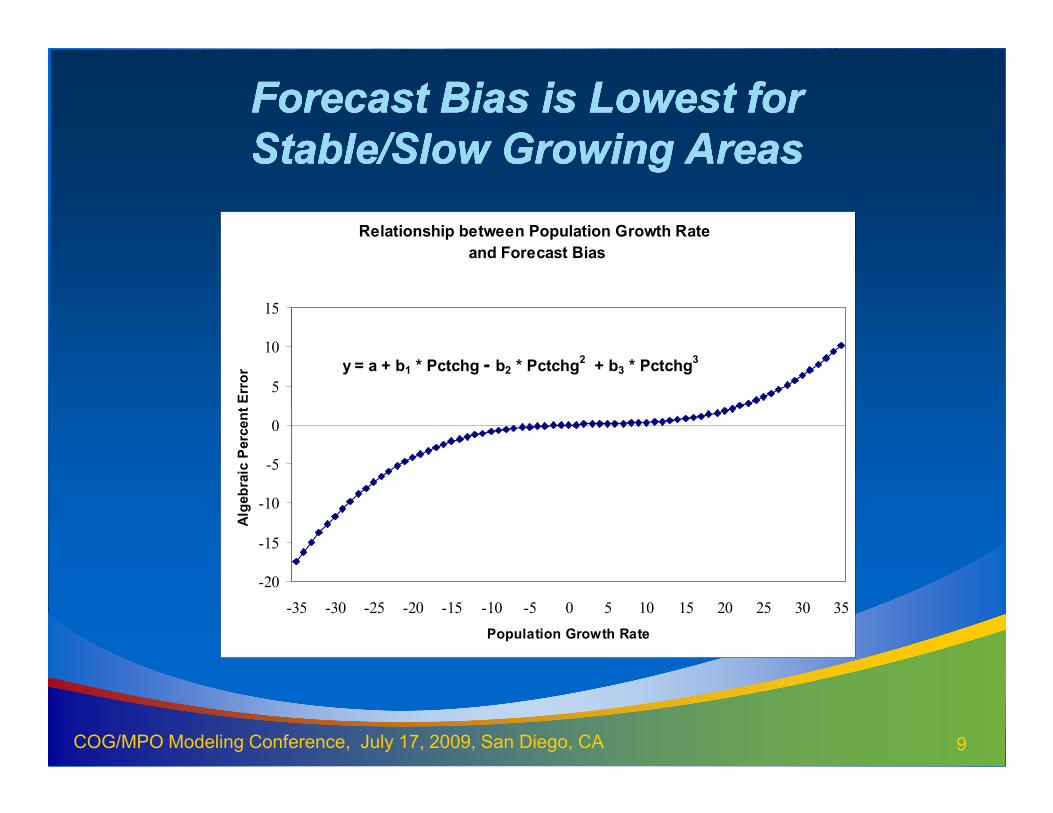
Forecast Bias is Lowest for Forecast Bias is Lowest for
Stable/Slow Growing AreasStable/Slow Growing Areas
Forecast Bias is Lowest for Forecast Bias is Lowest for
Stable/Slow Growing AreasStable/Slow Growing Areas
Relationship between Population Growth Rate
and Forecast Bias
5
10
15
Algebraic Percent Error y = a + b1 * Pctchg - b2 * Pctchg
2 + b3 * Pctchg
3
9COG/MPO Modeling Conference, July 17, 2009, San Diego, CA
-20
-15
-10
-5
0
-35 -30 -25 -20 -15 -10 -5 0 5 10 15 20 25 30 35
Population Growth Rate
Algebraic Percent Error
Complex Methods Do Not Complex Methods Do Not
Out Perform Simpler MethodsOut Perform Simpler Methods
Complex Methods Do Not Complex Methods Do Not
Out Perform Simpler MethodsOut Perform Simpler Methods
Average Error Across Age Groups
StatesLaunch Year
Target Year MAPE MALPE
CCM 7.7 3.6
HP 7.0 2.3
CCM 12.6 -0.1
HP 10.7 -1.3
1980 1990
1980 2000
10COG/MPO Modeling Conference, July 17, 2009, San Diego, CA
CCM 4.9 -1.6
HP 5.6 -2.3
Florida Counties
Launch Year
Target Year MAPE MALPE
CCM 10.4 0.4
HP 10.6 0.7
CCM 15.2 -5.7
HP 15.4 -5.0
CCM 10.9 -3.8
HP 9.5 -3.8
1990 2000
1980 1990
1980 2000
1990 2000
S. Smith and J. Tayman. 2003. An Evaluation of Population Projections by Age. Demography 40: 741-757
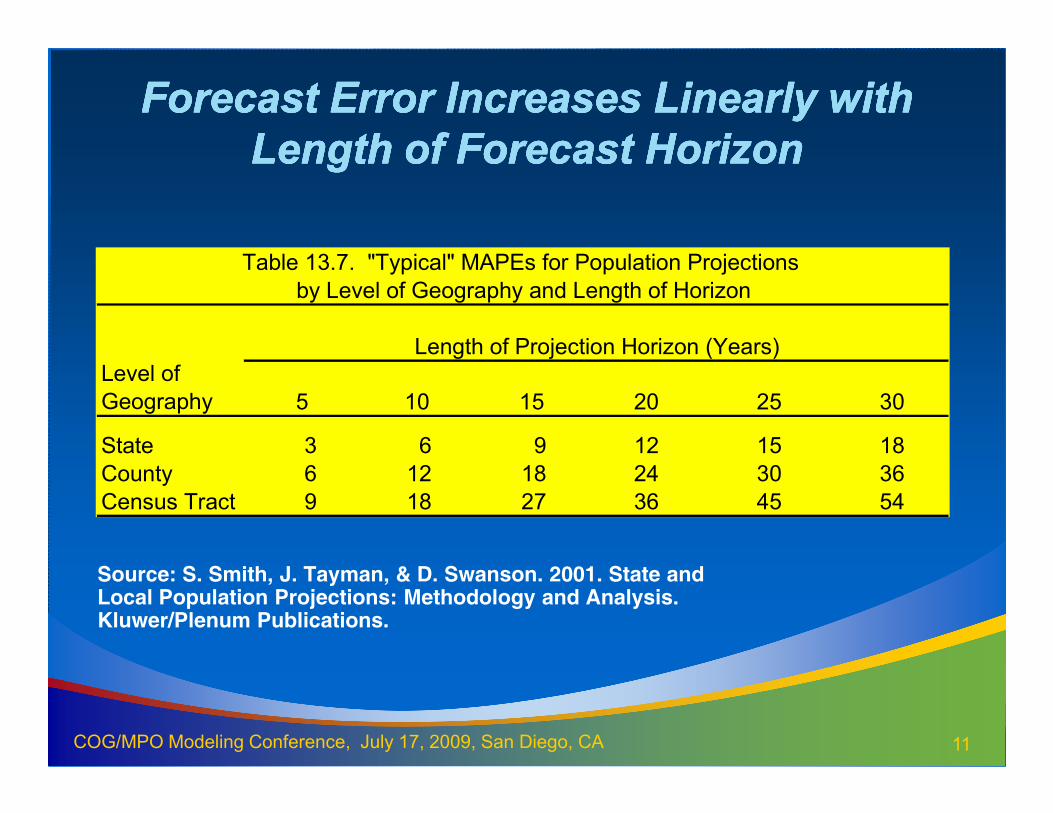
Forecast Error Increases Linearly with Forecast Error Increases Linearly with
Length of Forecast HorizonLength of Forecast Horizon
Forecast Error Increases Linearly with Forecast Error Increases Linearly with
Length of Forecast HorizonLength of Forecast Horizon
Table 13.7. "Typical" MAPEs for Population Projections
by Level of Geography and Length of Horizon
Length of Projection Horizon (Years)Level of
Geography 5 10 15 20 25 30
11COG/MPO Modeling Conference, July 17, 2009, San Diego, CA
Geography 5 10 15 20 25 30
State 3 6 9 12 15 18
County 6 12 18 24 30 36
Census Tract 9 18 27 36 45 54
Source: S. Smith, J. Tayman, & D. Swanson. 2001. State and Local Population Projections: Methodology and Analysis. Kluwer/Plenum Publications.
Words MatterWords MatterWords MatterWords Matter
Used Car Used Car –– PrePre--owned Carowned Car
Cheap Cheap –– InexpensiveInexpensive
Quick and Dirty Quick and Dirty –– Cost EffectiveCost Effective
12COG/MPO Modeling Conference, July 17, 2009, San Diego, CA
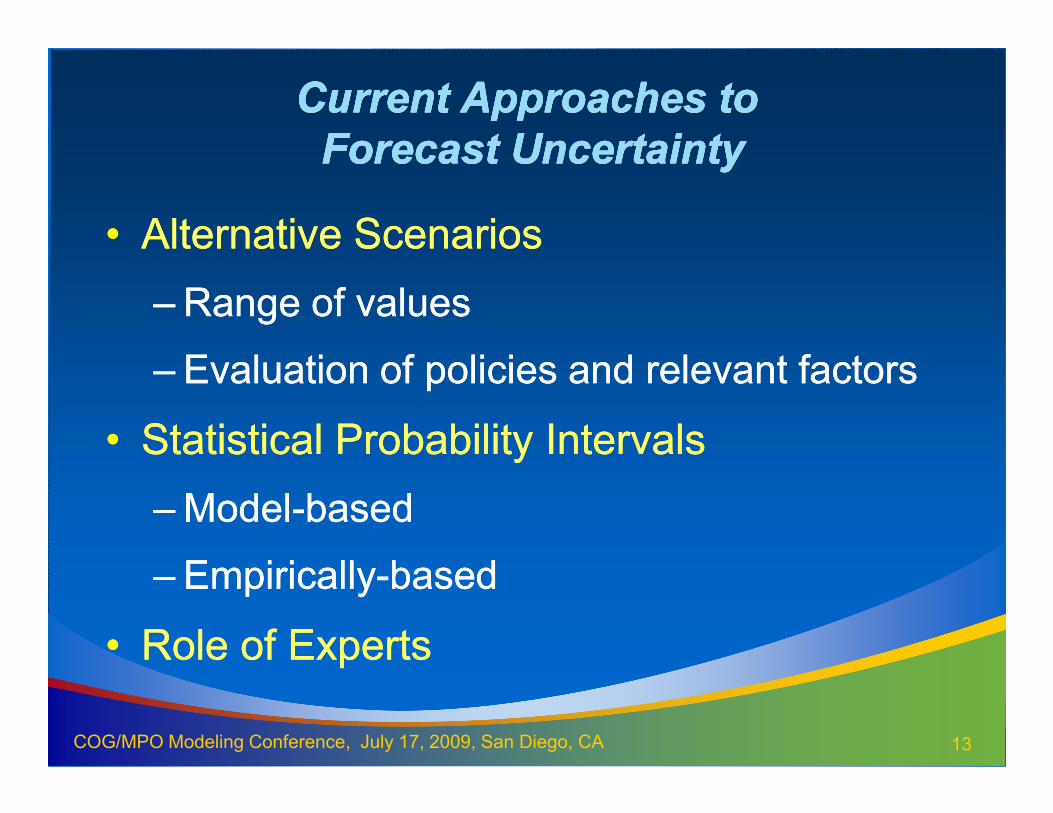
–– Evaluation of policies and relevant factorsEvaluation of policies and relevant factors
13COG/MPO Modeling Conference, July 17, 2009, San Diego, CA
•• Statistical Probability IntervalsStatistical Probability Intervals
––ModelModel--basedbased
–– EmpiricallyEmpirically--basedbased
•• Role of ExpertsRole of Experts
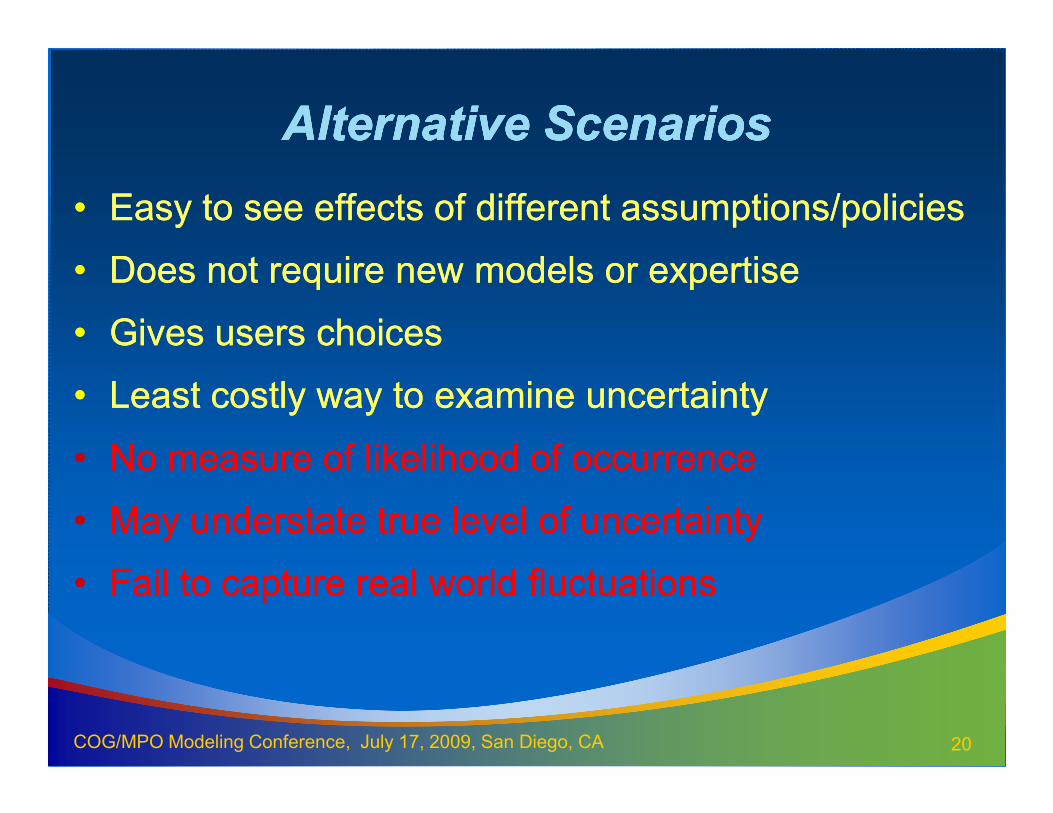
Alternative ScenariosAlternative Scenarios
14COG/MPO Modeling Conference, July 17, 2009, San Diego, CA
Alternative ScenariosAlternative Scenarios
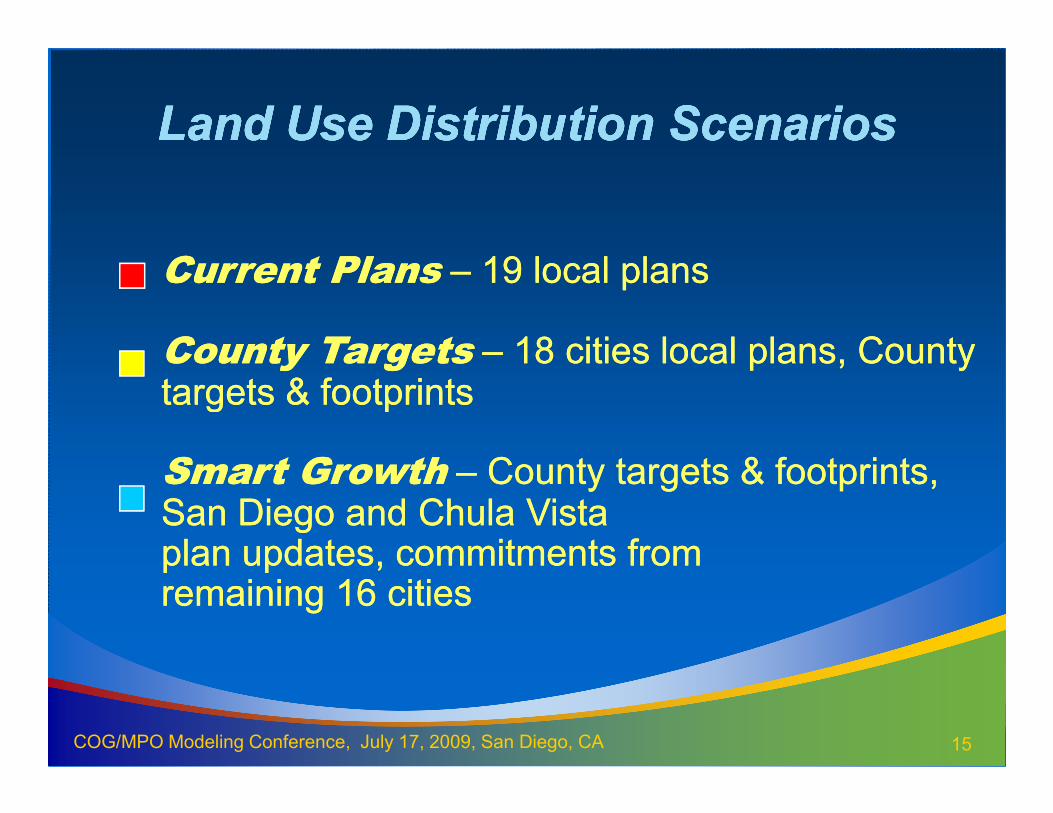
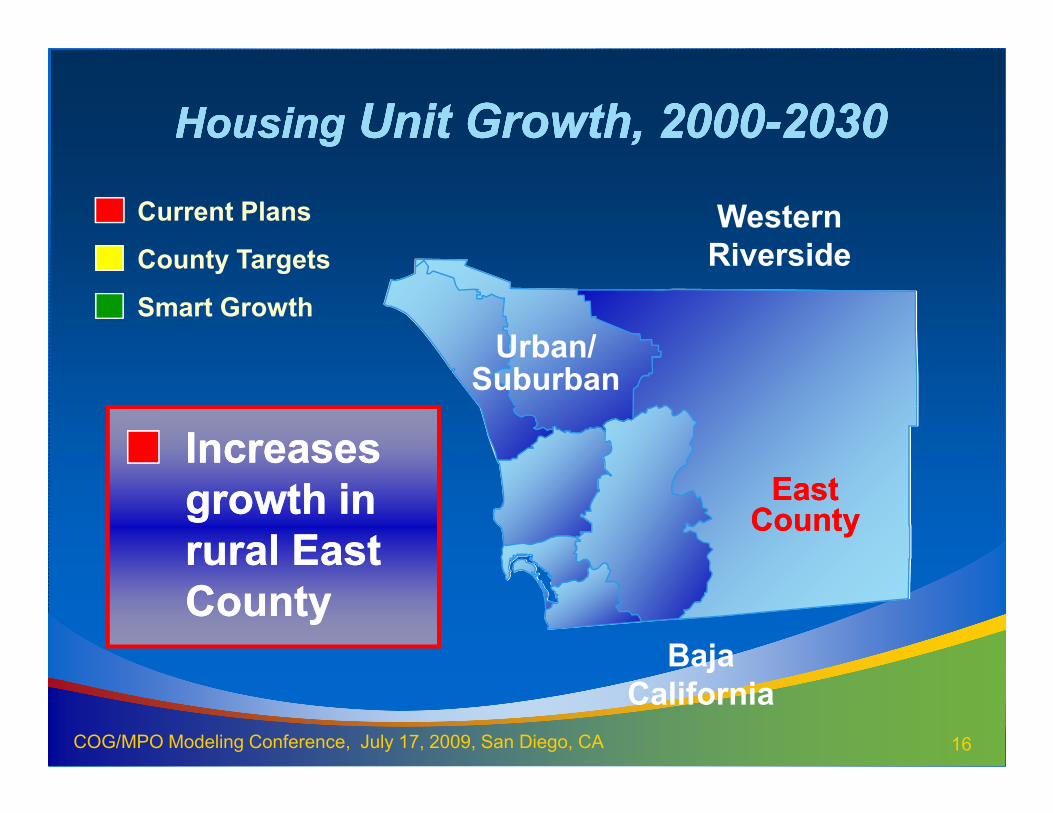
Land Use Distribution ScenariosLand Use Distribution ScenariosLand Use Distribution ScenariosLand Use Distribution Scenarios
Current PlansCurrent Plans –– 19 local plans19 local plans
County TargetsCounty Targets –– 18 cities local plans, County 18 cities local plans, County targets & footprintstargets & footprints
15COG/MPO Modeling Conference, July 17, 2009, San Diego, CA
targets & footprintstargets & footprints
Smart GrowthSmart Growth –– County targets & footprints, County targets & footprints, San Diego and Chula VistaSan Diego and Chula Vistaplan updates, commitments fromplan updates, commitments fromremaining 16 citiesremaining 16 cities
HousingHousing Unit Growth, 2000Unit Growth, 2000--20302030HousingHousing Unit Growth, 2000Unit Growth, 2000--20302030
Urban/Suburban
WesternRiverside
Current Plans
County Targets
Smart Growth
16COG/MPO Modeling Conference, July 17, 2009, San Diego, CA
BajaCalifornia
EastEastCountyCounty
IncreasesIncreasesgrowth in growth in rural East rural East CountyCounty
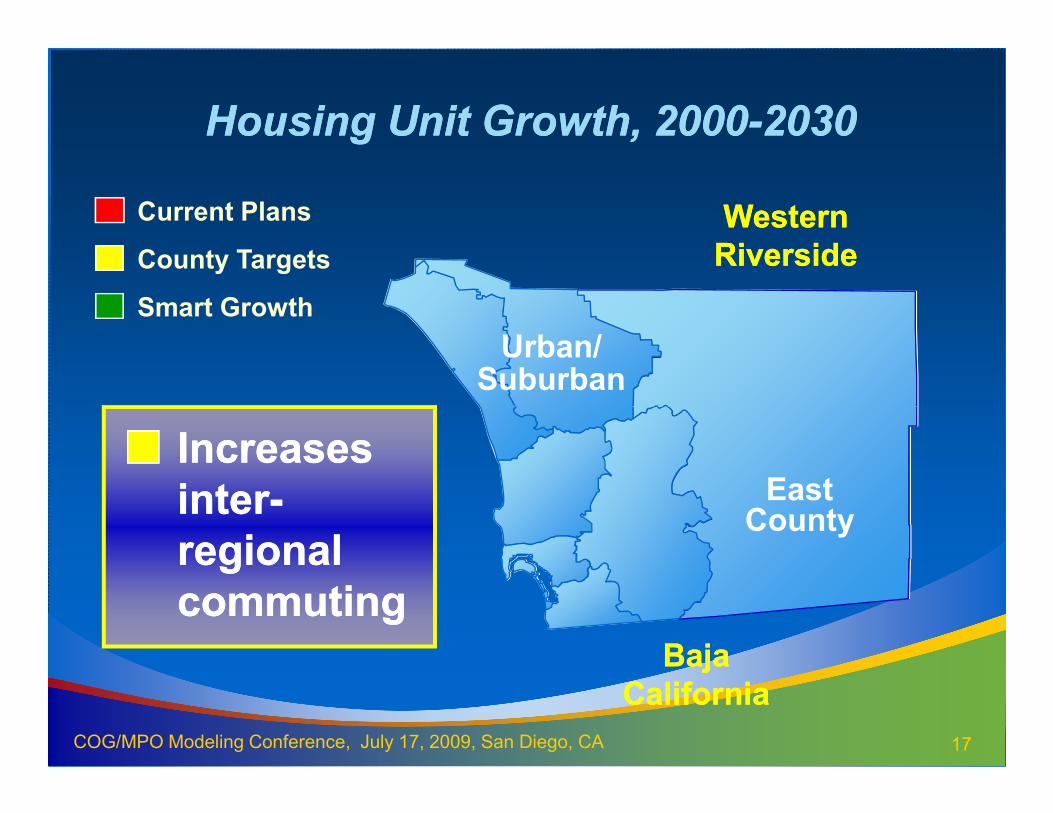
Housing Unit Growth, 2000Housing Unit Growth, 2000--20302030
Urban/Suburban
WesternWesternRiversideRiverside
Current Plans
County Targets
Smart Growth
17COG/MPO Modeling Conference, July 17, 2009, San Diego, CA
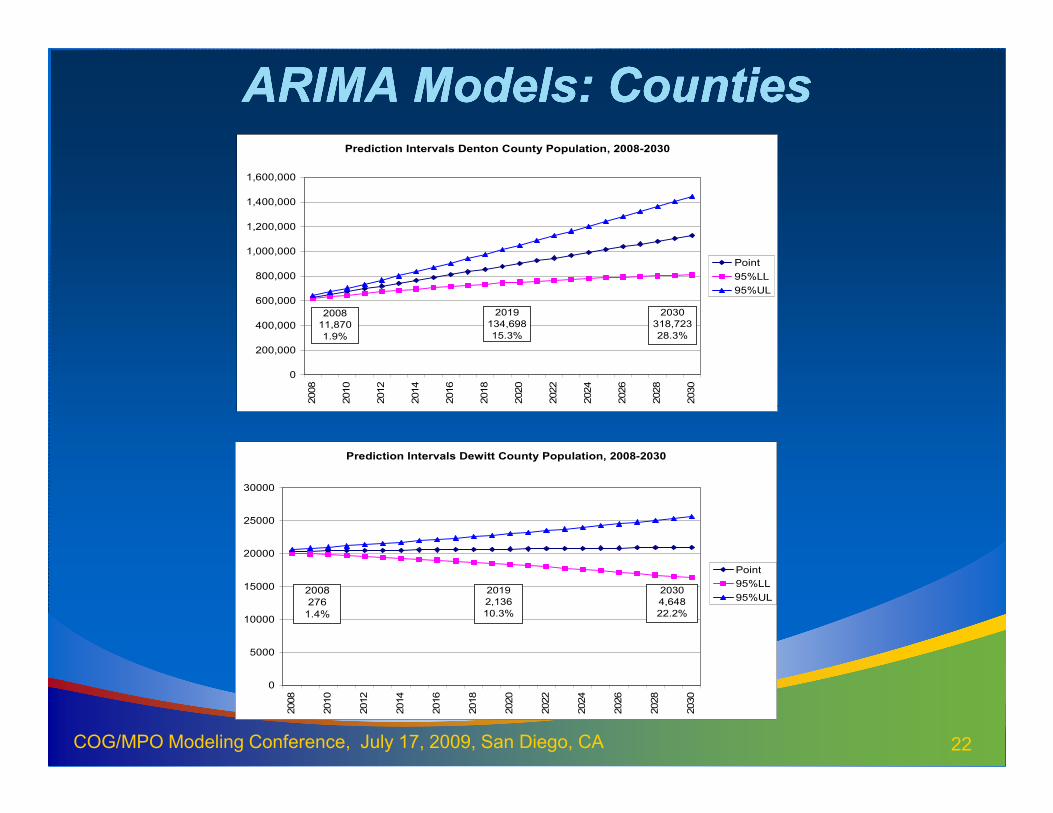
J. Tayman, S. Smith, & J. Lin. 2007. Precision, Bias, and Uncertainty for State Population Forecasts: An Exploratory Analysis of Time Series Models. Population Research and Policy Review 26: 347-369
ModelModel--Based Probability IntervalsBased Probability IntervalsModelModel--Based Probability IntervalsBased Probability Intervals
•• Provide explicit probability statements to measure Provide explicit probability statements to measure forecast uncertaintyforecast uncertainty
•• Intervals often exceed low and high ranges; Intervals often exceed low and high ranges; provide an important reality checkprovide an important reality check
•• Valid only to extent underlying assumptions holdValid only to extent underlying assumptions hold
•• Models are complex; require expertise beyond inModels are complex; require expertise beyond in--
24COG/MPO Modeling Conference, July 17, 2009, San Diego, CA
•• Models are complex; require expertise beyond inModels are complex; require expertise beyond in--house capabilities; users find difficult to house capabilities; users find difficult to understandunderstand
•• Alternate models imply different levels of Alternate models imply different levels of uncertaintyuncertainty
•• Netherlands only agency using probabilistic Netherlands only agency using probabilistic intervals in official projectionsintervals in official projections
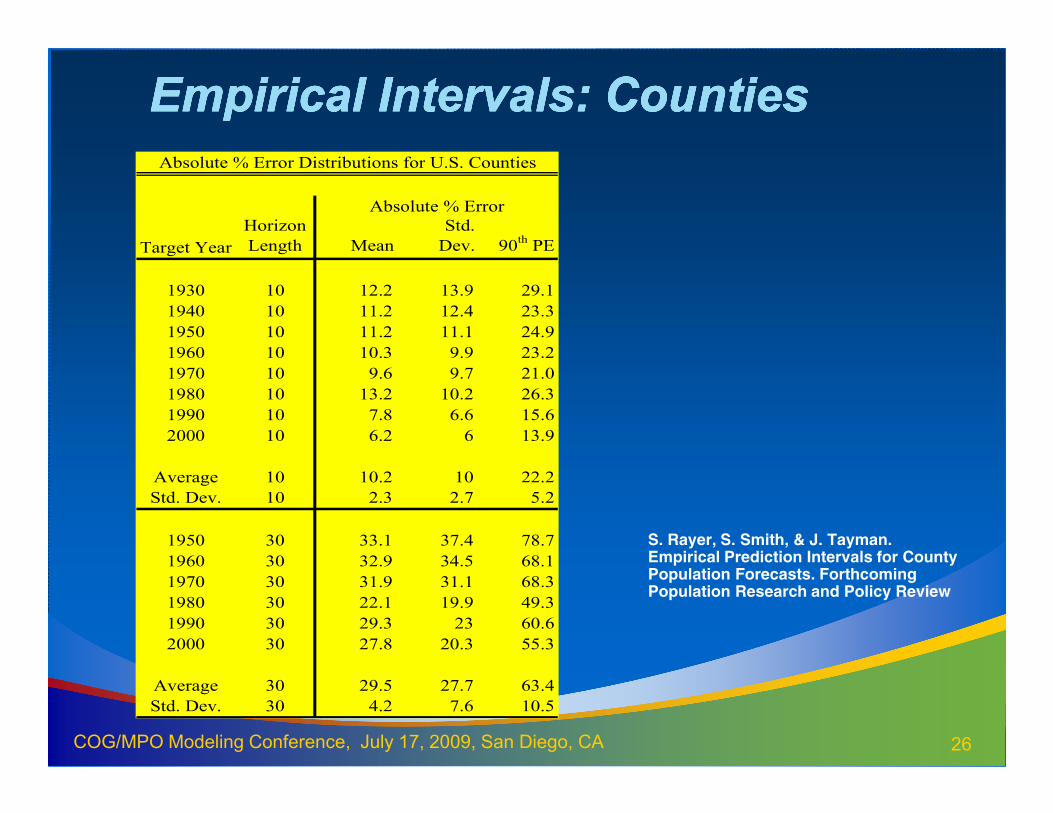
EmpiricallyEmpirically--Based Probability IntervalsBased Probability Intervals
25COG/MPO Modeling Conference, July 17, 2009, San Diego, CA
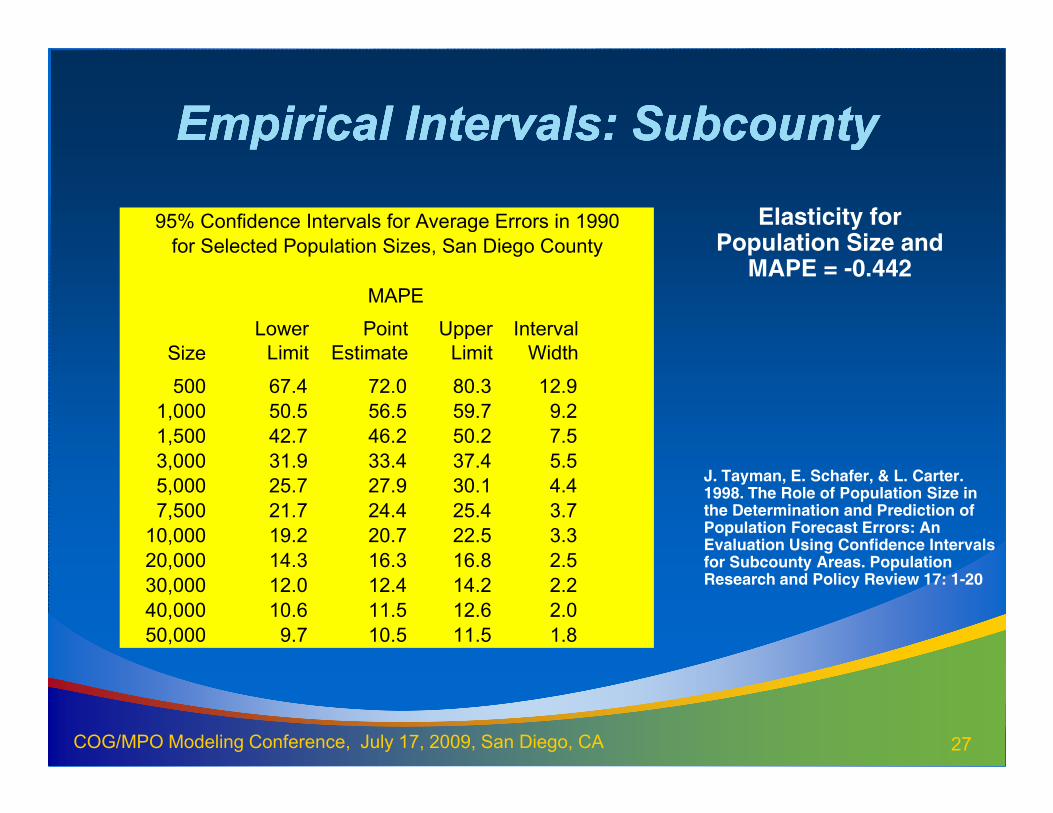
EmpiricallyEmpirically--Based Probability IntervalsBased Probability Intervals
95% Confidence Intervals for Average Errors in 1990
for Selected Population Sizes, San Diego County
MAPE
SizeLower Limit
Point Estimate
Upper Limit
Interval Width
500 67.4 72.0 80.3 12.9
1,000 50.5 56.5 59.7 9.2
Elasticity for Population Size and
MAPE = -0.442
27COG/MPO Modeling Conference, July 17, 2009, San Diego, CA
1,000 50.5 56.5 59.7 9.2
1,500 42.7 46.2 50.2 7.5
3,000 31.9 33.4 37.4 5.5
5,000 25.7 27.9 30.1 4.4
7,500 21.7 24.4 25.4 3.7
10,000 19.2 20.7 22.5 3.3
20,000 14.3 16.3 16.8 2.5
30,000 12.0 12.4 14.2 2.2
40,000 10.6 11.5 12.6 2.0
50,000 9.7 10.5 11.5 1.8
J. Tayman, E. Schafer, & L. Carter. 1998. The Role of Population Size in the Determination and Prediction of Population Forecast Errors: An Evaluation Using Confidence Intervals for Subcounty Areas. Population Research and Policy Review 17: 1-20
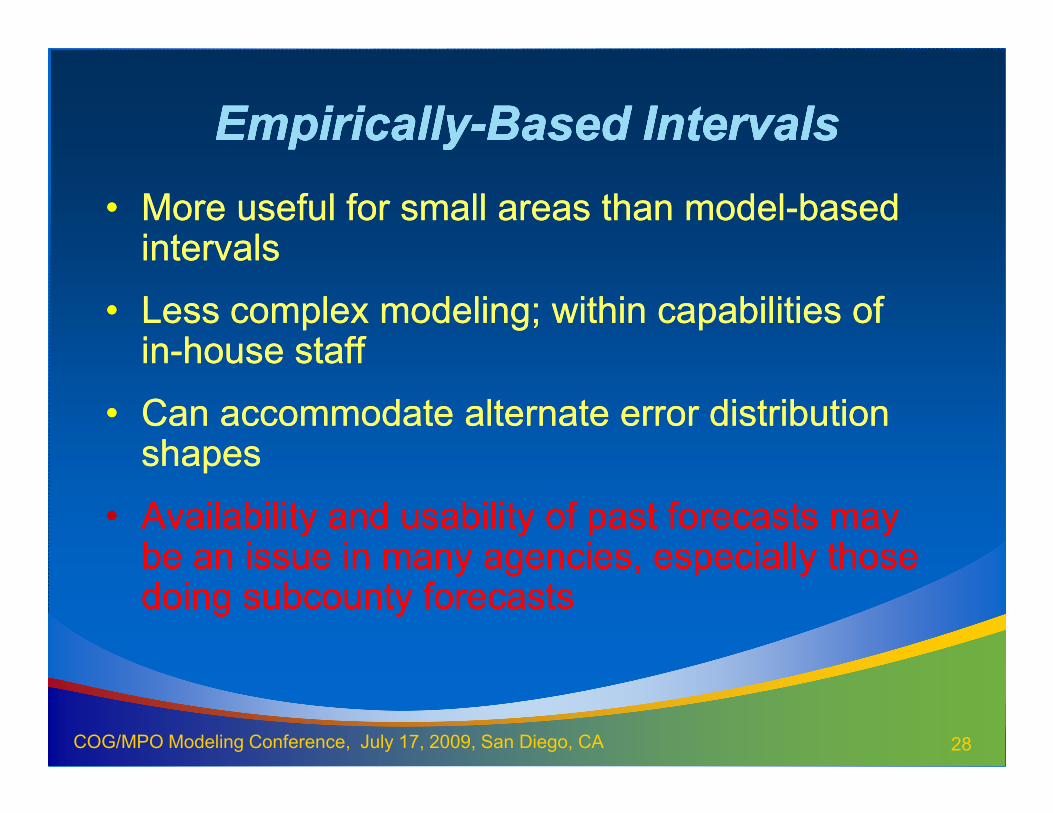
•• More useful for small areas than modelMore useful for small areas than model--based based intervalsintervals
•• Less complex modeling; within capabilities of Less complex modeling; within capabilities of inin--house staffhouse staff
•• Can accommodate alternate error distribution Can accommodate alternate error distribution
28COG/MPO Modeling Conference, July 17, 2009, San Diego, CA
•• Can accommodate alternate error distribution Can accommodate alternate error distribution shapesshapes
•• Availability and usability of past forecasts may Availability and usability of past forecasts may be an issue in many agencies, especially those be an issue in many agencies, especially those doing subcounty forecastsdoing subcounty forecasts
Expert PanelsExpert Panels
29COG/MPO Modeling Conference, July 17, 2009, San Diego, CA
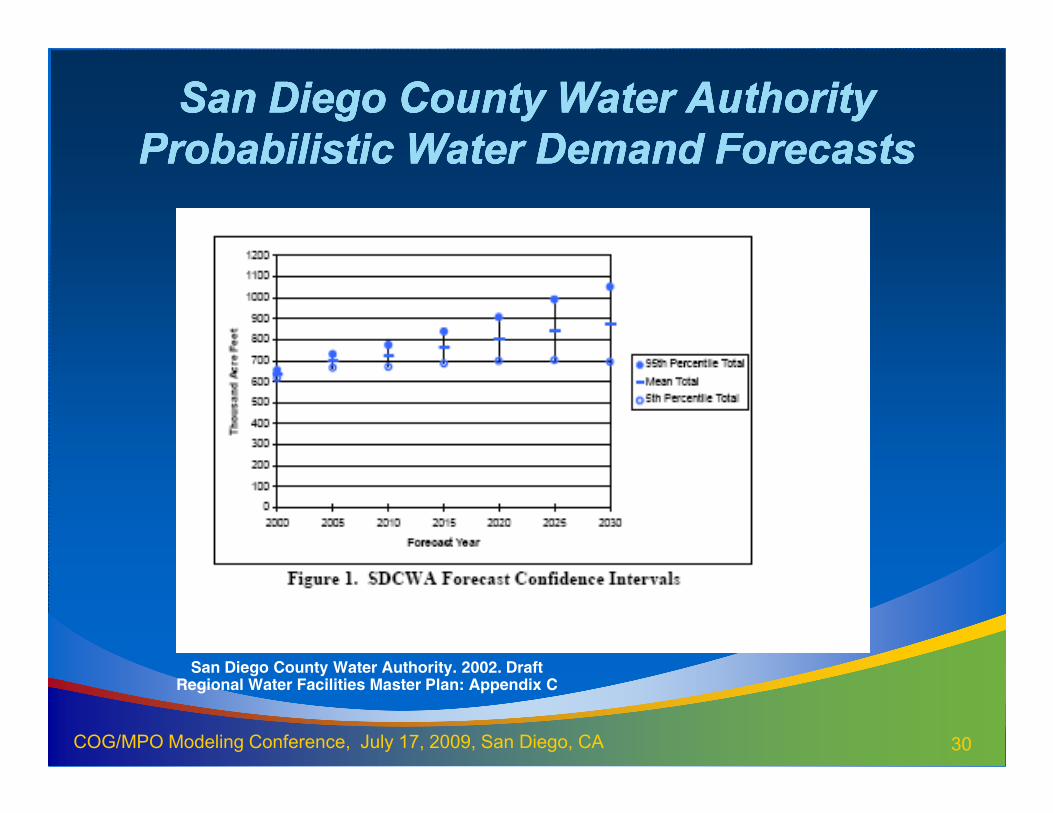
San Diego County Water AuthoritySan Diego County Water Authority
Probabilistic Water Demand ForecastsProbabilistic Water Demand Forecasts
San Diego County Water AuthoritySan Diego County Water Authority
Probabilistic Water Demand ForecastsProbabilistic Water Demand Forecasts
30COG/MPO Modeling Conference, July 17, 2009, San Diego, CA
San Diego County Water Authority. 2002. Draft Regional Water Facilities Master Plan: Appendix C
Economic Impacts of Economic Impacts of
Border Wait TimesBorder Wait Times
Economic Impacts of Economic Impacts of
Border Wait TimesBorder Wait Times
31COG/MPO Modeling Conference, July 17, 2009, San Diego, CA
SANDAG & Caltrans District 11. 2006. Economic Impacts of Wait Timesat the San Diego-Baja California Border.
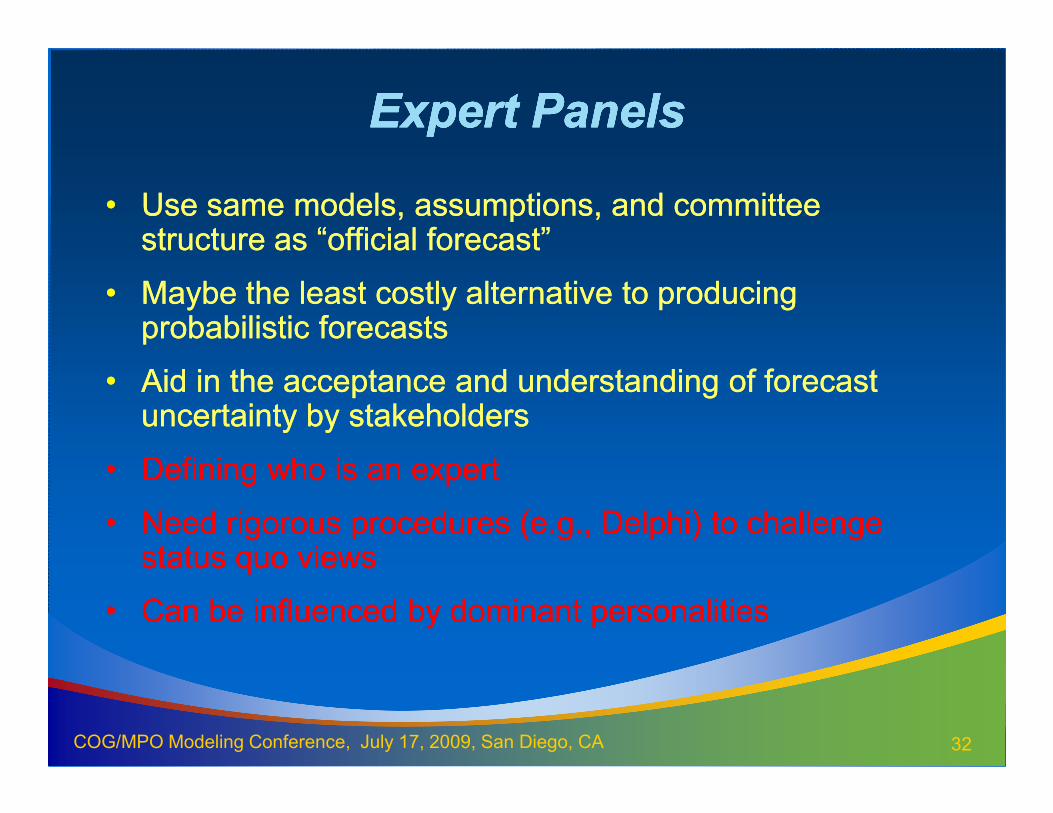
•• Use same models, assumptions, and committee Use same models, assumptions, and committee structure as “official forecast”structure as “official forecast”
•• Maybe the least costly alternative to producing Maybe the least costly alternative to producing probabilistic forecastsprobabilistic forecasts
•• Aid in the acceptance and understanding of forecast Aid in the acceptance and understanding of forecast uncertainty by stakeholdersuncertainty by stakeholders
32COG/MPO Modeling Conference, July 17, 2009, San Diego, CA
uncertainty by stakeholdersuncertainty by stakeholders
•• Defining who is an expertDefining who is an expert
•• Need rigorous procedures (e.g., Delphi) to challenge Need rigorous procedures (e.g., Delphi) to challenge status quo viewsstatus quo views
•• Can be influenced by dominant personalitiesCan be influenced by dominant personalities
Survey of State and Regional AgenciesSurvey of State and Regional Agencies
33COG/MPO Modeling Conference, July 17, 2009, San Diego, CA
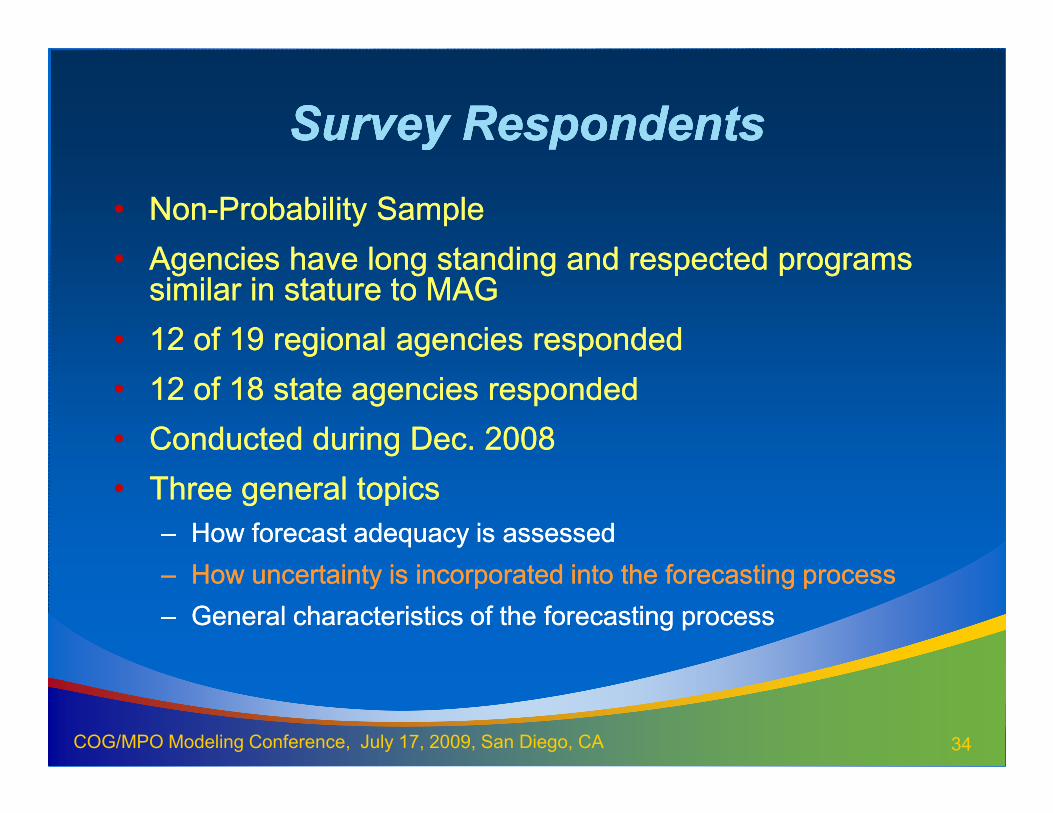
Survey of State and Regional AgenciesSurvey of State and Regional Agencies
•• Agencies have long standing and respected programs Agencies have long standing and respected programs similar in stature to MAGsimilar in stature to MAG
•• 12 of 19 regional agencies responded12 of 19 regional agencies responded
•• 12 of 18 state agencies responded12 of 18 state agencies responded
34COG/MPO Modeling Conference, July 17, 2009, San Diego, CA
•• Conducted during Dec. 2008Conducted during Dec. 2008
•• Three general topicsThree general topics
–– How forecast adequacy is assessedHow forecast adequacy is assessed
–– How uncertainty is incorporated into the forecasting processHow uncertainty is incorporated into the forecasting process
–– General characteristics of the forecastingGeneral characteristics of the forecasting processprocess
Migration is the Highest RankedMigration is the Highest Ranked
Source of UncertaintySource of Uncertainty
Migration is the Highest RankedMigration is the Highest Ranked
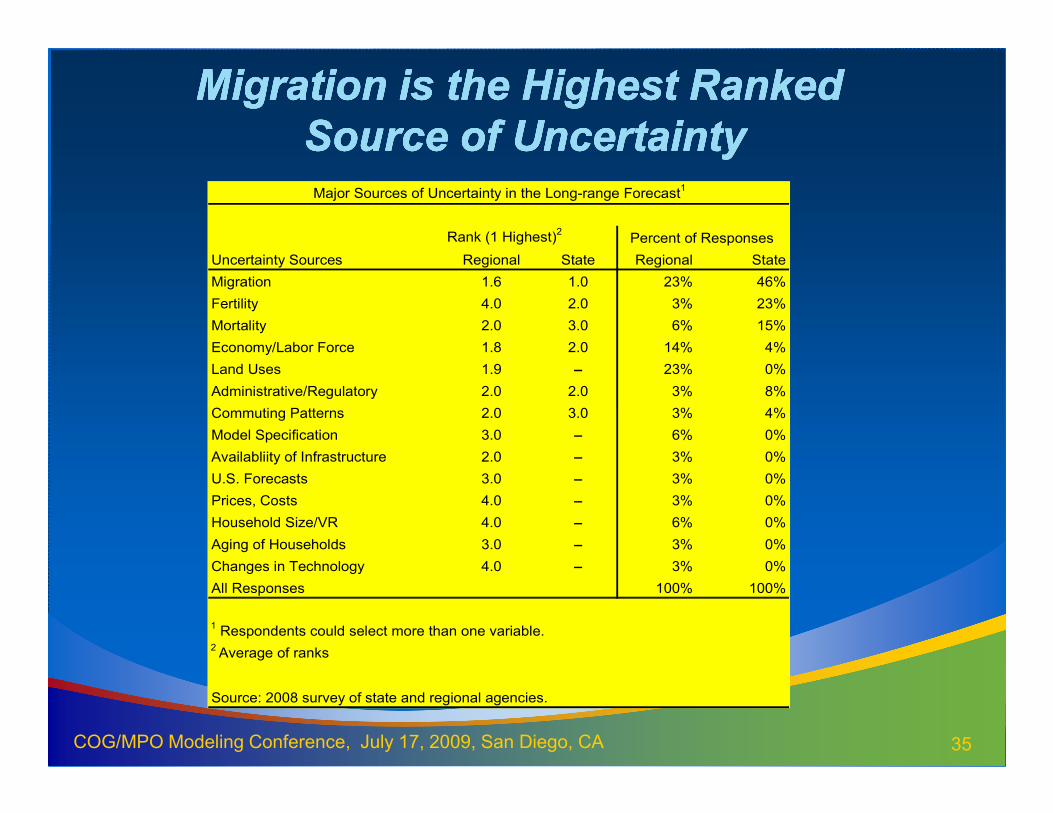
Source of UncertaintySource of UncertaintyMajor Sources of Uncertainty in the Long-range Forecast
1
Rank (1 Highest)2
Percent of Responses
Uncertainty Sources Regional State Regional State
Migration 1.6 1.0 23% 46%
Fertility 4.0 2.0 3% 23%
Mortality 2.0 3.0 6% 15%
Economy/Labor Force 1.8 2.0 14% 4%
Land Uses 1.9 – 23% 0%
Administrative/Regulatory 2.0 2.0 3% 8%
Commuting Patterns 2.0 3.0 3% 4%
35COG/MPO Modeling Conference, July 17, 2009, San Diego, CA
Commuting Patterns 2.0 3.0 3% 4%
Model Specification 3.0 – 6% 0%
Availabliity of Infrastructure 2.0 – 3% 0%
U.S. Forecasts 3.0 – 3% 0%
Prices, Costs 4.0 – 3% 0%
Household Size/VR 4.0 – 6% 0%
Aging of Households 3.0 – 3% 0%
Changes in Technology 4.0 – 3% 0%
All Responses 100% 100%
1 Respondents could select more than one variable.2 Average of ranks
Source: 2008 survey of state and regional agencies.
More Regional than State Agencies More Regional than State Agencies
Currently Incorporate UncertaintyCurrently Incorporate Uncertainty
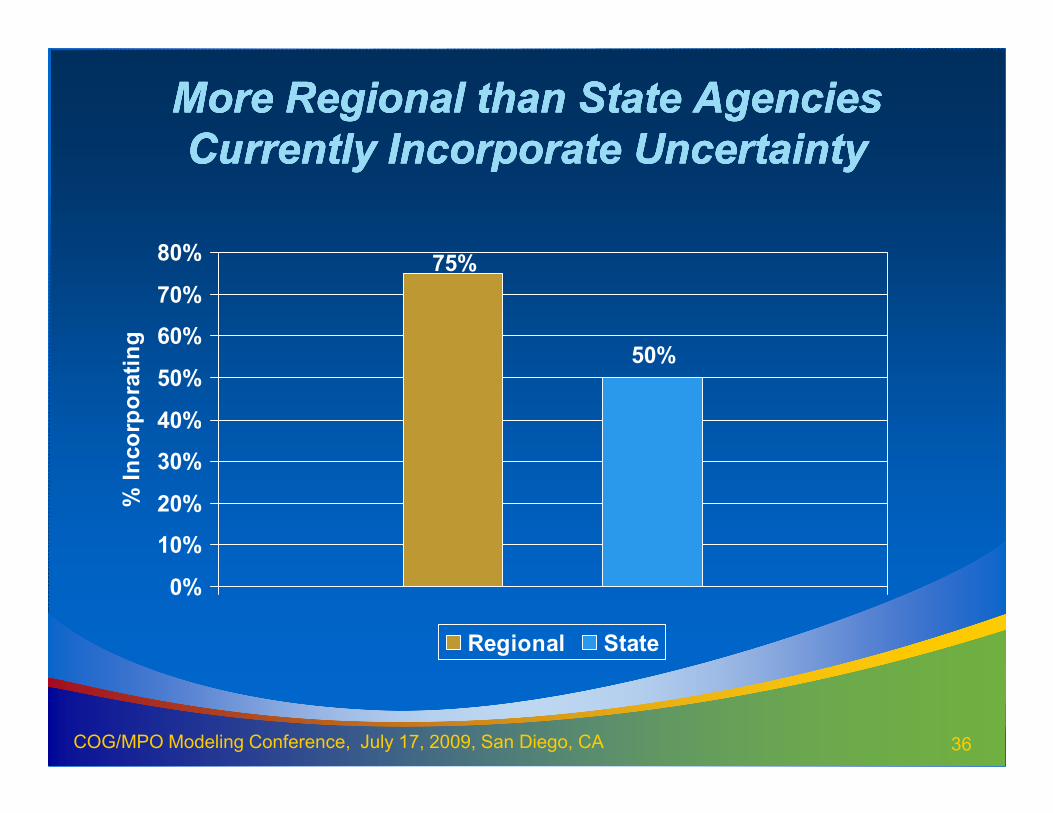
More Regional than State Agencies More Regional than State Agencies
Currently Incorporate UncertaintyCurrently Incorporate Uncertainty
50%
75%
40%
50%
60%
70%
80%
% Incorporating
36COG/MPO Modeling Conference, July 17, 2009, San Diego, CA
0%
10%
20%
30%
40%
% Incorporating
Regional State
Only 1 Agency Not Currently or Planning Only 1 Agency Not Currently or Planning
to Incorporate Uncertaintyto Incorporate Uncertainty
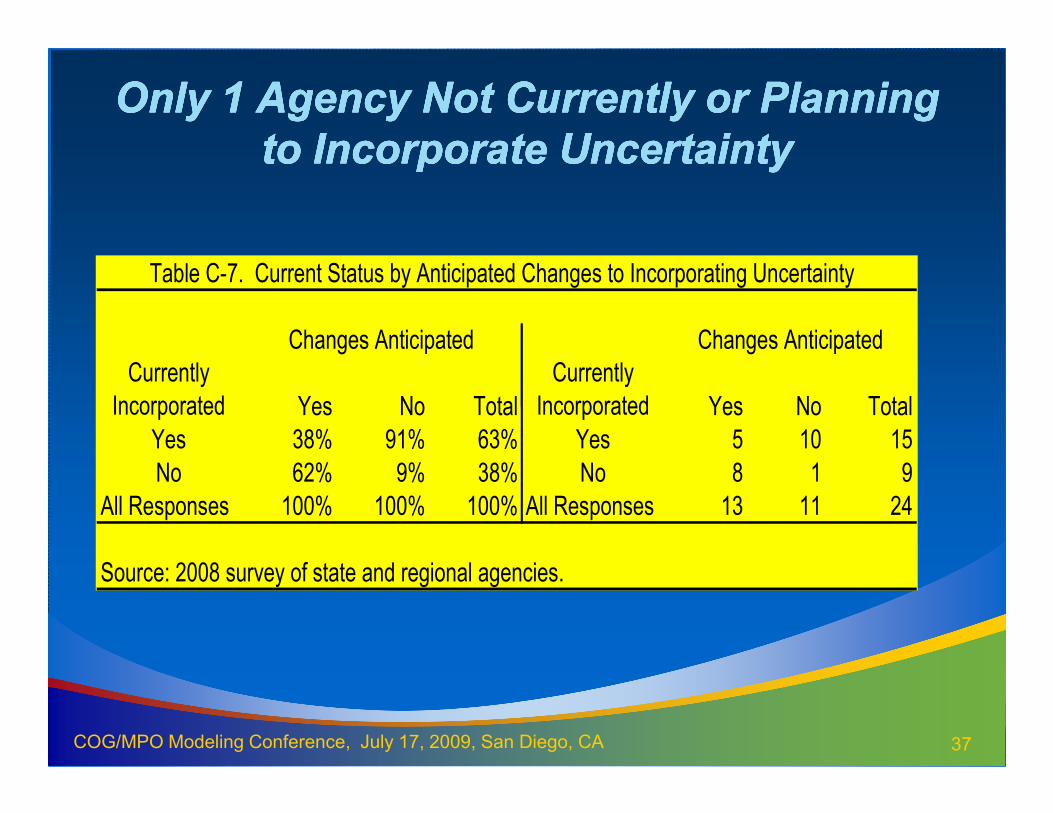
Only 1 Agency Not Currently or Planning Only 1 Agency Not Currently or Planning
to Incorporate Uncertaintyto Incorporate Uncertainty
Table C-7. Current Status by Anticipated Changes to Incorporating Uncertainty
Changes Anticipated Changes AnticipatedCurrently
Incorporated Yes No Total
Currently
Incorporated Yes No Total
37COG/MPO Modeling Conference, July 17, 2009, San Diego, CA
Incorporated Yes No Total Incorporated Yes No Total
Yes 38% 91% 63% Yes 5 10 15
No 62% 9% 38% No 8 1 9
All Responses 100% 100% 100% All Responses 13 11 24
Source: 2008 survey of state and regional agencies.
Regional Agencies Use Multiple Methods Regional Agencies Use Multiple Methods
for Incorporating Uncertaintyfor Incorporating Uncertainty
Regional Agencies Use Multiple Methods Regional Agencies Use Multiple Methods
for Incorporating Uncertaintyfor Incorporating Uncertainty
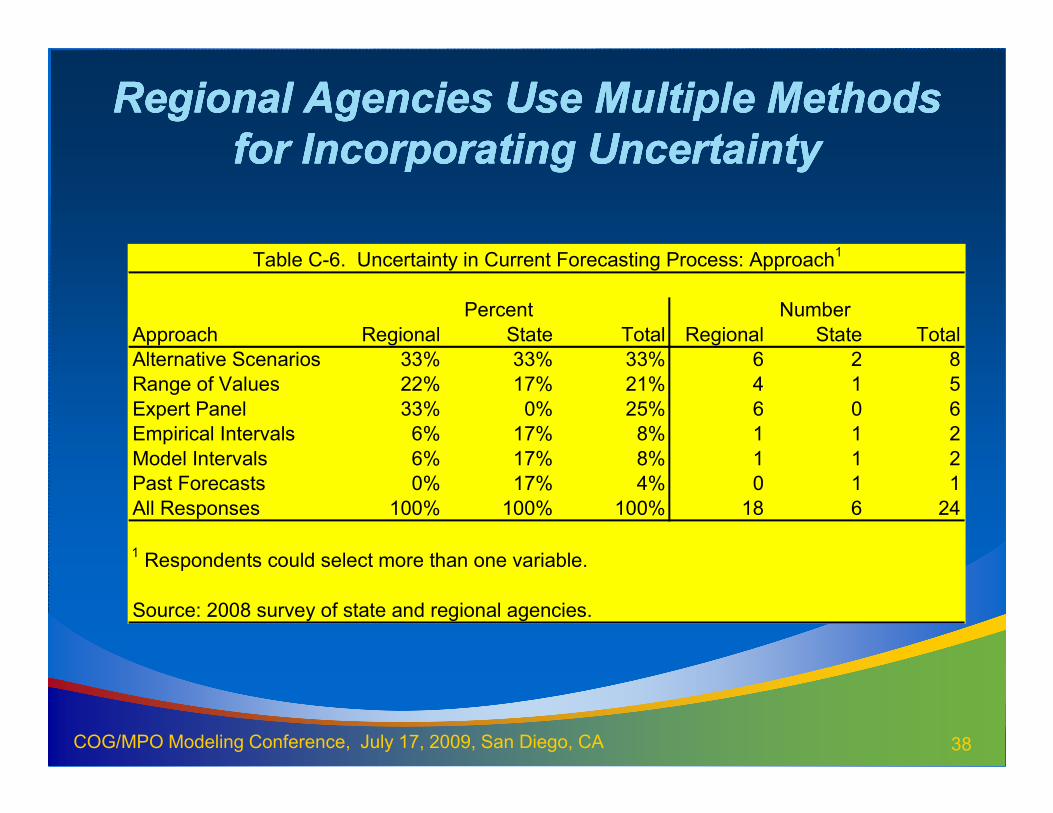
Table C-6. Uncertainty in Current Forecasting Process: Approach1
Percent Number
Approach Regional State Total Regional State Total
Alternative Scenarios 33% 33% 33% 6 2 8
Range of Values 22% 17% 21% 4 1 5
Expert Panel 33% 0% 25% 6 0 6
38COG/MPO Modeling Conference, July 17, 2009, San Diego, CA
Expert Panel 33% 0% 25% 6 0 6
Empirical Intervals 6% 17% 8% 1 1 2
Model Intervals 6% 17% 8% 1 1 2
Past Forecasts 0% 17% 4% 0 1 1
All Responses 100% 100% 100% 18 6 24
1 Respondents could select more than one variable.
Source: 2008 survey of state and regional agencies.
Alternate Scenarios/Range of Values Most Alternate Scenarios/Range of Values Most
Likely New Approaches to UncertaintyLikely New Approaches to Uncertainty
Alternate Scenarios/Range of Values Most Alternate Scenarios/Range of Values Most
Likely New Approaches to UncertaintyLikely New Approaches to Uncertainty
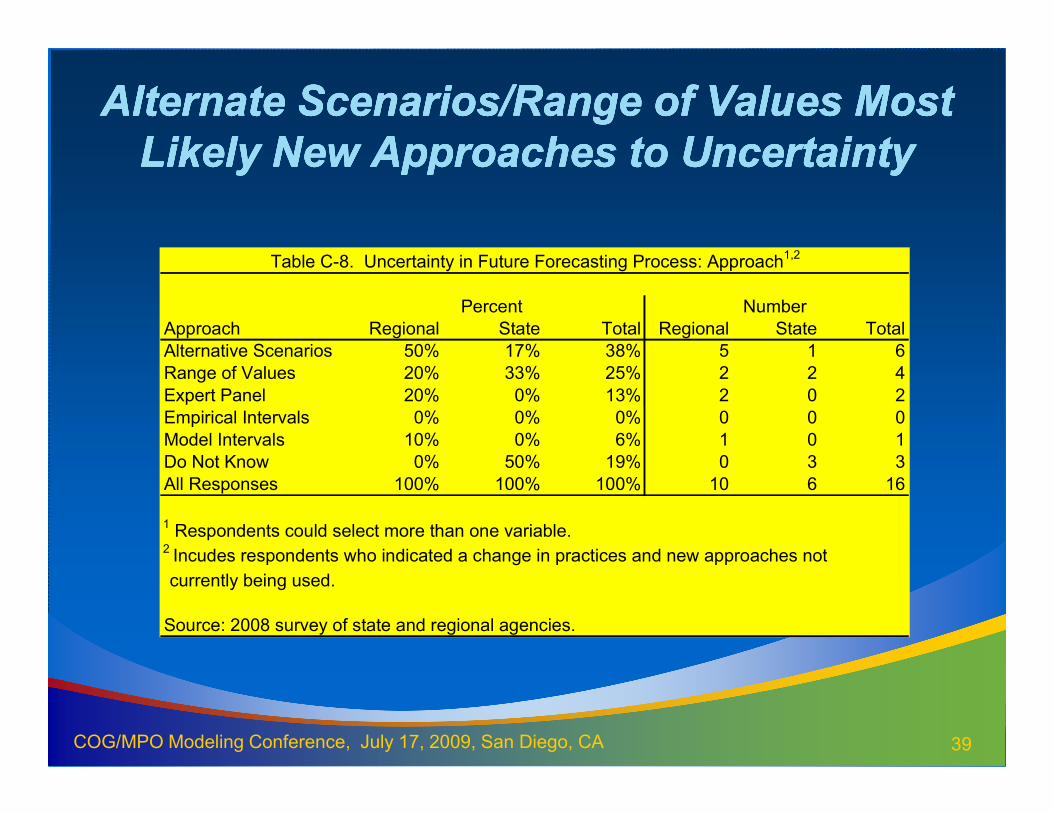
Table C-8. Uncertainty in Future Forecasting Process: Approach1,2
Percent Number
Approach Regional State Total Regional State Total
Alternative Scenarios 50% 17% 38% 5 1 6
Range of Values 20% 33% 25% 2 2 4
Expert Panel 20% 0% 13% 2 0 2
39COG/MPO Modeling Conference, July 17, 2009, San Diego, CA
Empirical Intervals 0% 0% 0% 0 0 0
Model Intervals 10% 0% 6% 1 0 1
Do Not Know 0% 50% 19% 0 3 3
All Responses 100% 100% 100% 10 6 16
1 Respondents could select more than one variable.2 Incudes respondents who indicated a change in practices and new approaches not currently being used.
Source: 2008 survey of state and regional agencies.
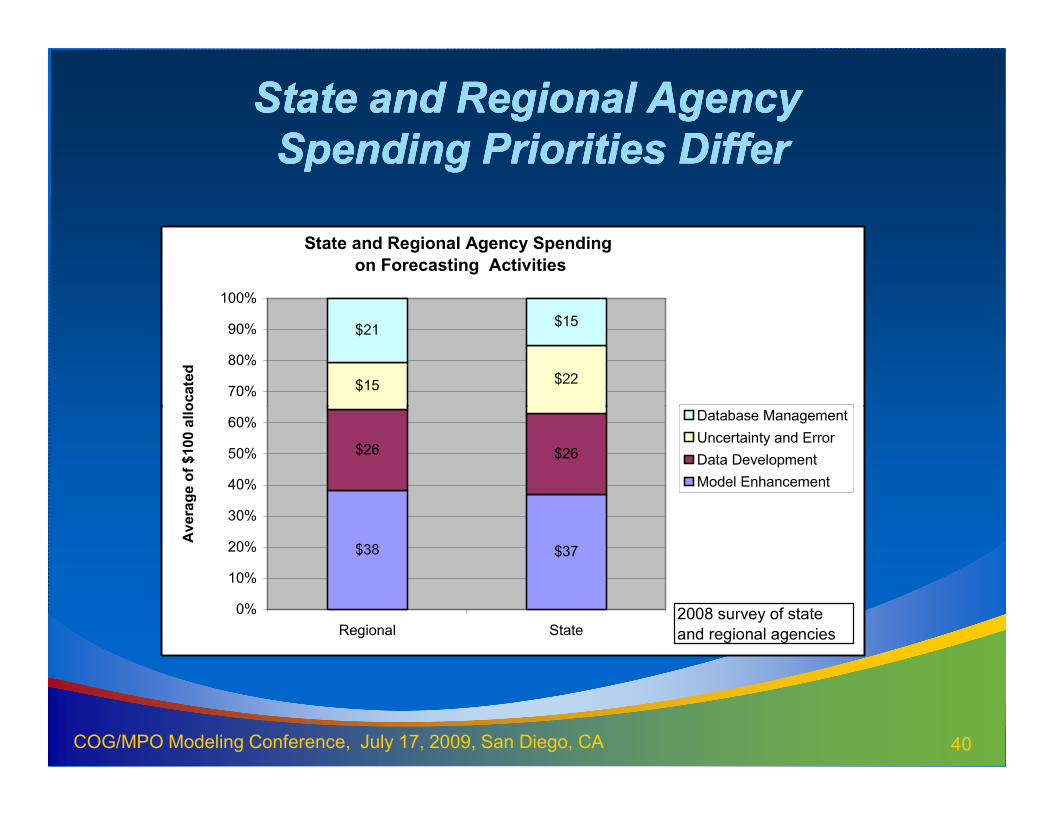
State and Regional AgencyState and Regional Agency