32
Understanding America’s Water and Wastewater Challenges May 2017

Understanding America’s Water and Wastewater Challenges May 2017

1 bipartisanpolicy.org
ACKNOWLEDGEMENTSThis report was supported by the Executive Council on Infrastructure and a grant from the Charles Stewart Mott Foundation. For more information, visit www.mott.org.
DISCLAIMERThe findings and recommendations expressed herein do not necessarily represent the views or opinions of the Bipartisan Policy Center’s founders or its board of directors.
Executive Council on Infrastructure Water Task Force
Steve BartlettFormer U.S. RepresentativeFormer Mayor
Henry CisnerosFormer Secretary of Housing and Urban DevelopmentFormer Mayor
George HeartwellFormer Mayor
Kelly McAndrewVice President, Xylem, Inc.
Aldie WarnockSenior Vice President, American Water
Staff
Michele NellenbachDirector of Strategic Initiatives
Sarah KlineFellow
Andy WinklerSenior Policy Analyst
Jake VarnPolicy Analyst

2bipartisanpolicy.org
Introduction
Background on Water InfrastructureWastewaterDrinking WaterStormwater
Funding and Financing Needs
Price of Water
Inefficiencies from Deferred Maintenance
Role of the Private Sector
Future Focus AreasPublic Education Low-Income RatepayersSmall SystemsPublic-Private Partnerships Technological Innovation
Conclusion
Appendix A: Current Federal Programs
Endnotes
3
4
9
16
17
20
22
23
24
Table of Contents
3 bipartisanpolicy.org
Introduction
The nation’s water and wastewater utilities are victims of their own success: Americans have rightfully become accustomed to receiving clean water when they turn on their taps and having waste disappear down their pipes. Yet public understanding of the complicated and expensive systems needed to deliver those services is minimal. For instance, the United States has 1.2 million miles of water-supply mains—26 miles of water mains for every mile of interstate highway.1 That is just the drinking water system. There are nearly an equal number of sewer pipes.
Now, as systems across the country require critical repairs and upgrades, water and wastewater customers are often surprised by and reflexively opposed to new charges and fees, and thus unwilling or unable to accept a higher price for services they may have taken for granted. These expectations have left utilities with the challenge of raising mission-critical funding from a skeptical public while maintaining affordability for those who already struggle to pay their bills.
To address some of these issues and raise awareness among policymakers, the Bipartisan Policy Center has created a water infrastructure task force whose members include former mayors George Heartwell (Grand Rapids, MI), Steve Bartlett (Dallas, TX) and Henry Cisneros (San Antonio, TX) as well as senior staff from Xylem and American Water. The task force, in a series of upcoming papers, will:
• Identify the challenges facing water and wastewater utilities around the country;
• Explore the true cost of providing vital services;
• Examine the role of the private sector in helping to address water and wastewater infrastructure needs; and
• Highlight innovations that may bring down the cost of supplying drinking water, treating wastewater, and limiting polluted runoff to preserve the nation’s aquatic environments and public health.
This first paper briefly reviews several types of water infrastructure along with some unique challenges and opportunities in addressing their affordability, funding, and financing.

4bipartisanpolicy.org
Background on Water Infrastructure
Inadequate water systems and services or mismanagement and lack of oversight, as seen in Flint, MI, can quickly turn into a dangerous threat to public health and wellness. In 2011, 2,252 small systems had serious drinking water violations, 193 of which required public notification within 24 hours. After three years, only 22 percent of those 193 systems had achieved compliance.2 While the crisis in Flint exemplifies the dangers of lead contamination, water systems face myriad concerns: Other drinking water contaminants, system failures in the treatment of wastewater, and contaminated stormwater overflows all present unique environmental and health risks. The Environmental Protection Agency (EPA) estimates that between 1.8 million and 3.5 million people per year become ill from recreational contact, such as swimming, with water contaminated by overflows of sanitary sewers, which carry sewage to wastewater treatment plants.3 Furthermore, the American Society of Civil Engineers estimates that aging pipes and inadequate capacity result in the discharge of 900 billion gallons of untreated sewage into U.S. waterways each year.4
Prior to 1972, state and local governments had primary jurisdiction over water quality with the federal government providing financial assistance and conducting research. In 1972, Congress amended the Federal Water Pollution Control Act, thereafter commonly referred to as the “Clean Water Act.” The Clean Water Act established a system by which state and local governments would be responsible for implementing federal effluent limitations for wastewater treatment and pollution into bodies of water. The act also updated the construction grants program, through which municipalities received funds to upgrade any publicly owned treatment works (POTWs), or sewer-treatment plants, to comply with the new federal law. While more common in the drinking water sector, some POTWs are owned by private entities, including for-profit corporations. In this paper, the term POTWs includes investor-owned, regulated water utility companies, except where noted. Since the passage of the Clean Water Act, government and industry have spent over $1 trillion to abate water pollution in the United States.5
In 1987, Congress and then-President Ronald Reagan, concerned about the cost of the grant program, replaced this funding mechanism with the Clean Water State Revolving Fund (SRF). Under the Clean Water SRF, the federal government provides a capitalization grant to each state and territory based on a statutory formula weighing both population and need. States then provide loans and other financial assistance to municipalities for the construction, upgrade, and repair of POTWs and related clean-water programs and projects.
Congress passed the Safe Drinking Water Act amendments in 1996 to create the Drinking Water SRF program. Through the program, the EPA provides capitalization grants to states that, after matching a percentage of the funding, subsequently provide loans and other assistance to public water systems for projects to improve drinking water quality. Unlike the Clean Water SRF, drinking water funding is distributed solely according to need, following a survey and assessment conducted by the EPA in partnership with states and community water systems. Further, while they are not eligible for the Clean Water SRF, private, regulated water utilities are eligible for the Drinking Water SRF.

5 bipartisanpolicy.org
Wastewater
The nation has 14,478 POTWs that serve more than 238 million Americans, or 76 percent of the U.S. population.6 Approximately 5 percent of the population is served by systems providing less than secondary treatment, the basic level provided by POTWs, which is described in the next section. There are 21 million Americans on septic systems which raise an entirely different set of challenging issues, including groundwater contamination.7
POTWs have a 20- to 50-year lifecycle and pipes can range from 15 to 100 years old depending on conditions.8 Philadelphia has some pipes that are between 150 to 200 years old.9 Population shifts from the Northeast to the South and West have left some areas with a declining population, and therefore a declining revenue stream to pay for upgrades, while other areas face an immediate need to expand service.10
A wastewater system includes the conveyance of wastewater from sinks, showers, and toilets in homes and businesses to a POTW as well as the outflow pipes that carry clean, treated effluent back to the environment. At the POTW, the wastewater goes through several different processes and, depending on the facility, undergoes different levels of treatment. The most basic level of treatment, called sedimentation, filters out suspended solids. Secondary treatment removes dissolved, biodegradable organic matter typically using biological-treatment processes. Advanced treatment is additionally required at some plants to remove other chemicals and pollutants not captured by secondary treatment such as nutrients. Finally, the treated effluent at most POTWs is disinfected before being released back into the environment. Figure 1 depicts the process used by DC Water, the POTW in Washington, D.C.
Figure 1. Example Wastewater Treatment Process
Source: DC Water11

6bipartisanpolicy.org
Drinking Water
The drinking water system is similarly complex, transporting water from its source to homes and businesses. The overwhelming majority of the nation—300 million Americans, roughly 94 percent of the U.S. population—receive at least some of their drinking water from a community water system (CWS).12 The remaining 6 percent are rural American households that are not connected to public water and instead receive water from privately owned wells.13
Figure 2. Features of a Community Water System
Source: U.S. Fire Administration14
As shown in Figure 2, CWSs pull water from designated bodies of water and treat it for harmful contaminants, including arsenic, radon, E.coli, and Cryptosporidium, in accordance with EPA drinking water standards. These facilities may use chlorine in water-distribution pipes to ensure that water reaching customers is of a high quality. However, if chlorine is used both to kill pathogens at the water treatment plant and to provide this residual disinfectant, then facilities need an additional layer of oversight: Water systems must carefully manage disinfection so as not to create unacceptable levels of disinfection byproducts, a group of compounds that are potential carcinogens. Disinfection byproducts are formed when chlorine and other disinfectants react with organic compounds in the source water. As was seen with the Flint crisis, it is critical that drinking water treatment is appropriately matched to the particular water source available to the water system.
There are approximately 52,000 CWSs and 17,000 not-for-profit noncommunity water systems, including schools, and about 15 percent of the U.S. water market is privately owned.15 16 Systems range widely in size, from the nation’s largest cities to small

7 bipartisanpolicy.org
systems with just 15 connections. This diversity in system size complicates efforts to create just one financing mechanism that can address such a variety of needs. Importantly, water is one of the few economic sectors where financial insolvency can impact Americans’ public health.
There is considerable discussion around alternative uses of drinking water and whether all water piped into homes and businesses should meet the same standards. After all, only 20 percent of the water a household uses indoors passes through faucets for drinking, and only another 20 percent passes through showers or bathtubs and therefore comes into direct contact with a person’s eyes, ears, nose, or mouth (see Figure 3). The remaining 60 percent of household water is primarily used for things like watering lawns, operating toilets, and washing clothes. Does the water required for those uses need to meet the same standards? Further, many homeowners and businesses are now capturing stormwater and reusing so-called “greywater,”—water from showers and sinks—for watering lawns and irrigating crops. The new Mercedes-Benz Stadium in Cobb County, GA, soon to be the home of the Atlanta Falcons and Atlanta United FC, for example, will capture stormwater in ponds under the field and use the water in the facility’s cooling towers and to irrigate plants throughout the complex.17
Figure 3. Indoor Household Water Use by Fixture
Source: Water Research Foundation18
Toilet Faucet Shower Clothes Washer Leak Bath Other Dishwasher
Toilet24%
Faucet20%
Shower20%
Clothes Washer
16%
Leak13%
Bath3%
Other3%
Dishwasher1%

8bipartisanpolicy.org
Stormwater
In 1990, the EPA first outlined the responsibilities of municipalities with populations over 100,000 in controlling pollutants stemming from the discharge of stormwater into local bodies of water.19 Phase II of the stormwater program, which affects cities under 100,000, was finalized in 1999 with the first compliance deadlines in 2002.20 Yet, the increasing severity and unpredictability of storms has further complicated this task. For example, in the past 50 years, precipitation from the most intense 1 percent of storms has increased by 20 percent,21 with the Midwest and Northeast observing even higher increases.22 Many cities and towns have separate utilities and fees to address the management of municipal separate stormwater sewer systems (MS4s).
Additionally, more than 770 communities across the United States have combined sewer systems. These systems, a water infrastructure innovation of the 1850s, are so named because they carry wastewater and stormwater together.23 When rainwater is excessive and overwhelms the capacity of the sewer pipes, the combined wastewater and stormwater bypasses treatment and is released directly into adjoining bodies of water. Today, it is widely agreed that “dilution is not a solution” to water pollution. As a result, many communities, mostly spanning across the Northeast and Midwest, are under federal orders to either build large storage tunnels or separate their storm and sanitary sewers to prevent these overflows. A 2012 EPA survey estimated that projects to prevent or control combined sewer overflows would cost $48 billion over 20 years.24
Cities must also address what are known as sanitary sewer overflows (SSOs) which result from a blockage of sewer lines or excessive inflow of stormwater into sanitary sewers. The EPA estimates that there are between 23,000 and 75,000 SSOs each year and often result in a POTW violating the terms of its permit. SSOs can pose a risk not only to the environment but also public health.
One might think wastewater, drinking water, and stormwater are all managed in a seamless system from water intake through the CWS, into the home, out through the sewers into the POTW, and back into the environment. And, to the consumer, this process does appear seamless. However, in reality, very little coordination may exist among the entities that oversee the various parts of the process. A wastewater system is usually managed by an entirely different city agency or entity from the drinking water system. An MS4 is often managed by yet another agency that charges its own fee separate from that for water and sewer services. There is a growing “one water” movement to manage water resources from the drinking water source all the way through to the outflow into the POTW’s receiving body of water, which would drive efficiencies and better decision-making. However, while some communities have combined their POTWs and CWSs, in many places the division in management makes a holistic vision difficult to implement.

9 bipartisanpolicy.org
Funding and Financing Needs
Drinking water and wastewater systems, including pipes and the facilities themselves, are funded through a combination of service charges/user fees, federal and state grants, or, in some jurisdictions, local taxes. These funding sources allow utilities to take on loans or issue bonds to cover their costs. Approximately 80 percent of a water utility’s costs are fixed, such as debt service. However, about 80 percent of a utility’s revenue is generated from rates based on water consumption, which varies depending on individual needs. Thus, utilities face a mismatch between fixed expenses and variable revenues, a dichotomy that can create budgeting challenges over the long run. Furthermore, if consumers conserve water as they often do during economic downturns, a utility’s income drops but its debt payments remain largely the same.25
Utilities often use bonds, non-ratepayer based funding, and financing to pay the upfront costs associated with capital improvements. In particular, systems in the largest U.S. cities have the customer bases and credit ratings to secure low-interest-rate bond financing as needed, which may result in their exclusion from a state’s list of projects it intends to fund through the SRF. Their bonds are then often repaid by raising customer rates. While large systems may not appear to need additional assistance, many state and local governments prohibit charging different rates to different customers based on their ability to pay. As such, even large systems may struggle with how to balance the need for system improvements without adversely impacting low-income customers.
Though regulations and regulatory bodies vary by state, private utilities—and some public utilities—are regulated by state public utility commissions which often oversee and approve rate increases. Rates and other investment decisions for most publicly owned utilities, however, are overseen by locally elected officials. While in some cases, private utilities’ rates exceed those of comparable public water systems,26 they often have better federal compliance rates.27 They also pay taxes whereas municipal systems do not. Additionally, private utilities often take over systems with significant maintenance backlogs and compliance issues, which may also account for the variation in rates.
Many cities struggle with shrinking population rates. In a recent review of ten U.S. cities, the Government Accountability Office found that utilities in mid- and large-sized cities with shrinking populations face declining revenues and increasing operational costs.28 When compared with similar cities with growing populations, declining cities had higher poverty rates (23.6 percent compared with 16.5 percent), higher unemployment (12.5 percent compared with 9.2 percent), and lower median household incomes ($40,993 compared with $57,729).29 The strain placed on such cities raises heightened concerns about affordability as utilities are forced to compensate with higher rates. On the other hand, any failure to make those needed investments could undermine the integrity of their water systems and further exacerbate the public health risk from lead and other contaminants.

10bipartisanpolicy.org
Figure 4. Location of U.S. Cities with 2010 Population (≥ 50,000) That Experienced a Decline in Population from 1980 to 2010
Source: U.S. Government Accountability Office30

11 bipartisanpolicy.org
Small systems—those serving fewer than 10,000 people—rely more heavily on federal grants, through programs like the U.S. Department of Agriculture’s (USDA) Rural Utility Service, than their larger counterparts. (For a list of federal funding sources, see Appendix A.) These systems lack the capacity and size to participate in the bond market or pursue innovative financing options. To bridge this gap, the Safe Drinking Water Act requires the EPA to create a capacity improvement program to help these small systems.
The SRFs are the main source of federal funding for municipal water and wastewater systems. Each state maintains an SRF intended-use plan which includes every project in the state that is in need of a loan from the fund. Every four years, the EPA conducts two surveys of states to separately identify wastewater and drinking water needs. In the case of the Drinking Water SRF, the needs survey serves as the basis for the formula by which funds are distributed to the states. The SRFs provide long-term loans with up to 30-year repayment periods at below-market rates. States must match 20 percent of the amount of funding they receive each year from the federal government. The SRFs can provide a variety of services including loans, refinancing, guarantees on local debt, and bond insurance.
Clean Water Eligible Projects
Secondary Wastewater TreatmentAdvanced Wastewater Treatment Conveyance System RepairCombined Sewer Overflow CorrectionNew Conveyance SystemsStormwater Management and Management ProgramsWater Conservation and RecyclingTechnical Capacity to Seek Financing
Drinking Water Eligible Projects
TreatmentTransmission and DistributionSource Water ProtectionStorage Consolidation of SystemsCreate New System From Contaminated WellsRecycled Water Distribution Create New Regional System

12bipartisanpolicy.org
According to the EPA’s most recent needs survey, over the next 20 years the United States must invest $271 billion for wastewater/stormwater upgrades and $384 billion for drinking water upgrades. Unfortunately, the EPA’s survey only accounts for 21 percent of stormwater needs.31 State intended-use plans and the EPA needs surveys form the basis of state spending from the SRFs. Since its creation, the Clean Water SRF has provided 36,100 loans totaling over $111 billion for water projects, including more than 24,000 loans to small systems, amounting to about 24 percent of funding.32 While 10 percent of loan agreements and 42 percent of the funding goes to systems that serve more than 100,000 people. Systems in the middle, ranging from 10,000 to 99,999 people have received 23 percent of loans and 35 percent of the funding.33 As with the Clean Water SRF, the Drinking Water SRF also provides the majority of funding to large systems and large populations, but most loan agreements are with small system drinking water utilities. The 41,000 systems that serve fewer than 10,000 people have received $11 billion in assistance, or 35 percent of funding and 71 percent of loan agreements, while the largest systems serving more than 110,000 people have received $8.6 billion, or 27 percent of all funding and just 7 percent of loan agreements.34 As the EPA notes, small systems face a myriad of challenges including a lack of technical and managerial capacity.35 Small systems in particular and their consumers may benefit from partnerships with other systems.
State Revolving Funds
Fiscal Year Clean Water Appropriations(Millions of dollars not adjusted for inflation)
Drinking Water Appropriations(Millions of dollars not adjusted for inflation)
2008 $689.1 $829.0
2009* $4,689.1 $2,829.0
2010 $2,100.0 $1,387.0
2011 $1,522.0 $963.1
2012 $1,466.5 $917.9
2013 $1,376.1 $956.3
2014 $1,448.9 $906.9
2015 $1,448.9 $906.9
2016 $1,393.9 $863.2
Table A: State Revolving Fund Funding Chart36
* Dollar amounts reflect one-time infusion of funds as part of the American Recovery and Reinvestment Act.

13 bipartisanpolicy.org
In 2002, to address concerns that its needs survey was underestimating the national funding gap, the EPA conducted a separate analysis and found that from 1982 to 2002 communities spent $1 trillion on drinking water and wastewater treatment and disposal.37 They estimated the need from 2000 to 2019 would range from $485 billion to $896 billion. The EPA further noted that most of that gap could be eliminated if utilities increased rates by 3 percent over and above the rate of inflation. The American Water Works Association found the United States needs to invest over $1 trillion over 25 years to both replace and expand drinking water systems just to maintain the current level of service.38
Price of Water
The EPA generally considers drinking water affordable if it accounts for 2.5 percent or less of median household income (for a small community).39 It is generally understood that EPA would consider a combined annual water and wastewater bill affordable if it is less than 4.5 percent of median household income (2.5 percent for water and 2 percent for wastewater services and CSO controls).40 The Congressional Budget Office projected that between 11 and 21 percent of households will spend more than 4 percent of household income on drinking water alone by 2019.41
Nationally, according to the National Association of Clean Water Agencies (the trade association for the nation’s POTWs), the average 2015 residential sewer/wastewater service charge exceeded $400 per year in many areas of the country, a 3.1 percent increase from 2014 and the 14th consecutive year that charges have increased.42 The Circle of Blue’s 2015 annual survey of rates found that the cost of water for a family of four increased by 6 percent from the previous year, while the median cost increased 4.5 percent. Though this is the smallest year-over-year increase since the survey started in 2009, the cost of water still outpaced inflation.43
Cities around the country are seeing this reality play out. St. Louis, MO, a metro area facing a decline in water usage, a drop in its customer base, and broad economic challenges, is in the process of correcting its combined sewer overflows at a cost of $4.7 billion. To pay for that improvement—which addresses just one water quality issue and does nothing to limit drinking water contaminants—the metro region’s sewer district announced rate increases. The average household will see their rates rise from $41 per month in July 2015 to at least $100 per month by 2025.44
Perhaps no city in the country epitomizes the struggle to properly set water and sewer rates than Detroit, MI. While acknowledging that the history and current situation in Detroit is too complicated for adequate discussion in this brief, an overview is illustrative. In 2009 the city of Detroit’s residential water rates were $62.75 per month compared with $26.56 per month in the Detroit suburbs.45 The Detroit Water and Sewer Department (DWSD) has gone through several rounds of water shut-offs including over 31,000 households in the spring and summer of 2014.46 Once water to a home has been shut off, the home becomes a target for condemnation and young children can be removed from the home. According to DWSD, in 2014 half of the city’s utilities accounts were in arrears including both residential and business accounts.47 (Detroit is not the only city to take drastic measures. In 2015, the city of Baltimore, with $40 million in delinquent water bills, issued 25,000 shut-off notices.48)

14bipartisanpolicy.org
DWSD is one of the largest water and sewer utilities in the United States, with several thousand miles of water and sewer transmission lines covering over 1,000 square miles. The systems serve Detroit, 77 suburban communities on the wastewater side, and 125 suburban communities on the water side.49 The system was designed in the 1960s when Detroit had a thriving economy and a well-off population. Fast forward to today, and the city has lost one-half of its population and many of its industries, and it is served by a utility with thousands of delinquent accounts.
As Detroit was addressing its collapsing municipal budget under the auspices of a state-appointed emergency manager, the city’s wastewater system was viewed as a potential source of revenue. However, what was not acknowledged was the years of deferred maintenance of the system, an expensive federal consent order regarding combined sewer overflows and a limited consumer base on which additional fees could be charged.
As part of a bankruptcy settlement agreement and to address growing pressures from new customers in non-Detroit communities about high water rates, on January 1, 2016, the city of Detroit entered into an agreement to lease its regional water and sewer infrastructure, as well as its water and wastewater treatment facilities, to the Great Lakes Water Authority (GLWA). The agreement between DWSD and GLWA includes a $50 million annual lease payment for 40 years to replace and rehabilitate DWSD’s aging water and sewer systems.
To avoid future shut-offs in Detroit, the GLWA and DWSD are working with the Community Action Alliance, a local non-profit organization, to create the Water Residential Assistance Program (WRAP). WRAP works with utility customers to develop a payment plan that allows them to pay at least a portion of their bill each month in exchange for not having their water service cut off. The program is funded through one-half of a percent of GLWA’s revenues. More than a quarter of Detroit’s residential ratepayers are on a payment assistance program—44,000 out of 175,000.50 Detroit’s WRAP has the potential to be particularly effective because it addresses the underlying problem of water conservation. Qualifying residents with water usage exceeding 20 percent of the average household’s water consumption in the city are eligible for a free home water-conservation audit. Based on the audit, customers may receive up to an additional $1,000 for minor household plumbing repairs, including the installation of low-flow toilets. Therefore, not only is the city of Detroit helping low-income residents structure their payments, they are also helping to permanently lower bills through the elimination of waste. However, with just $5 million in annual funding the program is insufficient to meet current needs.
Some utilities are dealing with affordability issues by offering “lifeline rates” or assistance programs for low-income customers. However, many states and cities have laws prohibiting utilities from differentiating rates based on the ability to pay. In these states, utilities can charge businesses different rates than they do homeowners, but they must charge all homeowners the same rate regardless of need. To address affordability issues in places where these requirements apply, many utilities create separate grant programs to assist low-income customers that are either self-funded or funded through donations from other customers.

15 bipartisanpolicy.org
Other examples of assistance programs include:
• Sacramento, CA, provides an annual rebate to low-income consumers but only on the conveyance and treatment charge, and not the usage charge, which is where most of the cost is incurred. The Sacramento County Department of Waste Management and Recycling and the Sacramento County Water Agency offer a $5 and $7 per month rate-assistance credit respectively on the utility bill for qualifying customers. If you receive both utility services from Sacramento County, you could receive rate assistance of up to $144 a year.
• The city of Olympia, WA, offers a lifeline rate on utility services for customers who qualify as low-income and disabled, or are low-income older adults (aged 62 and over). This rate applies to residential customers only. Lifeline rates are 50 percent of the standard utility rate for water, solid waste, sewer, and stormwater.
• The city of Cleveland’s Division of Water and the Northeast Ohio Regional Sewer District have partnered on a program to help those who are struggling to pay their utility bills, including a program that helps those who are suddenly under financial hardship, likely due to the loss of a job, regardless of income.
• Where approved by state authorities, American Water state subsidiaries offer customer assistance programs to help financially challenged or disadvantaged households with water services bills via one-time emergency grants or discount payment programs. For example, New Jersey American Water offers a comprehensive assistance program called H2O to Help Others. The program includes payment assistance and discounted rates for qualified applicants. The program is fully funded by New Jersey American Water.
An EPA survey of nearly 800 drinking water and wastewater utilities found that more than a quarter of utilities offer customer assistance programs.51 These aid programs are critical not only because they provide much needed help to low-income Americans but because they lay the groundwork for utilities to incorporate the full cost of providing water and wastewater services into their rates. According to the EPA, “As a percentage of household income, U.S. households pay less for water and wastewater than other developed countries. There is a perception that water is readily available and water services are generally inexpensive.”52 Most rates paid by consumers today do not reflect the long-term costs of maintaining and repairing U.S. water and wastewater systems; often they are just a reflection of short-term construction and service cost.
16bipartisanpolicy.org
Inefficiencies from Deferred Maintenance
Many water systems also operate with considerable inefficiencies. “Nonrevenue water” is water that utilities treat but that is lost through either a physical leak or through monitoring errors such as metering inaccuracies, unauthorized consumption, or data errors. Every year, there are roughly 240,000 water main breaks in the United States, which, when combined with the other causes of nonrevenue water, result in utilities losing 1.7 trillion gallons, or $2.6 billion worth of treated drinking water.53 As pipes age and budgets tighten, maintenance and technological upgrades are being constantly deferred, leading to decrepit systems that are spilling money.
This is a problem that occurs in water utilities across the country. A 2012 survey of utilities in the Great Lakes region found that, just through leaks, the utilities lose an estimated 66.5 billion gallons of water per year.54 The Chicago area alone loses 22 billion gallons of treated water per year through leaky pipes which could otherwise serve 698,000 people.55 The Great Lakes survey also found that 71 percent of the region’s utilities have no policy to control water loss, and 67 percent do not publicly report the condition of their infrastructure.56 If the treated water leaking out in this region alone was being used, it could annually supply 1.9 million people.
There is a desperate need for more investment to prevent water loss. It has been estimated that the average system loses 16 percent of its water and that up to 75 percent of that nonrevenue water should be recoverable.57 Outside of this direct water loss, the need for improving efficiency and productivity is evident across the industry. A recent report by the water technology company Xylem, Inc., found that if the wastewater sector implemented existing innovations, they could reduce electricity-related emissions by nearly 50 percent and do so almost entirely at a zero or negative cost.58 By modernizing our infrastructure, including the adoption of existing technologies, the water sector would reduce inefficiencies and potentially generate substantial savings.

17 bipartisanpolicy.org
Role of the Private Sector: Public-Private
Partnerships, Co-Ownership, and System Acquisitions
Investor-owned utilities and the broader private sector play a pivotal role in addressing water sector challenges such as infrastructure renewal and water costs. Often, the private sector can provide the technical expertise, regulatory experience, financial resources, and organizational structure to address challenges in effective ways that are not always available to small water systems. Public-private partnerships (P3s), co-ownership arrangements, and struggling system acquisition represent a full spectrum of options that allow communities to ensure safe, clean, reliable water.
P3s can take many different forms. In some cases, a public agency will contract with a private company for design and construction of a new water facility such as a treatment plant. In other cases, the private company will handle the operations and maintenance of existing facilities for a specified number of years. In a third type of arrangement, a public agency may fully transfer a water facility or system to the private sector, relieving the government of the burden of long-term operation and maintenance costs and allowing the private company to collect fees from ratepayers.
P3 arrangements can benefit municipalities in several ways. First, the private company often provides upfront cash to address urgent capital needs, which is paid back over time by ratepayers or other available sources. This can be particularly helpful for systems facing consent decrees or other pressing capital needs that lack the capacity to issue bonds to finance those needs. Second, private water companies can provide technical expertise in meeting federal requirements that a smaller water system may lack. Because private water companies generally operate on a larger scale than municipal water systems, they may benefit from economies of scale in their purchasing and hiring, which can reduce costs and build institutional capacity, as in the Tolt Water Treatment Facility.59
Both small and large communities have successfully used P3s to help meet their water needs. Fairview Township, a small community in York County, PA, sold its wastewater system to Pennsylvania American Water (a subsidiary of American Water Works), for $16.8 million. Through this process, the town could ensure that urgent repair needs would be addressed without having to take on additional debt. In fact, the town could reduce property tax rates for its residents. Pennsylvania American Water will invest an additional $13 million in capital improvements to the system, paid for over time through ratepayer fees.
Across the country, the city of Phoenix used a P3 model known as Design-Build-Operate to deliver a new water treatment plant that would help keep up with the city’s growing population. In a design-build-operate model, a single private consortium is responsible for multiple project stages, running in this case from the earliest stages of design through long-term operations. The city determined that this model would best suit their long-term needs because operating staff were already on board at the beginning of the project and could advise the designers on project elements that would impact operations. The city has estimated that it saved $30 million by using this integrated approach.60

18bipartisanpolicy.org
While more than 2,000 communities across the country use P3s of one type or another, this is a small percentage of the overall water sector. There are many reasons why P3s are underutilized in the water sector compared with other sectors such as transportation and compared with international experience. For one thing, some states do not allow municipalities to utilize this approach. More than half of states either have no P3-enabling legislation or allow P3s for transportation projects only.61 Even in those states that do allow P3s for water projects, public officials may be wary of exploring their potential due to fear of public opposition. Moreover, often the only details the public receives about a potential P3 involve how much it will cost, rather than focusing on the improvements that will result. Finally, developing a P3 can be complex, and public utility managers often do not have the time to explore whether a P3 would help with the management and financing of their system.
Municipalities may also enter co-ownership arrangements with investor-owned, regulated water utilities. These agreements allow investor-owned utilities to possess a stake in a municipality’s water or wastewater system ensuring both entities can benefit, while sharing the risks and costs of that system.
Some municipalities have turned to system acquisitions by investor-owned utilities to resolve fiscal, operational, and safety challenges associated with water system ownership. Small water systems are tasked with navigating increasingly complex regulatory environments, ever more stringent environmental and quality standards, as well as crucial infrastructure renewal needs and lack of capital accessibility. Overcoming these obstacles is daunting for municipal governments, leading some to sell their ailing water systems to investor-owned regulated water utilities. These utilities can provide communities with a number of benefits: Regulated water utilities have significant expertise in the regulatory, financial, operational, and water quality aspects of water system operations. These benefits can translate into infrastructure investment and replacement, water safety compliance, and other qualities that directly benefit customers and communities.
With federal funds unlikely to increase enough to meet the need for investment, it is time for more utilities to explore these arrangements. Given the steady revenue stream that comes with the water and sewer sectors, they are a natural place for private investors to look. For smaller systems, a system may need to be developed to bundle water infrastructure projects whose scale would otherwise not rise to the level that draws the attention of institutional investors.
One cannot underestimate the political challenges that may come from contracting with a private company for any portion of a publicly owned water or sewer system. For instance, when task force member George Heartwell, the former mayor of Grand Rapids, MI, was rumored to be considering privatization to reduce city spending, there was immediate push-back from those who believe that seeking a return on an investment is in conflict with providing safe drinking water access, which many see as a right. As one opponent stated: “We cannot let something as fundamental to our lives as access to clean water be placed in the hands of private corporations. We all should send a message to the city that this is unacceptable and organize ourselves in order to fight this proposed privatization.”62

19 bipartisanpolicy.org
In a climate where some corporations are associated negatively with globalization, the notion that a private entity would control a community’s water system is concerning to some. However, what this view fails to take into account is that the publicly owned utilities are also businesses that must balance their books and what is paramount is who is most able to deliver clean water. In some cases, the answer is privately regulated companies that are subject to regulation by state public utility commissions. In other cases, it will be publicly owned utilities that are subject to oversight by locally elected officials. Both options should be available to local governments to consider what is best for their constituents and their environment.

20bipartisanpolicy.org
Future Focus Areas
Earlier this year, BPC’s Executive Council on Infrastructure issued several recommendations to help the private and public sectors modernize the nation’s infrastructure, including water systems and POTWs. Following the release of the recommendations, BPC has embarked on an effort to dive further into the water infrastructure funding gap and hopes to work with other leaders in the field to bring attention to the nation’s water infrastructure issues. Through this series of papers, BPC seeks to raise the profile of the nation’s water and wastewater systems and highlight some critical issues to which policymakers must give considerable consideration. These issues are briefly described below and will be the subject of our future work at BPC.
Public Education
Much more needs to be done to inform the public about the state of the nation’s water infrastructure. Water main breaks are largely reported for the effect they have on traffic—not for the amount of water lost or the cost to recoup that water. The public expects that when they turn on their tap, clean, safe water will come out. Today, water is viewed more as a certainty, rather than as a commodity that must be monitored, conserved, and maintained. For example, cities across the country have been sued by irate customers when they imposed fees to pay for federally mandated stormwater improvements.63 The U.S. Water Alliance created several free sample public service announcements that local utilities can use to educate consumers about the complexity and costs of providing water and sewer services, but for the public to fully appreciate the value and needs of water, much more public education will be needed.64
Low-Income Ratepayers
Among our nation’s most critical challenges is how to price water to reflect the true value of service without impacting residents already struggling to pay their bills. While many utilities across the country have lifeline programs to help low-income customers with their water and sewer bills, too many customers continue to struggle. A federal intervention could standardize these lifeline practices and help ensure affordability. The Low Income Home Energy Assistance Program (LIHEAP), which helps low-income households pay their electric bills, provides a model that could also be applied to water utilities. LIHEAP is administered through local aid agencies and provides assistance directly to customers. LIHEAP, however, is subject to annual appropriations and each year, federal decision-makers are accused of underfunding the program.
Small Systems
As noted above, small communities have unique challenges and receive targeted federal assistance, including: the majority of assistance agreements from the SRFs, USDA loans and grants set aside solely for small rural systems, and EPA and USDA training programs for small-system operators. Despite the availability of this assistance, small systems continue to struggle. One potential solution is to combine small-system service areas so that one system serves more people, reducing compliance and operation costs while enabling better, more focused training. However, consolidation of systems is not without political risks as small towns have a strong sense of identity often tied up in their utilities and other government services. Furthermore, this solution is not viable for isolated small systems where the distance to join the nearest neighboring service can be insurmountable.

21 bipartisanpolicy.org
Energy consumption is one of the largest expenses for any utility, and some have recommended that small systems should look to incorporate energy-efficiency programs to save money and reallocate saved funds to other services.65 Though notably, any significant efficiency projects would likely require upfront capital.
Public-Private Partnerships
Increasing the use of public-private partnerships in the water sector has the potential to deliver needed projects more quickly, increase efficiency, and reduce costs down the road. A lack of state-enabling laws, a complex permitting and regulatory environment, and public concern are all key barriers to P3s that should be addressed. Federal action to encourage municipalities to evaluate P3s could help, as well as amendments to federal regulations that make P3s difficult. Repealing rules that require tax-exempt municipal debt to be repaid before a publicly financed water facility can be transferred to private ownership, for example, would allow the benefits of such financing to continue to accrue to ratepayers in the community. State action is also needed; in particular, legislative changes may be required to provide municipalities with a full range of delivery and financing options for addressing their water needs.
Technological Innovation
Emerging technologies have the potential to deliver cleaner water at a lower cost. Many such innovations are available today, yet it is difficult for the water industry to incorporate them as many places are struggling simply to continue providing service, while others consider implementing new and less common technologies to be too risky. While there is typically an upfront cost to incorporate new technologies, the benefits may be realized long into the future. A new national focus on innovative technology in the water sector could help to provide incentives for development and deployment of more efficient, higher-performing water infrastructure. It will be important to consider how policymakers can create a safe space for water and wastewater utilities to innovate without threatening the public health or the environment and while avoiding compliance actions or lawsuits.

22bipartisanpolicy.org
Conclusion
The nation’s nearly 15,000 publicly owned treatment works and 52,000 community water systems provide vital, underappreciated services. No one can argue the importance of water and sewer service in maintaining public health, protecting the environment, and promoting economic development. Yet, the value of these resources is not reflected in the nation’s priorities. Given the severity of the challenge and the wide variety of systems at risk, the United States needs a national, strategic conversation about how to address the health and environmental threats that are looming in communities across the country.
The nation must embark on a discussion about solutions: Are higher customer fees and declining (or stagnating) federal funds the means by which the government should address rising infrastructure costs, which are in part driven by federal regulatory compliance? In our next several papers, BPC will explore issues related to providing safe, reliable, and affordable services for low-income Americans; the role of federal and state funding and public-private partnerships, particularly for smaller systems; and leveraging new technologies to provide cleaner, more environmentally friendly, and more efficient water services.
23 bipartisanpolicy.org
U.S. Environmental Protection Agency, Clean Water State Revolving Fund
Grants funds to states that provide loans to communities of all sizes for wastewater treatment infrastructure, nonpoint pollution management, and estuary programs.
U.S. Environmental Protection Agency, Drinking Water State Revolving Fund
Grants funds to states that provide loans to communities of all sizes for drinking water infrastructure.
U.S. Department of Agriculture, Rural Utilities Service, Water and Waste Disposal Program
Provides funding for water and wastewater infrastructure projects in communities with populations of less than 10,000.
U.S. Department of Housing and Urban Development, Community Development Block Grant
Provides block grant funds to states for distribution to communities, and to certain metropolitan areas. Communities use these funds for a broad range of activities including water and wastewater infrastructure. According to department officials, about 10 percent of funding is used for this purpose.
U.S. Department of Commerce, Economic Development Administration, Public Works and Economic Development Program
Provides grants to small and disadvantaged communities to construct public facilities, including drinking water and wastewater facilities, to alleviate unemployment.
U.S. Army Corps of Engineers Provides assistance for water and wastewater infrastructure projects, typically for specific locations as authorized by Congress.
U.S. Department of the Treasury, Internal Revenue Service
Administers provisions for tax-exempt bonds issued by local governments to finance qualified projects.
Bureau of Reclamation Provides assistance for water supply projects through individual projects and under its rural water supply program.
Indian Health Service Provides funding for water and wastewater infrastructure on tribal lands.
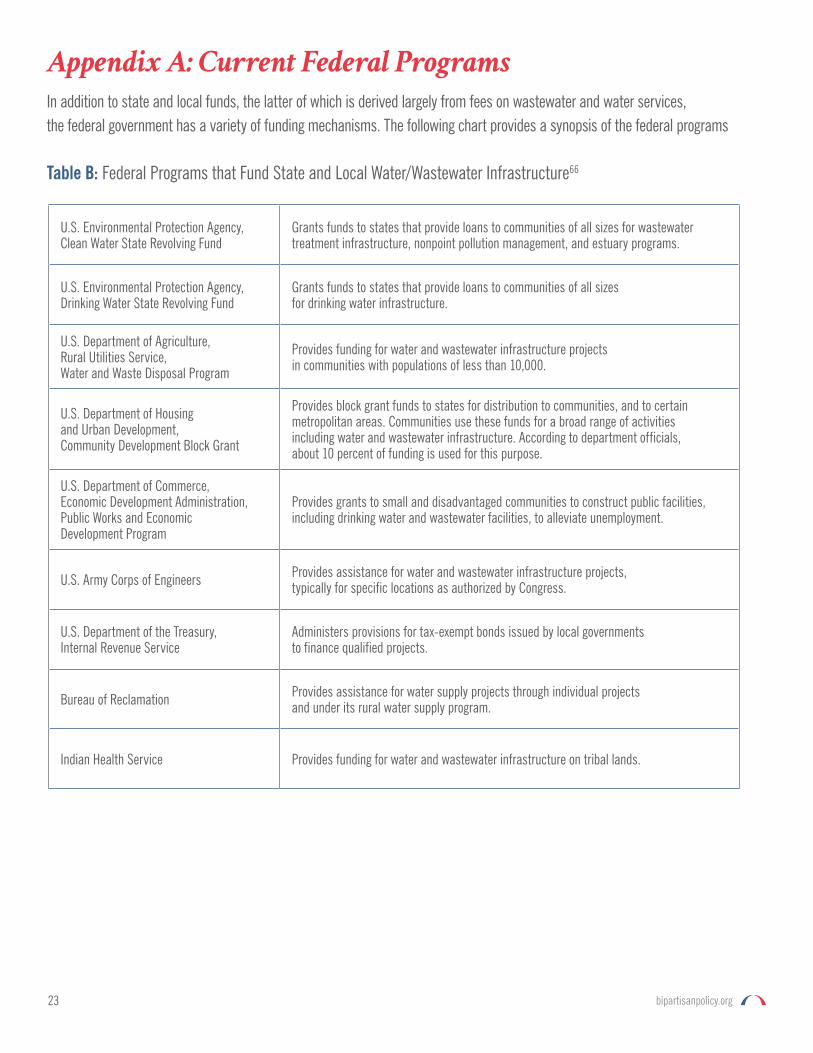
Appendix A: Current Federal Programs
In addition to state and local funds, the latter of which is derived largely from fees on wastewater and water services, the federal government has a variety of funding mechanisms. The following chart provides a synopsis of the federal programs
Table B: Federal Programs that Fund State and Local Water/Wastewater Infrastructure66

24bipartisanpolicy.org
1 Circle of Blue, “The Age of U.S. Drinking Water Pipes From Civil War Era to Today,” 2016. Available at: http://www.circleofblue.org/2016/world/infographic-the-age-of-u-s-drinking-water-pipes-from-civil-war-era-to-today.
2 U.S. Environmental Protection Agency, Drinking Water: EPA Needs to Take Additional Steps to Ensure Small Community Water Systems Designated as Serious Violators Achieve Compliance, Report No. 16-P-0108, March 2016. Available at: https://www.epa.gov/sites/production/files/2016-03/documents/20160322-16-p-0108.pdf.
3 The Johnson Foundation at Wingspread, Financing Sustainable Water Infrastructure, January 2012. Available at: http://www.johnsonfdn.org/sites/default/files/reports_publications/WaterInfrastructure.pdf.
4 American Society of Civil Engineers, Failure to Act: The Economic Impact of Current Investment Trends in Water and Wastewater Treatment Infrastructure, 2011, 4. Available at: http://www.asce.org/uploadedfiles/issues_and_advocacy/our_initiatives/infrastructure/content_pieces/failure-to-act-water-wastewater-report.pdf.
5 David A. Keiser and Joseph S. Shapiro, “Consequences of the Clean Water Act and the Demand for Water Quality,” The National Bureau of Economic Research, January 2017. Available at: http://www.nber.org/papers/w23070
6 U.S. Environmental Protection Agency, Clean Watersheds Needs Survey Report to Congress, EPA-830-R-15005, January 2016, 25. Available at: https://www.epa.gov/sites/production/files/2015-12/documents/cwns_2012_report_to_congress-508-opt.pdf.
7 Circle of Blue, Infographic: America’s Septic Systems, October 2015. Available at: http://www.circleofblue.org/2015/world/infographic-americas-septic-systems/.
8 U.S. Environmental Protection Agency, Drinking Water Infrastructure Needs Survey and Assessment Fifth Report to Congress, EPA-816-R-13-006, 2013, 9. Available at: https://www.epa.gov/sites/production/files/2015-07/documents/epa816r13006.pdf.
9 Philadelphia Water Department, Water Infrastructure Management. Available at: http://www.phillywatersheds.org/watershed_issues/infrastructure_management.
10 U.S. Government Accountability Office, Water Infrastructure: Information on Selected Midsize and Large Cities with Declining Populations, GAO-16-785, September 2016. Available at: http://www.gao.gov/products/GAO-16-785.
11 DC Water, Blue Plains Advanced Wastewater Treatment Plant. Available at: https://www.dcwater.com/sites/default/files/Blue_Plains_Plant_brochure.pdf.
12 U.S. Environmental Protection Agency, Population Served by Community Water Systems with No Reported Violations of Health-Based Standards, 2016. Available at: https://cfpub.epa.gov/roe/indicator.cfm?i=45.
13 U.S. Department of the Interior, U.S. Geological Survey, “Domestic Water Use,” December 2016. Available at: http://water.usgs.gov/edu/wudo.html.
14 U.S. Fire Administration, Water Supply Systems and Evaluation Methods, October 2008. Available at: https://www.usfa.fema.gov/downloads/pdf/publications/water_supply_systems_volume_i.pdf.
15 Bluefield Research, Crumbling Public Water Infrastructure Signals Larger Role for Private Participation, August 2016. Available at: http://bluefieldresearch.com/larger-role-private-participation/.
16 U.S. Environmental Protection Agency, Drinking Water Infrastructure Needs Survey and Assessment Fifth Report to Congress, EPA-816-R-13-006, 2013. Available at: https://www.epa.gov/sites/production/files/2015-07/documents/epa816r13006.pdf
17 Lucy Wang, “Atlanta’s Mercedes-Benz Stadium to be NFL’s first-ever LEED Platinum venue” Inhabitat.com, September 7, 2016. Available at: http://inhabitat.com/atlantas-mercedes-benz-stadium-to-be-nfls-first-ever-leed-platinum-venue/; See also: Mercedes-Benz Stadium News & Media at: http://mercedesbenzstadium.com/news-community/.
18 Water Research Foundation, Residential End Uses of Water Version 2 Executive Report, April 2016. Available at: http://www.waterrf.org/PublicReportLibrary/4309A.pdf.
19 U.S. Environmental Protection Agency, Federal Register, “National Pollutant Discharge Elimination System Permit Application Regulations for Storm Water Discharges,” November 1990. Available at: https://www.epa.gov/sites/production/files/2015-10/documents/stormwater_phase1_rule.pdf.
Endnotes

25 bipartisanpolicy.org
20 U.S. Environmental Protection Agency, Federal Register, “National Pollutant Discharge Elimination System—Regulations for Revision of the Water Pollution Control Program Addressing Storm Water Discharges,” December 1999. Available at: https://www.epa.gov/sites/production/files/2015-10/documents/sw2-part1.pdf.
21 Union of Concerned Scientists, Is Global Warming Linked to Severe Weather? June 2011. Available at: http://www.ucsusa.org/global_warming/science_and_impacts/impacts/global-warming-rain-snow-tornadoes.html#.WFHlx4WcEpQ.
22 Great Lakes Integrated Sciences + Assessments, University of Michigan and Michigan State University, “Extreme Precipitation.” Available at: http://glisa.umich.edu/climate/extreme-precipitation.
23 U.S. Environmental Protection Agency, “What is a CSO?” February 2016. Available at: https://www3.epa.gov/caddis/ssr_urb_ww2.html.
24 U.S. Environmental Protection Agency, “EPA Survey Shows $271 Billion Needed for Nation’s Wastewater Infrastructure,” January 2016. Available at: https://www.epa.gov/newsreleases/epa-survey-shows-271-billion-needed-nations-wastewater-infrastructure.
25 Circle of Blue, “Price of Water 2015: Up 6 percent in 30 Major U.S. Cities; 41 Percent Rise Since 2010,” April 2015. Available at: http://www.circleofblue.org/2015/world/price-of-water-2015-up-6-percent-in-30-major-u-s-cities-41-percent-rise-since-2010/.
26 Food & Water Watch, The State of Public Water in the United States, February 2016. Available at: http://www.foodandwaterwatch.org/sites/default/files/report_state_of_public_water.pdf.
27 David M. Konisky and Manuel P. Teodoro, “When Governments Regulate Governments,” American Journal of Political Science¸ Vol. 60, Issue 3 (2016). Available at: http://onlinelibrary.wiley.com/doi/10.1111/ajps.12221/abstract.
28 U.S. Government Accountability Office, Water Infrastructure: Information on Selected Midsize and Large Cities with Declining Populations, September 2016. Available at: http://gao.gov/assets/680/679783.pdf.
29 Ibid., 19.
30 Ibid.
31 U.S. Environmental Protection Agency, Clean Watersheds Needs Survey Report to Congress, EPA-830-R-15005, January 2016, 19. Available at: https://www.epa.gov/sites/production/files/2015-12/documents/cwns_2012_report_to_congress-508-opt.pdf.
32 U.S. Environmental Protection Agency, “Learn about the Clean Water State Revolving Loan Fund.” (2016) Available at: https://www.epa.gov/cwsrf/learn-about-clean-water-state-revolving-fund-cwsrf.
33 U.S. Environmental Protection Agency, 2015 Annual Report: Clean Water State Revolving Fund Programs, March 2016. Available at: https://www.epa.gov/sites/production/files/2016-05/documents/2015_annual_report_3-14-16.pdf.
34 U.S. Environmental Protection Agency, “State and National Roll-Up Reports 2016,” October 2016, 10. Available at: https://www.epa.gov/sites/production/files/2016-03/documents/statenatrollup2015.pdf. There have been longstanding issues between the states and the EPA regarding the types of documentation needed to justify costs for the survey. Many states have struggled to adequately explain both the water quality benefits and costs of a stormwater project. Another complaint with the EPA needs survey is estimating infrastructure costs associated with growth. The Drinking Water SRF fails to allow states to list funding needs that primarily accommodate new population growth.
35 U.S. Environmental Protection Agency, “Water Systems Partnerships.” Available at: https://www.epa.gov/sustainable-water-infrastructure/water-system-partnerships.
36 Claudia Copeland, Funding for EPA Water Infrastructure A Fact Sheet, Congressional Research Service, June 2015. Available at: http://nationalaglawcenter.org/wp-content/uploads/assets/crs/R43871.pdf. U.S. Environmental Protection Agency, FY 2017 Budget in Brief, February 2016. Available at: https://www.epa.gov/sites/production/files/2016-02/documents/fy17-budget-in-brief.pdf.
37 U.S. Environmental Protection Agency, The Clean Water and Drinking Water Infrastructure Gap Analysis, EPA-816-R-02-020, September 2002, 8. Available at: https://nepis.epa.gov/Exe/ZyPURL.cgi?Dockey=901R0200.TXT.
38 American Water Works Association, Buried No Longer: Confronting America’s Water Infrastructure Challenge, 2011, 10. Available at: http://www.awwa.org/Portals/0/files/legreg/documents/BuriedNoLonger.pdf.
39 U.S. Environmental Protection Agency, “Affordability Criteria for Small Drinking Water Systems: an EPA Science Advisory Board Report,” December 2002. Available at: https://nepis.epa.gov/Exe/ZyPURL.cgi?Dockey=P100JOKY.TXT

26bipartisanpolicy.org
40 U.S. Conference of Mayors, American Water Works Association, and Water Environment Federation, “Affordability Assessment Tool for Federal Water Mandates,” (2013). Available at: http://www.awwa.org/Portals/0/files/legreg/documents/affordability/AffordabilityAssessmentTool.pdf.
41 Congressional Budget Office, “Testimony: Future Investment in Drinking Water Infrastructure,” April 2002. Available at: https://www.cbo.gov/sites/default/files/107th-congress-2001-2002/reports/04-11-drinkingwaterinfra.pdf.
42 National Association of Clean Water Agencies, “2015 Cost of Clean Water Index,” (2015). Available at: https://www.nacwa.org/docs/default-source/clean-water-current-pdf/31-may-16/2016-05-24-15index-(cost-of-clean-water).pdf.
43 Circle of Blue, “Price of Water 2015: Up 6 percent in 30 Major U.S. Cities; 41 Percent Rise Since 2010,” April 2015. Available at: http://www.circleofblue.org/2015/world/price-of-water-2015-up-6-percent-in-30-major-u-s-cities-41-percent-rise-since-2010/.
44 Veronique Lacapra, “MSD holds public meetings to explain why sewer rates are rising,” St. Louis Public Radio, March 18, 2015. Available at: http://news.stlpublicradio.org/post/msd-holds-public-meetings-explain-why-sewer-rates-are-rising.
45 Rachel Butts and Stephen Gasteyer, “More Cost per Drop: Water Rates, Structural Inequality, and Race in the United States–The Case of Michigan,” Environmental Practice, Vol. 13, Issue 4, December 2011. Available at: https://doi.org/10.1017/S1466046611000391.
46 Detroiters Resisting Emergency Management, “Statement on Water Affordability vs. Water Assistance for DWSD Low Income Customers: Assistance is not Affordability,” April 30, 2015. Available at: www.d-rem.org/statement-on-water-affordability-vs-water-assistance-for-dwsd-low-income-customers-assistance-is-not-affordability.
47 Matthew Yglesias, “Why Detroit is cutting off tap water to thousands of people,” Vox, July 8, 2014. Available at: http://www.vox.com/2014/7/8/5878713/why-detroit-is-cutting-off-tap-water-to-thousands-of-people.
48 Luke Broadwater, “City shuts off water to delinquent residents; hits Baltimore Co. homes hardest,” Baltimore Sun, May 15, 2015. Available at: http://www.baltimoresun.com/news/maryland/baltimore-city/bs-md-ci-water-shutoffs-20150515-story.html.
49 Michael Daisy (eds), “The First 300 Years,” Detroit Water and Sewerage Department. Available at: http://dwsd.org/downloads_n/about_dwsd/history/complete_history.pdf.
50 City of Detroit, “Press Release: New Program to Assist Low-Income Water Customers,” February 2016. Available at: http://www.waynemetro.org/wrap/docman/wrap/345-city-of-detroit-wrap-press-release-2-12-2016/file.
51 U.S. Environmental Protection Agency, Drinking Water and Wastewater Utility: Customer Assistance Programs, April 2016. Available at: https://www.epa.gov/sites/production/files/2016-04/documents/dw-ww_utilities_cap_combined_508.pdf.
52 U.S. Environmental Protection Agency, “Pricing and Affordability of Water Services.” Available at: https://www.epa.gov/sustainable-water-infrastructure/pricing-and-affordability-water-services.
53 Murray, D. J., “Aging Water Infrastructure Research Program: Addressing The Challenge Through Innovation.” U.S. Environmental Protection Agency, 2007. Available at: https://cfpub.epa.gov/si/si_public_record_report.cfm?dirEntryId=185093.
54 CNT, Water Loss Control in the Great Lakes States: A Utility Survey Report, 2012. Available at: http://www.cnt.org/sites/default/files/publications/CNT_WaterLossControl.pdf.
55 CMAP, An Assessment of Water Loss Among Lake Michigan Permittees in Illinois, Chicago Metropolitan Agency for Planning, July 2014. Available at: http://www.cmap.illinois.gov/documents/10180/296743/FY14-0071+IDNR+WATER+LOSS+REPORT/bfda6186-8c79-42b5-80b8-9d97c7c2300d.
56 CNT, Water Loss Control in the Great Lakes States: A Utility Survey Report, 2012. Available at: http://www.cnt.org/sites/default/files/publications/CNT_WaterLossControl.pdf.
57 U.S. Environmental Protection Agency, Water Audits and Water Loss Control for Public Water Systems, April 2015. Available at: https://www.epa.gov/sites/production/files/2015-04/documents/epa816f13002.pdf.
58 Xylem, Inc., Powering the Wastewater Renaissance: Energy Efficiency and Emissions Reduction in Wastewater Management, 2015. Available at: http://poweringwastewater.xyleminc.com/images/Xylem_Wastewater_Renaissance_2015_Report.pdf.
59 Bipartisan Policy Center, “Tolt Water Treatment Facility,” Infrastructure Case Study. Available at: http://bipartisanpolicy.org/wp-content/uploads/2016/10/BPC-Infrastructure-Tolt-Water-Facility.pdf.

27 bipartisanpolicy.org
60 Water Design-Build Council, “Lake Pleasant Water Treatment Plant (AZ).” Available at: http://waterdesignbuild.com/water-design-build-projects/lake-pleasant-water-treatment-plant-az/.
61 National Conference of State Legislatures, “Building Up: How States Utilize Public-Private Partnerships for Social and Vertical Infrastructure,” May 2016. Available at: http://www.ncsl.org/research/transportation/building-up-how-states-utilize-public-private-partnerships-for-public-multi-sector-vertical-infrastructure.aspx.
62 Jeff Smith, “Heartwell Proposes Grand Rapids Privatize Water Services,” Grand Rapids Institute for Information Democracy, September 29, 2010. Available at: https://griid.org/2010/09/29/heartwell-proposes-grand-rapids-privatize-water-services/.
63 National Association of Clean Water Agencies, Navigating Litigation Floodwaters: Legal Considerations for Funding Municipal Stormwater Programs, 2014, 7. Available at: http://stormwater.wef.org/wp-content/uploads/2015/01/NACWAs-Navigating-Ligitagtion-Floodwaters.pdf.
64 U.S. Water Alliance, Value of Water Campaign’s Communications Toolkit. Available at: http://thevalueofwater.org/mediakit/preview
65 Art Haddaway, “Rural Revenue: A Look at Small Water and Wastewater Utility Cost Challenges and Solutions,” WaterWorld, June 2014. Available at: http://www.waterworld.com/articles/print/volume-30/issue-6/editorial-features/rural-revenue-a-look-at-small-water-and-wastewater-utility-cost-challenges-and-solutions.html.
66 U.S. Government Accountability Office, “Testimony: Water Infrastructure: Approaches and Issues for Financing Drinking Water and Wastewater Infrastructure,” March 2013. Available at: http://www.gao.gov/assets/660/652976.pdf.

28bipartisanpolicy.org
Notes

29 bipartisanpolicy.org
Notes

BPC Policy Areas
Economy
Energy
Finance
Governance
Health
Housing
Immigration
Infrastructure
National Security
@BPC_Bipartisan facebook.com/BipartisanPolicyCenter instagram.com/BPC_Bipartisan flickr.com/BPC_Bipartisan
2017 marks the Bipartisan Policy Center’s 10th anniversary. For a decade, BPC hasworkedtofindactionablesolutionstoAmerica’smajorpolicychallenges.
Celebrating ten years of productive partisanship.
TheBipartisanPolicyCenterisanon-profitorganizationthatcombinesthebestideas
from both parties to promote health, security, and opportunity for all Americans. BPC
drives principled and politically viable policy solutions through the power of rigorous
analysis, painstaking negotiation, and aggressive advocacy.
bipartisanpolicy.org | 202-204-2400
1225 Eye Street NW, Suite 1000 |Washington, D.C. 20005

1225 Eye Street NW, Suite 1000 | Washington, D.C. 20005
202-204-2400| bipartisanpolicy.org


