INTEREST RATES Understanding Deliverable Swap Futures FEBRUARY 1, 2013 John W. Labuszewski Michael Kamradt David Gibbs Managing Director Executive Director Director Financial Research & Product Development 312-466-7469 [email protected]Interest Rate Products 312-466-7473 [email protected]Product Marketing 312-207-2591 [email protected]
Volatile conditions in the capital market have proven
quite challenging for asset managers in recent
years. We continue to deal with the fallout of the
subprime mortgage crisis that has witnessed the
failure of several venerable financial services firms
and compelled the Fed to push both short- and long-
term interest rates to historic lows.
Throughout this period of turbulence, CME Group
has continued to offer risk management solutions for
investors and asset managers. The Dodd Frank
financial reform legislation has been a significant
driving force in the OTC swap markets, calling for
greater transparency and financial sureties.
Deliverable USD Interest Rate Swap Futures (DSF)
answers that call and represents an important new
addition to CME’s product line of risk management
tools.
DSF contracts are intended to provide a liquid
means of managing rate exposure, offering the
opportunity to trade actual interest rate swaps on a
forward basis with the financial protections
attendant to a standard futures contract. Unlike
previously listed cash-settled interest rate swap
futures, DSF contracts provide for the delivery of
“plain-vanilla” interest rate swaps (“IRS” or “swaps”)
carried by the CME Clearing House.
As such, DSFs blend the advantages of trading both
futures and over-the-counter (OTC) derivative
instruments in a consolidated package. These
instruments provide new opportunities for asset
managers to address the risks attendant to the IRS
markets and other fixed income securities.
This document is intended to review how DSF
contracts are constructed and how they may be
applied to a number of risk management issues. In
particular, we explore use of DSF contracts to hedge
a spot IRS instrument; a cash Treasury security;
and, a spread vs. Treasury futures.
Deliverable Swap Futures
DSF contracts call for the delivery of an interest rate
swap instrument through the facilities of the CME
Clearing House. These delivered swaps are
structured using very standardized or plain-vanilla
terms and conditions.
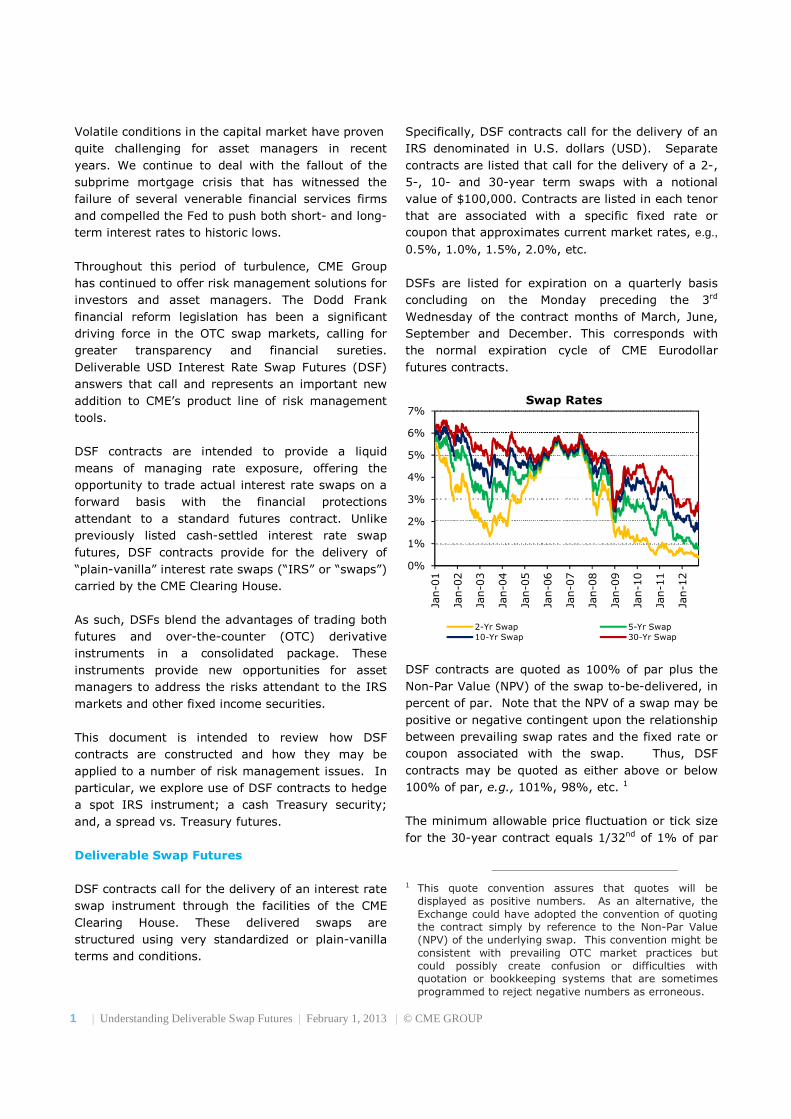
Specifically, DSF contracts call for the delivery of an
IRS denominated in U.S. dollars (USD). Separate
contracts are listed that call for the delivery of a 2-,
5-, 10- and 30-year term swaps with a notional
value of $100,000. Contracts are listed in each tenor
that are associated with a specific fixed rate or
coupon that approximates current market rates, e.g.,
0.5%, 1.0%, 1.5%, 2.0%, etc.
DSFs are listed for expiration on a quarterly basis
concluding on the Monday preceding the 3rd
Wednesday of the contract months of March, June,
September and December. This corresponds with
the normal expiration cycle of CME Eurodollar
futures contracts.
DSF contracts are quoted as 100% of par plus the
Non-Par Value (NPV) of the swap to-be-delivered, in
percent of par. Note that the NPV of a swap may be
positive or negative contingent upon the relationship
between prevailing swap rates and the fixed rate or
coupon associated with the swap. Thus, DSF
contracts may be quoted as either above or below
100% of par, e.g., 101%, 98%, etc. 1
The minimum allowable price fluctuation or tick size
for the 30-year contract equals 1/32nd of 1% of par
1 This quote convention assures that quotes will be
displayed as positive numbers. As an alternative, the Exchange could have adopted the convention of quoting the contract simply by reference to the Non-Par Value (NPV) of the underlying swap. This convention might be consistent with prevailing OTC market practices but could possibly create confusion or difficulties with quotation or bookkeeping systems that are sometimes programmed to reject negative numbers as erroneous.
or $31.25, based on a $100,000 face value contract
($31.25 = 1/32nd of 1% of $100,000). The tick
sizefor 10- and 5-year contracts is established at
one-half of 1/32nd or $15.625 per contract. The tick
size for the 2-year contract is one-quarter of 1/32nd
or $7.8125 per contract.
Upon delivery of an actual swap in satisfaction of a
maturing contract, an invoice amount is paid from
long to short; or, from short to long, as appropriate.
This cash adjustment reflects the NPV of the
underlying swap as reflected in the futures
settlement price on the final trading day of the DSF
contract.
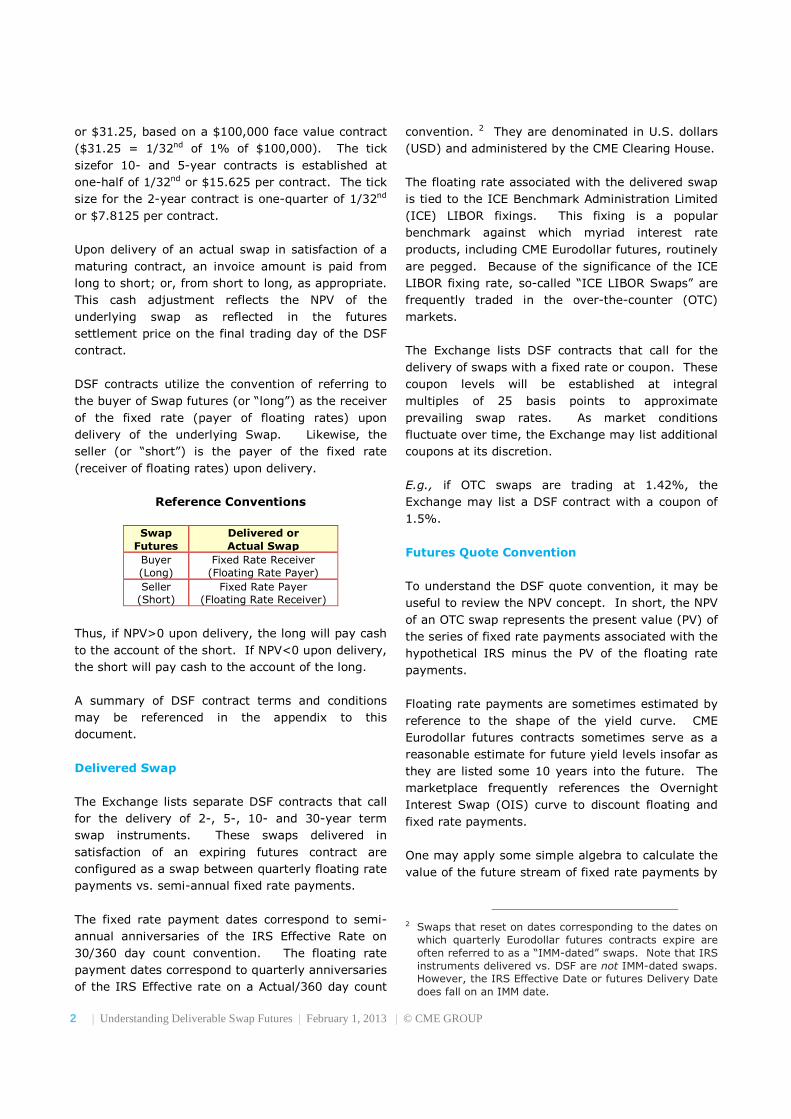
DSF contracts utilize the convention of referring to
the buyer of Swap futures (or “long”) as the receiver
of the fixed rate (payer of floating rates) upon
delivery of the underlying Swap. Likewise, the
seller (or “short”) is the payer of the fixed rate
(receiver of floating rates) upon delivery.
Reference Conventions
Swap
Futures
Delivered or
Actual Swap
Buyer (Long)
Fixed Rate Receiver (Floating Rate Payer)
Seller (Short)
Fixed Rate Payer (Floating Rate Receiver)
Thus, if NPV>0 upon delivery, the long will pay cash
to the account of the short. If NPV<0 upon delivery,
the short will pay cash to the account of the long.
A summary of DSF contract terms and conditions
may be referenced in the appendix to this
document.
Delivered Swap
The Exchange lists separate DSF contracts that call
for the delivery of 2-, 5-, 10- and 30-year term
swap instruments. These swaps delivered in
satisfaction of an expiring futures contract are
configured as a swap between quarterly floating rate
payments vs. semi-annual fixed rate payments.
The fixed rate payment dates correspond to semi-
annual anniversaries of the IRS Effective Rate on
30/360 day count convention. The floating rate
payment dates correspond to quarterly anniversaries
of the IRS Effective rate on a Actual/360 day count
convention. 2 They are denominated in U.S. dollars
(USD) and administered by the CME Clearing House.
The floating rate associated with the delivered swap
is tied to the ICE Benchmark Administration Limited
(ICE) LIBOR fixings. This fixing is a popular
benchmark against which myriad interest rate
products, including CME Eurodollar futures, routinely
are pegged. Because of the significance of the ICE
LIBOR fixing rate, so-called “ICE LIBOR Swaps” are
frequently traded in the over-the-counter (OTC)
markets.
The Exchange lists DSF contracts that call for the
delivery of swaps with a fixed rate or coupon. These
coupon levels will be established at integral
multiples of 25 basis points to approximate
prevailing swap rates. As market conditions
fluctuate over time, the Exchange may list additional
coupons at its discretion.
E.g., if OTC swaps are trading at 1.42%, the
Exchange may list a DSF contract with a coupon of
1.5%.
Futures Quote Convention
To understand the DSF quote convention, it may be
useful to review the NPV concept. In short, the NPV
of an OTC swap represents the present value (PV) of
the series of fixed rate payments associated with the
hypothetical IRS minus the PV of the floating rate
payments.
Floating rate payments are sometimes estimated by
reference to the shape of the yield curve. CME
Eurodollar futures contracts sometimes serve as a
reasonable estimate for future yield levels insofar as
they are listed some 10 years into the future. The
marketplace frequently references the Overnight
Interest Swap (OIS) curve to discount floating and
fixed rate payments.
One may apply some simple algebra to calculate the
value of the future stream of fixed rate payments by
2 Swaps that reset on dates corresponding to the dates on
which quarterly Eurodollar futures contracts expire are often referred to as a “IMM-dated” swaps. Note that IRS instruments delivered vs. DSF are not IMM-dated swaps. However, the IRS Effective Date or futures Delivery Date does fall on an IMM date.
E.g., let’s calculate the NPV of a 2-year IRS with a
coupon of 0.5% as of November 27, 2012. For
these purposes, we might assume that the floating
rate payments may be estimated by reference to the
Bloomberg Eurodollar forward curve. This curve is
calculated based upon term Eurodollar rates
supplemented by references to rates gleaned from
Eurodollar futures markets and long-term IRS
markets. We discount the net floating vs. fixed rate
payments by reference to the OIS curve.
Our analysis suggests that the PV of the fixed rate
payments exceeds that of the floating rate payments
by $154.38 per $100,000 in face value. This result
is intuitive to the extent that the coupon on 2-year
LIBOR-based swaps was trading at 0.42%, and
below the DSF coupon of 0.50%, when this analysis
was conducted. 3
3 This analysis relied upon Bloomberg’s “Swap Manager” or
“SWPM” functionality. To use this functionality, identify the specific DSF by reference to its ticker. Bloomberg designates 2-, 5-, 10- and 30-year DSF as CTP, CFP, CNP and CBP, respectively. Attach a reference to the
Mar-13 Two-Year DSF w/ 0.50% Coupon
(As of November 27, 2012)
Payment
Date
Fixed
Payment
Floating
Payment
Net
Payment
Discount
Factor
Present
Value
3/20/13 $0.00 $0.00 $0.00 0.999548 $0.00
6/20/13 $0.00 $84.10 -$84.10 0.999196 -$84.03
9/20/13 $250.00 $89.01 $160.99 0.998833 $160.80
12/20/13 $0.00 $92.92 -$92.92 0.998441 -$92.78
3/20/14 $250.00 $98.85 $151.15 0.998025 $150.85
6/20/14 $0.00 $106.97 -$106.97 0.997565 -$106.71
9/22/14 $252.78 $118.16 $134.62 0.997009 $134.22
12/22/14 $0.00 $123.98 -$123.98 0.996389 -$123.53
3/20/15 $247.22 $131.15 $116.07 0.995600 $115.56
$154.38
Source: Bloomberg
DSFs are quoted as 100% of par + the Non-Par
Value (NPV) of the swap to-be-delivered. NPV is
transformed into % of par to facilitate display of the
month and year to the ticker per standard conventions, e.g., H3 currently is a reference to March 2013, M3 a reference to June 2013, U3 to September 2013 and Z3 to December 2013. By typing in “CTPH3 <Comdty> DES <GO>” one arrives at a descriptive landing page for the 2-year DSF. From the descriptive landing page DES, select “Swap Manager (SWPM)” to view real-time implied DSF pricing based on forward staring interest rate swaps. Further details regarding the calculations are accessible from the SWPM page as well including the interest rate curves references, cash flows, scenario analysis, etc. Bloomberg provides a series of recommended settings but users may override these recommendations in order to deploy their own preferred settings as well. This tool represents a powerful and efficient functionality. Note that this analysis does not take into account cost of carry considerations. However, carry may generally be rather negligible to the extent that an OTC IRS instrument may generally be transacted on a par basis with no explicit up-front payment or cost. In any event, the results of this analysis do not necessarily indicate where DSF will trade but might be considered a general guidance or reference.
million face value unit of the security might decline
by $915.
Hedge Ratio
The fundamental objective of a hedge is to balance
any loss (profit) in the hedged market with an equal
and opposite profit (loss) in futures. Consider the
hedge ratio (HR) that allows one to balance the
change in the value of the instrument to be hedged
(∆hedge) with any change in the value of the DSF
contract (∆DSF). We use the Greek letter delta or ∆ to
denote the concept of a change in value.
∆01231= 4��∆567
We solve for the hedge ratio (HR) as follows.
4� = ∆01231 ÷ ∆567
Because the concept of a “change in value” is rather
abstract, this equation cannot readily be deployed in
practice. But we could readily use notions such as
duration or BPV to measure changes in value. Thus,
substituting the term BPV for ∆, we arrive at the
following general formula.
4� = 9��01231 ÷ 9��567
The BPV or DV01 of a DSF may be calculated simply
by “shocking” the calculations as illustrated in our
pricing example above by 1 basis point. I.e.,
compare the current NPV with the NPV calculated
assuming that yields fluctuate uniformly by 1 basis
point.
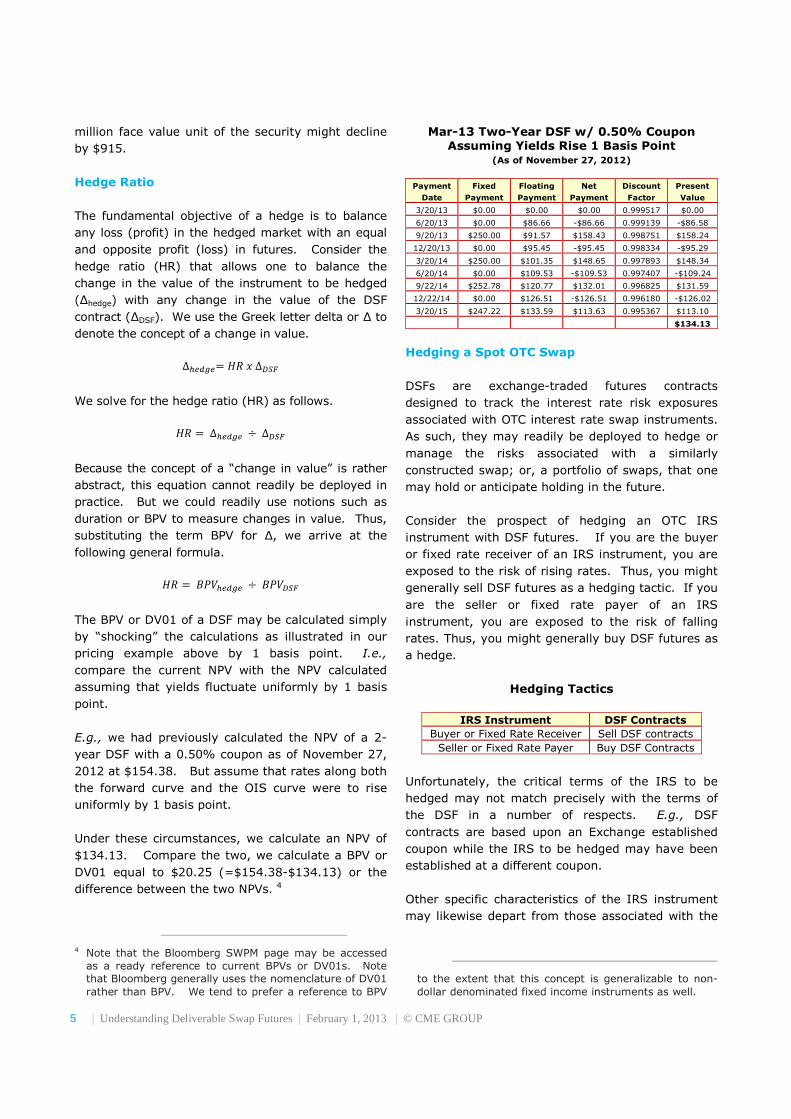
E.g., we had previously calculated the NPV of a 2-
year DSF with a 0.50% coupon as of November 27,
2012 at $154.38. But assume that rates along both
the forward curve and the OIS curve were to rise
uniformly by 1 basis point.
Under these circumstances, we calculate an NPV of
$134.13. Compare the two, we calculate a BPV or
DV01 equal to $20.25 (=$154.38-$134.13) or the
difference between the two NPVs. 4
4 Note that the Bloomberg SWPM page may be accessed
as a ready reference to current BPVs or DV01s. Note that Bloomberg generally uses the nomenclature of DV01 rather than BPV. We tend to prefer a reference to BPV
important of these characteristics is the reference
floating rate.
But presuming that the terms are reasonably
similar, in particular, if we assume that the IRS to
be hedged is based upon the ICE 3-month USD
LIBOR rate, it is likely that there is sufficient
correlation to create an effective hedge. Towards
that end, one readily may deploy the hedge ratio
calculation as shown above. 5
E.g., consider a hedge of a long $10 million notional
value unit of a 1.65% coupon 10-year IRS
instrument with an effective date of November 1,
2012. By November 28th, it had a NPV of $46.25
per $100,000 notional; or, $4,625 per $10 million
notional. 6 It had a BPV of $95.67 per $100,000
notional or $9,567 per $10 million notional.
A hypothetical Mar-13 10-year DSF with a 2%
coupon had a NPV of $2,459.55 and a BPV of $99.21
per $100,000 notional. This suggests that one
might sell 96 Ten-year DSF futures to hedge this
risk.
4� = $9,567 ÷ $99.21 = 96.43���<==96>�����>��
Note that the aggregate Basis Point Value (BPV) of
96 short DSFs equals $9,524 (=96 x $99.21) which
is comparable to the BPV of the hedged IRS
instrument of $9,567. The aggregate Non Par Value
(NPV) of 96 short DSFs equals $236,117 (=96 x
$2,459.55).
What might happen if interest rates along the
forward and OIS curves were uniformly to rise or fall
5 Fixed income instruments, including IRS instruments, may
represent varying points along the yield curve in terms of maturity or reset dates. Use of the BPV hedge ratio implies a presumption that yields might move in parallel or equally along the curve. This presumption may serve a hedger well although we note that fixed income traders may very well harbor beliefs about the prospective future shape of the yield curve. If one believed that the curve would steepen or flatten, this could impact one’s hedging strategy.
6 For these purposes and as a matter of simplification, we do not consider any accrued interest associated with the OTC IRS instrument.
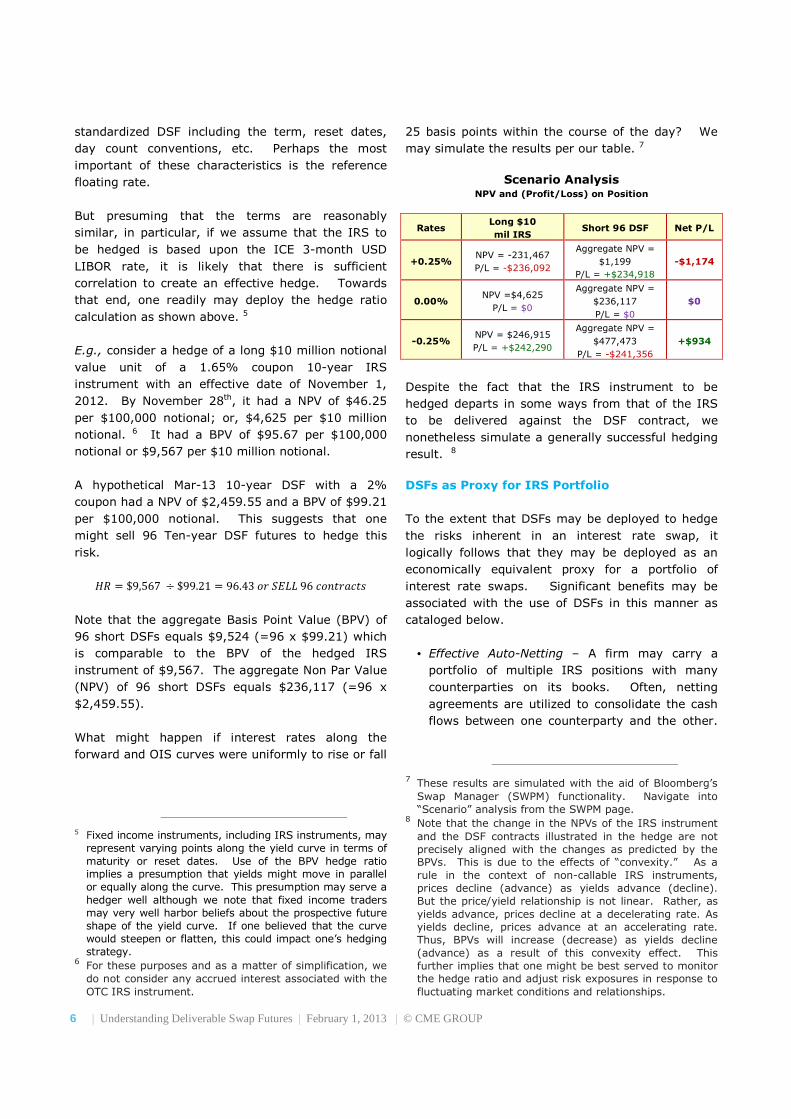
25 basis points within the course of the day? We
may simulate the results per our table. 7
Scenario Analysis
NPV and (Profit/Loss) on Position
Rates Long $10
mil IRS Short 96 DSF Net P/L
+0.25% NPV = -231,467
P/L = -$236,092
Aggregate NPV =
$1,199
P/L = +$234,918
-$1,174
0.00% NPV =$4,625
P/L = $0
Aggregate NPV =
$236,117
P/L = $0
$0
-0.25% NPV = $246,915
P/L = +$242,290
Aggregate NPV =
$477,473
P/L = -$241,356
+$934
Despite the fact that the IRS instrument to be
hedged departs in some ways from that of the IRS
to be delivered against the DSF contract, we
nonetheless simulate a generally successful hedging
result. 8
DSFs as Proxy for IRS Portfolio
To the extent that DSFs may be deployed to hedge
the risks inherent in an interest rate swap, it
logically follows that they may be deployed as an
economically equivalent proxy for a portfolio of
interest rate swaps. Significant benefits may be
associated with the use of DSFs in this manner as
cataloged below.
• Effective Auto-Netting – A firm may carry a
portfolio of multiple IRS positions with many
counterparties on its books. Often, netting
agreements are utilized to consolidate the cash
flows between one counterparty and the other.
7 These results are simulated with the aid of Bloomberg’s
Swap Manager (SWPM) functionality. Navigate into “Scenario” analysis from the SWPM page.
8 Note that the change in the NPVs of the IRS instrument and the DSF contracts illustrated in the hedge are not precisely aligned with the changes as predicted by the BPVs. This is due to the effects of “convexity.” As a rule in the context of non-callable IRS instruments, prices decline (advance) as yields advance (decline). But the price/yield relationship is not linear. Rather, as yields advance, prices decline at a decelerating rate. As yields decline, prices advance at an accelerating rate. Thus, BPVs will increase (decrease) as yields decline (advance) as a result of this convexity effect. This further implies that one might be best served to monitor the hedge ratio and adjust risk exposures in response to fluctuating market conditions and relationships.
year DSF contracts to address the risks associated
with that $10 million face value unit of the 10-year
U.S. Treasury note.
One might further trade DSF contracts vs. cash U.S.
Treasuries in anticipation of movement in these yield
spreads. To the extent that private credit risks are
represented in the LIBOR rate while public credit
risks are represented in U.S. Treasuries, one would
expect that U.S. Treasury yields would consistently
be less than the implicit yield on an IRS instrument.
Classically one might buy U.S. Treasuries and sell
private credit instruments in anticipation of credit
episodes and widening spreads. Or, sell Treasuries
and buy private credit instruments in anticipation of
improving credit quality and narrowing spreads.
Credit Conditions
Improving �
BUY Swaps & SELL
U.S. Treasuries
Credit Conditions
Deteriorating �
SELL Swaps & BUY
U.S. Treasuries
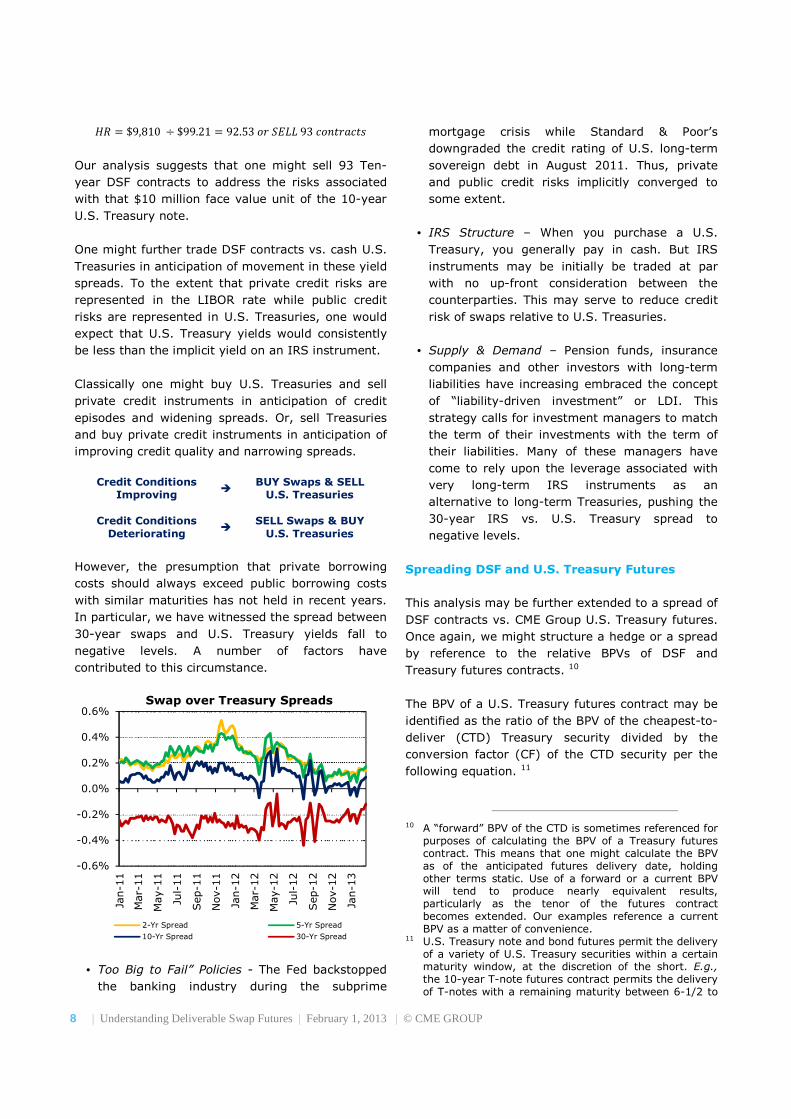
However, the presumption that private borrowing
costs should always exceed public borrowing costs
with similar maturities has not held in recent years.
In particular, we have witnessed the spread between
30-year swaps and U.S. Treasury yields fall to
negative levels. A number of factors have
contributed to this circumstance.
• Too Big to Fail” Policies - The Fed backstopped
the banking industry during the subprime
mortgage crisis while Standard & Poor’s
downgraded the credit rating of U.S. long-term
sovereign debt in August 2011. Thus, private
and public credit risks implicitly converged to
some extent.
• IRS Structure – When you purchase a U.S.
Treasury, you generally pay in cash. But IRS
instruments may be initially be traded at par
with no up-front consideration between the
counterparties. This may serve to reduce credit
risk of swaps relative to U.S. Treasuries.
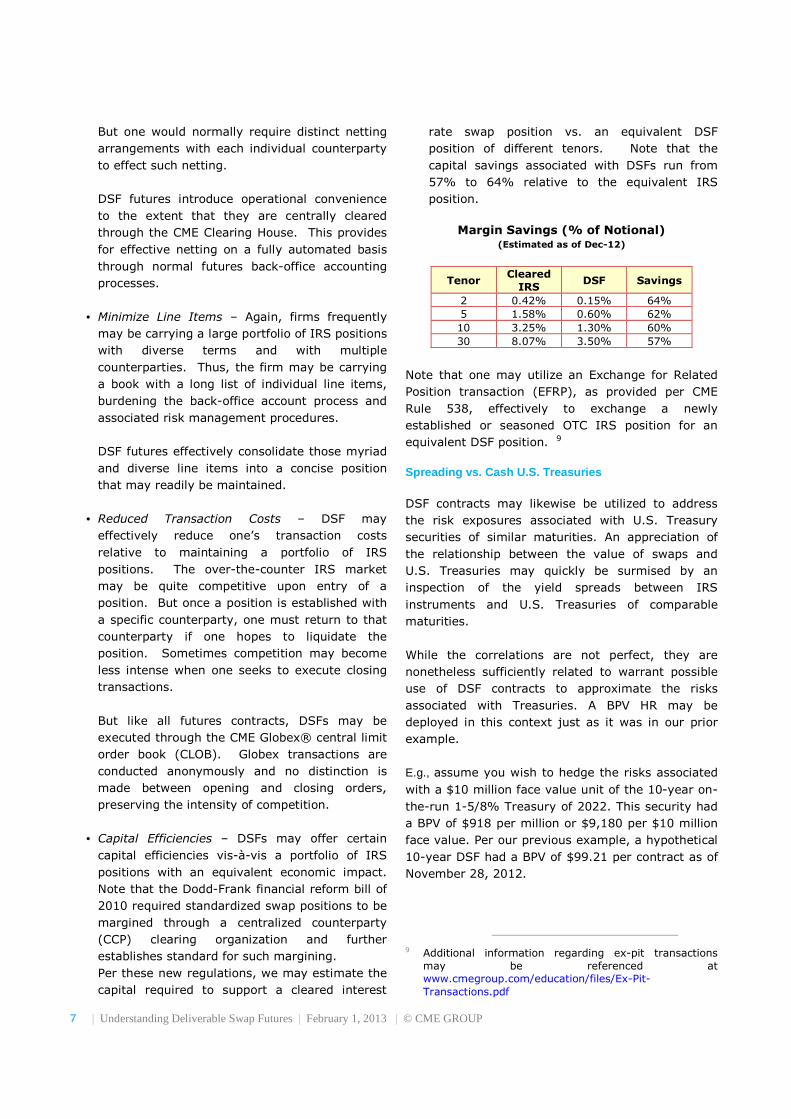
• Supply & Demand – Pension funds, insurance
companies and other investors with long-term
liabilities have increasing embraced the concept
of “liability-driven investment” or LDI. This
strategy calls for investment managers to match
the term of their investments with the term of
their liabilities. Many of these managers have
come to rely upon the leverage associated with
very long-term IRS instruments as an
alternative to long-term Treasuries, pushing the
30-year IRS vs. U.S. Treasury spread to
negative levels.
Spreading DSF and U.S. Treasury Futures
This analysis may be further extended to a spread of
DSF contracts vs. CME Group U.S. Treasury futures.
Once again, we might structure a hedge or a spread
by reference to the relative BPVs of DSF and
Treasury futures contracts. 10
The BPV of a U.S. Treasury futures contract may be
identified as the ratio of the BPV of the cheapest-to-
deliver (CTD) Treasury security divided by the
conversion factor (CF) of the CTD security per the
following equation. 11
10 A “forward” BPV of the CTD is sometimes referenced for
purposes of calculating the BPV of a Treasury futures contract. This means that one might calculate the BPV as of the anticipated futures delivery date, holding other terms static. Use of a forward or a current BPV will tend to produce nearly equivalent results, particularly as the tenor of the futures contract becomes extended. Our examples reference a current BPV as a matter of convenience.
11 U.S. Treasury note and bond futures permit the delivery of a variety of U.S. Treasury securities within a certain maturity window, at the discretion of the short. E.g., the 10-year T-note futures contract permits the delivery of T-notes with a remaining maturity between 6-1/2 to
follows, substituting the foregoing quantity for the
BPV of the item to be hedged.
4� =I9��GF2H�GF2 J ÷ 9��567
E.g., on November 28, 2012, the CTD 10-year
Treasury security vs. Mar-12 Ten-year T-note
futures was identified as the 3-3/8% U.S. Treasury
of 2019. It had a BPV of $72.90 per $100,000 face
value with a CF for delivery vs. the Mar-12 Treasury
futures of 0.8604.
4� =#$72.900.8604+ ÷ $99.21 = 0.85
This suggests that one might hedge or spread 10-
year DSFs vs. 10-year Treasury futures in a ratio of
0.85 or 17 DSF contracts for every 20 Treasury
futures. This result is intuitive to the extent that the
CTD U.S. Treasury security had a maturity of 2019
or just 7 years from November, 2012.
Thus, 10-year Treasury futures were tracking or
correlated most closely with a relatively short
maturity security compared with the 10-year term of
the IRS instrument to be delivered in satisfaction of
10 years. This includes a rather wide variety of securities with varying coupons and terms until maturity. Because these securities may be valued at various levels, the contract utilized a Conversion Factor (CF) invoicing system to determine the price paid by long to compensate the short for the delivery of the specific security. Specifically, the principal invoice amount paid from long to short upon delivery of securities is calculated as a function of the futures price multiplied by the CF. Technically, CFs are calculated as the price of the particular security as if they were yielding the “futures contract standard” of 6%. The system is intended to render equally economic the delivery of any eligible for delivery security. However, the mathematics of the CF system is such that a single security tends to stand out as most economic or cheapest-to-deliver (CTD) in light of the relationship between the invoice price of the security vs. the current market price of the security. Typically, long duration securities are CTD when prevailing yields are in excess of the 6% futures market standard; while short duration securities are CTD when prevailing yields are less than 6%. It is important to identify the CTD security because futures will tend to price or track or correlate most closely with the CTD.
a 10-year DSF. As a result, one may hedge with
fewer DSF contracts.
Yield Curve
Steepening �
SELL 10-yr DSFs &
BUY 10-yr Treasury futures
Yield Curve
Flattening �
BUY 10-yr DSFs &
SELL 10-yr Treasury futures
Further, this 10-year DSF vs. 10-year Treasury
futures spread implies that this spread will be
sensitive to movements in the shape of the yield
curve spread to the extent that one is effectively
playing the 10-year vs. the 7-year portion of the
yield curve. If one believed that the yield curve
might steepen, this implies that one may sell DSFs
and buy U.S. Treasury futures. If one believed that
the curve might flatten, buy DSFs and sell U.S.
Treasury futures.
If one wished to mitigate these yield curve
considerations and put on a spread that was more
closely driven by credit risk considerations, one
might place a spread using a combination of 5- and
10-year DSF contracts vs. 10-year U.S. Treasury
futures. E.g., if the CTD 10-year T-note had a
maturity of 7 years, one might match 60% of the T-
note futures position with 5-year DSFs and 40% of
the T-note futures position with 10-year DSFs.
Conclusion
DSF contracts represent a powerful and versatile
new trading and risk-management vehicle. The
product may be deployed in a variety of practical
applications including use as a substitute for actual
IRS market exposures; a hedge vs. current or
anticipate IRS holdings; a hedge or spread vs. cash
Treasury securities or Treasury futures.
These products are offered on the CME Group
Globex® electronic trading platform and via open
outcry. Further, they may be transacted as an EFRP
or block trade as well. Once transacted and booked
into the CME Clearing House, DSF contracts offer
significant capital efficiencies. For example, DSF
contracts are eligible for cross-margining offsets vs.
other CME Group interest rate products.
Further, the Dodd-Frank financial reform legislation
of 2010 mandates centralized clearing for
standardized swap contracts including plain-vanilla
interest rate swaps. Per the legislation, the initial
performance bond or margin associated with futures
must be designed to cover a minimum one-day
liquidation timetable; a minimum five-day liquidation
timetable is mandated for cleared IRS; and, a
minimum ten-day liquidation timetable for non-
cleared IRS. Thus, DSF contracts may be traded
with an advantageous capital requirement relative to
their close cousins in the form of OTC IRS
instruments.
DSF contracts are already being embraced by
broker/dealers, hedge funds, traditional asset
managers as a facile means by which either to
create or manage exposure to interest rate swap
risks. To learn more about this contract, please visit
our website at www.cmegroup.com/dsf.
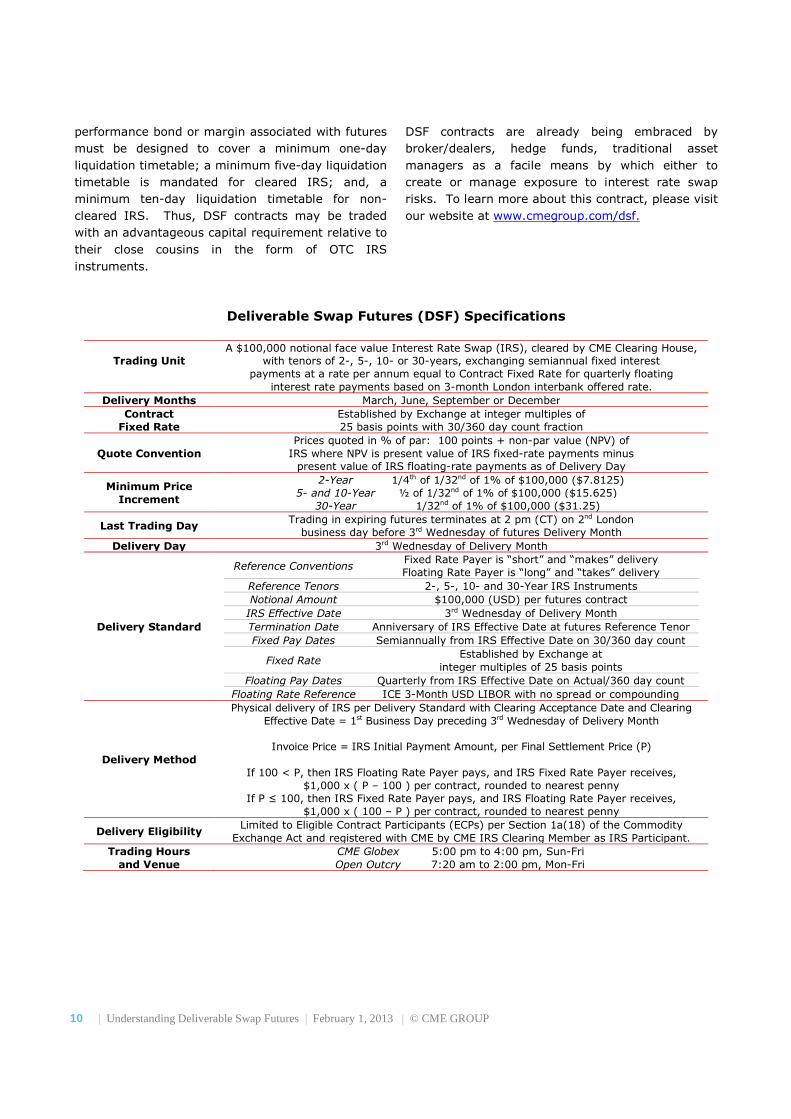
Deliverable Swap Futures (DSF) Specifications
Trading Unit
A $100,000 notional face value Interest Rate Swap (IRS), cleared by CME Clearing House, with tenors of 2-, 5-, 10- or 30-years, exchanging semiannual fixed interest
payments at a rate per annum equal to Contract Fixed Rate for quarterly floating interest rate payments based on 3-month London interbank offered rate.
Delivery Months March, June, September or December
Contract
Fixed Rate
Established by Exchange at integer multiples of 25 basis points with 30/360 day count fraction
Quote Convention
Prices quoted in % of par: 100 points + non-par value (NPV) of IRS where NPV is present value of IRS fixed-rate payments minus
present value of IRS floating-rate payments as of Delivery Day
Minimum Price
Increment
2-Year 1/4th of 1/32nd of 1% of $100,000 ($7.8125) 5- and 10-Year ½ of 1/32nd of 1% of $100,000 ($15.625)
30-Year 1/32nd of 1% of $100,000 ($31.25)
Last Trading Day Trading in expiring futures terminates at 2 pm (CT) on 2nd London
business day before 3rd Wednesday of futures Delivery Month
Delivery Day 3rd Wednesday of Delivery Month
Delivery Standard
Reference Conventions Fixed Rate Payer is “short” and “makes” delivery Floating Rate Payer is “long” and “takes” delivery
Reference Tenors 2-, 5-, 10- and 30-Year IRS Instruments
Notional Amount $100,000 (USD) per futures contract
IRS Effective Date 3rd Wednesday of Delivery Month
Termination Date Anniversary of IRS Effective Date at futures Reference Tenor
Fixed Pay Dates Semiannually from IRS Effective Date on 30/360 day count
Fixed Rate Established by Exchange at
integer multiples of 25 basis points
Floating Pay Dates Quarterly from IRS Effective Date on Actual/360 day count
Floating Rate Reference ICE 3-Month USD LIBOR with no spread or compounding
Delivery Method
Physical delivery of IRS per Delivery Standard with Clearing Acceptance Date and Clearing Effective Date = 1st Business Day preceding 3rd Wednesday of Delivery Month
Invoice Price = IRS Initial Payment Amount, per Final Settlement Price (P)
If 100 < P, then IRS Floating Rate Payer pays, and IRS Fixed Rate Payer receives,
$1,000 x ( P – 100 ) per contract, rounded to nearest penny If P ≤ 100, then IRS Fixed Rate Payer pays, and IRS Floating Rate Payer receives,
$1,000 x ( 100 – P ) per contract, rounded to nearest penny
Delivery Eligibility Limited to Eligible Contract Participants (ECPs) per Section 1a(18) of the Commodity
Exchange Act and registered with CME by CME IRS Clearing Member as IRS Participant.
Trading Hours
and Venue
CME Globex 5:00 pm to 4:00 pm, Sun-Fri Open Outcry 7:20 am to 2:00 pm, Mon-Fri