51
Understanding the aging trend Preparing for the region’s Preparing for the region’s future: future:
| Date post: | 27-Dec-2015 |
| Category: |
Documents |
| Upload: | jemima-baldwin |
| View: | 213 times |
| Download: | 0 times |

Understanding the aging trendPreparing for the region’s Preparing for the region’s future: future:
What’s age got to do with it?
• WHAT’S ARC GOT TO DO WITH IT?
• WHO’S AGING?
• TRENDS
• WHAT CAN YOU DO?
What’s ARC got to do with it?
• WHAT’S AAA?
• ROLE
• NATIONWIDE
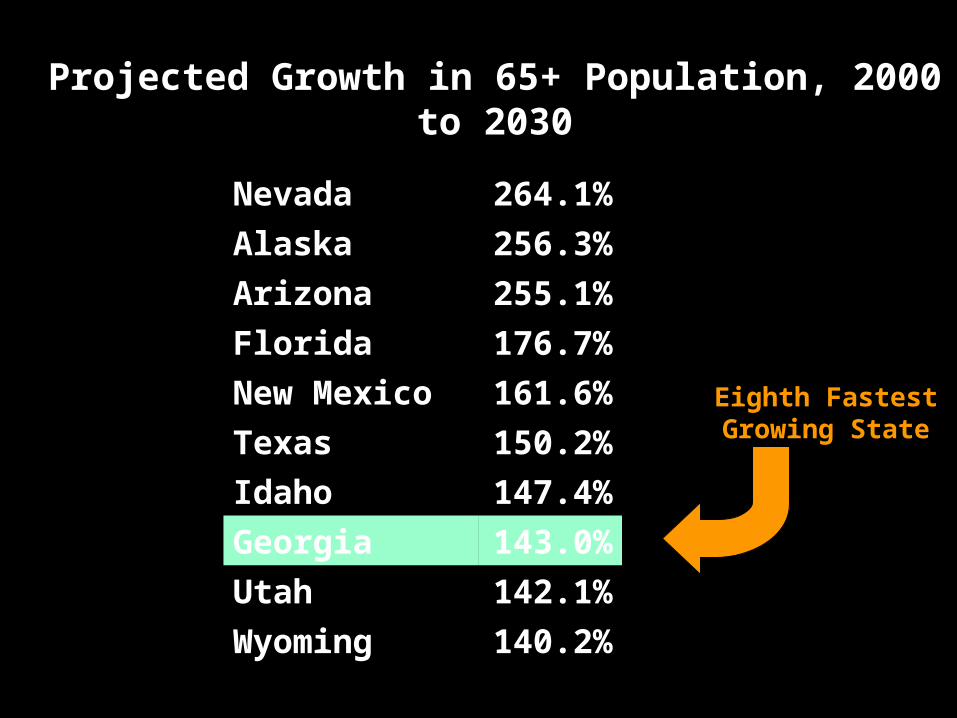
Projected Growth in 65+ Population, 2000 to 2030
Eighth Fastest Growing State
Nevada264.1
%
Alaska256.3
%
Arizona255.1
%
Florida176.7
%
New Mexico161.6
%
Texas150.2
%
Idaho147.4
%
Georgia143.0
%
Utah142.1
%
Wyoming140.2
%
2000 2005 2010 2015 2020 2025 2030
0
200,000
400,000
600,000
800,000
1,000,000
1,200,000
1,400,000
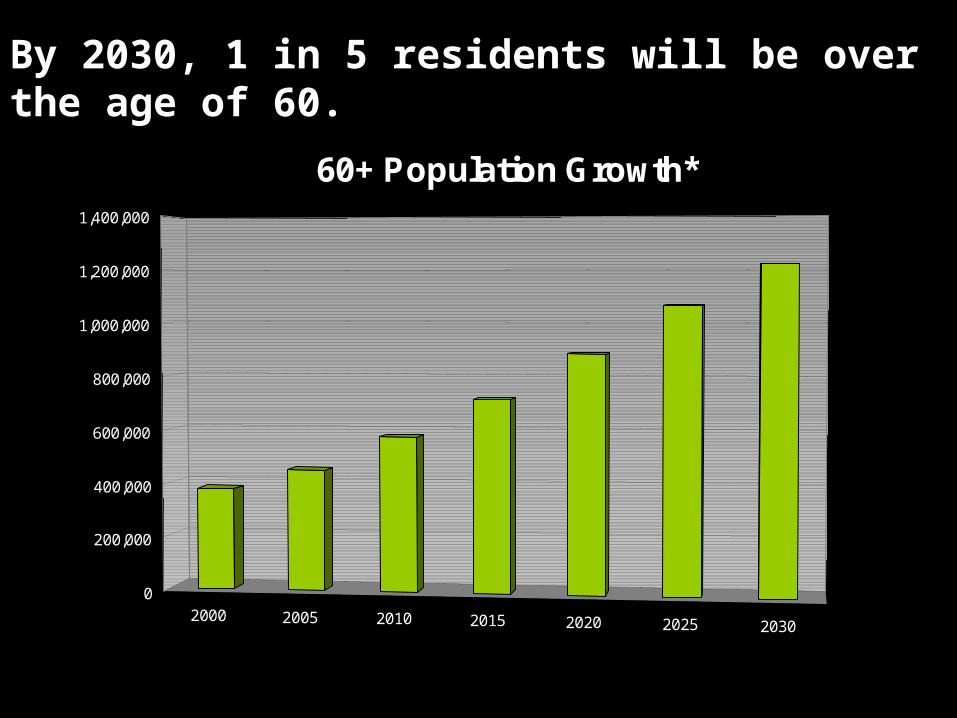
60+ Population Growth*
By 2030, 1 in 5 residents will be over the age of 60.
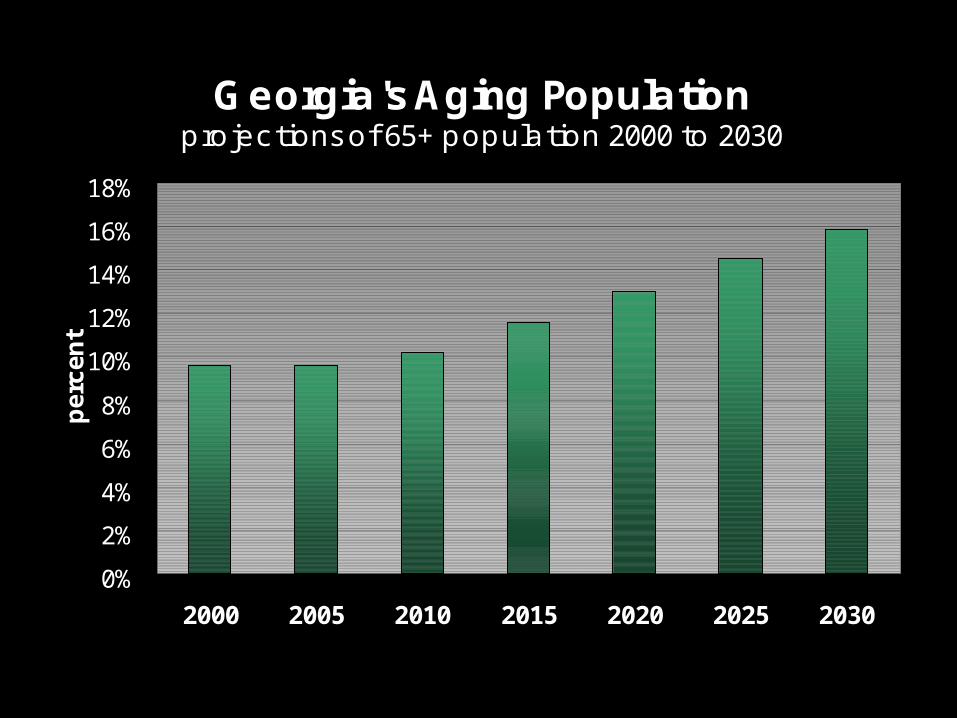
Georgia's Aging Populationprojections of 65+ population 2000 to 2030
0%
2%
4%
6%
8%
10%
12%
14%
16%
18%
2000 2005 2010 2015 2020 2025 2030
pe
rce
nt
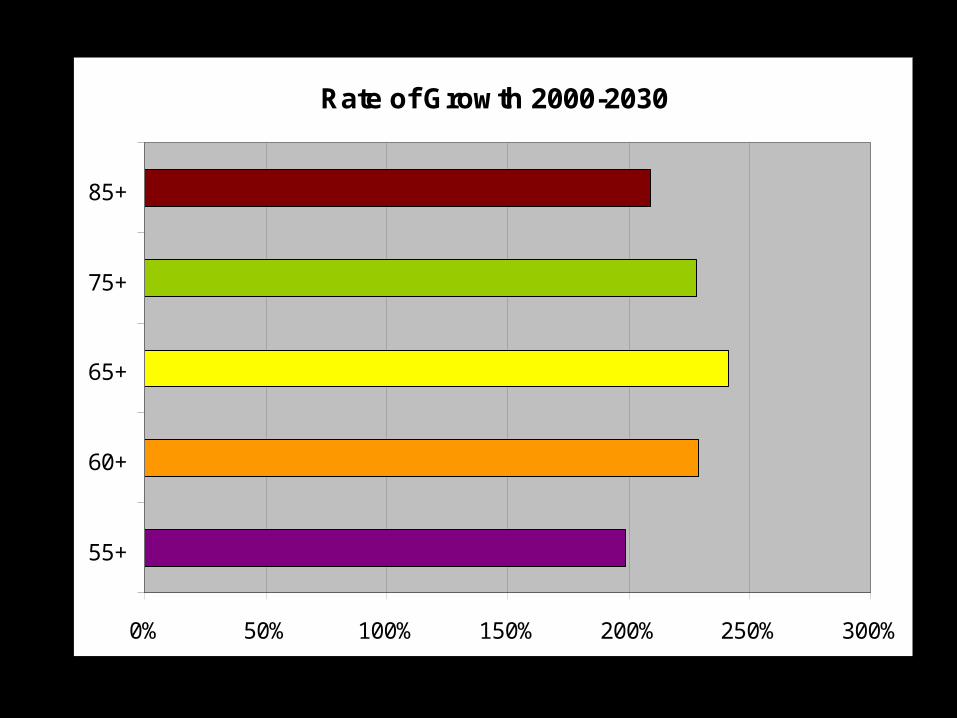
Rate of Growth 2000-2030
0% 50% 100% 150% 200% 250% 300%
55+
60+
65+
75+
85+
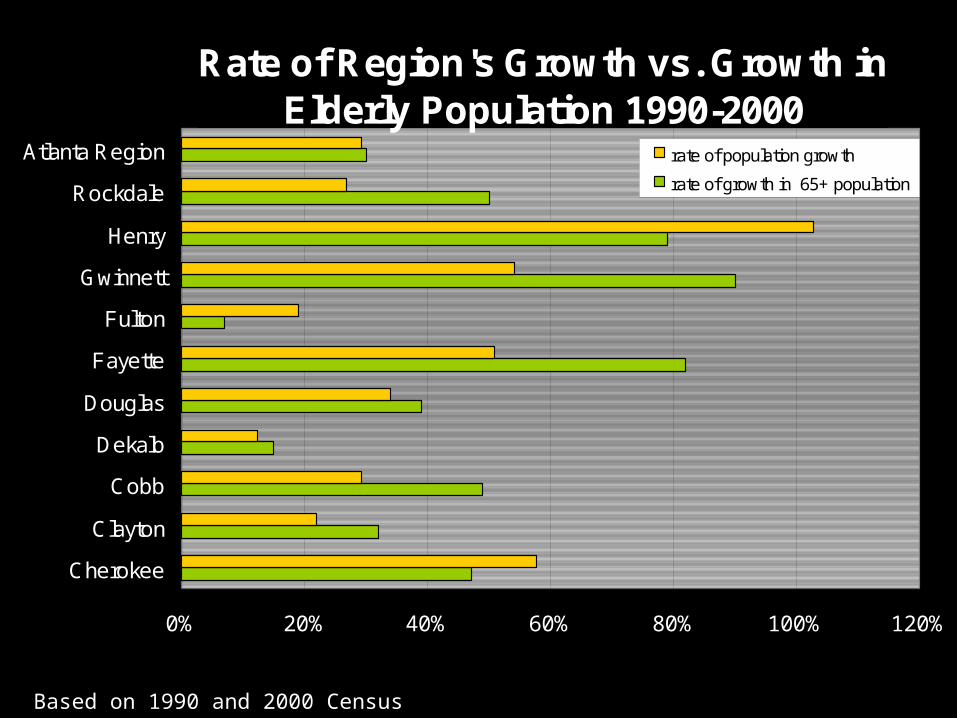
Based on 1990 and 2000 Census data.
Rate of Region's Growth vs. Growth in Elderly Population 1990-2000
0% 20% 40% 60% 80% 100% 120%
Cherokee
Clayton
Cobb
Dekalb
Douglas
Fayette
Fulton
Gwinnett
Henry
Rockdale
Atlanta Region rate of population growth
rate of growth in 65+ population
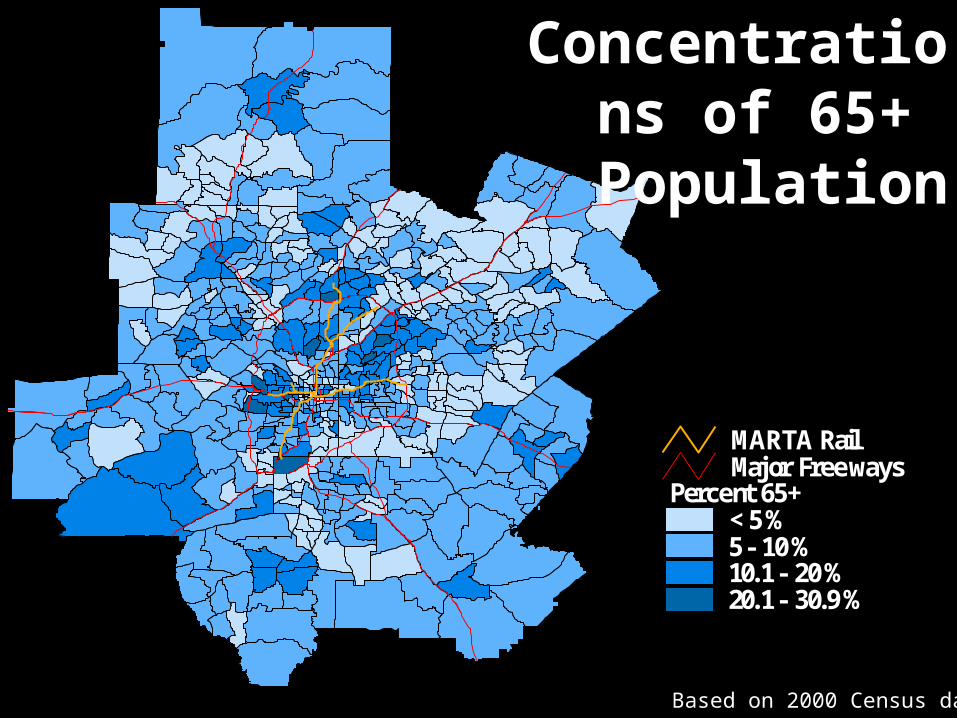
Percent 65+< 5%5 - 10%10.1 - 20%20.1 - 30.9%
Major FreewaysMARTA Rail
Based on 2000 Census data.
Concentrations of 65+
Population
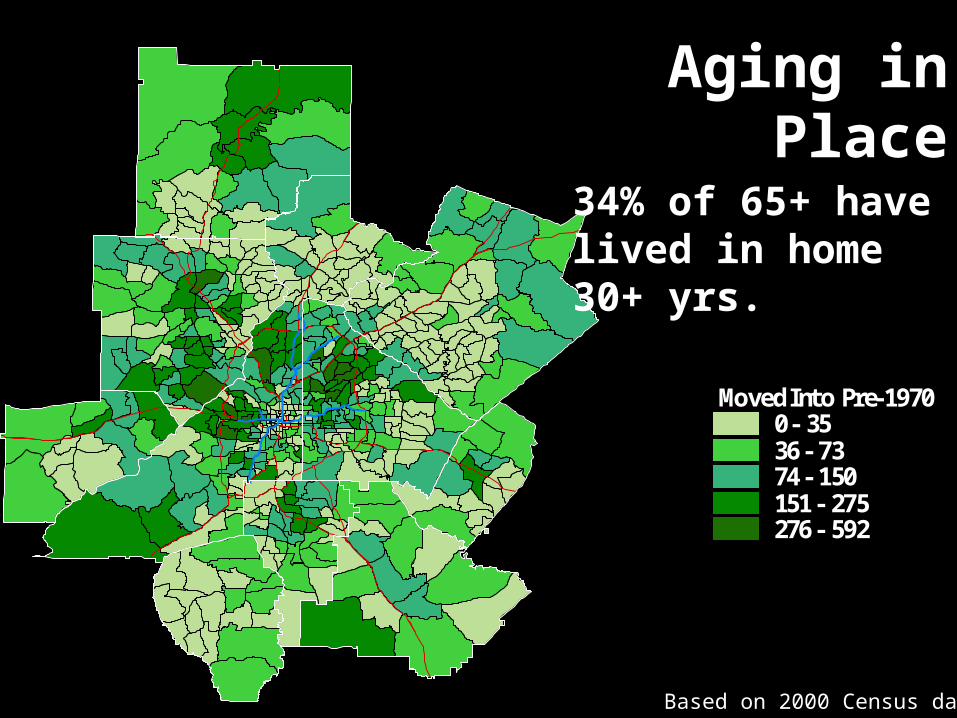
Moved Into Pre-19700 - 3536 - 7374 - 150151 - 275276 - 592
34% of 65+ havelived in home 30+ yrs.
Based on 2000 Census data.
Aging in Place
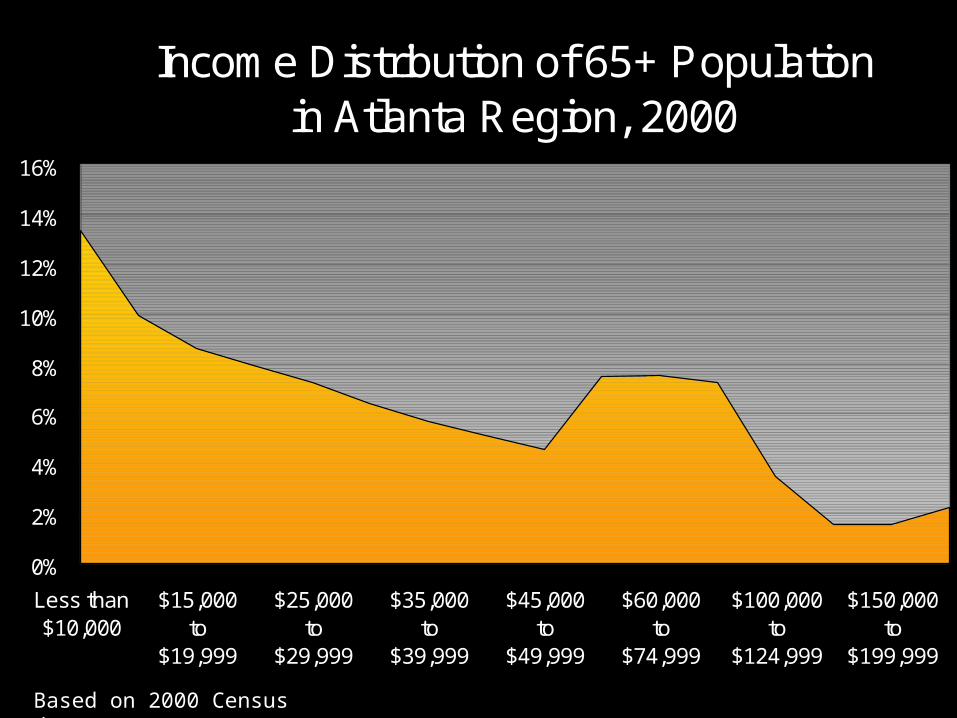
Income Distribution of 65+ Populationin Atlanta Region, 2000
0%
2%
4%
6%
8%
10%
12%
14%
16%
Less than$10,000
$15,000to
$19,999
$25,000to
$29,999
$35,000to
$39,999
$45,000to
$49,999
$60,000to
$74,999
$100,000to
$124,999
$150,000to
$199,999
Based on 2000 Census data.
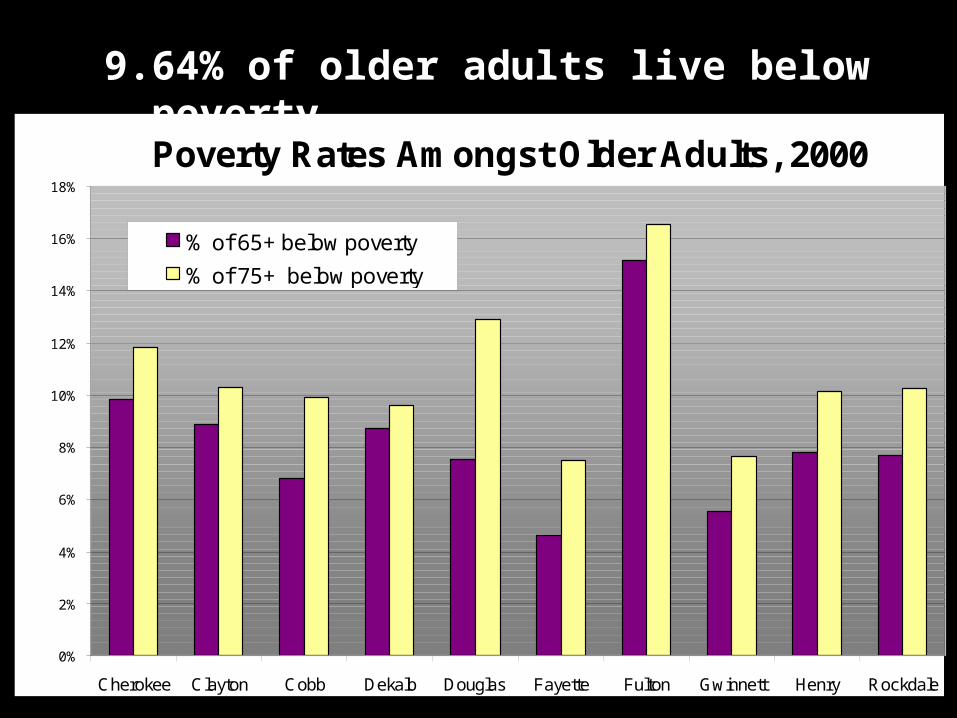
Poverty Rates Amongst Older Adults, 2000
0%
2%
4%
6%
8%
10%
12%
14%
16%
18%
Cherokee Clayton Cobb Dekalb Douglas Fayette Fulton Gwinnett Henry Rockdale
% of 65+ below poverty
% of 75+ below poverty
9.64% of older adults live below poverty.
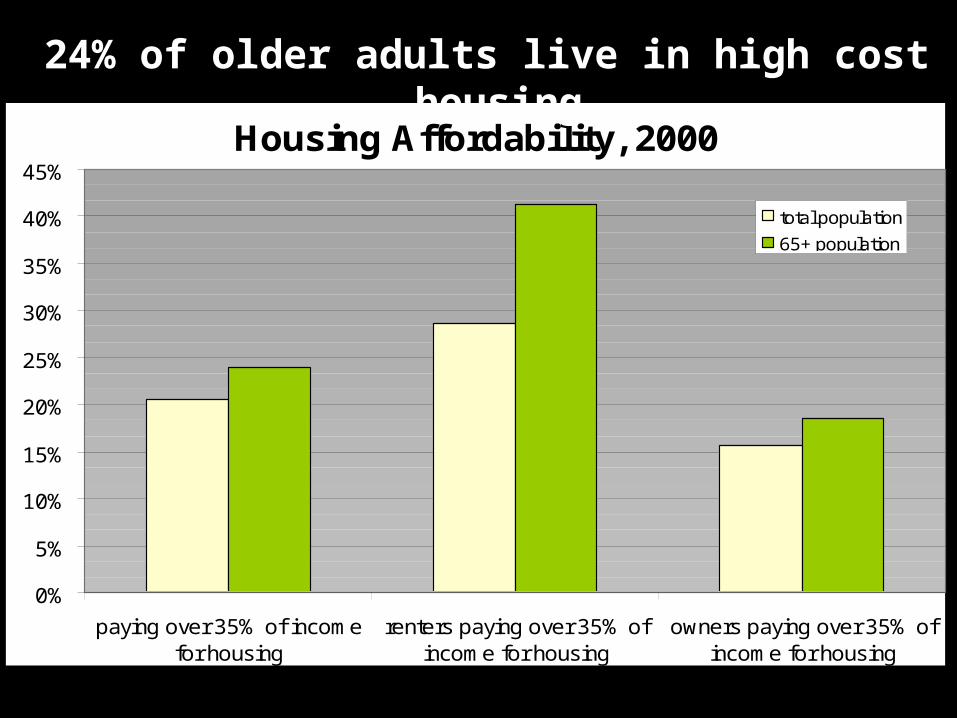
Housing Affordability, 2000
0%
5%
10%
15%
20%
25%
30%
35%
40%
45%
paying over 35% of incomefor housing
renters paying over 35% ofincome for housing
owners paying over 35% ofincome for housing
total population
65+ population
24% of older adults live in high cost housing.
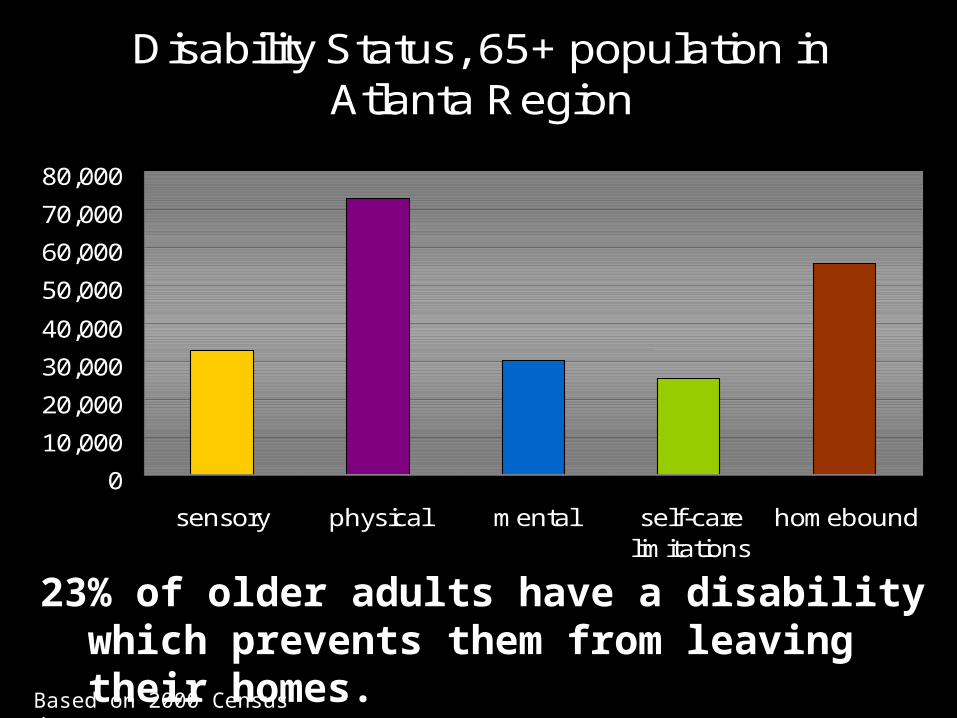
Disability Status, 65+ population in Atlanta Region
0
10,000
20,000
30,000
40,000
50,000
60,000
70,000
80,000
sensory physical mental self-carelimitations
homebound
Based on 2000 Census data.
23% of older adults have a disability which prevents them from leaving their homes.
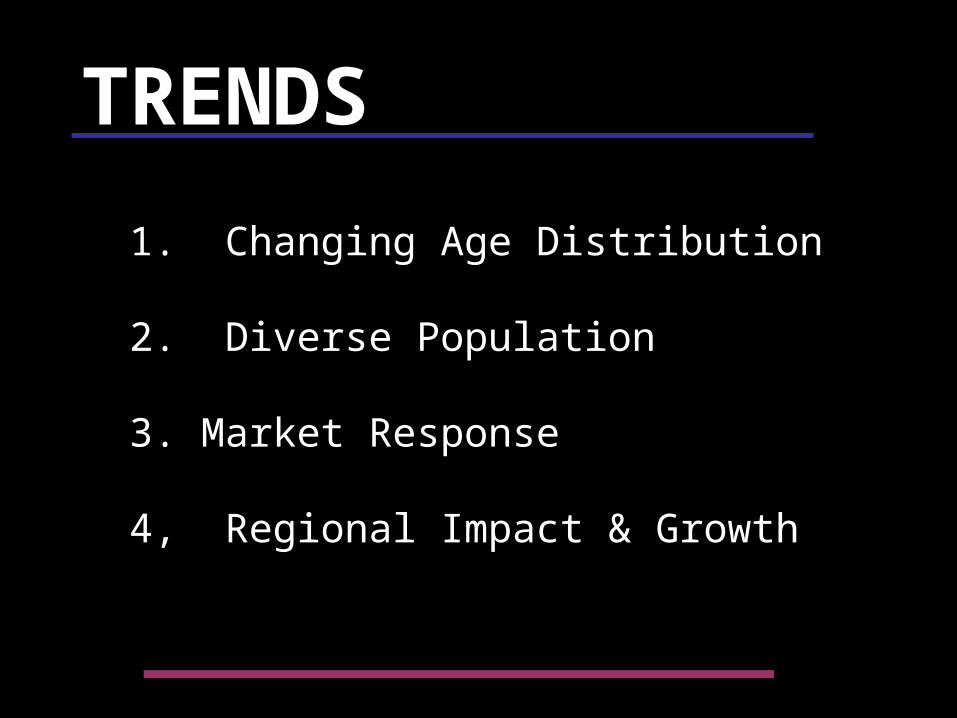
1. Changing Age Distribution
2. Diverse Population
3. Market Response
4, Regional Impact & Growth
TRENDSTRENDS


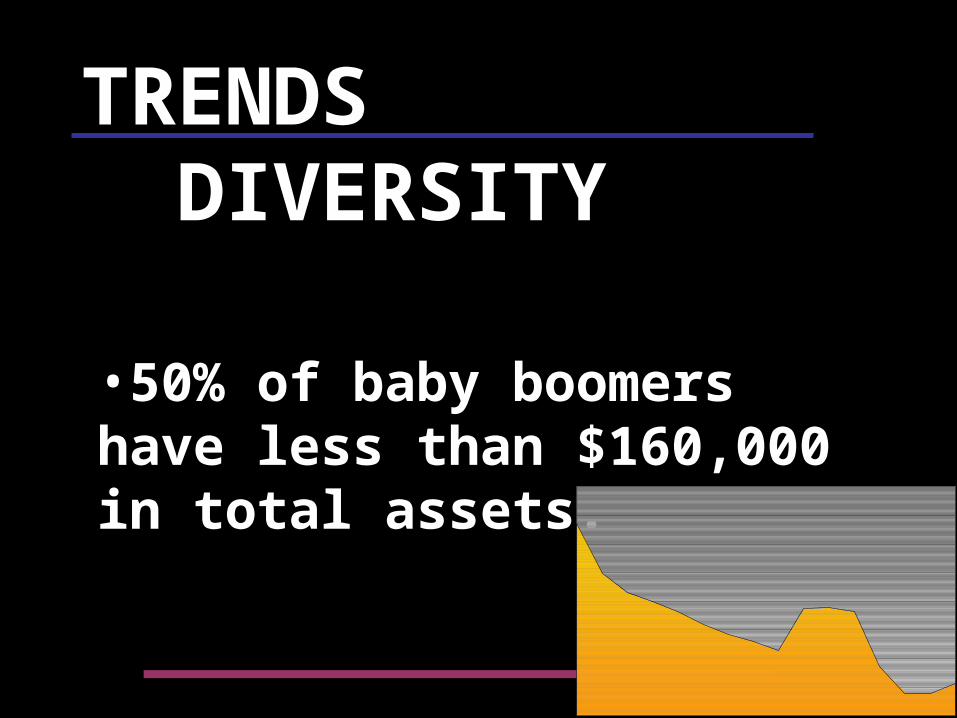
TRENDS TRENDS DIVERSITYDIVERSITY
•50% of baby boomers have less than $160,000 in total assets.
DIVERSE POPULATION
Growing ethnic diversity with different economic, health, social needs
Healthier older adults, trying to remain healthy and active
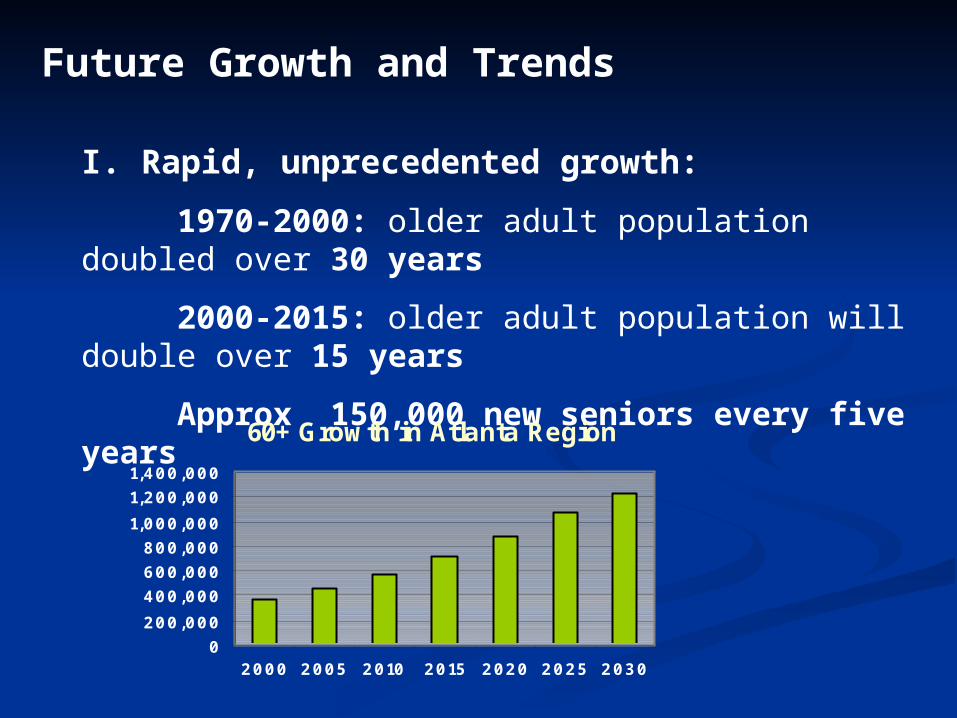
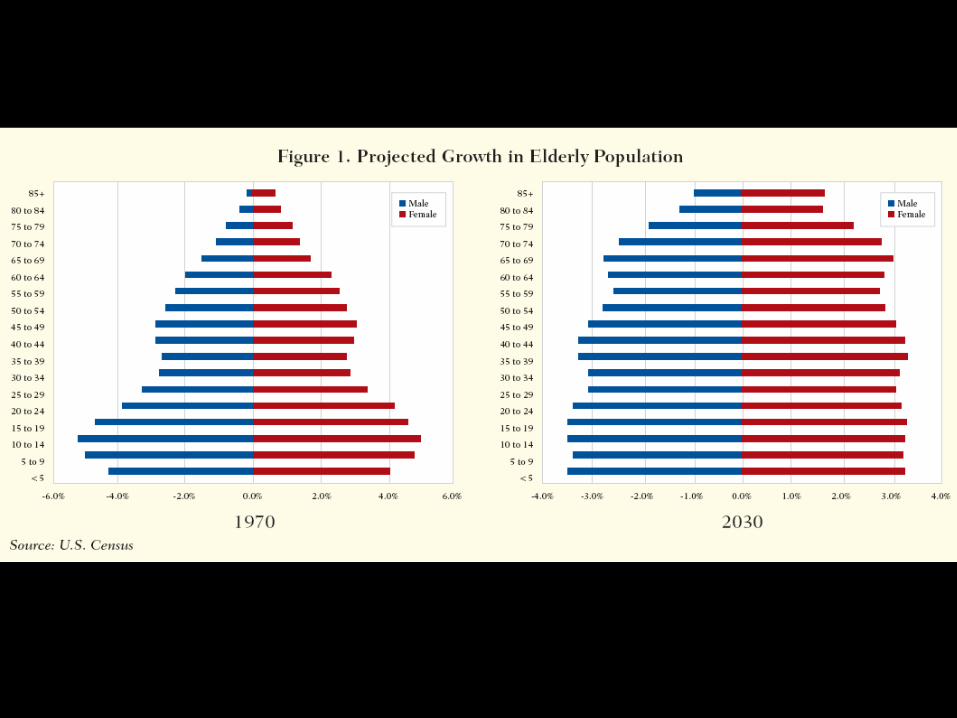
Future Growth and Trends
I. Rapid, unprecedented growth:
1970-2000: older adult population doubled over 30 years
2000-2015: older adult population will double over 15 years
Approx 150,000 new seniors every five years
60+ Growth in Atlanta Region
0
200,000
400,000
600,000
800,000
1,000,000
1,200,000
1,400,000
2000 2005 2010 2015 2020 2025 2030
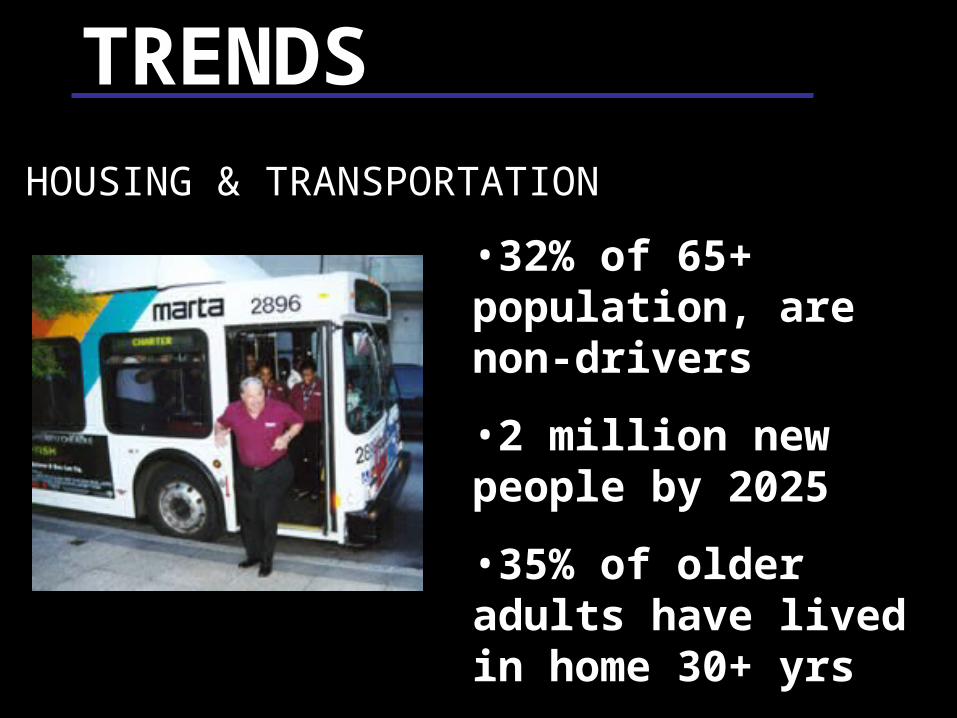
TRENDSTRENDS
•32% of 65+ population, are non-drivers
•2 million new people by 2025
•35% of older adults have lived in home 30+ yrs
HOUSING & TRANSPORTATION

4. Market response to baby boomers
TRENDSTRENDS
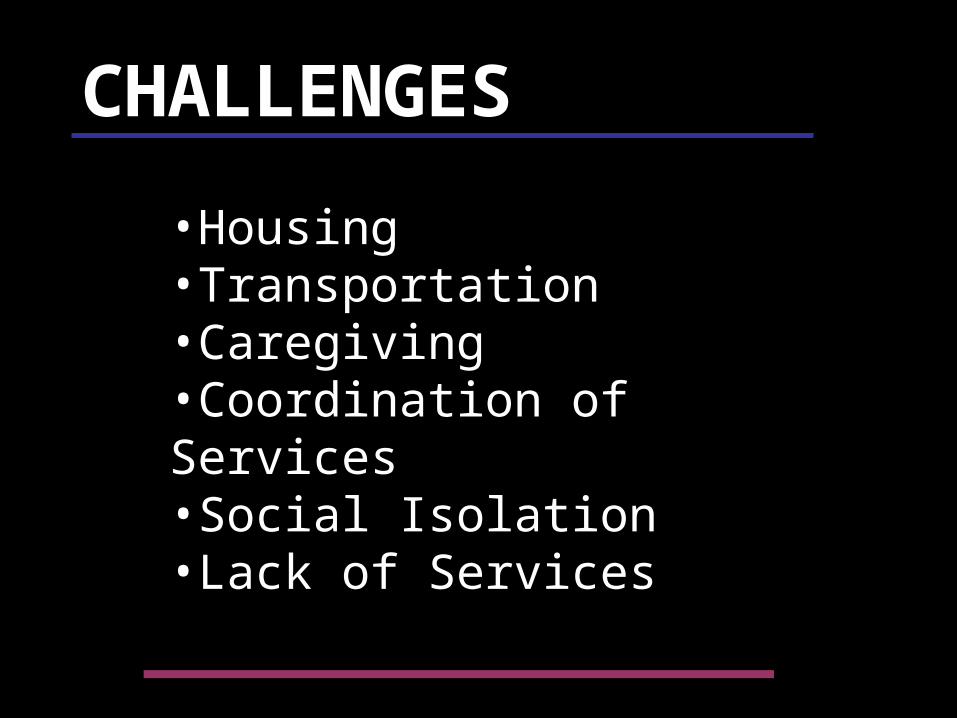
CHALLENGESCHALLENGES
•Housing•Transportation•Caregiving•Coordination of Services•Social Isolation•Lack of Services
4. Regional Growth & Impact
TRENDSTRENDS
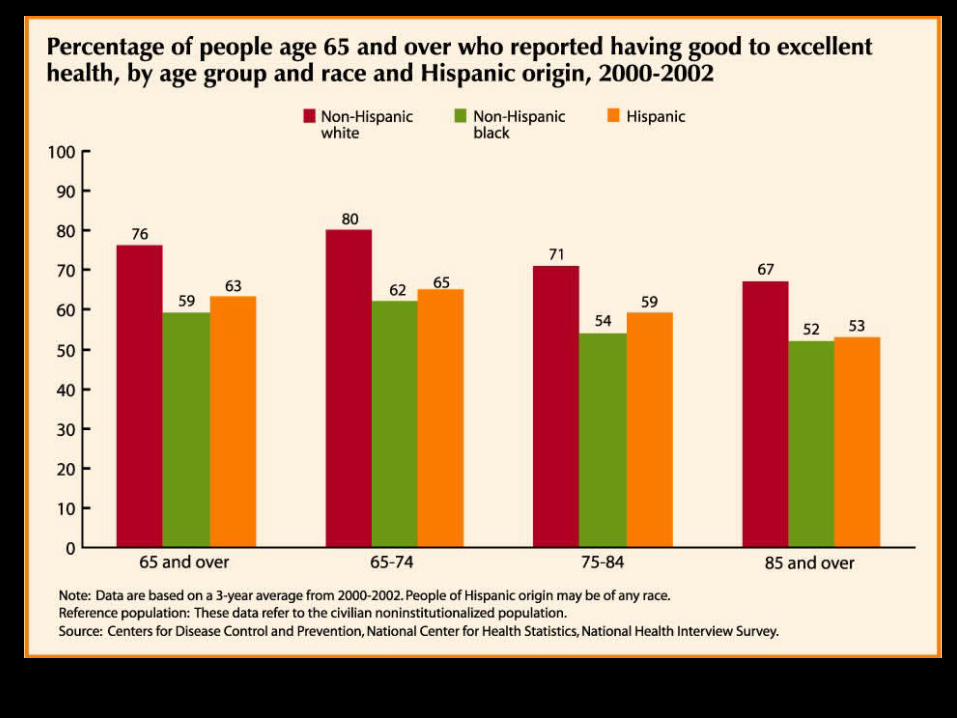
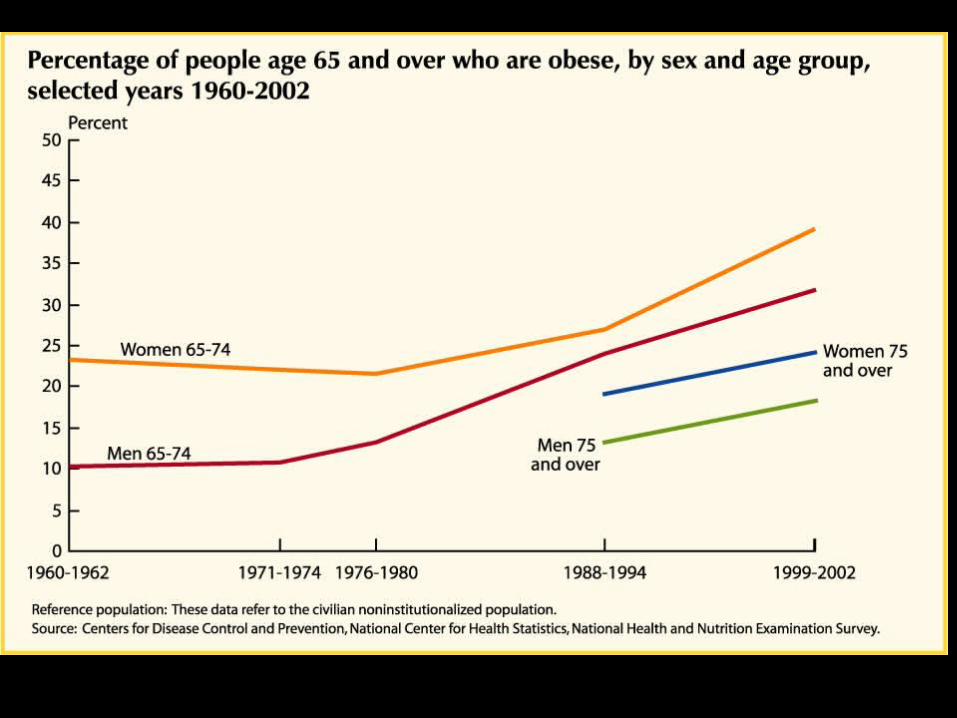
Source: Federal Interagency Forum on Aging. Older Americans 2004: Key Indicators of Well-Being.
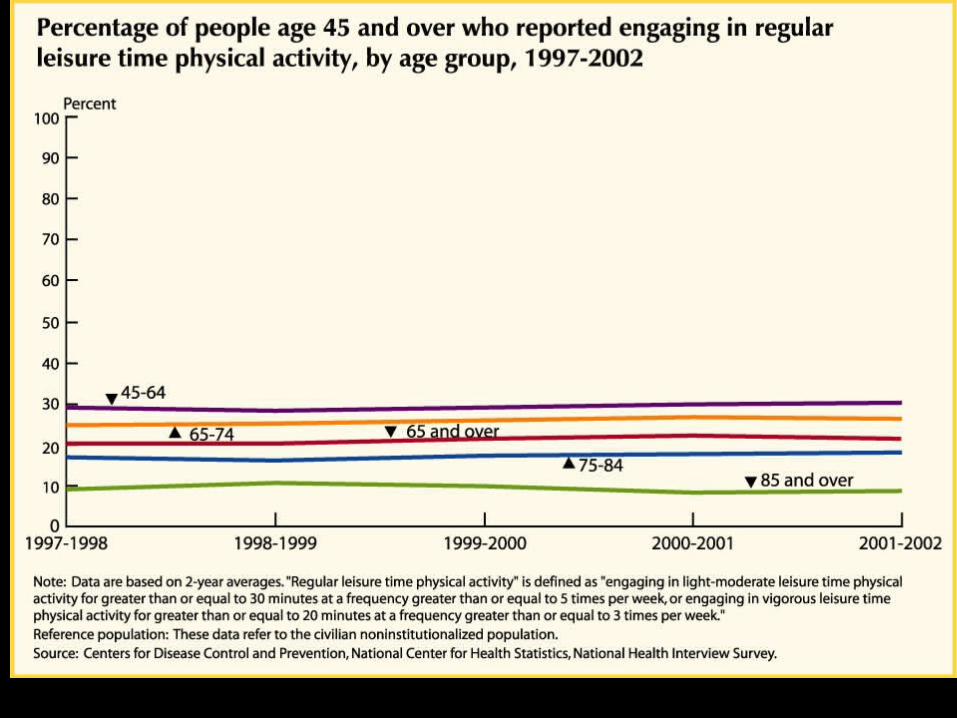
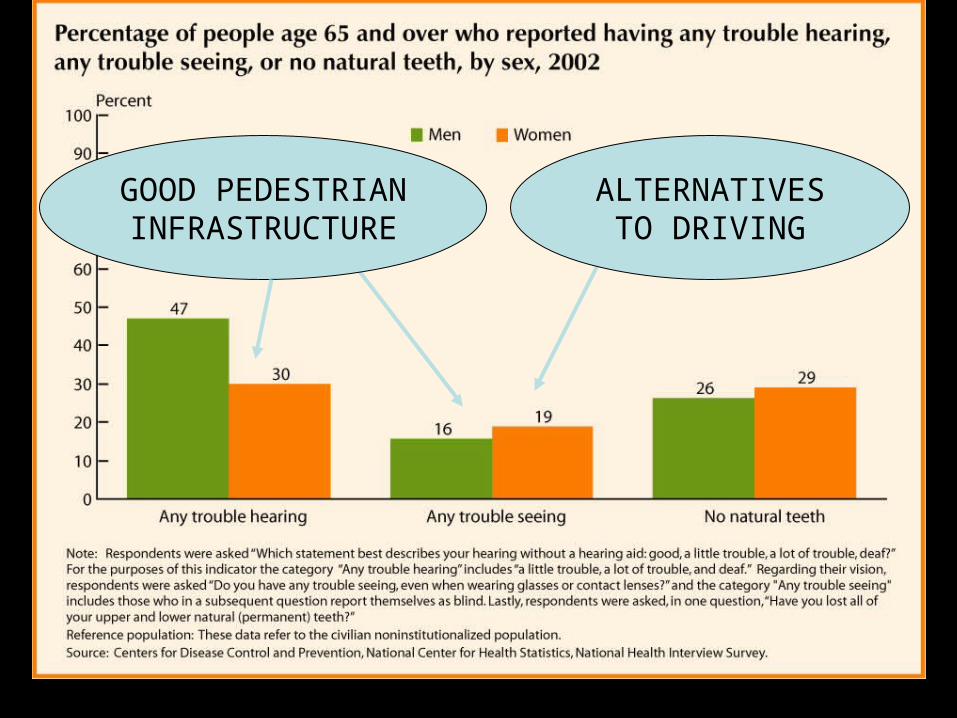
Source: Federal Interagency Forum on Aging. Older Americans 2004: Key Indicators of Well-Being.
Source: Federal Interagency Forum on Aging. Older Americans 2004: Key Indicators of Well-Being.
Source: Federal Interagency Forum on Aging. Older Americans 2004: Key Indicators of Well-Being.
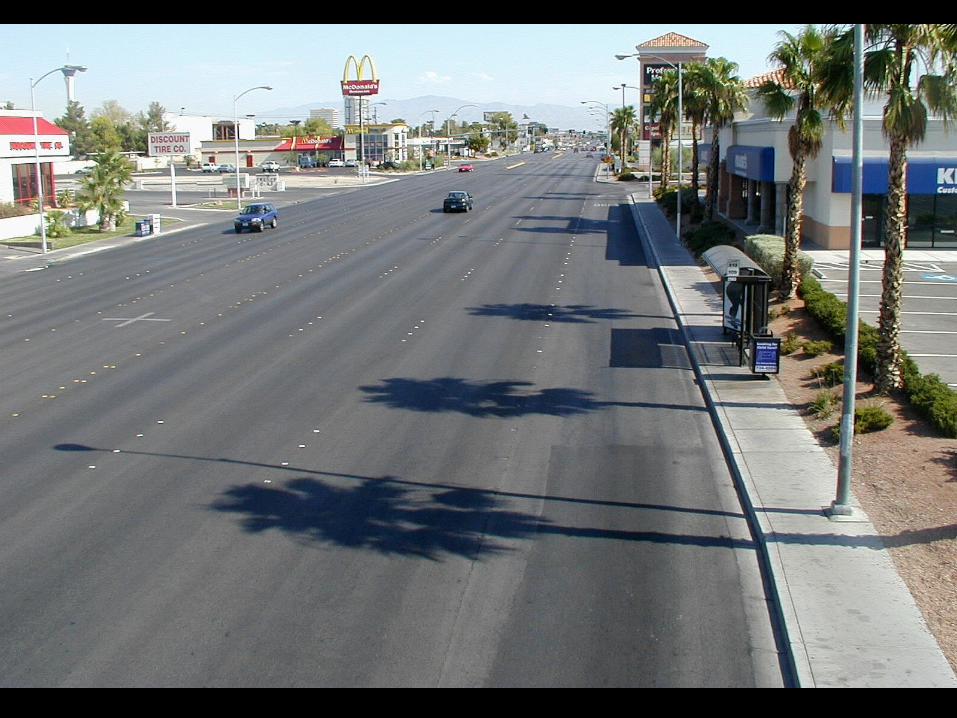
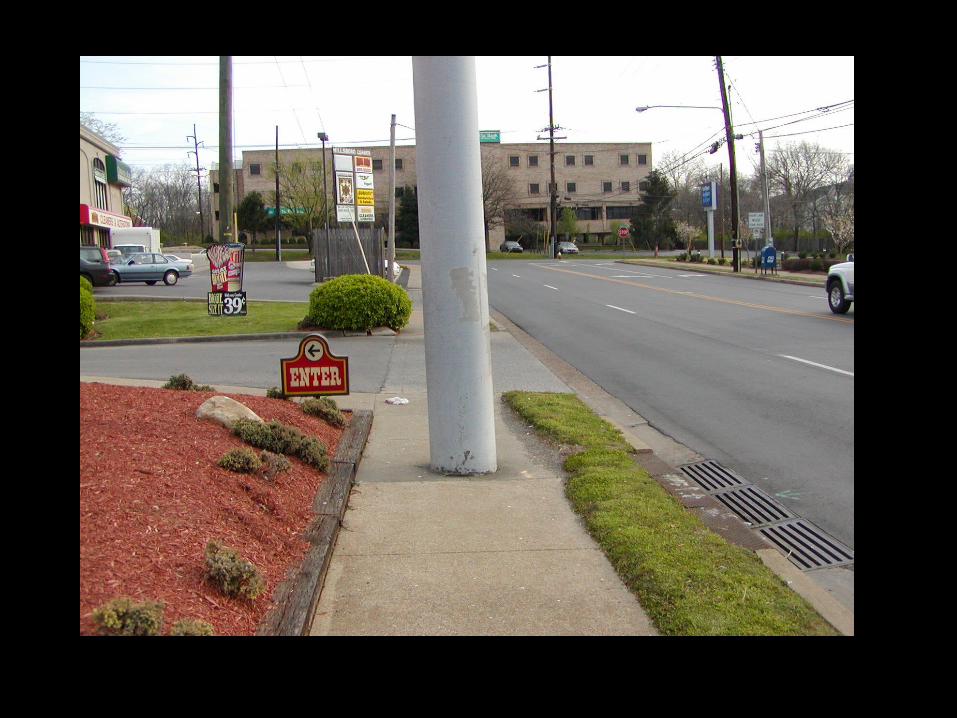
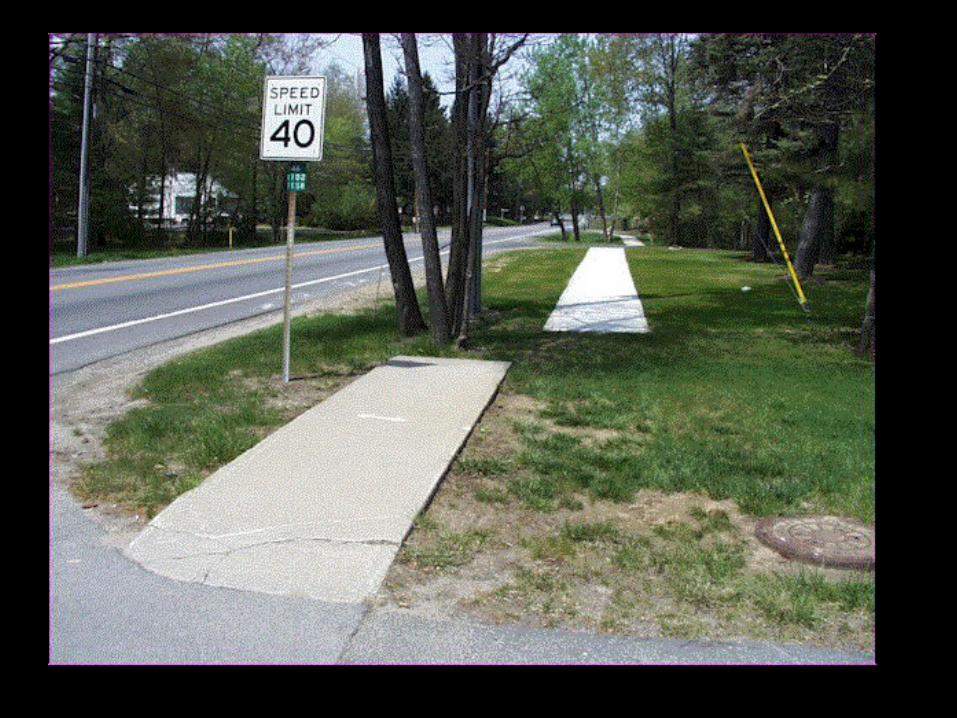
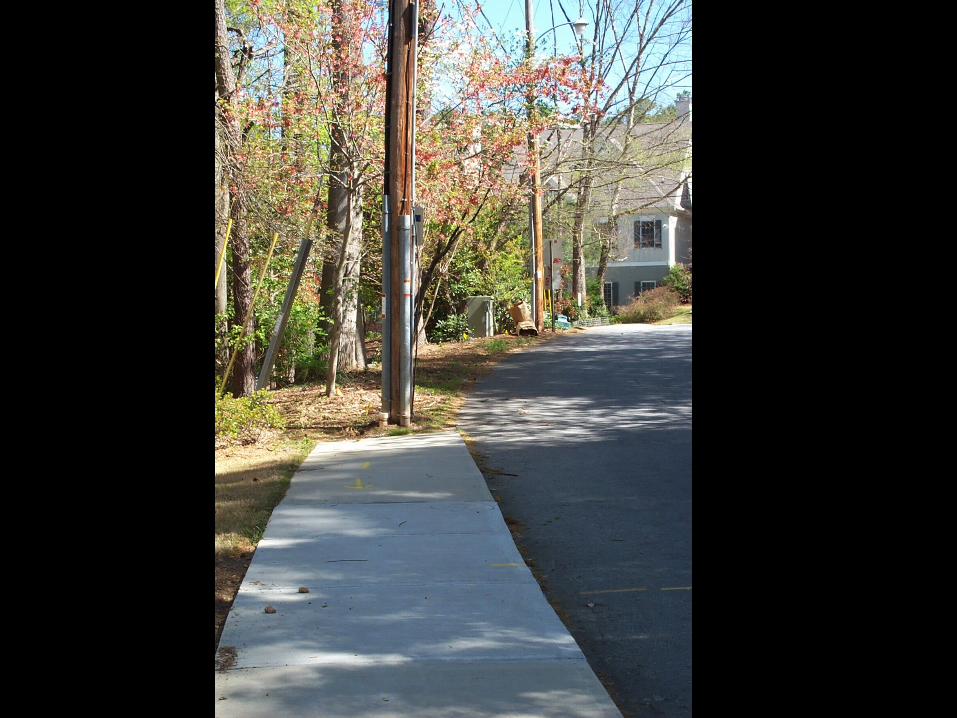
GOOD PEDESTRIAN
INFRASTRUCTURE
ALTERNATIVES TO DRIVING
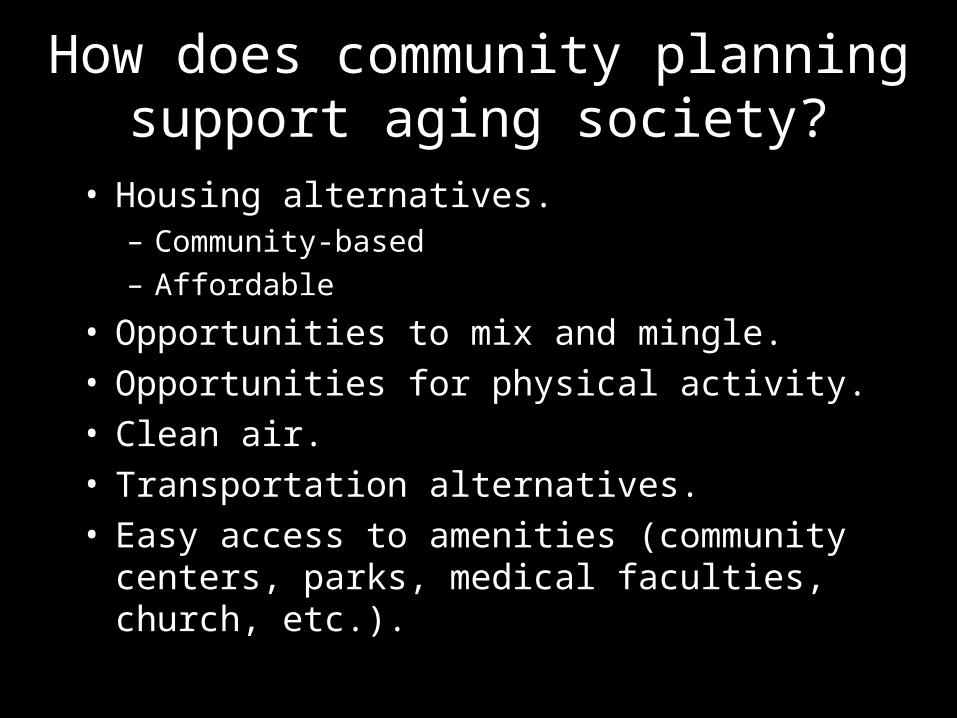
How does community planning support aging society?
• Housing alternatives.– Community-based– Affordable
• Opportunities to mix and mingle.• Opportunities for physical activity.• Clean air.• Transportation alternatives.• Easy access to amenities (community
centers, parks, medical faculties, church, etc.).

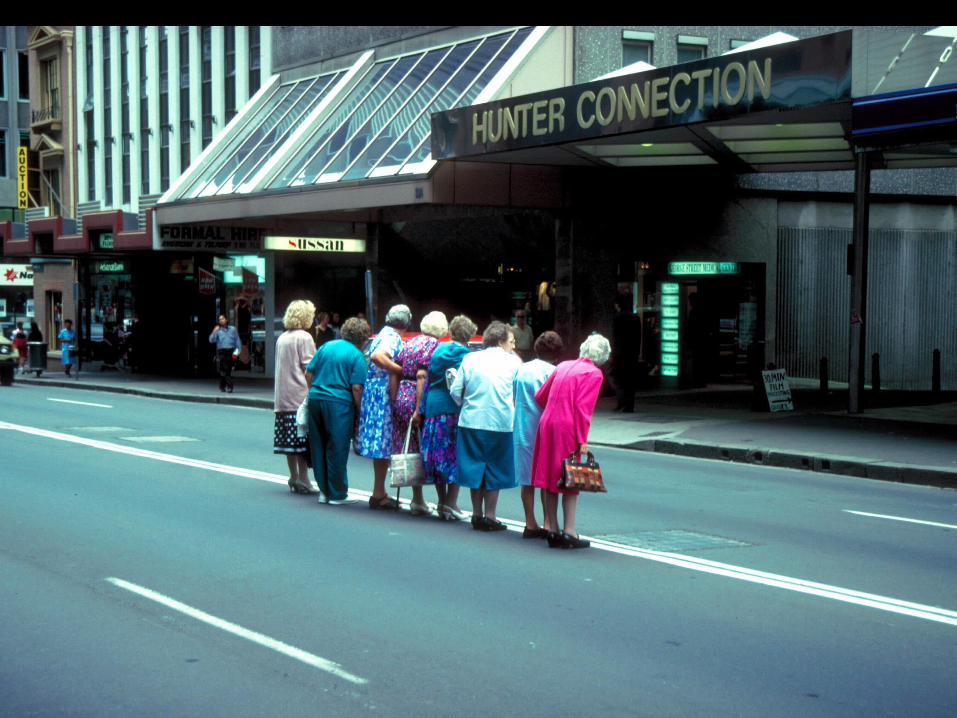
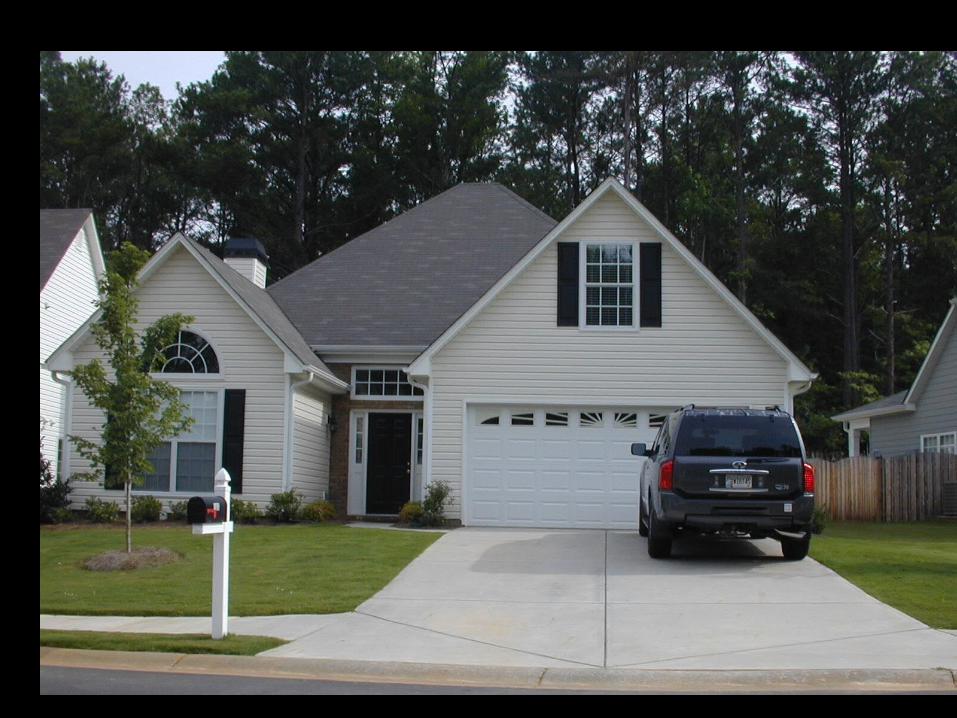
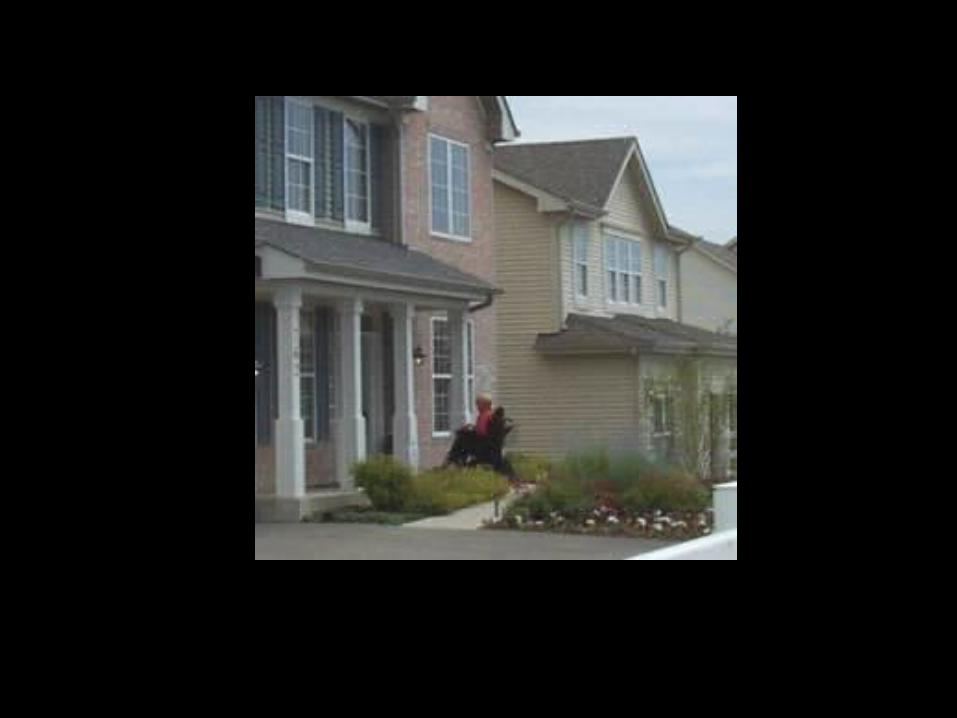
Are we designing and building communities that
are elder friendly?


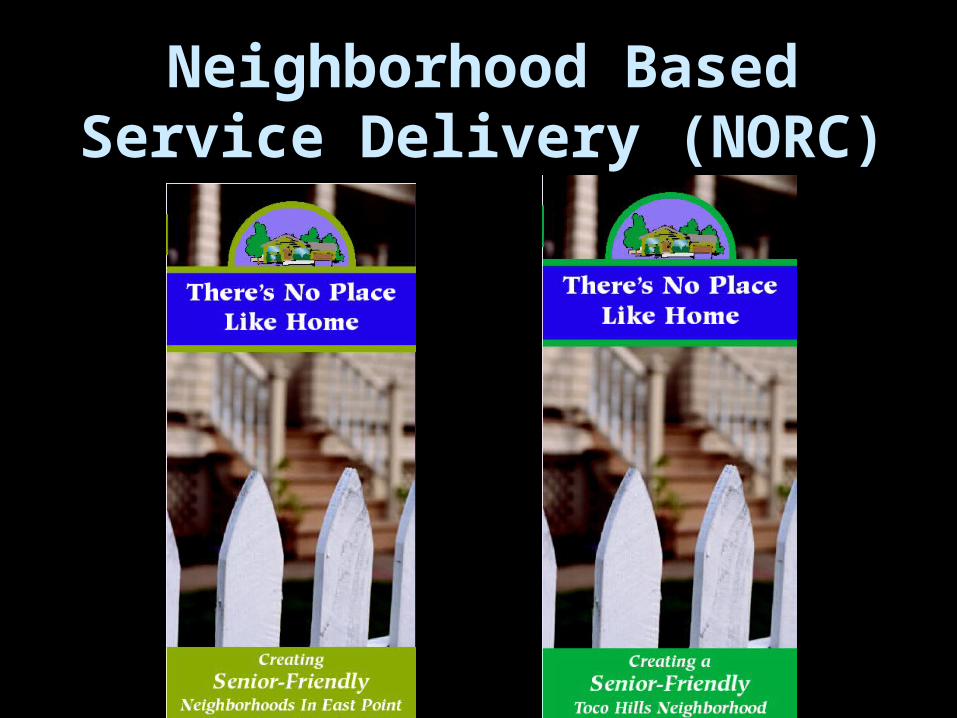
Neighborhood Based Service Delivery (NORC)

• New framework – changing perspective
• Focus on overarching goals
• Create new partnerships
WHAT CAN YOU DO?
• No longer just a social service problem
• 1 in 5 persons - 65+ population becomes part of the big picture or larger community vision.
Changing Perspective
• Solutions previously seen as addressing older adult issues now broadened such as:
Housing
Transportation
Overarching Goals
• Business community
• Governmental and inter-agency collaboration
• Cross Training
Create New Partnerships
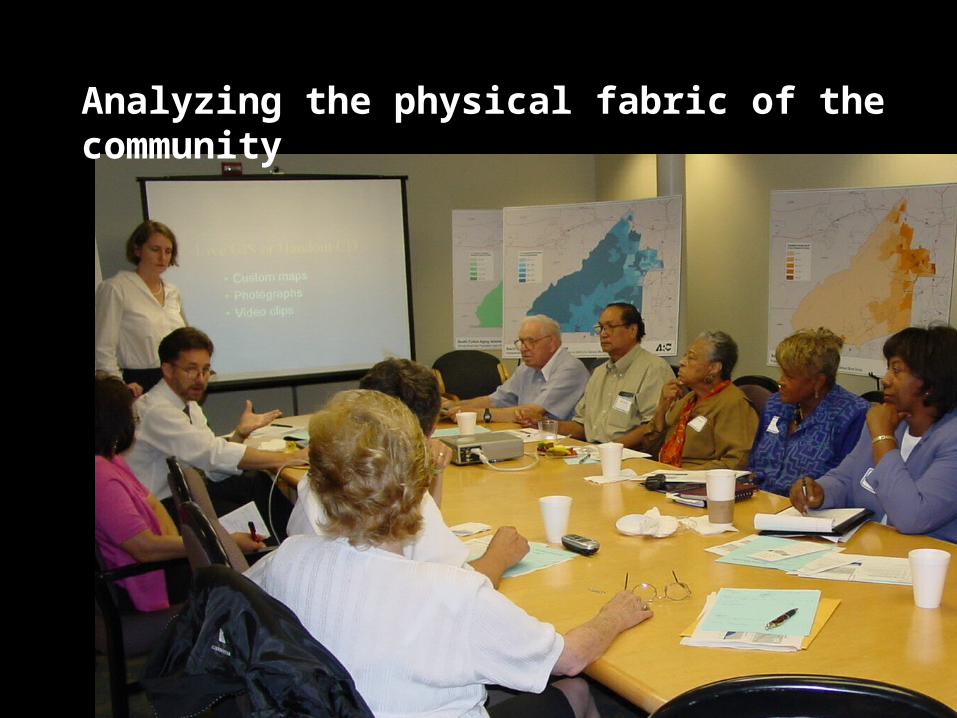
Analyzing the physical fabric of the community
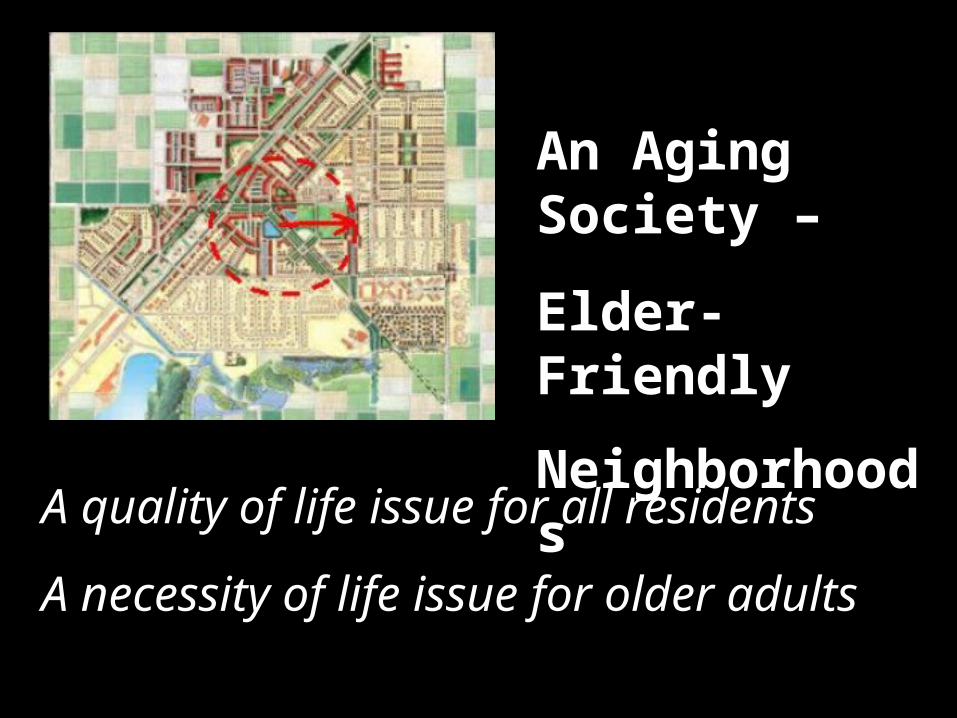
A quality of life issue for all residents
A necessity of life issue for older adults
An Aging Society –
Elder-Friendly
Neighborhoods