Page 1
University of Nebraska - LincolnDigitalCommons@University of Nebraska - LincolnDissertations, Theses, & Student Research in FoodScience and Technology Food Science and Technology Department
Summer 7-2014
UNDERSTANDING THE FACTORSAFFECTING MICROBIOLOGICALQUALITY OF WHEAT MILLED PRODUCTS:FROM WHEAT FIELDS TO MILLINGOPERATIONSLuis E. Sabillón GaleasUniversity of Nebraska-Lincoln, [email protected]
Follow this and additional works at: http://digitalcommons.unl.edu/foodscidiss
Part of the Agronomy and Crop Sciences Commons, Environmental Microbiology and MicrobialEcology Commons, Food Biotechnology Commons, Food Microbiology Commons, FoodProcessing Commons, and the Immunology and Infectious Disease Commons
This Article is brought to you for free and open access by the Food Science and Technology Department at DigitalCommons@University of Nebraska -Lincoln. It has been accepted for inclusion in Dissertations, Theses, & Student Research in Food Science and Technology by an authorizedadministrator of DigitalCommons@University of Nebraska - Lincoln.
Sabillón Galeas, Luis E., "UNDERSTANDING THE FACTORS AFFECTING MICROBIOLOGICAL QUALITY OF WHEATMILLED PRODUCTS: FROM WHEAT FIELDS TO MILLING OPERATIONS" (2014). Dissertations, Theses, & Student Research inFood Science and Technology. 49.http://digitalcommons.unl.edu/foodscidiss/49
Page 2
i
UNDERSTANDING THE FACTORS AFFECTING MICROBIOLOGICAL QUALITY OF
WHEAT MILLED PRODUCTS: FROM WHEAT FIELDS TO MILLING OPERATIONS
by
Luis Eduardo Sabillón Galeas
A THESIS
Presented to the Faculty of
The Graduate College at the University of Nebraska
In Partial Fulfillment of Requirements
For the Degree of Master of Science
Major: Food Science and Technology
Under the Supervision of Professor Andréia Bianchini
Lincoln, Nebraska
July, 2014
Page 3
ii
UNDERSTANDING THE FACTORS AFFECTING MICROBIOLOGICAL QUALITY OF
WHEAT MILLED PRODUCTS: FROM WHEAT FIELDS TO MILLING OPERATIONS
Luis Eduardo Sabillón Galeas, M.S.
University of Nebraska, 2014
Advisor: Andréia Bianchini
Although regarded as a low-risk commodity, wheat flour-based mixes have been
implicated in several food safety incidents. The present thesis is a compilation of five scientific
manuscripts on the effect of weather variation, milling steps and implementation of pre-milling
interventions on the microbiological quality and safety of wheat and milled products. The first
manuscript is a review of the microbiological quality and safety of wheat-based products. Despite
the low water activity, wheat flour may harbor dormant but viable microorganisms, which could
lead to safety concerns when flour is used to produce refrigerated dough products. The second
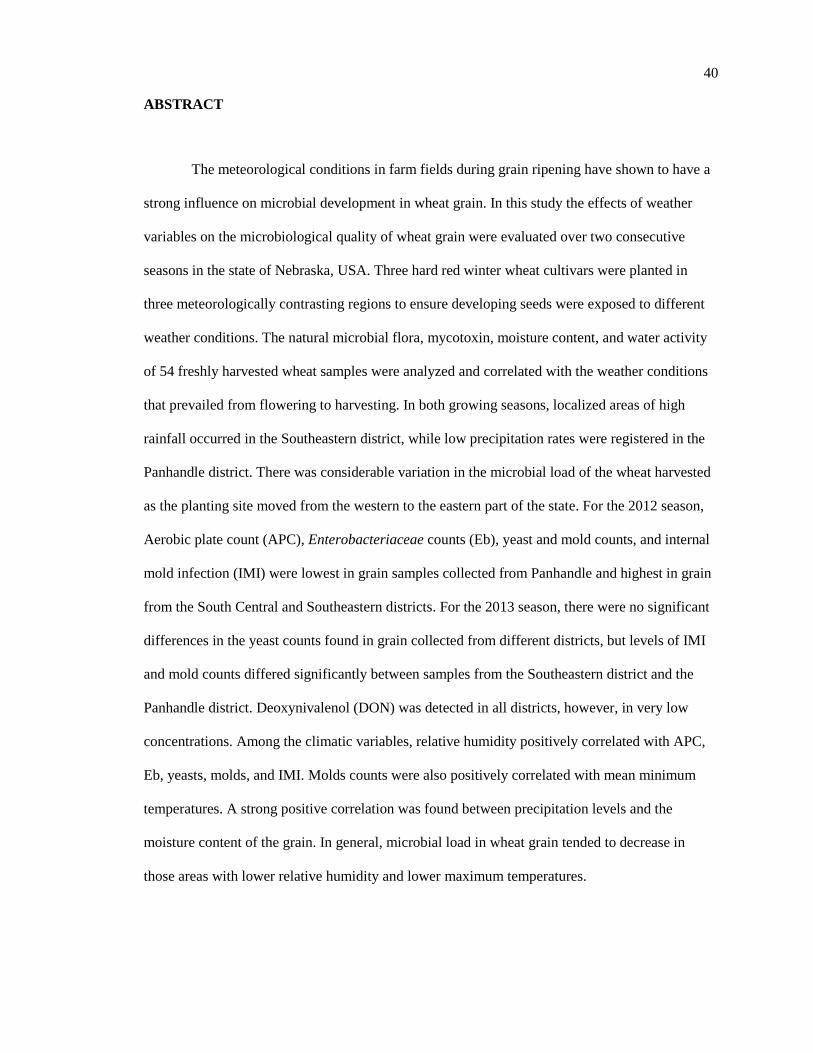
manuscript illustrates the effect of climatic conditions on the microbiological quality of wheat,
where wheat grown under higher relative humidity and higher maximum temperature may be
more susceptible to lower microbiological quality. In the third manuscript, the effect of the
milling steps on the microbial load of wheat milled products is reported. While the cleaning and
tempering steps did not affect the initial microbial counts, the grinding process caused a
redistribution and concentration of microbial contaminants into the bran and germ fractions. The
fourth manuscript reports the effect of novel tempering solutions on reducing microbial load in
wheat prior to milling. Results showed that tempering solutions containing organic acids and
NaCl were capable of effectively reducing the microflora of wheat kernels when compared to the
traditional tempering process. In the last manuscript, the combined antimicrobial effects of
organic acid and NaCl during tempering and its impact on flour functionality were evaluated. The
results indicated a synergistic effect between lactic acid and NaCl, which was very remarkable in
reducing microbial counts. Moreover, the impact on mixing, pasting, and baking properties was
minimal.
Page 4
iii
To God, my family, my friends and to
all the people who believe in me.
Page 5
iv
TABLE OF CONTENTS
Scientific Manuscript One: From Wheat Fields to Consumer’s Tables: A Comprehensive
Approach to the Microbiological Quality and Safety of Wheat-Based Products………………….1
Abstract …………………………………………………………………………………………....2
Introduction………………………………………………………………………………………...3
Microbiological profile of wheat grain…………………………………………………………….5
Effect of the milling steps on microbial load and mycotoxins in milled fractions……………….10
Microbiological quality and safety of wheat flour………………………………………………..13
Effects of bakery and pasta processing on the microbiological quality and safety of flour-based
foods……………………………………………………………………………………………....18
Potential safety risks associated to flour-based foods…………………………………………….21
Concluding remarks………………………………………………………………………………24
References………………………………………………………………………………………...26
Scientific Manuscript Two: Effects of weather variables on the microbiological quality of hard
red winter wheat…………………………………………………………………………………..39
Abstract…………………………………………………………………………………………...40
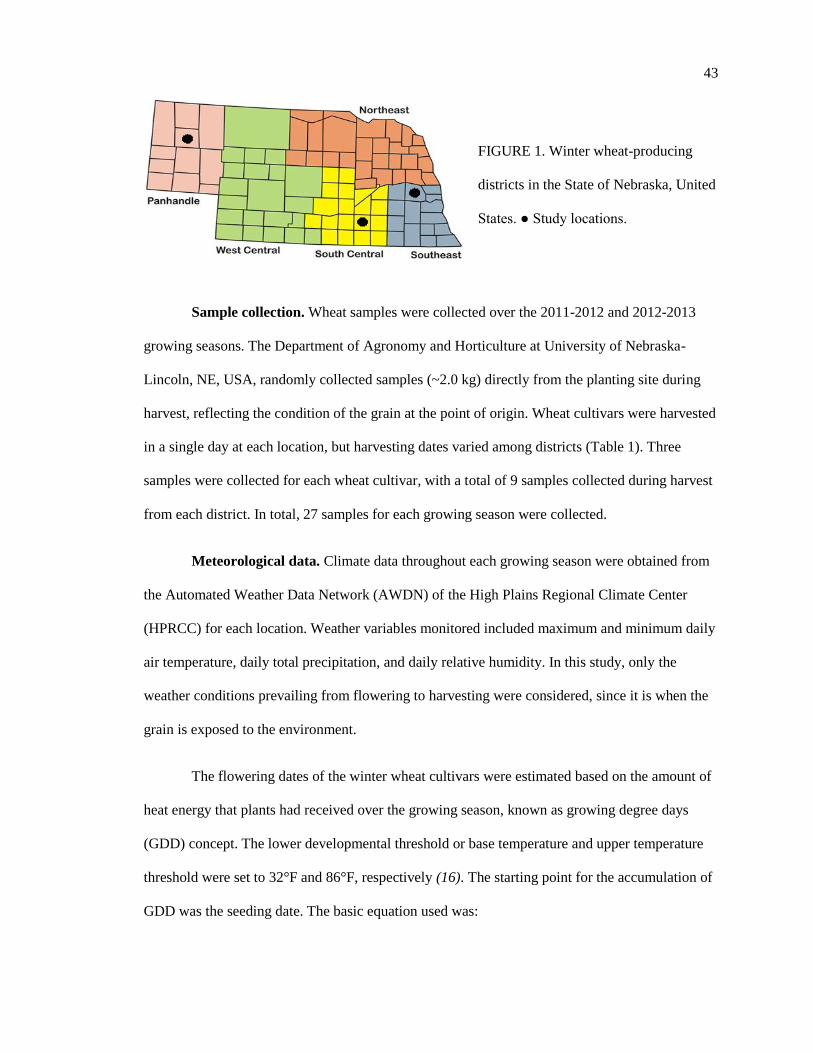
Introduction……………………………………………………………………………………….41
Materials and methods……………………………………………………………………………42
Results and discussion……………………………………………………………………………45
References………………………………………………………………………………………...57
Scientific Manuscript Three: Effect of the milling steps on the microbial load of wheat milled
products from different wheat varieties…………………………………………………………..61
Abstract…………………………………………………………………………………………...62
Introduction……………………………………………………………………………………….63
Materials and methods……………………………………………………………………………64
Results and discussion……………………………………………………………………………67
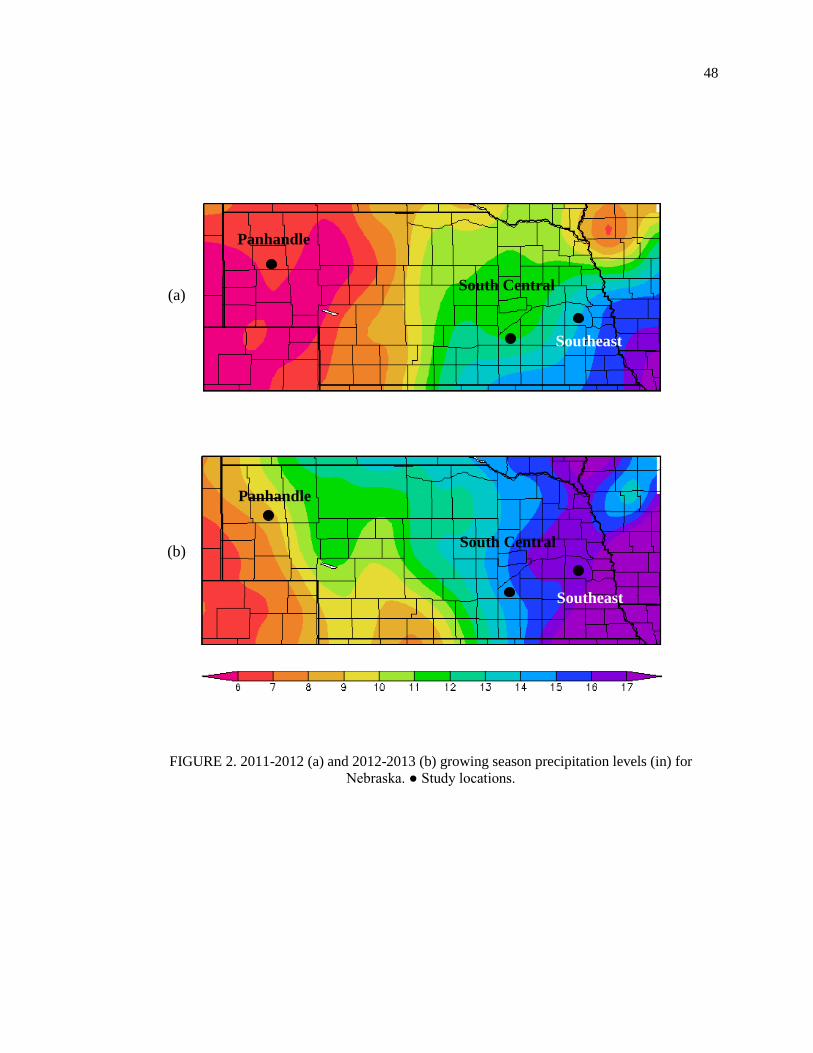
References………………………………………………………………………………………...76
Page 6
v
Scientific Manuscript Four: Effect of novel tempering solutions on reducing microbial load in
wheat prior to milling……………………………………………………………………………..78
Abstract…………………………………………………………………………………………...79
Introduction……………………………………………………………………………………….80
Materials and methods……………………………………………………………………………81
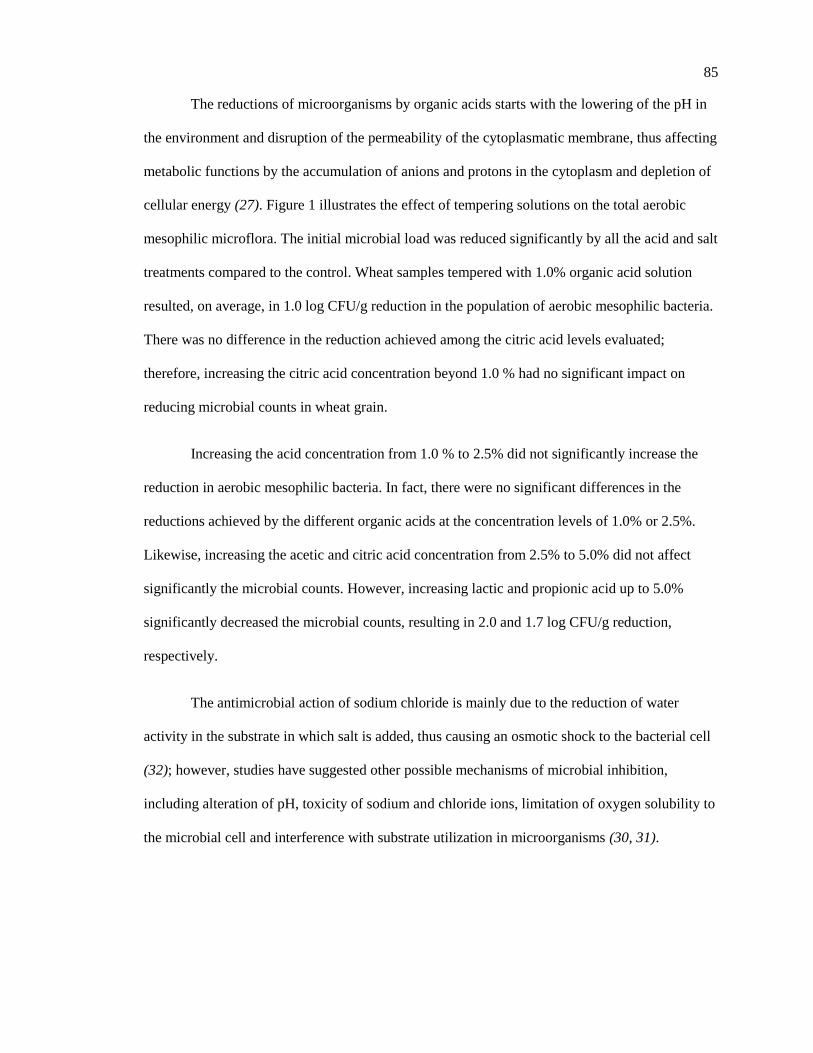
Results and discussion……………………………………………………………………………83
References………………………………………………………………………………………...94
Scientific Manuscript Five: Pre-milling interventions to reduce the microbial load of straight-
grade and whole grain flour with minimal impact on flour functionality………………………...98
Abstract…………………………………………………………………………………………...99
Introduction……………………………………………………………………………………...100
Materials and methods…………………………………………………………………………..101
Results and discussion…………………………………………………………………………..106
References……………………………………………………………………………….………130
Page 7
vi
LIST OF TABLES AND FIGURES
Scientific Manuscript Two
Figure 1. Winter wheat-producing districts in the State of Nebraska, United States…………….43
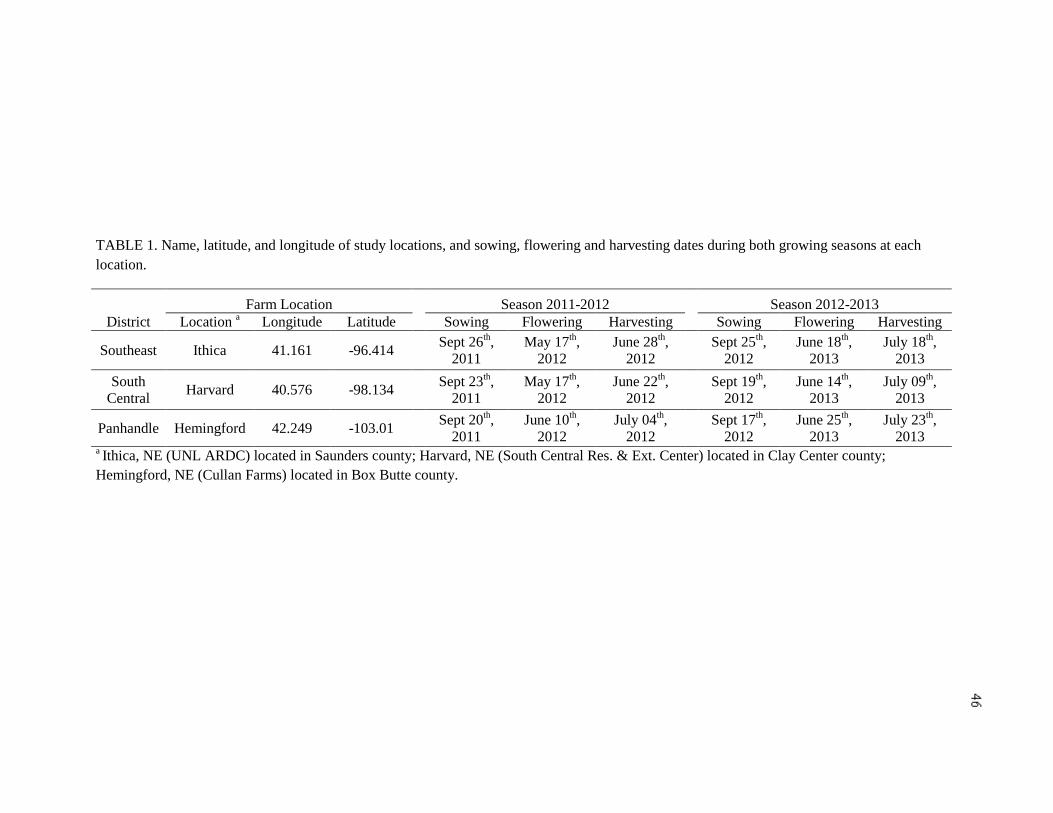
Table 1. Name, latitude, and longitude of study locations, and sowing, flowering and harvesting
dates during both growing seasons at each location……………………………………………...46
Figure 2. 2011-2012 (a) and 2012-2013 (b) growing season precipitation levels (in) for
Nebraska………………………………………………………………………………………….48
Table 2. Average high and low temperature (T-Max, T-Min), relative humidity (RH), and total
precipitation (Precip) distribution during the two growing seasons at each district……………...49
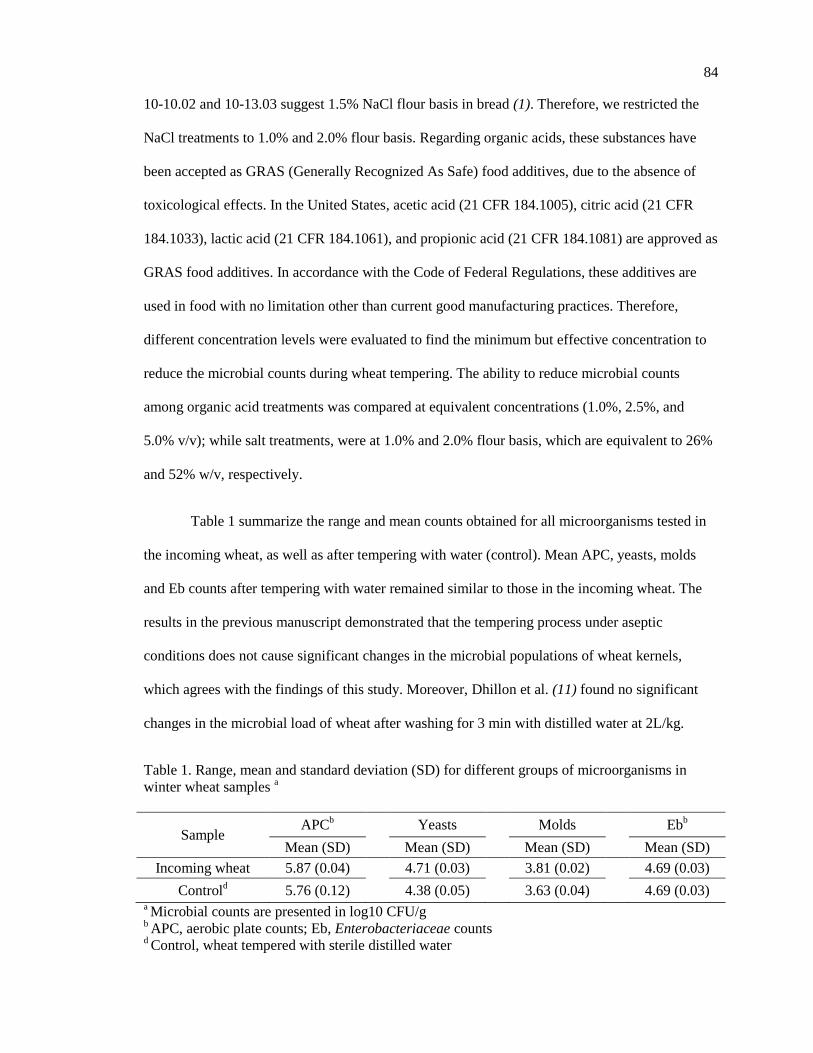
Table 3. Mean and standard deviation (SD) for microbial counts in winter wheat samples from
the 2011-2012 growing season………………………………………………………..………….50
Table 4. Mean and standard deviation (SD) for Deoxynivalenol, moisture content and water
activity in winter wheat samples from the 2011-2012 growing season…………………………..51
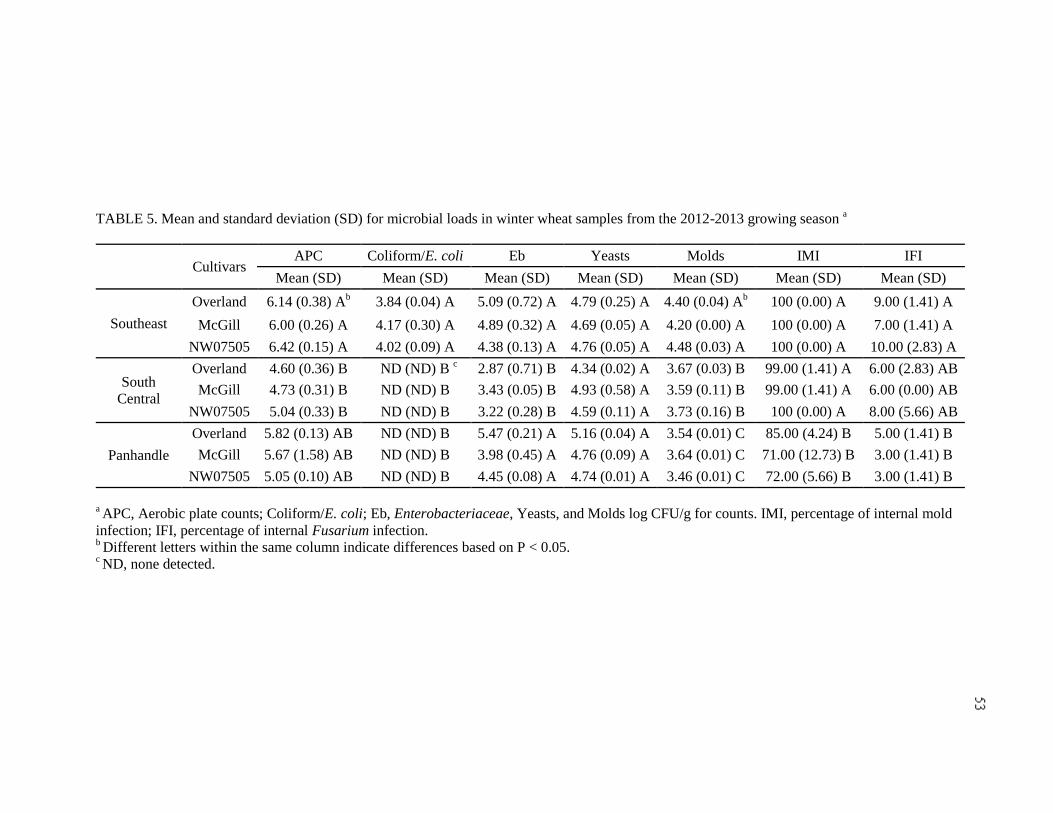
Table 5. Mean and standard deviation (SD) for microbial loads in winter wheat samples from the
2012-2013 growing season……………………………………………………………………….53
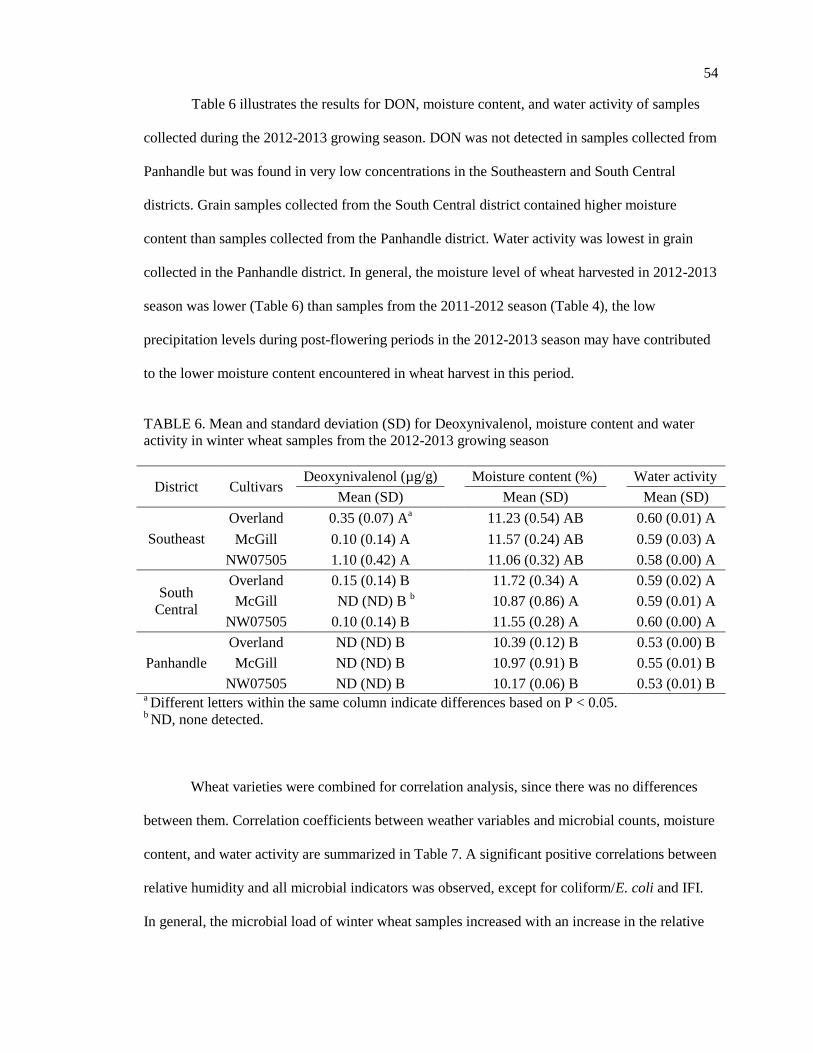
Table 6. Mean and standard deviation (SD) for Deoxynivalenol, moisture content and water
activity in winter wheat samples from the 2012-2013 growing season…………………………..54
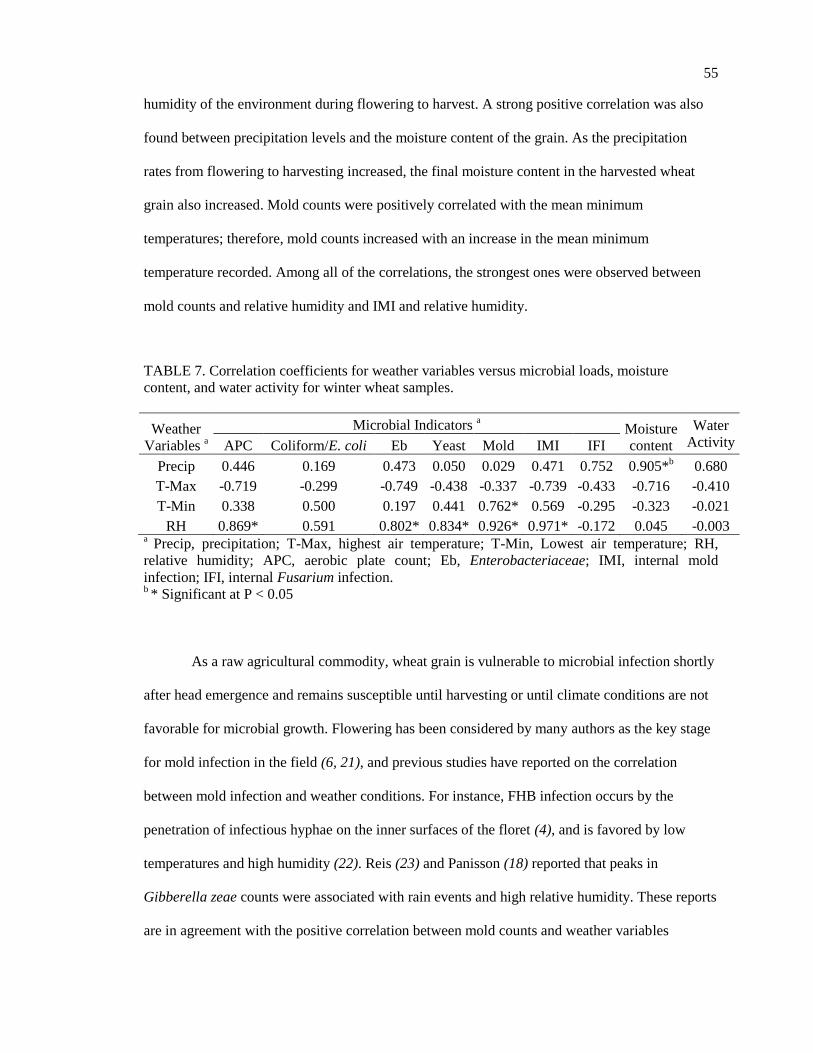
Table 7. Correlation coefficients for weather variables versus microbial loads, moisture content,
and water activity for winter wheat samples……………………………………………………...55
Scientific Manuscript Three
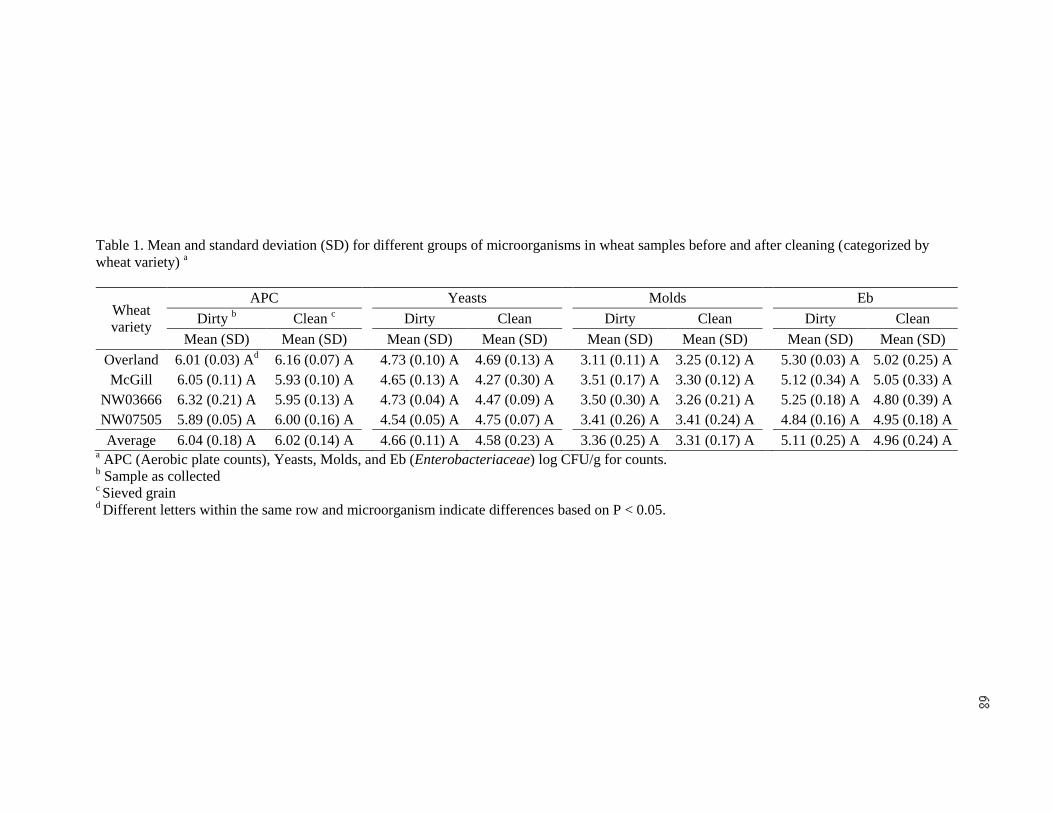
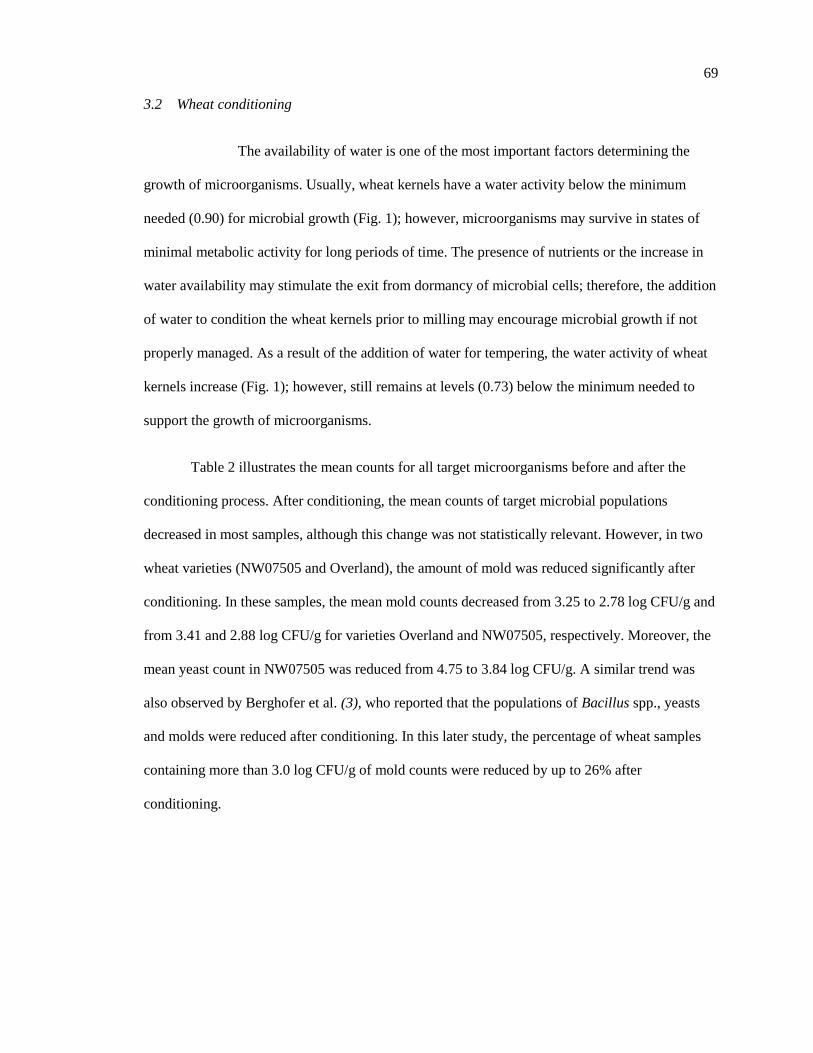
Table 1. Mean and standard deviation (SD) for different groups of microorganisms in wheat
samples before and after cleaning (categorized by wheat variety)……………………………….68
Table 2. Mean and standard deviation (SD) for different groups of microorganisms in wheat
samples before and after tempering (categorized by wheat variety)……………………………..70
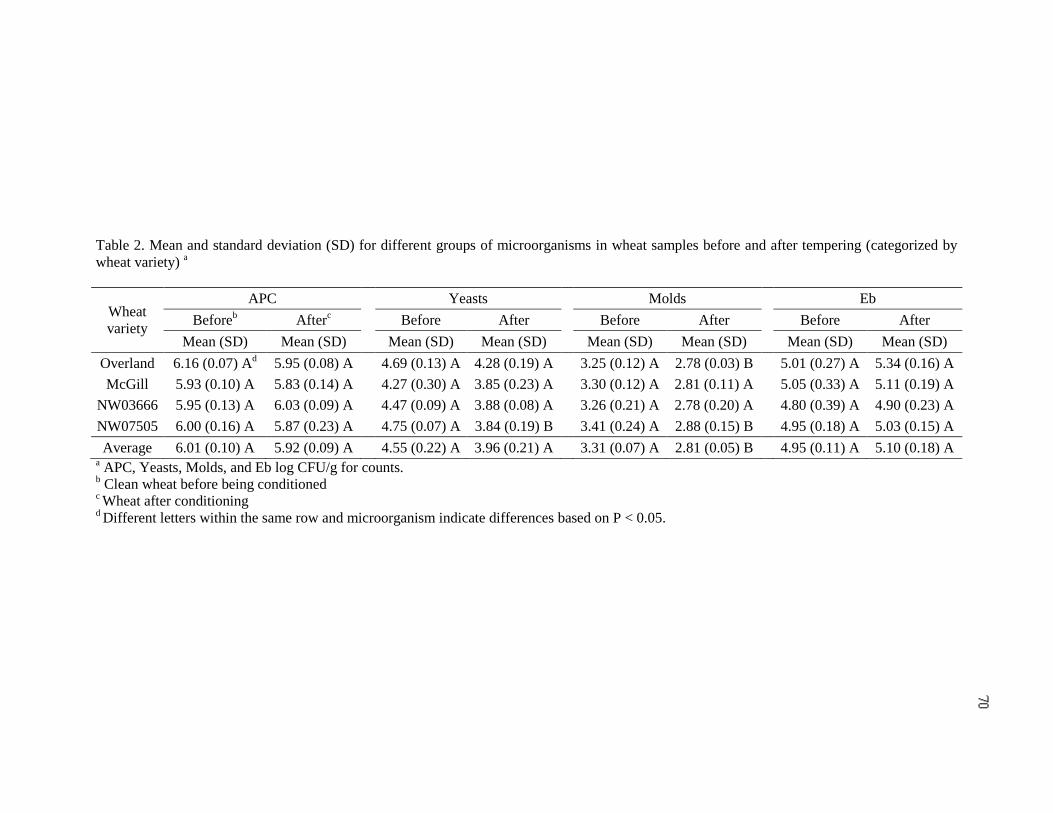
Figure 1. Average water activity of wheat grain before and after conditioning and milling end
products for all wheat varieties. Error bars denote ± standard deviation…………………………71
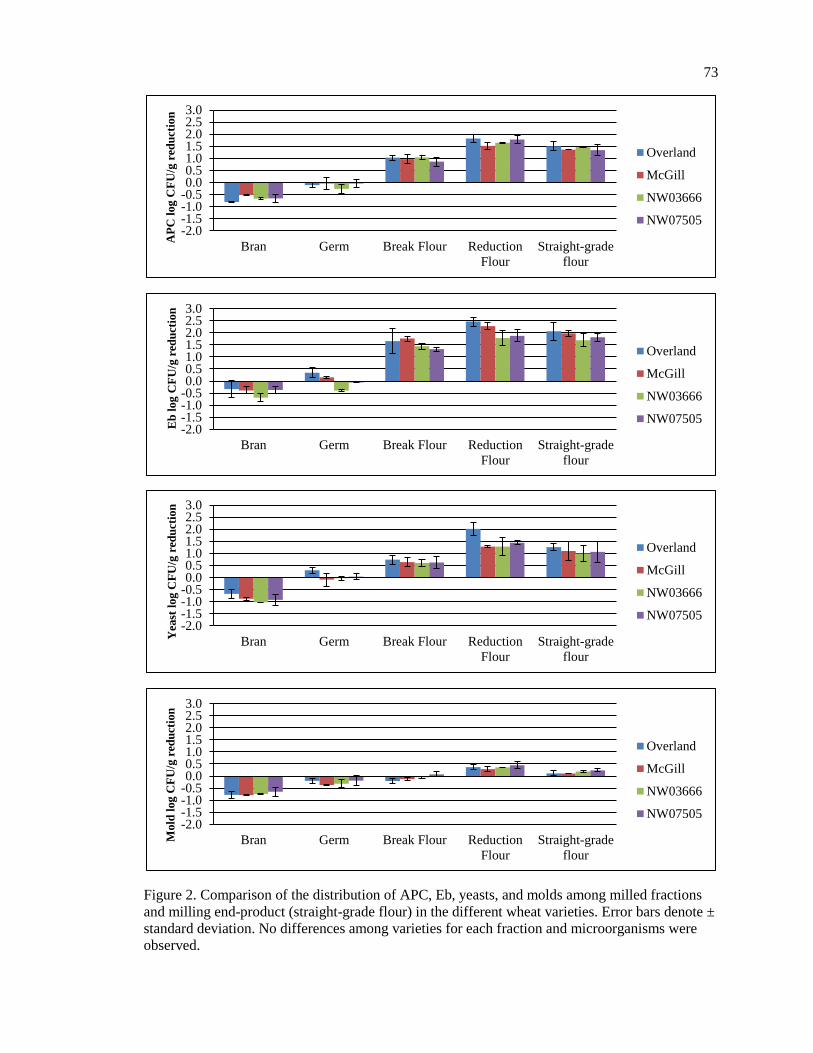
Figure 2. Comparison of the distribution of APC, Eb, yeasts, and molds among milled fractions
and milling end-product (straight-grade flour) in the different wheat varieties. Error bars denote ±
standard deviation. No differences among varieties for each fraction and microorganisms were
observed…………………………………………………………………………………………..73
Page 8
vii
Scientific Manuscript Four
Table 1. Range, mean and standard deviation (SD) for different groups of microorganisms in
winter wheat samples……………………………………………………………………………..84
Figure 1. Effect of organic acid and saline solutions on aerobic plate counts (APC) during wheat
tempering. Error bars denote ± standard deviation. One log reduction is equivalent to a 90%
reduction in CFU per gram of wheat grain. Log reduction values with the same letter are not
significantly different……………………………………………………………………………..86
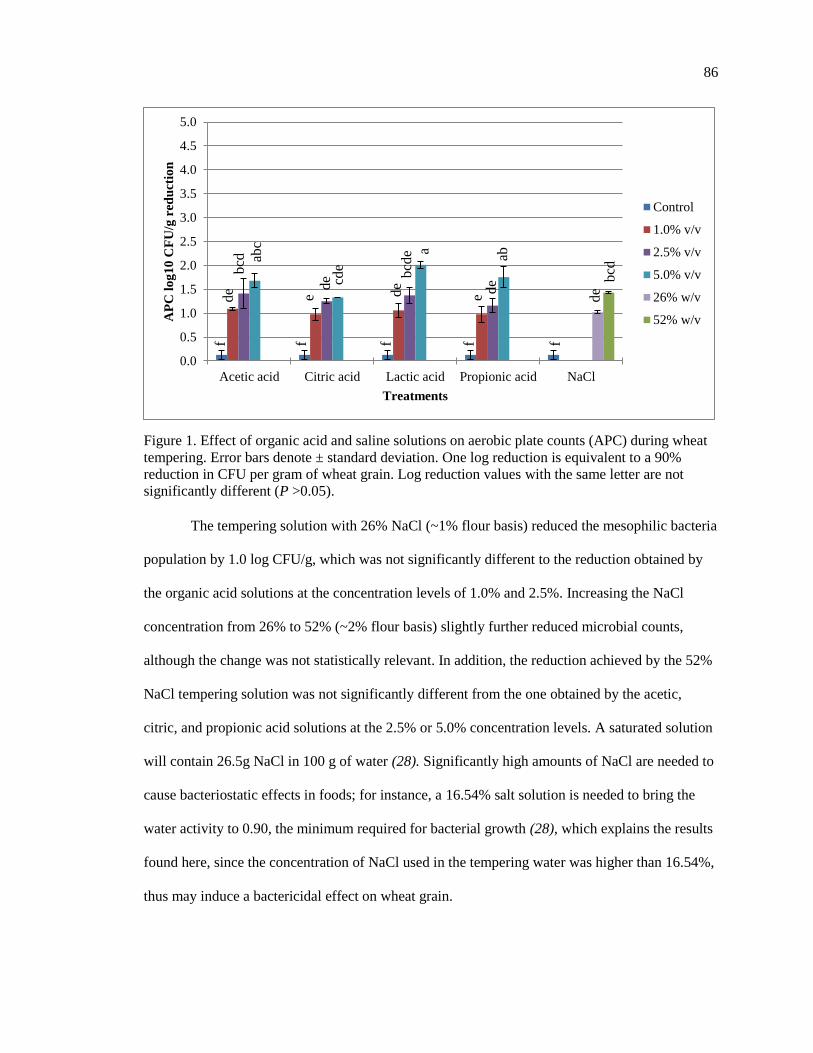
Figure 2. Effects of organic acids and saline solutions on Enterobacteriaceae (Eb) counts during
wheat tempering. Error bars denote ± standard deviation. One log reduction is equivalent to a
90% reduction in CFU per gram of wheat grain. Log reduction values with the same letter are not
significantly different……………………………………………………………………………..88
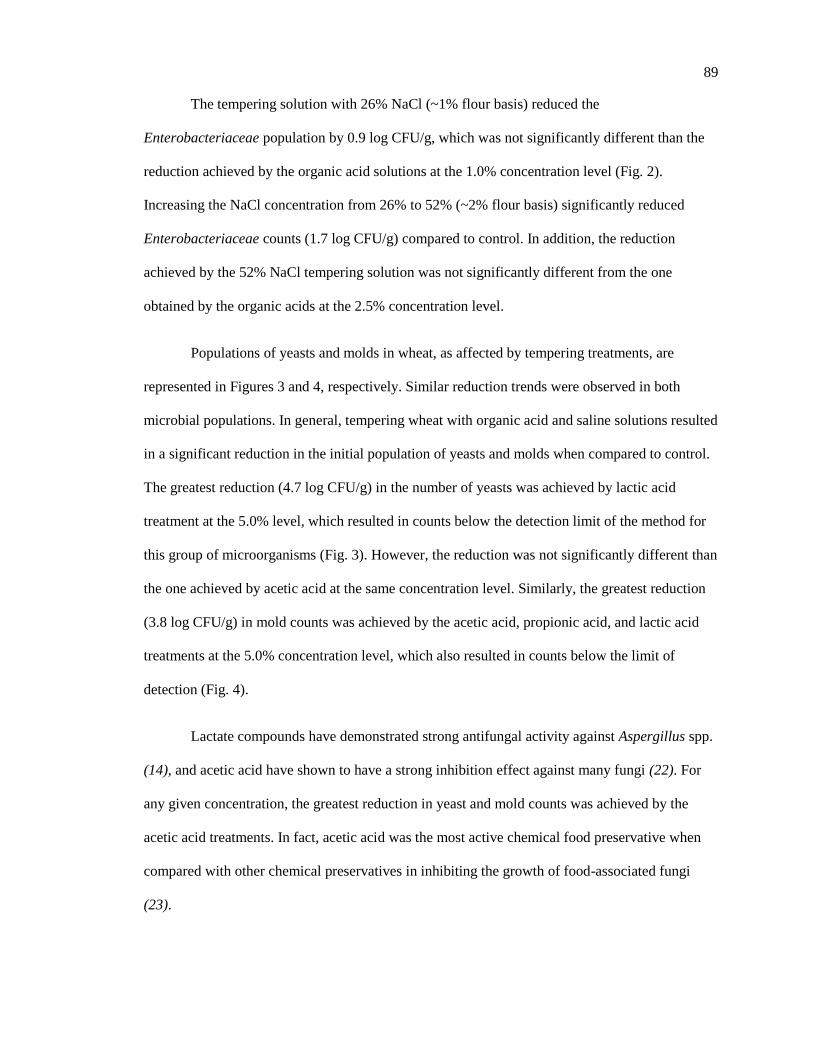
Figure 3. Effects of organic acids and saline solutions on yeast during wheat tempering. Error
bars denote ± standard deviation. One log reduction is equivalent to a 90% reduction in CFU per
gram of wheat grain. Log reduction values with the same letter are not significantly different.....
………………………………………………………………………………………….................90
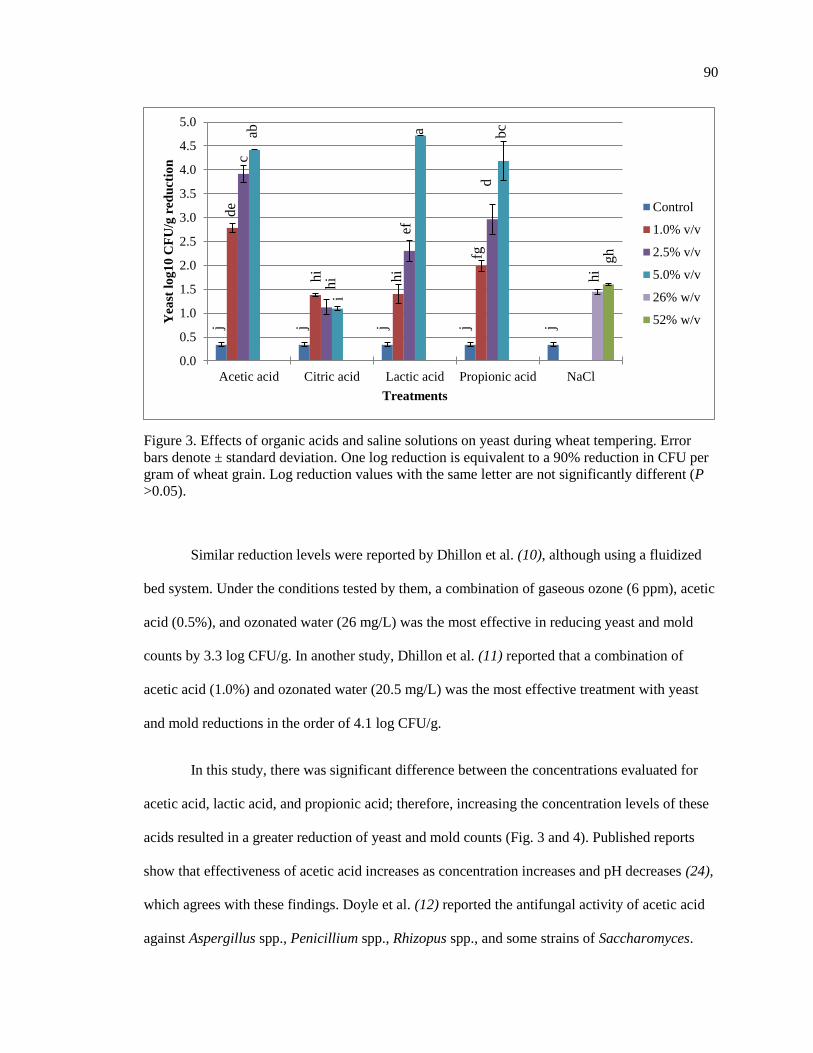
Figure 4. Effects of organic acids and saline solutions on mold counts during wheat tempering.
Error bars denote ± standard deviation. One log reduction is equivalent to a 90% reduction in
CFU per gram of wheat grain. Log reduction values with the same letter are not significantly
different…………………………………………………………………………………………...91
Scientific Manuscript Five
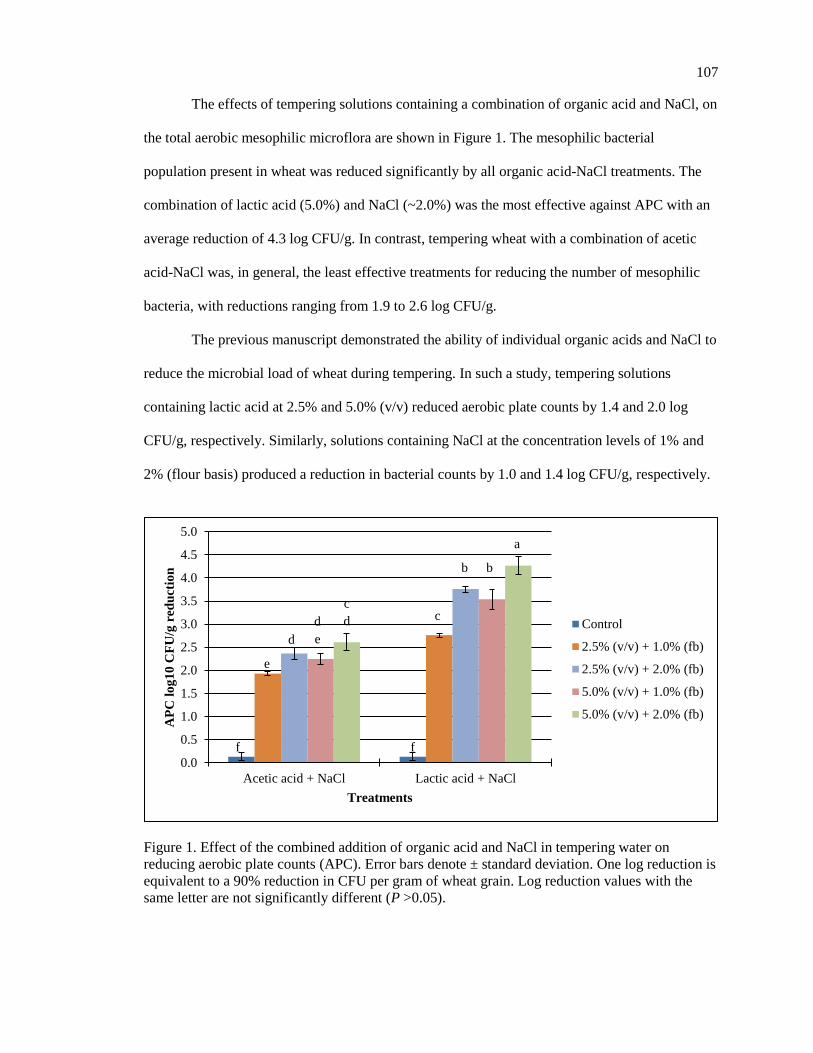
Figure 1. Effect of the combined addition of organic acid and NaCl in tempering water on
reducing aerobic plate counts (APC). Error bars denote ± standard deviation. One log reduction is
equivalent to a 90% reduction in CFU per gram of wheat grain. Log reduction values with the
same letter are not significantly different……………………………………………………….107
Figure 2. Effect of the combined addition of organic acid and NaCl in tempering water on
reducing Enterobacteriaceae counts (Eb). Error bars denote ± standard deviation. One log
reduction is equivalent to a 90% reduction in CFU per gram of wheat grain. Log reduction values
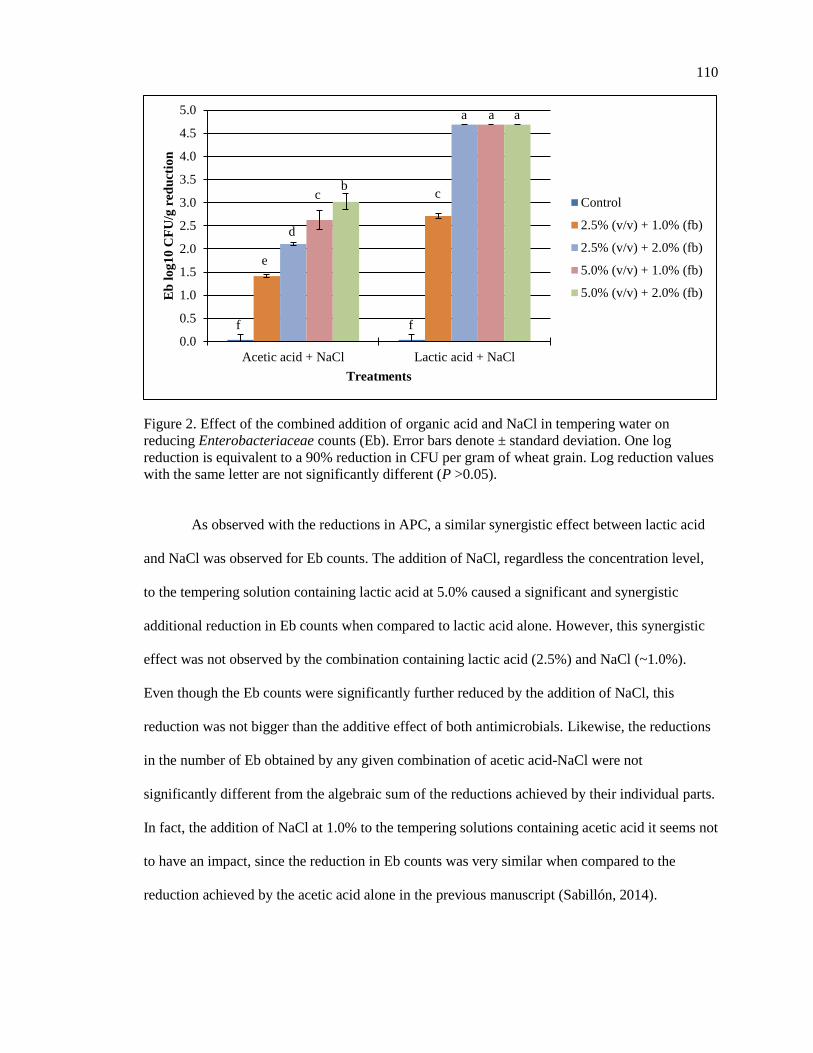
with the same letter are not significantly different……………………………………………...110
Figure 3. Effect of the combined addition of organic acid and NaCl in tempering water on
reducing yeast counts. Error bars denote ± standard deviation. One log reduction is equivalent to
a 90% reduction in CFU per gram of wheat grain. Log reduction values with the same letter are
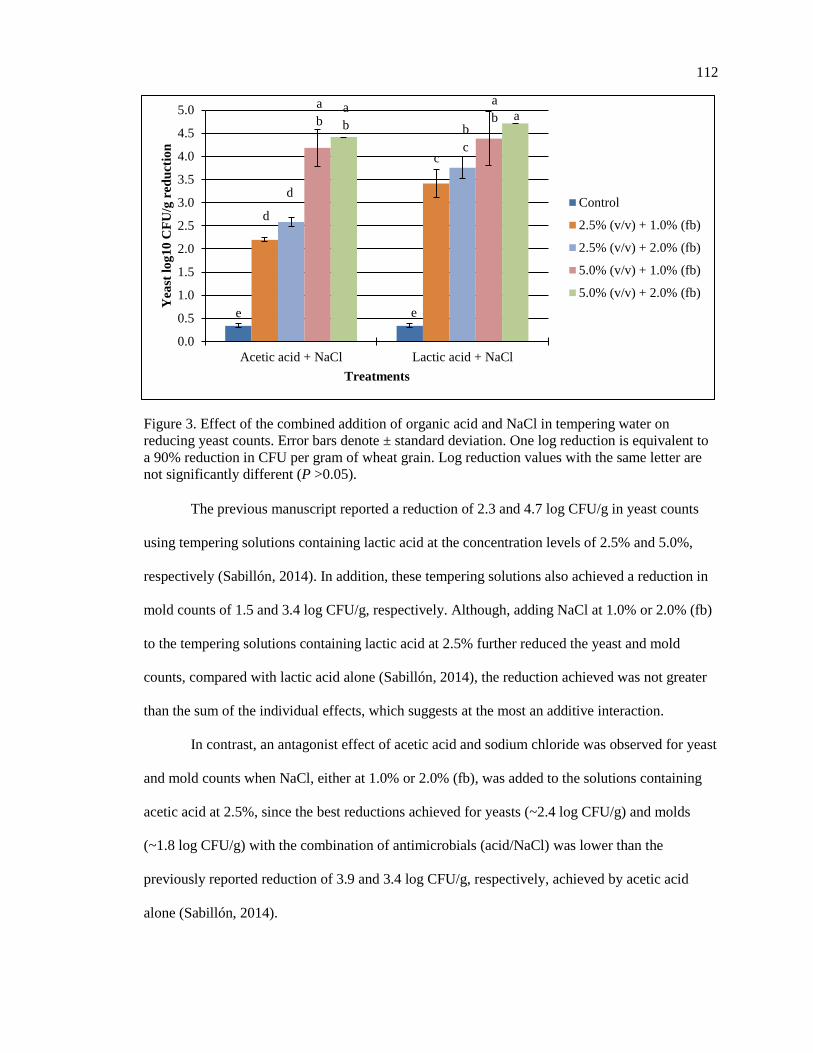
not significantly different………………………………………………………………………..112
Figure 4. Effect of the combined addition of organic acid and NaCl in tempering water on
reducing mold counts. Error bars denote ± standard deviation. One log reduction is equivalent to
a 90% reduction in CFU per gram of wheat grain. Log reduction values with the same letter are
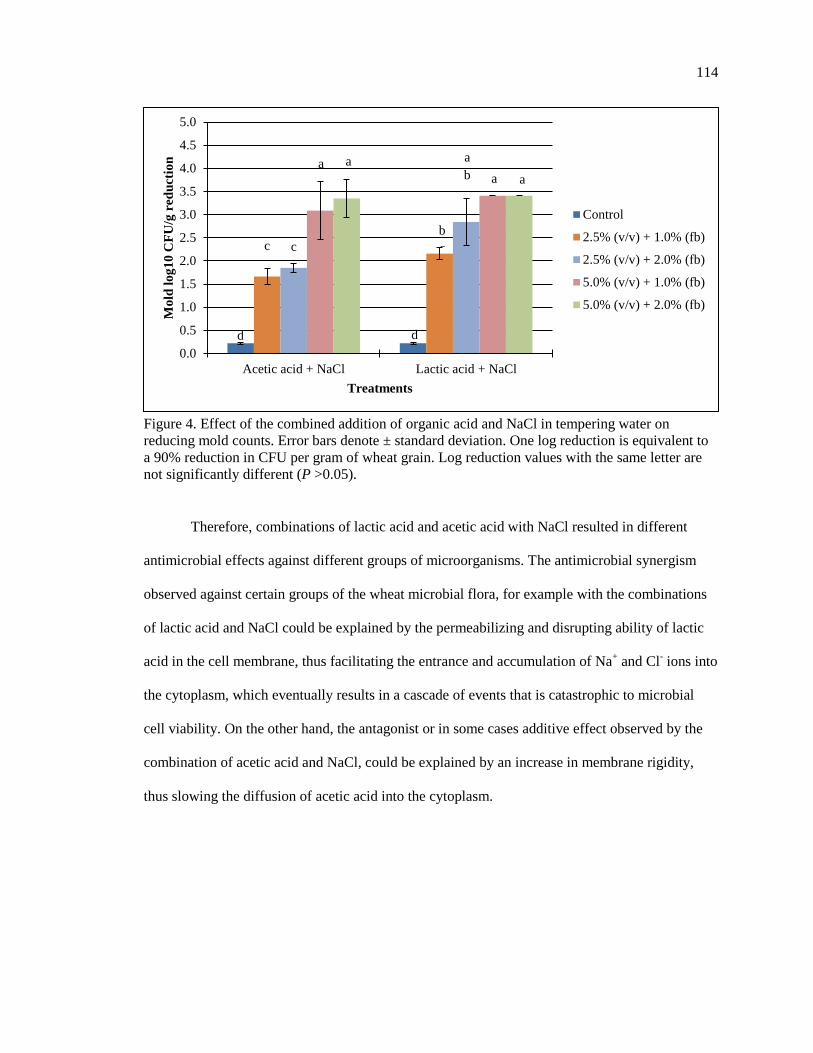
not significantly different………………………………………………………………………..114
Page 9
viii
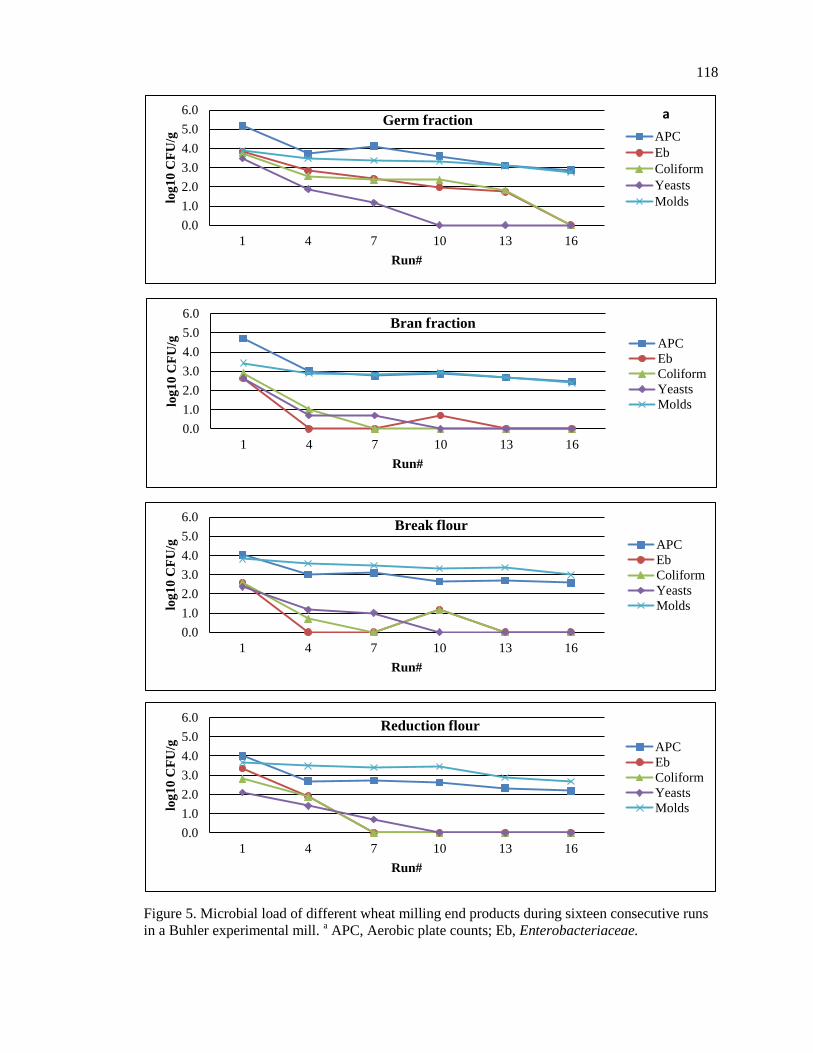
Figure 5. Microbial load of different wheat milling end products during sixteen consecutive runs
in a Buhler experimental mill. a APC, Aerobic plate counts; Eb, Enterobacteriaceae………….118
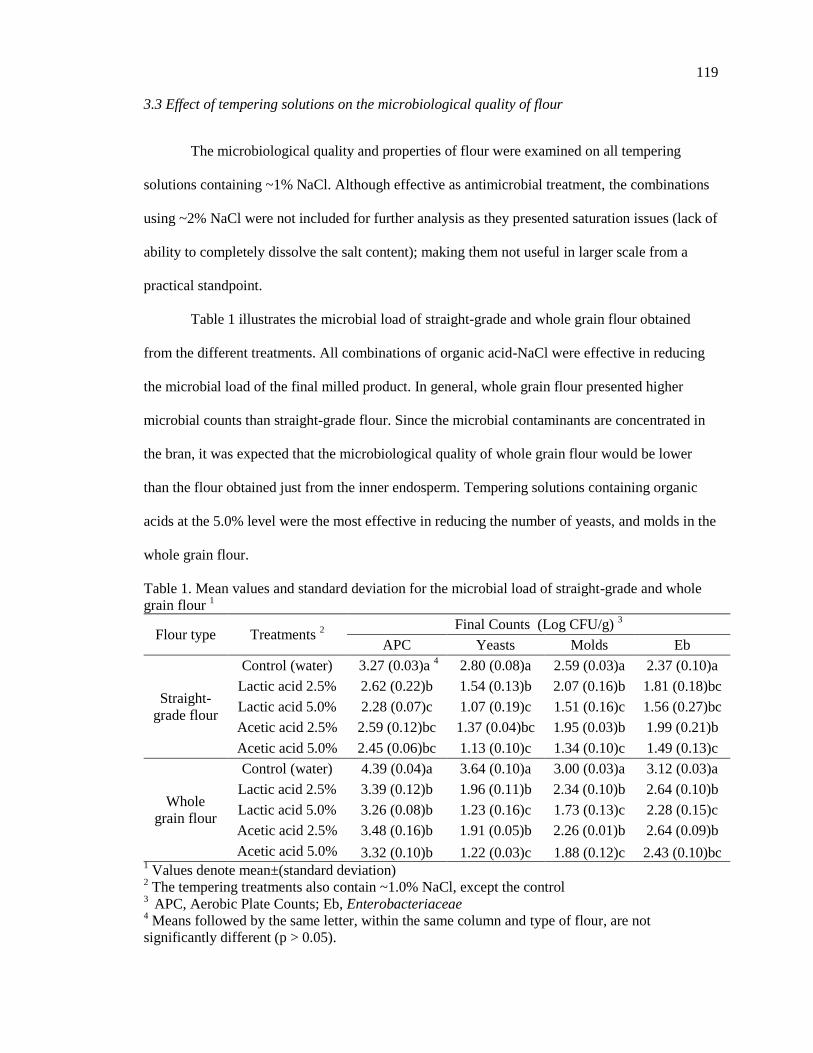
Table 1. Mean values and standard deviation for the microbial load of straight-grade and whole
grain flour………………………………………………………………………………………..119
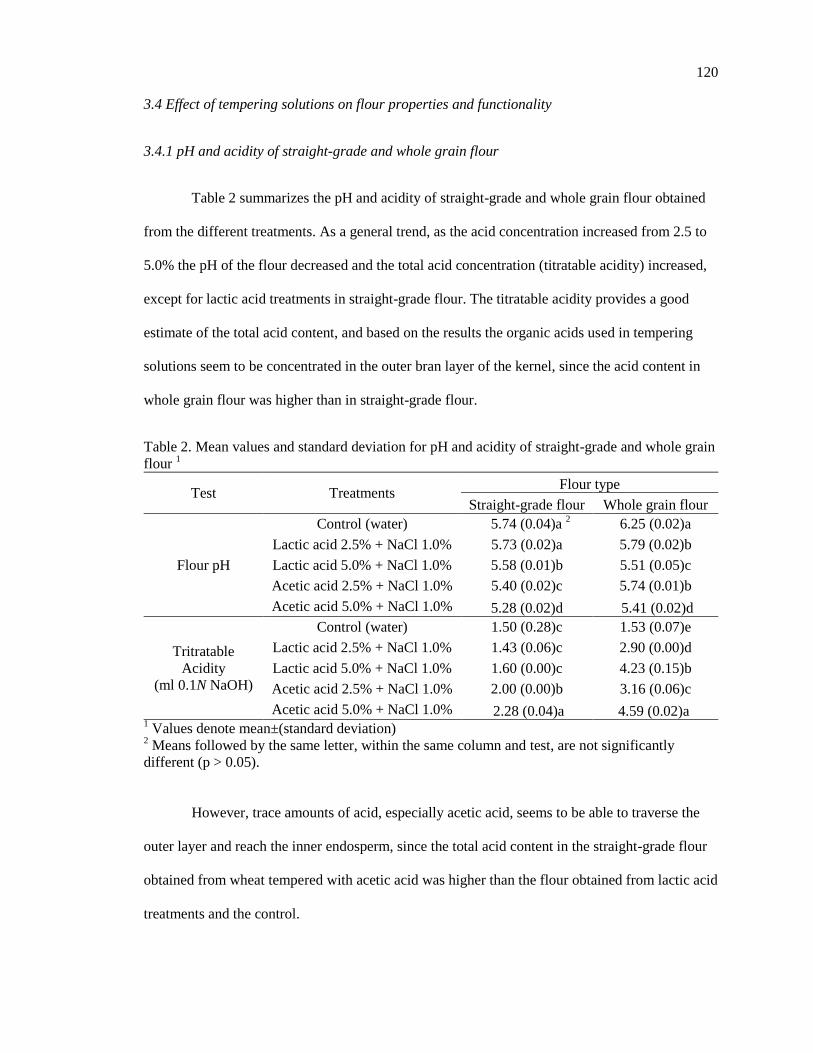
Table 2. Mean values and standard deviation for pH and acidity of straight-grade and whole grain
flour……………………………………………………………………………………………...120
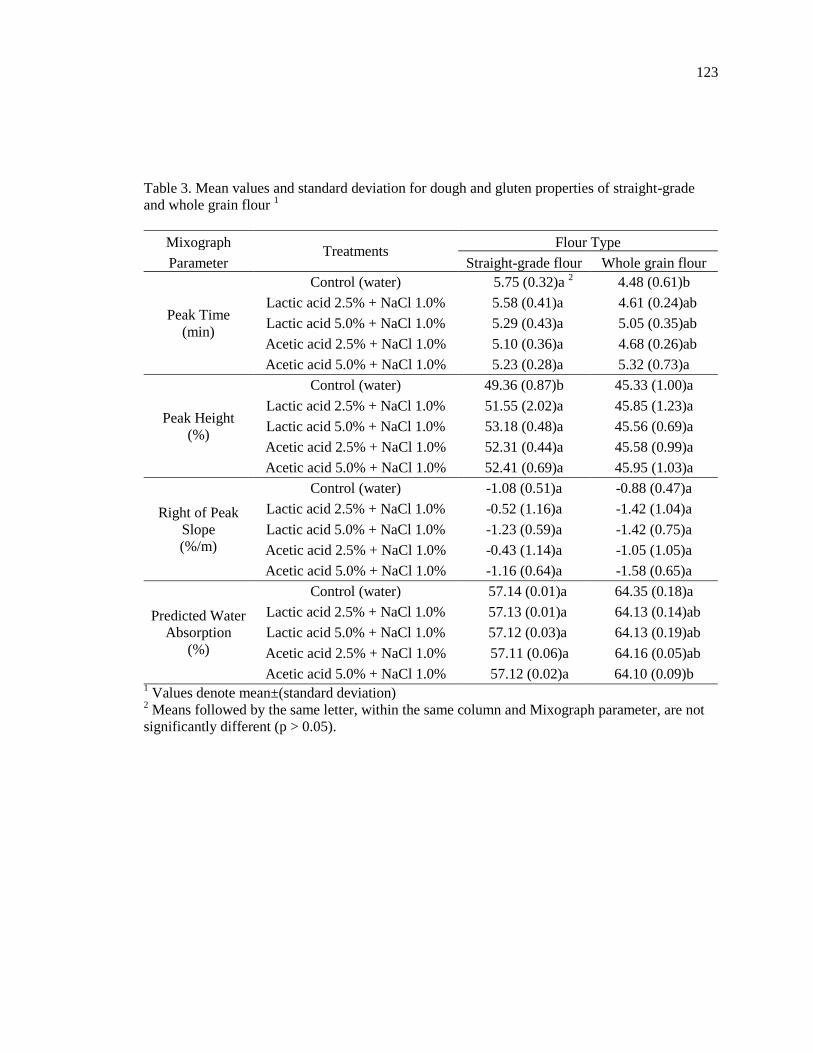
Table 3. Mean values and standard deviation for dough and gluten properties of straight-grade
and whole grain flour……………………………………………………………………………123
Table 4. Mean values and standard deviation for RVA pasting parameters of straight-grade and
whole grain flour………………………………………………………………………………...126
Table 5. Mean values and standard deviation for straight-grade and whole grain bread loaf
volume and firmness…………………………………………………………………………….127
Table 6. Mean values and standard deviation for straight-grade and whole grain bread image
analysis…………………………………………………………………………………………..128
Page 10
1
FROM WHEAT FIELDS TO CONSUMER’S TABLES: A COMPREHENSIVE
APPROACH TO THE MICROBIOLOGICAL QUALITY AND SAFETY OF WHEAT-
BASED PRODUCTS *
L. Sabillón and A. Bianchini
Department of Food Science and Technology
University of Nebraska – Lincoln, Lincoln, NE, USA
Corresponding author:
Andréia Bianchini, Department of Food Science and Technology
The Food Processing Center, University of Nebraska – Lincoln
University of Nebraska – Lincoln, Lincoln, NE, USA
Phone: (402) 472-3114, Fax: (402) 472-1693
[email protected]
* Scientific manuscript formatted to meet guidelines for the Journal of Cereal Chemistry
Page 11
2
ABSTRACT
Throughout history, wheat-based foods have been considered among the safest of all
foods produced for human consumption. In part, this claim reflects both the low risk profile of
low moisture foods and the thermal processes used to produce the finished product. Nevertheless,
raw flour contains a number of potential hazards, which, if not properly managed, may have the
potential to result in serious public health consequences. These hazards are mostly
microbiological in origin and arise mainly during production and distribution through the wheat
supply chain. The physical processes carried out during milling have minimal impact on the level
of contamination present on grain; therefore, the initial microbiological quality of wheat grain has
a strong influence on the ultimate quality and safety of milling end products. While most flour-
based foods are processed and consumed in forms that are less likely to be contaminated with
pathogens, many refrigerated dough products possess a substantial safety hazard to consumer
health, since they are more likely to be consumed raw or undercooked. The potential for exposure
to pathogenic microorganisms present in raw flour by eating uncooked baking mixture has been
demonstrated by several outbreaks. Such food safety incidents have led to heightened
manufacturer and consumer awareness about safety related to flour-containing foods.
Page 12
3
INTRODUCTION
Historically, wheat flour has symbolized a pure and wholesome product. Furthermore, as
a low moisture food, it has not traditionally been a discussion point in terms of food safety (7).
However, recent events have caused the food industry and consumers to reconsider the safety
level offered by wheat milled products. Studies have indicated that bacterial contaminants may
survive in a latent state for extended periods in wheat flour, despite the low moisture content, and
emerge from dormancy when flour is added to environments that are more receptive to growth,
such as batter or mixes (13, 22). The multistate outbreak of Escherichia coli O157:H7 infections
in the United States in 2009 associated with consumption of ready-to-bake pre-packaged cookie
dough represents the most striking recent example of the potential for harm caused by products
containing raw flour (35). And it is far from an isolated event, since the safety of wheat flour-
based products has been threatened over the years. Low levels of Salmonella contamination have
been detected in wheat flour; and flour and flour-based mixes have been involved in foodborne
Salmonella outbreaks (7, 27, 52, 64, 84, 90, 100, 101). Coliforms and generic E. coli species are
commonly used as hygiene and safety indicators in many food industries to assess the
microbiological safety of processing environments and foods. However, some species of enteric
bacteria normally live and feed on dead organic matter (e.g., plants), thus these microorganisms
are likely to be present in grain or milled products to some extent (104). Indeed, these
microorganisms have been found in wheat flour (5, 7, 64, 84), where high levels may indicate
unhygienic processing or handling and the potential presence of fecally-transmitted pathogens.
Wheat flour is usually contaminated with Bacillus spores as a result of processing or post-
processing contamination (83). Bacillus species have been associated with the spoilage of flour-
containing foods (e.g., rope spoilage of bread) as well as food safety incidents (18, 45, 83, 89,
102). The presence of spore-forming pathogenic Bacillus species, such as B. cereus, in starchy
foods like wheat-pasta is frequently the cause of several foodborne illnesses (18, 17, 50).
Page 13
4
The safety of flour-containing foods has been compromised over the years, not only by
pathogenic bacteria, but also by fungal contamination, especially those mycotoxin-producing
molds. In addition to the negative changes in the chemical composition of flours, bread, and
pastries, the production of mycotoxins is one of the several major consequences of mold growth
(42). Mycotoxins are fungal secondary metabolites that have various acute and chronic effects on
human health (33), therefore they represent another important risk associated with wheat product
consumption. Mold growth and subsequent mycotoxin production usually occurs during grain
ripening at the field level but also as a result of poor storage conditions (61, 71, 103). As wheat
kernels are further processed into flour, fungal and mycotoxin contamination is redistributed, un-
destroyed, and concentrated in certain milling fractions; therefore, wheat flour may carry a
significant mycological and mycotoxigenic load (12, 92). Mycotoxin-producing species of the
genus Aspergillus, Penicillium and Fusarium have been found in wheat-based retail products,
especially whole-grain flours (10, 26, 42, 47). Moreover, low but persistent levels of multiple
mycotoxins in wheat-based products sold directly to the public have been reported in several
countries (3, 26, 47, 69, 91, 99). Besides potentially pathogenic microorganisms and mycotoxins,
wheat milling end products harbor a wide variety of spoilage microorganisms, including aerobic
psychrophilic, mesophilic or thermophilic bacteria (e.g., spore-forming and lactic acid bacteria),
yeasts, and molds (3, 7, 22, 44, 64, 84). Consequently, the use of raw flour (not heat-treated) in
foods such as refrigerated dough products, pie pastry or pasta products could also be the source of
accelerated spoilage.
The increased incidence of foodborne disease outbreaks caused by products containing
flour has highlighted the importance of high microbiological quality of wheat grain at the
beginning of the flour supply chain. During wheat production, including harvest, storage and
transport, microbial contaminants are hosted and concentrated mainly on the surface of the grain
and from there they reach the flour during milling (39). The microbiological quality of wheat
grain is considered to be the major contributor to loss of quality and safety of milled products and
Page 14
5
foods produced from this ingredient (7, 79). A comparison between the milling end products of
high and low microbiological quality wheat showed that flour with higher microbial counts is
usually obtained from wheat of inferior microbiological quality (7). Since wheat flour is an
agricultural product, as such, it is exposed to naturally occurring microbiological threats, and
therefore the assumption that flour and other milled products are microbiologically safe is risky
for consumers. Nowadays, many flour-based products rely on the consumer to perform baking or
cooking steps, which could be dangerous, since an alarming percentage of consumers often eat
these products (e.g., refrigerated cookie or biscuit dough, frozen pizzas or pies) without fully
cooking them as directed by the manufacturer (13). Therefore, it is important to understand how
to mitigate the risk of microbial contamination in wheat flour, especially the one used in ready-to-
cook or ready-to-bake products. In light of several food safety incidents implicating wheat flour
as a potential carrier of pathogens, this article aims to provide an overview of the microbiological
safety of the flour supply chain, from wheat grain to finished products, and to describe the effects
of milling procedures and thermal processes on the microbial load and mycotoxins of wheat grain
and finished products. Hence, to help evaluate the potential risk related to wheat-based products,
within each section of this article, the microbial load has been categorized into three classes:
spoilage microorganisms, pathogenic microorganisms, mycotoxin-producing molds and
mycotoxins.
MICROBIOLOGICAL PROFILE OF WHEAT GRAIN
Throughout the growing season, wheat is exposed to multiple sources of microbial
contamination, including soil, water, insects, and animal feces (15, 16, 39). Additionally,
microbial contamination also occurs during harvesting and subsequent handling and storage (80,
103). Thus, throughout the wheat production chain, there is ample opportunity for molds to
produce toxins and for microbes to colonize the wheat grain. The number and type of
microorganisms present in wheat is influenced by several factors, including the meteorological
Page 15
6
conditions prevailing during grain ripening and harvesting, harvesting and handling equipment,
insect, bird and rodent activity during production and storage, and moisture control (64, 79, 103).
The microflora found in wheat grain is large and varied, and includes bacteria that mainly
belongs to the families Micrococcaceae, Pseudomonadaceae, Enterobacteriaceae,
Lactobacillaceae and Bacillaceae; yeasts, and molds that mostly belong to Alternaria,
Cladosporium, Fusarium, Helminthosporium, Aspergillus, Penicillium, and Eurotium (39, 103).
Within these families, pathogenic microorganisms (e.g. Bacillus cereus, Clostridium botulinum,
Clostridium perfringens, Escherichia coli, Salmonella, Staphylococcus aureus), mycotoxin-
producing molds, and spoilage microorganisms (e.g. Bacillus spp. and lactic acid bacteria) are
found (7, 24, 32, 64, 103). These microorganisms are mostly distributed in the surface of the
grain, although some species can occupy the inner part of the kernel (e.g. fungal hyphae), mainly
thorough the germ or due to mechanical damage during harvesting (34, 39). Generally, wheat
grain stored under proper conditions (e.g. temperature and humidity controlled) have water
activity below the minimum needed for microbial growth; however, pathogenic and spoilage
microorganisms may survive in a dormant state and be transferred to processed products where
they become a problem (44, 103).
Spoilage microorganisms. Yeast and mold are among the common spoilage
microorganisms found on wheat grain. In a two-year survey, Seiler (79) reported mold counts of
5.1 log colony forming units/gram (log CFU/g) in British wheat for the 1976 growing season and
6.0 log CFU/g for the 1977 growing season. Eyles et al. (24) found yeast-mold counts in the order
of 4.2 log CFU/g in Australian wheat. In another Australian survey, Berghofer et al. (7) analyzed
58 wheat samples and found yeast and mold counts in the range of 2.0 to 5.0 log CFU/g. In a
2001 North American survey, the yeast-mold counts found in durum wheat samples as received
from growers, farms bins, and elevators ranged from 1.4 to 5.0 log CFU/g, with an average of 3.3
log CFU/g (44). More recently, in another Australian wheat survey, Eglezos (22) reported mean
counts of 3.7 log CFU/g and 2.7 log CFU/g for yeast and mold, respectively. Moreover, Peles et
Page 16
7
al. (48) examined the microbiological status of Hungarian organic wheat grain, and found mean
counts of 3.9 log CFU/g and 3.5 log CFU/g for yeast and mold, respectively. Riba et al. (63)
reported that mean value counts of fungi ranged from 2.4 to 3.1 log CFU/g in Algerian wheat.
In addition to fungi, a wide variety of spoilage bacteria, including bacilli, lactic acid
bacteria, and micrococci are also present in wheat grain. Eyles et al. (24) reported total aerobic
counts of 4.9 log CFU/g in Australian wheat. The same levels of aerobic bacteria (4.9 log CFU/g)
were observed in 54 U.S. wheat samples (65). Berghofer et al. (7) reported that the most frequent
(modal) counts in the Australian wheat for aerobic mesophilic bacteria was 5.0 log CFU/g, with
55% of the samples analyzed containing counts greater than or equal to 4.0 log CFU/g, up to a
maximum of 7.0 log CFU/g. In addition, the most frequent count for Bacillus spp., bacteria
responsible for rope spoilage of bread, was 4.0 log CFU/g. In the same study, mesophilic aerobic
spores and thermophilic aerobes were also commonly detected but at levels (1.0 log CFU/g)
lower than other spoilage microorganisms. In the 2001 durum wheat survey in North America,
the aerobic plate counts ranged from 0.9 to 8.4 log CFU/g (44). Peles et al. (48) also reported
aerobic bacterial counts at a mean of 4.9 Log CFU/g in Hungarian organic wheat.
Pathogenic and fecal microorganisms. Enteric pathogens, such as Salmonella spp. and
Escherichia coli, may be among the microflora of wheat grain creating a food safety risk in
milled products. Likewise, the food poisoning spore-former Bacillus cereus may also be present
in wheat grain. In 1992, Salmonella Havana was isolated from wheat grain in Queensland,
Australia (22). More recently, Eglezos (22) reported a single isolation of Salmonella Give from
50 unscreened wheat samples. Similar occurrence was reported by Berghofer et al. (7), where
only 2 environmental serovars of Salmonella, S. Chester and S. Hvittingvoss, were isolated from
2 milling samples out of 412 analyzed. Berghofer et al. (7) also reported that 47 out of 58 wheat
samples evaluated tested positive for B. cereus. However, the majority of the positive samples
contained less than 1 spore per gram. A low incidence of B. cereus in wheat was reported by
Eglezos (22), since only 2 out of 50 samples analyzed showed the presence of this organism, at a
Page 17
8
mean of 2.1 log CFU/g. Some species of enteric bacteria are associated with plant materials, and
wheat is not the exception. In the same study, Eglezos (22) detected E. coli in one of the samples
evaluated, at a mean of 0.6 log CFU/g. Eyles et al. (24) found coliforms counts at 1 most probable
number/gram (MPN/g) in Australian wheat. However, Berghofer et al. (7) reported higher levels,
10 MPN/g, also in Australian wheat. Escherichia coli O157:H7 have not been isolated or detected
in any of the other surveys carried out.
Mycotoxin-producing molds and mycotoxins. Fungal contamination is frequently
divided into two groups, field fungi and storage fungi (49, 103). Field fungi invade grain before
harvest when they have high moisture content (18 to 30%), whereas storage fungi infect grain
post-harvest when they have lower moisture contents (14 to 16%). Field fungi consist primarily
of species of Alternaria, Cladosporium, Fusarium, and Helminthosporium, while storage fungi
include species of Eurotium, Aspergillus, Penicillium, and Mucor. Riba et al. (63) analyzed the
mycobiota composition of 27 samples of freshly harvested field wheat grain collected from two
regions in Algeria. Their results revealed the dominance of Aspergillus spp. followed by
Fusarium spp., in both areas. A post-harvest survey by Birck et al. (105) found that Aspergillus
(100%), Fusarium (80%) and Penicillum (60%) were the most frequently recovered genera from
stored wheat samples during 180 days. Bensassi et al. (106) analyzed the mycobiota of freshly
harvested wheat grain in Tunisia and found Alternaria as the dominant fungal species followed
by Fusarium species. Fusarium culmorum and Alternaria alternata were among the most
predominant isolated mycotoxigenic species. In another study, wheat samples were analyzed
directly after harvest as well as after three months of storage (107). The most predominant species
on wheat grain after harvest belonged to the genus Alternatia, Cladosporium and Fusarium,
whereas after three months of storage the dominant species were those belonging to Aspergillus
and Penicillium.
When wheat grain is colonized by these fungi there is a significant risk of contamination
with mycotoxins and consequently, the safety of the grain can be greatly reduced. Mycotoxins
Page 18
9
have multiple effects on eukaryotic cell functions; hence, it can cause significant harm to humans
and animals when ingested (33). The mycotoxins of greatest significance on wheat grain include
deoxynivalenol (DON) and zearalenone (ZEA) produced by Fusarium graminearum and
Fusarium culmorum, respectively, during wheat flowering, and ochratoxin (OTA) produced by
Penicillium verrucosum and Aspergillus ochraceus during wheat storage (51). Nishio et al. (53)
studied the levels of Fusarium graminearum infection in wheat and observed that the amount of
DON produced was directly related to the incidence of fungal growth. Among the mycotoxins
produced by Fusarium spp., DON is the predominant and most economically important
mycotoxin in small grain production, such as wheat (116). Several surveys have been conducted
on the levels of mycotoxins in wheat worldwide (108, 109, 111, 112). Regulatory agencies such
as the European Commission, have established maximum limits for these toxins to minimize the
exposure and toxic effects in humans and animals (19, 20).
The microbial load and mycotoxin production in wheat grain depends on several factors,
among them the climatic and geographical conditions. Seiler (79) demonstrated this by
comparing the microbial load at the time of harvest of wheat grown under warm dry weather
conditions (5.7 log CFU/g for total bacteria and 5.1 log CFU/g for molds) and wheat grown under
unusually wet conditions (8.1 log CFU/g for total bacteria and 6.0 log CFU/g for molds). More
recently, Manthey et al. (44) also found differences in the microbial load of durum wheat planted
across the North Plains region in the United States as a result of precipitation levels during the
growing season. Moreover, some studies have shown that moisture related variables, such as
daily average relative humidity and total daily precipitation can be positively correlated with
mold infection and mycotoxin production (114, 115). According to these studies, wheat grown
under higher precipitation rates and humidity may be more susceptible to lower microbiological
quality and higher mycotoxin content.
Page 19
10
EFFECT OF THE MILLING STEPS ON MICROBIAL LOAD AND MYCOTOXINS IN
MILLED FRACTIONS
The dry milling process of wheat involves three general operations: cleaning, tempering,
and milling. None of these operations involve chemical or thermal treatments and thus do not
significantly impact the safety of milled products. Nevertheless, the milling process causes a
redistribution of contaminants and may lower the contamination levels in milled fractions
intended for human consumption (flour and semolina).
Cleaning. Flour milling begins with removal of unwanted materials from wheat grain.
Once harvested, wheat contains a significant percentage of non-wheat materials, including sticks,
stems, stones, unsound wheat kernels, attached soil, insects and other kind of materials that may
come from wheat fields (62). The cleaning process is carried out by a sequence of operations that
removes these impurities based on shape, density, size, and magnetism (62). The foreign matter
separated during the cleaning process may contribute to improve the safety of wheat grain prior to
milling. In terms of microbiological quality, Manthey et al. (44) demonstrated that after cleaning
dirty grain with a dockage tester and cyclone grain cleaner, on average, the microbial load was
reduced in 1.0 log CFU/g for aerobic bacteria and similar reductions were also seen with yeast
and molds counts. Seiler (79) also observed small reductions in counts of bacteria and mold in
wheat when evaluating different dry scourers, aspirators and brushes. In contrast, Riba et al. (63)
observed no differences in the fungal contamination between unclean wheat and wheat after
cleaning, with fungal counts varying from 2.7 to 2.9 log CFU/g.
Likewise, physical separation and cleaning procedures may also reduce mycotoxin
concentrations by removing contaminated and damaged kernels (9). According to Abbas et al. (1)
the cleaning step can reduce deoxynivalenol concentrations from 5.5 to 19% from scab infected
wheat. More recently, Lancova et al. (40) achieved an average reduction of 48% in
deoxynivalenol content by sieving, scouring and polishing wheat grain. Pascale et al. (57)
reported a 62% and 53% reduction of T-2 and HT-2, respectively, in wheat after cleaning.
Page 20
11
Although these cleaning procedures may reduce microbial and mycotoxins contamination, the
extent of the reduction is variable and there are no reports on the effectiveness of these cleaning
steps for pathogen reduction. Therefore, kernels may still contain a substantial amount of
contaminants (44).
Tempering. This process involves the addition of water to the clean wheat, primarily to
enhance the efficiency of flour extraction (62). Water is added in precise amounts to reach the
desired moisture level. To ensure even penetration of moisture into the kernels, wheat is held in
large conditioning bins during specific holding periods (7, 62). This is a critical step in milling
operations, since an improper handling can encourage microbial growth either in the wheat or on
the milling equipment. Berghofer et al. (7) found higher mesophilic aerobic counts more
frequently after wheat conditioning. In the same study, E. coli was detected after tempering in
previously non-contaminated wheat. Since the holding periods are relatively short (6-18 hr) and
the water activity of the grain during tempering is not enough to support bacterial growth (7, 62),
the increase in contamination may be more likely to be due the use of poorly cleaned conditioning
bins and equipment. Indeed, Berghofer et al. (7) during an inspection survey in Australian mills,
detected build-up of grain residues in conditioning and storage bins, which may harbor substantial
amounts of microbial contamination. Therefore, attention should be given to sanitary conditions
and cleaning protocols of the equipment involved in the tempering process.
Milling. Once conditioned, wheat undergoes a series of reduction, grinding and sifting
operations to separate the germ and the bran fractions from the endosperm (62). As in cleaning
and tempering, milling processes do not destroy mycotoxins and microorganisms but rather
redistributes and concentrates these contaminants in certain milled fractions, particularly in germ
and bran (1, 57, 64). As wheat passes through break, coarse and fine reduction stages in the mill,
the overall microbial load in the milled products is reduced when compared with that originally
present on the conditioned grain. In an earlier study, Hesseltime (31) showed that the dry-milling
process reduced bacterial counts in 1.3 log CFU/g from that originally present in wheat before
Page 21
12
processing (5.3 log CFU/g); however, fungal counts were relatively unchanged. More recently,
Berghofer et al. (7) reported that maximum aerobic bacterial count decreased from 7.0 to 5.0 log
CFU/g, yeast counts from 6.0 to 3.0 log CFU/g, and mold counts from 6.0 to 4.0 log CFU/g after
fine reduction. In the same study, the bran and germ fractions showed higher microbial counts
than the incoming wheat, with aerobic bacterial count increasing from 6.0 to 7.0 log CFU/g in the
bran portion. In fact, the dry milling process concentrates in excess of 90% of aerobic bacteria
present on wheat into the bran and germ fractions (84).
The physical removal of microorganisms and other contaminants during the early break
stages of the milling process seems to exert the greatest influence over the microbial levels of
milled products, since only small reductions have been observed between the microbial load in
the final reduction stages and the end product (e.g., flour) (7). When the microbial load of milling
end products is compared, flour tends to have lower microbial loads than the initial wheat and
other milled fractions (e.g., germ and bran) (7, 44, 64). This improvement in safety is achieved by
the physical removal of the more heavily contaminated outer parts of the kernel (germ and bran
fractions), that are first colonized by fungi and microorganisms (30, 39, 40, 44). The germ and
bran fractions are less likely to be used for food production; however, whole grain and whole
grain milled products consumption is growing at a remarkable rate due to their known health
benefits (82), representing a unique food safety challenge for the milling and food industry.
Regarding mycotoxins, similar trends in redistributions of deoxynivalenol, aflatoxin, and
zearalenone have been previously documented (1, 21, 56, 96). In general, the levels of
mycotoxins are lower in the flour fraction that in the germ or bran fractions; however, the extent
of the reduction may depend on the variety of wheat, the penetration degree of mycotoxin-
producing molds, transfer of mycotoxins to the inner parts of the kernel, and flour extraction rate
(60).
Therefore, even though the levels of microorganisms and mycotoxins are lower in milled
fractions intended for human consumption (flour or semolina), these fractions can still retain
Page 22
13
unsafe contaminants and represent a potential risk for consumers’ health (7, 64). Furthermore, it
is important to consider that the energy needed to break apart the wheat kernels can generate
considerable amount of heat, hence moisture condensation is likely to occur in the break rolls,
sifters and reduction rolls, which may lead to build-up of flour residues which supports bacterial
growth (7). Thus, the final microbiological quality of wheat flour can be greatly influenced by
these residues if they are not properly controlled.
MICROBIOLOGICAL QUALITY AND SAFETY OF WHEAT FLOUR
The cleaning and grinding procedures have minimal or no direct impact on the level of
contamination present in wheat; therefore, the initial quality of the grain have a strong influence
on the ultimate safety and quality of milling end products. Thus, the majority of microorganisms,
including pathogenic and spoilage microorganisms, and mycotoxins originally present on the
wheat might be expected to be present in the milled products (84).
Spoilage microorganisms. As in the original wheat grain, yeast and mold are among the
common spoilage microorganisms found in flour. A survey by Seiler (79) revealed that the mold
counts in flour (3.7 log CFU/g) were only about 10 times less than in the corresponding wheat
(4.3 log CFU/g). Richter et al. (64) provided a comprehensive microbiological profile for more
than 4,000 commercial wheat flours of four different types collected throughout the United
States. On average, flour samples had counts of 2.1 log CFU/g and 2.9 log CFU/g for yeast and
mold, respectively. More recently, Manthey et al. (44) evaluated the microbiological quality of
219 wheat flour samples produced from the 2001 durum wheat crop in the United States. The
mean yeast-mold counts for these flour samples were 2.2 log CFU/g. A survey by Sperber et al.
(84) analyzed more than 6,500 flour samples from the period 2003 through 2005, which represent
the most recent microbiological profile of North American wheat flour (whole-wheat flour and
durum flour). A mean yeast counts of 1.3 log CFU/g was observed for 6,573 flour samples
analyzed, and a mean mold counts of 2.4 log CFU/g was observed for 6,869 flour samples. The
Page 23
14
maximum count for both microorganisms was 5.9 log CFU/g. A survey by Berghofer et al. (7) in
the late 90s, showed the microbiological status of freshly milled Australian wheat flour. The yeast
and mold counts in the flour samples ranged from 2.0 to 3.0 log CFU/g, being 2.0 log CFU/g the
most frequent count. Eglezos (22) reported higher fungal counts than the previous Australian
survey. The mean count in flour samples were 3.0 log CFU/g and 2.8 log CFU/g for yeast and
mold, respectively. A survey by Aydin et al. (5) found mean mold counts of 2.2 log CFU/g in 142
Turkish flour samples. Total mold counts obtained from retail wheat flour samples in Spain
ranged from 1 to 3.2 log CFU/g (10). Weidenbörner et al. (98) reported total fungal counts of 3.2
and 3.3 log CFU/g in white and whole-grain German flour, respectively. Considerably higher
levels of yeast and mold in the order of 3.7 to 5.3 log CFU/g, respectively, have been reported in
Pakistani flour (88).
In addition to fungi, a wide variety of spoilage bacteria are also present in flour. Seiler
(79) also reported that bacterial count in flour was, on average, 1.9 log CFU/g lower than the
initial level present in the wheat (6.4 log CFU/g). In an earlier study, a mean aerobic bacterial
count of 4.9 log CFU/g was observed in wheat before milling, while the flour had a mean aerobic
bacterial count of 3.6 log CFU/g (65). In the survey carried out by Richter et al. (64), flour
samples presented a mean count of 4.2 log CFU/g for aerobic bacteria. Moreover, Manthey et al.
(44) reported aerobic bacterial counts in the order of 5.7 log CFU/g for durum wheat flour. A
mean aerobic plate count of 3.7 log CFU/g with a maximum of 6.9 log CFU/g were reported in
6,598 flour samples analyzed in North America by Sperber et al. (84). In a recent Australian
survey, Eglezos (22) reported higher aerobic bacterial counts than both the previous Australian
survey and the North American survey, with a mean aerobic bacterial count of 4.2 log CFU/g.
Besides yeast and mold, Berghofer et al. (7) also detected a wide range of other spoilage
microorganisms in freshly milled flour. Aerobic mesophilic and thermophilic bacteria counts
ranged from 1.0 to 7.0 log CFU/g and from 1.0 to 2.0 log CFU/g, respectively. In addition,
Bacillus spp. and mesophilic aerobic spores’ counts ranged from 2.0 to 5.0 log CFU/g and from
Page 24
15
non-detectable to 3.0 log CFU/g, respectively. More recently, in a Turkish study, high levels of
aerobic bacteria were found in 32 of 142 wheat flour samples analyzed (5). The aerobic bacterial
counts in these flour samples ranged from 5.0 to 7.2 log CFU/g. In the same set of samples from
Turkey, rope spore counts ranged from 30 to 4500 MPN/g in 62 flour samples (5).
Pathogenic and fecal microorganisms. Several microbiological surveys of wheat flour
have also indicated the presence of pathogenic and fecal microorganisms, including Escherichia
coli, Salmonella spp., Bacillus cereus and coliforms. A survey carried out during the period 1984
through 1991 in North America revealed that 1.05% of the 4,210 samples of wheat flour analyzed
were contaminated with Salmonella, and 12.8% of the 3,350 samples of wheat flour analyzed
were E. coli positive (64, 84). In contrast, the prevalence of Salmonella in 4,358 samples of wheat
flour analyzed during the period 2003 through 2005 was significantly lower (0.14%) than the
earlier reported incidence in 1984-1991 (84). The same study in 2003-2005 also reported mean
counts of 0.7 log CFU/g for E. coli (petrifilm) in 2,921 samples analyzed, up to a maximum of
3.0 log CFU/g. Berghofer et al. (7) detected E. coli in 1 out of 72 flour sample analyzed at the
level of 9 MPN/g, while in another Australian survey 2 out of 300 flour samples were E. coli
positive (22). However, high levels of contamination with E. coli, 72 out of 142 flour samples
contained more than 9 MNP/g, have been reported in Turkey (5). Victor et al. (55) found E. coli
at levels of 3.8 and 4.1 log CFU/g in white and whole-grain flour, respectively, produced in
Lesotho. A number of coliforms species are also part of the microbial flora found in wheat flour.
In an earlier study, Spicher (85) reported mean coliform count of 2.0 log CFU/g in German flour.
Richter et al. (64) reported mean coliform count of 1.2 MPN/g in 1,477 samples analyzed in the
first comprehensive microbiological survey of North American wheat flour carried out in 1989.
More recently, slightly higher levels of coliform (1.6 MPN/g) have been reported by another
North American (84). Coliform counts reported in Australian flour varied from 1 to 1,000
MPN/g, being the most frequent count 1 MPN/g (7). In a recent study, coliform counts ranged
from 3.0 to 4.0 log CFU/g in Pakistan flour (88). Victor et al. (55) also detected coliforms in
Page 25
16
white and whole-grain flour produced in Lesotho, at levels of 3.4 and 3.7 log CFU/g,
respectively.
Regarding sporeformers, Berghofer et al. (7) reported that 93% of 81 flour samples
analyzed in Australia tested positive for B. cereus, although the most frequent count was 0.1
MPN/g. In the Turkish survey, only 6 out of 142 flour samples contained B. cereus at levels of
more than 2.0 log CFU/g (5). B. cereus was not isolated in any of the flour samples analyzed in
the 2006 Australian survey, and it is not mentioned in the North American surveys. Aydin et al.
(5) was the only report to mention with an occurrence of Clostridium perfringens, in 14 out of
142 flour samples at levels above the detection limit of 2.0 log CFU/g.
Mycotoxin-producing molds and mycotoxins. The mycological profile of retail wheat
flour is somewhat similar among reports found in the literature. Aspergillus and Penicillium
species (storage fungi) have been recorded among the most prevalent ones in wheat flour by
many authors. Riba et al. (63) evaluated the mycoflora of Algerian soft and durum wheat flour,
especially for the presence of Aspergillus strains and its potential for ochratoxin A production.
Results showed that fungi of the genus Aspergillus prevailed (95%) in soft wheat flour, while in
durum flour Penicillium (43%) was as abundant as Aspergillus (57%). High frequency of
ochratoxigenic species of Aspergillus was detected in all flour samples, being A. candidus the
most predominant specie in both soft flour (47%) and durum flour (31%). Similar results were
reported by Weidenbörner et al. (98) in commercial samples of white and whole-grain flour in
Germany. The mycobiota of whole-grain and white flour was dominated by Aspergillus spp.
accounting for 84% and 77.3% of the isolations, respectively. A. candidus was also the most
frequently encountered mold. From the 3,325 isolations, 93.3% belonged to 32 fungal species that
are well known for their mycotoxin producing potential. Likewise, the most common genera
isolated in 50 retail wheat flour samples from Saudi Arabia were Aspergillus (70%) and
Penicillium (30%) (26). Cabañas et al. (10) have also shown that retail wheat flour in Spain have
Aspergillus spp. and Penicillium spp. species as the predominant fungi. The most frequent
Page 26
17
isolated species by this group were A. flavus, A. candidus, A. versicolor, and Penicillum
verrucosum. However, a survey of the fungal and mycotoxin contamination in South African
wheat products revealed that the major fungal contamination was Fusarium spp. (field fungi) and
their related mycotoxins (47). Berghofer et al. (7) compared the fungal genera present on wheat
before and after milling and found that field fungi such as Fusarium, Alternaria, and
Cladosporium were usually detected in lower numbers in milling end products than on incoming
wheat, while the storage fungi Aspergillus and Penicillium prevailed in all milled fractions.
Therefore, mold genera entering the milling system are mostly comprised by storage fungi, which
is consistent with the abovementioned mycological profile of retail wheat flour.
The majority of fungal species encountered on wheat flour are well known for their
mycotoxin producing potential; therefore, improper conditions during wheat flour storage (e.g.,
high moisture levels and temperature) may promote spore germination, mold growth and
mycotoxin production (98). However, mycotoxin contamination in wheat flour generally comes
from infected kernels during the growing season or during storage. The incidence of several
mycotoxins, including DON, ZEA, OTA and T-2 in commercial wheat flour has been reported in
numerous studies. According to a study carried out in southwest Germany (74) in 1998, the
incidence of DON for white flour (n=134) and whole-grain flour (n=77) were 78% and 66%, with
contents ranging from 15 to 624 μg/Kg and from 15 to 1670 μg/Kg, respectively. Likewise, a
follow-up study on the occurrence of DON in 1999 from the same German region showed again
high frequency of occurrence of DON. Almost all (98%) 60 wheat flour samples, characterized
by different ash contents, evaluated showed DON in concentrations ranging from 15 to 1379
μg/Kg (73). Also, it was noticed that the overall degree of toxin contamination tended to be lower
with decreasing ash content. Abdulkadar et al. (2) analyzed 106 food products in Qatar and found
2 wheat flour samples contaminated by DON at levels ranging from 148.22 to 182.94 μg/Kg. In a
survey of the occurrence of mycotoxins in wheat flour collected from the Serbian markets, results
Page 27
18
showed that the most prevalent mycotoxin was DON (86.7%), with an average value of 325
μg/Kg (81).
Concerning the occurrence of ZEA and OTA, it has been shown that their levels are
rarely high. A survey done by Kumagaia et al. (69) analyzed 50 retail wheat flour samples in
Japan, where 28 samples were contaminated with OTA at levels ranging from 0.10 to 0.48 μg/kg.
Nonetheless, Riba et al. (63) detected OTA in one Algerian flour sample at high concentration of
41.55 μg/Kg. Schollenberger et al. (73) encountered ZEA in German flour at levels ranging from
1 to 24 μg/Kg; while Skrbic et al. (81) reported an average value for this toxin of 4.6 μg/Kg in
Serbian flour. A survey of cereal flour (including wheat flour) collected from local stores in
Valencia, Spain revealed that 1 out of 21 samples tested positive for ZEA; however the sample
presented levels below the maximum limit established by the European Commission (19, 20, 59).
T-2 and HT-2 Fusarium toxins have also been detected in wheat flour sold in traditional markets.
Kassim et al. (36) evaluated 15 wheat/wheat powder samples for the presence of T-2 and HT-2
toxins in South Korea, and found T-2 toxin in 3 samples with levels ranging from 65.2 to 431.0
μg/kg, while HT-2 was found at the high level of 355.3 μg/kg. According to these studies, for the
most part consumers worldwide are exposed to low but persistent levels of multiple mycotoxins
in commercial wheat flour. Nevertheless, samples of wheat flour that exceeded the maximum
permitted level for most of these mycotoxins established by regulatory agencies were also
reported.
EFFECTS OF BAKERY AND PASTA PROCESSING ON THE MICROBIOLOGICAL
QUALITY AND SAFETY OF FLOUR-BASED FOODS
The methods commonly used to produce flour-based products generally involve the
application of heat, and includes baking, frying, cooking, steaming and extrusion. However,
nowadays there is an increased use of flour in a non-conventional manner to produce refrigerated
and frozen products, which may not include a validated processing step to ensure safety. For
Page 28
19
those processes that include a thermal treatment, the product achieves temperatures lethal to
vegetative cells, effectively reducing the number of spoilage and pathogenic microorganisms that
may be present. However, bacterial spores of the genus Bacillus or related genera are highly
resistant to thermal destruction, thus they may survive and multiply during the cooling step.
Furthermore, some mycotoxins have proven to be highly stable to heat, thereby also are not
affected by the production processes. Therefore, regarding thermally processed products, in terms
of food safety, both bacterial spores and mycotoxins represent a potential threat to consumers’
health that must be considered.
Bakery processing. The main stages involved in the bread making process are
fermentation, proofing, and baking. The effects of the baking fermentation step on mycotoxin
concentration are rather contradictory, some studies have reported that fermentation of wheat
flour dough reduced detectable levels of DON (40, 70, 75), while others showed an increase or no
change in DON content (6, 38). During dough proofing, some authors reported an increased in
DON levels (95). Regarding baking, DON content in some products like Egyptian flat bread
have shown to be stable, withstanding baking temperatures (23); while the baking of regular
bread provided reductions of 24-71% and a 35% reduction in biscuits and cookies (75).
Kostelanska et al. (38) reported that DON content in the breadcrumbs barely decreases, whereas
degradation of DON content take place mostly in the bread crust as it reaches the highest
temperature. OTA have shown to be stable during bread making, with no apparent reduction (76,
95). However, Subirade (86) demonstrated that baking of biscuits resulted in the destruction or
immobilization of about two-thirds of the toxin. Studies on heat stability have demonstrated that
ZEA can also resist thermal treatments. Cano-Sancho et al. (11) did not find any reduction on
ZEA during bread making, neither after fermentation nor after baking. Although some published
studies indicate a slight reduction in some mycotoxins, the extent of the reduction in the final
product may depend on fermentation and baking temperatures, baking times, loaf size, and the
type of mycotoxin (95). In addition, it is important to consider that mycotoxin concentration in
Page 29
20
the starting flour may be diluted when flour is mixed with other ingredients during processing;
consequently, mycotoxins levels in finished products are usually lower than in the starting flour
(76, 94).
Concerning the microbiological safety of baked products, spore-forming bacteria of the
genus Bacillus or Clostridium are the major organisms responsible for the spoilage (ropiness) and
poisoning of baked goods. Wheat and flour are usually the sources of heat resistant Bacillus
spores (58, 67). Studies have shown that multiplication of vegetative cells of Bacillus spp. does
not occur in the dough before baking (66), although some spores may germinate (25). Heat-
resistant Bacillus spores can survive the baking process, mostly in the center of the crumb, where
the temperature reaches up to 97–101°C for a few minutes (93). During prolonged cooling or
improper storage, favorable conditions to spore germination may develop. When spore
germination occurs, vegetative cells not only cause rope spoilage of bread but also cause food
poisoning through the production of toxins.
Pasta processing. Unlike bakery processing, extrusion employs high heat, high pressure
and mechanical shear simultaneously. It is also notable that the extrusion process for pasta
products may lead to a reduction in some mycotoxins. Several studies have reported reduction in
DON content in pasta or noodles ranging between 40% and 70% (54, 87). Although, Scudamore
et al. (78) reported minimal effect on DON in wheat flour during simple extrusion. Processing
semolina into spaghetti did not significantly alter DON concentrations (44). The addition of
additives may also play a significant role in reduction of mycotoxins during extrusion as 62%
reduction of DON was observed in the presence of sodium bisulfate (3). DON levels may also be
reduced in pasta or noodles during cooking because of leaching into the boiling water, since DON
is water-soluble (54, 87, 97). However, around 53% of DON content was retained in the noodles
after cooking (54). Regarding ZEA, extrusion cooking of wheat flour at 120-140°C resulted in
73-83% reduction of ZEA content, the highest reduction was achieved when shear stress was
applied (68). Both temperature and initial moisture content seems to play an important role in
Page 30
21
reducing OTA content during extrusion cooking of wheat whole-meal, since 11-39% reduction
rate of OTA was achieved at 30% moisture and 116-136°C, while only 8-33% reduction rate
occurred at 17.5% moisture content (77).
The efficacy of extrusion in reducing microbial load when processing semolina into
spaghetti has been evaluated (44). Semolina with a moisture content of 32% was extruded as
spaghetti at 45°C and 25 rpm screw speed, and then the spaghetti was dried at 40°C. The starting
semolina and the dried spaghetti were analyzed for microbial load. Reduction in aerobic
mesophilic bacterial population ranged from 2.2 to 4.1 log CFU/g compared to semolina, whereas
the yeast-mold population was reduced 0.1 to 1.7 log CFU/g from those for semolina. It is
interesting that fungal populations were reduced in a lesser degree than the aerobic mesophilic
bacterial flora, indicating that this group of microorganisms might be more resistant during
spaghetti processing. The presence of these microorganisms in the finished product may lead to
quality and safety problems.
POTENTIAL SAFETY RISKS ASSOCIATED TO FLOUR-BASED FOODS
Although historically regarded as a low-risk commodity for microbial contamination, raw
flour and finished flour-based products have been implicated in foodborne disease outbreaks over
the last few years. In baked or extruded goods, incidents where consumer health has been
compromised are usually related to, but not entirely, germination of bacterial spores that have
survived normal processing conditions. Whereas food-safety incidents associated with ready-to-
bake type products appear to be related to the breach of cooking instructions and consumer eating
habits. In addition to microbiologically related incidents, consumer health has also been
threatened by mycotoxin contamination. Food safety incidents related to mycotoxin involving
baked goods have been previously documented.
Processed and ready-to-eat products. Reports of food poisoning associated with spore-
forming bacteria and involving extruded products have been documented. Bacillus cereus is
Page 31
22
probably the leading cause of illnesses caused by foods of plant origin that have undergone heat
treatments; however, infection with this organism is not commonly reported because of its usually
mild symptoms (28). Nevertheless, a more severe form of the emetic type of foodborne illness
associated with the consumption of spaghetti has been reported (43). More recently, Dierick et al.
(18) described a fatal case of liver failure due to emetic toxin contamination in pasta salad.
Moreover, bakery products have also been implicated in food safety incidents involving
Salmonella spp., but due to transfers from production workers or food handlers rather than
contamination of the product itself (37). Research has shown that, Salmonella spp. can survive for
more than one year in dried pasta, which can represent a potential safety and public health hazard
if the pasta is not properly cooked (117).
Mycotoxin contamination in finished bakery products has been implicated in foodborne
gastroenteritis outbreaks in several countries. Bhat et al. (8) reported an outbreak of
trichothecenes mycotoxicosis in India associated with consumption of bread made from mold
damaged wheat. In China, foods made from wheat highly contaminated with DON and ZEA were
linked to an outbreak that involved 130,000 people with gastrointestinal disorders (41).
Moreover, several publications devoted solely to surveys of mycotoxins in wheat-based products,
especially breakfast cereals, have reported low but persistent levels of multiple mycotoxins in
these products sold directly to the public (46, 47, 69, 91, 99, 110).
Raw or ready-to-bake products. Within this product category are included: refrigerated
cookie, pastry, and biscuit dough; frozen pizzas and pies; cake, brownie and many other bakery
mixes. Unlike processed foods, these ready-to-bake type products have not undergone any
validated kill step during processing to ensure that microbial food safety hazards are minimized.
Therefore, these types of products represent a substantial safety challenge; since they rely on the
consumers to perform the kill step. Moreover, a recent nationwide survey of 1,032 consumers in
the United State revealed that many of them have eaten raw bakery goods or without fully
cooking them as directed by the manufacture (13). The same survey indicated that 58% and 67%
Page 32
23
of consumers, respectively, have tasted refrigerated store-bought cookie dough and raw
homemade dough before they have been baked, and another 11% and 24% admitted to having
eaten pizza dough and biscuit dough before it is fully cooked.
Bacterial contaminants cannot grow and multiply in dry flour because of the small
amount of available water (7). Nevertheless, these microorganisms survive in a dormant state,
retaining their viability and the potential to multiply if flour is incorporated to a more receptive
environment for microbial growth, such as batter or mixes (13, 22). However, some pathogenic
bacteria such as Salmonella spp. and E. coli do not need to grow to cause illness, since they
require only a small number of cells (infective dose) to begin an infection (72). When such risky
eating practices are associated with a potential microbial contamination of raw flour, ready-to-
bake products can serve as a vehicle of serious and life threatening foodborne illness. Indeed, in
recent years, wheat flour has been the ‘‘suspected agent’’ in several food safety incidents.
The first incident where consumer health was compromised due to a flour-based food
occurred in Australia in 1952. Among the ingredients, flour was the suspected carrier agent of
Salmonella, but the organism was not isolated (14). In 2005, 25 people in the United State
became ill with salmonellosis due to cake batter ice cream. In this case, a dry cake mix was the
suspected agent, but flour was not the ingredient of contamination (90). However, The Federal
and Drug Administration issued a warning that dry cake mix should not be considered ready-to-
eat unless has been treated to ensure safety. The first confirmed involvement of flour as a vehicle
for transmission of pathogens occurred in 2008 in New Zealand (22). Sixty-six people became ill
with salmonellosis, of which 8 were hospitalized. The investigation revealed that they had eaten
uncooked flour, raw cake and had licked beaters after mixing batter. Nevertheless, Salmonella is
not the only pathogen that has been related to an outbreak caused by a product containing flour.
The last incident, in 2009, was caused by Shiga toxin-producing Escherichia coli (STEC)
infection. This was the first reported STEC outbreak associated with consumption of ready-to-
bake commercial pre-packaged cookie dough made with wheat flour, where 77 people in the
Page 33
24
United States were sickened (35). The investigation did not conclusively implicate flour, but it
remains the prime suspect for introducing the pathogen to the product. Over 3.6 million packages
of cookie dough had to be withdrawn in this incident (35).
CONCLUDING REMARKS
Wheat from which flour is obtained is a raw agricultural commodity that is subject to
naturally-occurring microbiological threats, therefore it is the primary contamination source for
milled products. Physical processes carried out before and during milling influence the level of
contamination present originally in the wheat. The milling process may reduce the concentration
of mycotoxins and microorganisms in fractions commonly used for human consumption, but has
the drawback of concentrating these contaminants into fractions that are becoming more widely
consumed for their nutritional value, thus creating an emerging food safety challenge. Since none
of the operations carried out during milling includes chemical or thermal treatments to ensure
safety, milling end products should not be considered safe for consumption without further
processing. Microbial contaminants that may have passed into flour during milling can survive in
a dormant state, retaining their viability and the potential to multiply; therefore, foods containing
raw flour (not heat-treated) should be considered as possible vehicles of infection. The thermal
treatments applied to bakery goods or pasta products simultaneously reduces the microbial load
and moisture content, thereby limiting the types of microorganisms that can grow and cause
safety problems. However, minimal impact on mycotoxin levels occurs during such food
processing operations; therefore, many wheat-based foods such as breads, pastas, and breakfast
cereals, may contain at least trace amounts of mycotoxins.
Unlike thermally processed foods, refrigerated dough products can represent a substantial
safety hazard since eating uncooked dough appears to be a popular practice among consumers.
With increased use of flour in refrigerated and frozen products, even the low incidence of
Page 34
25
pathogen contamination in wheat flour should not be ignored; instead, it should warrant the
application of further treatments to make flour safer for human consumption. Relying only on
consumers’ education about the health risks associated with eating bites of raw dough may not
guarantee the absence of food safety incidents. Therefore, even though label statements warn
them against the danger of such risky eating practices, manufacturers should implement the use of
heat-treated flour in ready-to-cook or ready-to-bake products to make them as safe as ready-to-eat
products (35). Moreover, to ensure safety several control procedures should be used to reduce
microbial load and mycotoxins in flour and flour-based products. These include the prevention of
microbial establishment and growth within the mill and throughout the production chain through
proper sanitation of production equipment, stringent temperature control during baking, testing of
incoming wheat and the resulting flour, and hygienic packaging and shipping procedures.
Page 35
26
REFERENCES
1. Abbas HK, Mirocha CJ, Pawlosky RJ and Pusch DJ. 1985. Effect of cleaning, milling, and
baking on deoxynivalenol in wheat. Applied and Environmental Microbiology. 50(2): 482-
486.
2. Abdulkadar, A. H. W., Abdulla, Al-Ali., Al-Kildi, A.M., Jassim, Al-Jedah. 2004.
Mycotoxins in food products available in Qatar. Food Control. 15, 543-548.
3. Accerbi, M.; Rinaldi, V.E.; Ng, P.K. 1999. Utilization of highly deoxynivalenol-
contaminated wheat via extrusion processing. J. Food Prot. 62, 1485-1487.
4. Aydin A, Gunsen U, and Demirel S. 2008. (b) Total aflatoxin, aflatoxin b1 and ochratoxin a
levels in Turkish wheat flour. J Food Drug Anal. 16:48–53.
5. Aydin, A., Pulsen, P., and Smulders, J.M. 2009. (a) The physico-chemical and
microbiological properties of wheat flour in Thrace. Turkish journal of agriculture and
forestry. 33: 445-454.
6. Bergamini, E., Catellani, D., Dall’asta, C., Galaverna, G., Dossena, A., Marchelli, R., et al.
2010. Fate of Fusarium mycotoxins in the cereal product supply chain: the deoxynivalenol
(DON) case within industrial bread-making technology. Food Additives and Contaminants e
Part A Chemistry, Analysis, Control, Exposure and Risk Assessment. 27, 677-687.
7. Berghofer, L.K., Hocking, A.D., Miskelly, D., and Jansson, E. 2003. Microbiology of wheat
and flour milling in Australia. Int. J. Food Microbiology. 85:137-149.
8. Bhat RV, B eedu S R, Ramakrishna Y, Munshi KL. 1989. Outbreak of trichothecenes myco-
toxicosis associated with consumption of mould-damaged wheat production in Kashmir
Valley, India. Lancet. 1:35–37.
9. Bullerman, L. B., & Bianchini, A. 2007. Stability of mycotoxins during food processing.
International Journal of Food Microbiology. 119:140-146.
Page 36
27
10. Cabañas R, Bragulat MR, Abarca ML, et al. 2008. Occurrence of Penicillium verrucosum in
retail wheat flours from the Spanish market. Food Microbiol. 25:642–647.
11. Cano-Sancho G, Sanchis V, Ramos AJ and Marin S. 2013. Effect of food processing on
exposure assessment studies with mycotoxins, Food Addit Contam A 30:867–875.
12. Cheli, F. Luciano, P. Luciana, R. and Vittorio, D. 2013. Effect of milling procedures on
mycotoxin distribution in wheat fractions: A review. LWT - Food Science and Technology
54:307-314.
13. ConAgra Mills. 2001. The raw truth about consumer eating habits. Published online at
www.conagramills.com/media/Food%20Habits%20of%20American%20Consumers%20Fin
al.pdf. ConAgra Mills Consumer Insights, Omaha, NE.
14. Dack, G.M. 1961. Public health significance of flour bacteriology. Cereal Sci. Today 6:9-12.
15. Bullerman, L.B., Bianchini, A. 2009. Food Safety Issues and The Microbiology of Cereals
and Cereals Products. Microbiologically Safe Foods. Chapter 15. John Wiley&Sons.
16. Deibel, K.E., Swanson, K.J. 2001. Cereal and cereal products. Microbiological Examination
of Foods (Ed PF Downes, K), American Public Health Association, Washington DC, pp.
549- 552.
17. Delbrassinne L., et al. 2011. Follow-up of the Bacillus cereus emetic toxin production in
penne pasta under household conditions using liquid chromatography coupled with mass
spectrometry. Food Microbiol. 28:1105–1109.
18. Dierick K, Van Coillie E, Swiecicka I, Meyfroidt G, Devlieger H, Meulemans A,
Hoedemaekers G, Fourie L, Heyndrickx M, Mahillon J. 2005. Fatal family outbreak of
Bacillus cereus-associated food poisoning. J Clin Microbiol 43:4277–9.
19. EC. 2006. Commission Regulation 1881/2006 of 19 December2006 setting maximum levels
for certain contaminants in foodstuffs as regards Fusarium toxins in maize and maize
products. Official Journal of the European Union, L 364, 5-18.
Page 37
28
20. EC. 2007. Commission Regulation 1126/2007 of 28 September 2007 amending regulation
(EC) No. 1881/2006 setting maximum levels for certain contaminants in foodstuffs as
regards Fusarium toxins in maize and maize products. Official Journal of the European
Union, L. 255:14-17.
21. Edwards, S. G., Dickin, E. T., MacDonald, S., Buttler, D., Hazel, C. M., Patel, S., et al.
2011. Distribution of Fusarium mycotoxins in UK wheat mill fractions. Food Additives and
Contaminants Part A e Chemistry Analysis Control Exposure & Risk Assessment. 28:1694-
1704.
22. Eglezos, S. 2010. Microbiological Quality of Wheat Grain and Flour from Two Mills in
Queensland, Australia. Journal of Food Protection. 73:1533-1536.
23. El-Banna AA, Lau PY and Scott PM. 1983. Fate of mycotoxins during processing of food
stuffs. Deoxynivalenol (vomitoxin) during making of Egyptian bread. J. Food Protect.
46:484–486.
24. Eyles, M.J., Moss, R., Hocking, A.D. 1989. The microbiological status of Australian flour
and the effects of milling procedures on the microflora of wheat and flour. Food Australia
704-708 April.
25. Farmiloe, F.J., Cornford, S.J., Coppock, J.B.M. and Ingram, M. 1954. The survival of
Bacillus subtilis spores in the baking of bread. J. Sci. Food Agri. 5:292-304.
26. Gashgari RM, Shebany YM, Gherbawy YA. 2010. Molecular characterization of mycobiota
and aflatoxin contamination of retail wheat flours from Jeddah markets. Foodborne Pathog.
Dis. 7:1047–1054.
27. Gilbert, S., R. Lake, P. Cressey, N. King. 2010. Risk profile: Salmonella in cereal grains.
New Zealand safety authority. Available at:
http://www.foodsafety.govt.nz/elibrary/industry/salmonella-in-cereals.pdf Accessed 1 May
2014.
Page 38
29
28. Granum, P.E., and Lund, T. 1997. Bacillus cereus and its food poisoning toxins. FEMS
Microbiology Letters. 157:223-228.
29. Hart, L.P.; Braselton, W.E., Jr. 1983. Distribution of vomitoxin in dry milled fractions of
wheat infected with Gibberella zeae. J. Agric. Food Chem. 31:657-659.
30. Hemery, Y., Rouau, X., Lullien-Pellerin, V., Barron, C., & Abecassis, J. 2007. Dry processes
to develop wheat fractions and products with enhanced nutritional quality. Journal of Cereal
Science, 46:327-347.
31. Hesseltime, C.W. 1968. Flour and wheat: research on their microbiological flora. Bakers
Dig. 42:40-46.
32. Hocking, A.D. 2003. Microbiological facts and fictions in grain storage. Food Science
Australia. Proceedings of the Australian Postharvest Technical Conference, Canberra.
33. Hussein, H. S., & Brasel, J. M. 2001. Toxicity, metabolism, and impact of mycotoxins on
humans and animals. Toxicology, 167:101-134.
34. International Commission of Microbiological Specification for Foods (ICMSF). 1980.
Cereals and cereal products. In Microbial ecology of foods, Vol. 2, Food commodities. New
York: Academic Press, Inc.
35. K. P. Neil, G. Biggerstaff, J. K. MacDonald, E. Trees, C. Medus, K. A. Musser, S. G.
Stroika, D. Zink, M. J. Sotir. 2012. A Novel Vehicle for Transmission of Escherichia coli
O157:H7 to Humans: Multistate Outbreak of E. coli O157:H7 Infections Associated With
Consumption of Ready-to-Bake Commercial Prepackaged Cookie Dough--United States,
2009. Clinical Infectious Diseases. 54:511-518.
36. Kassim, N., Kim, K., Mtenga, A. B., Song, J.-E., Liu, Q., Shim, W.-B., et al. 2011. A
preliminary study of T-2 and HT-2 toxins in cereals sold in traditional market in South
Korea. Food Control, 22:1408-1412.
37. Kimura, A.C., Palimbo, M.S., Meyers, H., Abbott, S., Rodriguez, R., Werner, S.B. 2005. A
multi-state outbreak of Salmonella serotype Thompson infection from commercially
Page 39
30
distributed bread contaminated by an ill food handler. Epidemiology and Infection, 133:823-
828.
38. Kostelanska, M., Dzuman, Z., Malachova, A., Capouchova, I., Prokinova, E., Skerikova, A.,
et al. 2011. Effects of milling and baking technologies on levels of deoxynivalenol and its
masked form deoxynivalenol-3-glucoside. Journal of Agricultural and Food Chemistry,
59(17):9303-9312
39. Laca, A., Mousia, Z., Diaz, M., Webb, C., and Pandiella, S.S. 2006. Distribution of
microbial contamination within cereal grains. J. Food Eng. 72:332-338.
40. Lancova, K., Hajslova, J., Kostelanska, M., Kohoutkova, J., Nedelnik, J., Moravcova, H., et
al. 2008. Fate of trichothecene mycotoxins during the processing: milling and baking. Food
Additives and Contaminants. 25:650-659.
41. Li F-Q, Luo X-Y, Yoshizawa T. 1999. M ycotoxins (trichothecenes, zearalenone, and
fumon- isins) in cereals associated with human r ed-mold i ntoxications stored since 1989
and 1991 in China. Nat Toxins. 7:93–97.
42. M. Weidenbӧrner, C. Wieczorek, S. Appel, B. Kunz. 2000. Whole wheat and white wheat -
The mycobiota and potential mycotoxins. Food Microbiology, 17: 103-107.
43. Mahler, H., A. Pasi, J. M. Kramer, P. Schulte, A.C. Scoging, W. Bar, and S. Krahenbuhl.
1997. Fulminant liver failure in association with the emetic toxin of Bacillus cereus. N. Engl.
J. Med. 336:1142-1148.
44. Manthey, F.A., Wolf-Hall, C. E., Yalla, S., Viajayakumar, C., and Carlson, D. 2004.
Microbial loads, mycotoxins, and quality of durum wheat from the 2001 harvest of the North
Plains region of the United States. J. Food Prot. 67:772-780.
45. Maria Florencia Fangio, Sara Ines Roura, and Rosal´Ia Fritz. 2010. Isolation and
Identification of Bacillus spp. and Related Genera from Different Starchy Foods. Journal of
food science, 75:218-221.
Page 40
31
46. Martins ML, Martins HM. 2001. Determination of deoxynivalenol in wheat-based breakfast
cereals marketed in Portugal. Journal of Food Protection 64:1848–1850.
47. Mashinini K, Dutton MF. 2006. The incidence of fungi and mycotoxins in South Africa
wheat and wheat-based products. J Environ Sci Health B. 41(3):285-296.
48. Peles F., . Gy ri, T. B cskai, s. Szab , M. Murvai, B. Kovács. 2012. Microbiological
quality of organic wheat grains and sprouts. Institute of Food Science, Quality Assurance
and Microbiology, University of Debrecen, Böszörményi. 18:53-60.
49. Miller, J.D. 1995. Fungi and mycotoxins in grains: implications for stored product research.
J. Stored Prod. Res. 31:1-16.
50. Naranjo, M., S. Denayer, N. Botteldoorn, L. Delbrassinne, J. Veys, J. Waegenaere, N.
Sirtaine, R.B. Driesen, K.R. Sipido, J. Mahaillon and K. Dierick. 2011. Sudden Death of a
Young Adult Associated with Bacillus cereus Food Poisoning. J. Clin. Microbiol. 49:12
4379-4381.
51. Naresh Magan, David Aldred, Kalliopi Mylona and Ronald J.W. Lambert. 2010. Limiting
mycotoxins in stored wheat. Food Additives and Contaminants. Vol. 27, No. 5. 644–650.
52. New Zealand Food and Safety Authority. 2008. Flour batch believed linked to Salmonella
outbreak. New Zealand Food and Safety Authority press release. Available at:
http://foodsafety.govt.nz/elibrary/industry/Flour_Batch-Investigations_Into.htm. Accessed 7
May 2014.
53. Nishio, Z., Takata, Kanenori., Ito, M., Tanio, M., Yamauchi, H., Tabiki, T., Ban, T. 2010.
Deoxynivalenol distribution in flour and bran of spring wheat lines with different levels of
Fusarium head blight resistance. Plant Dis. 94:335–338.
54. Nowicki, T.W., Gaba, D.G., Dexter, J.E., Matsuo, R.R., Clear, R.M. 1988. Retention of the
Fusarium mycotoxin deoxynivalenol in wheat during processing and cooking of spaghetti
and noodles. Cereal Chem 8:189–202.
Page 41
32
55. Ntuli Victor*, Mekibib Sissay Bekele, Molebatsi Ntseliseng, Makotoko Makotoko, Chatanga
Peter, Asita .O. Asita. 2013. Microbial and Physicochemical Characterization of Maize and
Wheat Flour from a Milling Company, Lesotho. Internet Journal of Food Safety. 15:11-19.
56. Park DL. Effect of processing on aflatoxin. 2002. Advances in Experimental Medicine and
Biology. 504: 173-179.
57. Pascale, M., Haidukowski, M., Lattanzio, V. M. T., Silvestri, M., Ranieri, R., & Visconti, A.
2011. Distribution of T-2 and HT-2 toxins in milling fractions of durum wheat. Journal of
Food Protection, 74:1700-1707.
58. Pepe, O., Blaiotta, G., Moschetti, G., Greco, T., Villani, F. 2003. Rope-producing strains of
Bacillus spp. from wheat bread and strategy for their control by lactic acid bacteria. Applied
and Environmental Microbiology. 69:2321–2329.
59. Pérez-Torrado, E., Blesa, J., Moltó, J. C., & Font, G. 2010. Pressurized liquid extraction
followed by liquid chromatographyemass spectrometry for determination of zearalenone in
cereal flours. Food Control. 21:399-402.
60. Pinson-Gadais, L., Barreau, C., Chaurand, M., Gregoire, S., Monmarson, M., & Richard-
Forget, F. 2007. Distribution of toxigenic Fusarium spp. and mycotoxin production in
milling fractions of durum wheat. Food Additives and Contaminants. 24:53-62.
61. Pitt, J.I. and Hocking, A.D. 1997. Fungi and Food Spoilage. Blackie Academic Press,
Sydney.
62. Posner, E.S., and Hibbs, A.N. 1997. Wheat Flour Milling. AACC International, St. Paul,
MN.
63. Riba, A., Mokrane, S., Mathieu, F., Lebrihi, A., and Sabaou. N. 2008. Mycoflora and
ochratoxin A producing strains of Aspergillus in Algerian wheat. International Journal of
Food Microbiology. 122:85–92.
64. Richter KS, Dorneanu E, Eskridge KM, Rao C. 1993. Microbiological quality of flours.
Cereal Foods World. 38:367–369.
Page 42
33
65. Rogers, R.F., and C.W. Hesseltine. 1978. Microflora of wheat and wheat flour from six areas
of the United States. Cereal. Chem. 55(6): 889-898.
66. Rosenkvist, H. and Hansen, A. (b) 1993. Quality problems in bread caused by Bacillus spp.
In: T. Aalto-Kaarlehto and H. Salovara (Eds.), Proceedings of the 25th Nordic Cereal
Congress, Finnish Society of Cereal Technology, Helsinki, pp. 146-150.
67. Rosenkvist, H., Hansen, A. 1995. Contamination profiles and characterisation of Bacillus
species in wheat bread and raw materials for bread production. International Journal of Food
Microbiology. 26:353–363.
68. Ryu D, Hanna MA, Bullerman LB. 1999. Stability of zearalenone during extrusion of corn
grits. Journal of Food Protection. 62:1482–1484.
69. S. Kumagaia, M. Nakajimab, S. Tabatac, E. Ishikurod, T. Tanakae, H. Norizukif, Y. Itohg,
K. Aoyamad,K. Fujitag, S. Kaih, T. Satoi, S. Saitoa, N. Yoshiikej and Y. Sugita-Konishik.
2008. Aflatoxin and ochratoxin A contamination of retail foods and intake of these
mycotoxins in Japan. Food Additives and Contaminants. 25:1101–1106.
70. Samar, M. M., Neira, M. S., Resnik, S. L., & Pacin, A. 2001. Effect of fermentation on
naturally occurring deoxynivalenol (DON) in Argentinean bread processing technology.
Food Additives and Contaminants. 18:1004-1010.
71. Samson, R.A., Hoekstra, E.S., Frisvad, J.C. and Filtenborg, O. 1996. Introduction to Food
Borne Fungi. CBS, Delft, The Netherlands.
72. Schmid-Hempel, P., Frank, S.A. 2007. Pathogenesis, Virulence, and Infective Dose. PLoS
Pathog 3:1372-1373.
73. Schollenberger, M., Jara, H. T., Suchy, S., Drochner, W., & Müller, H.-M. 2002 (b).
Fusarium toxins in wheat flour collected in an area in southwest Germany. International
Journal of Food Microbiology. 72:85-89.
Page 43
34
74. Schollenberger, M., Suchy, S., Jara, H. T., Drochener, W., & Müller, H. M. 1999. A survey
of Fusarium toxins in cereal-based foods marketed in an area of southwest Germany.
Mycopathologia. 147:49-57.
75. Scott PM. 1991. Possibilities of reduction or elimination of mycotoxins present in cereal
grains. In: Chelkowski J, editor. Cereal grain: Mycotoxin, fungi and quality in drying and
storage. New York: Elsevier. 529–72.
76. Scudamore KA, Banks J and MacDonald SJ. 2003. Fate of ochratoxin A in the processing of
whole wheat grains during milling and bread production. Food Additives and Contaminants.
20:1153–1163.
77. Scudamore KA, Banks JN, Guy RCE. (c) 2004. Fate of ochratoxin A in the processing of
whole wheat grain during extrusion. Food Additives and Contaminants. 21:488–497.
78. Scudamore KA, Guy RC, Kelleher B and McDonald SJ. (b) 2008. Fate of the Fusarium
mycotoxins, deoxynivalenol, nivalenol and zearalenone, during extrusion of wholemeal
wheat grain. Food Addit. Contam. 25:331–337.
79. Seiler, D.A. 1986. The microbial content of wheat and flour. In B. Flannigan (ed),
Proceedings of the spring meeting of the Biodeterioration Society on spoilage and
mycotoxins of cereals and other stored products. C.A.B. International, Slough, UK. p. 35-40.
80. Setamou M, Cardwell KF, Schulthess F, Hell K. 1997. Aspergillus flavus Infection and
Aflatoxin Contamination of Pre-harvest Maize in Benin. APSnet. 81:1323-1327.
81. Skrbic, B., Zivancev, J., Durisic-Mladenovic, N., Godula, M. 2012. Principal mycotoxins in
wheat flour from the Serbian market: Levels and assessment of the exposure by wheat-based
products. Food Control. 25:389-396.
82. Sloan, A.E. 2011. Consumer Trends: Consumers go with the grain. Food Technology 65:12,
35-42.
Page 44
35
83. Sorokulova IB, Reva ON, Smirnov VV, Pinchuk IV, Lapa SV, Urdaci MC. 2003. Genetic
diversity and involvement in bread spoilage of Bacillus strains isolated from flour and ropy
bread. Lett Appl Microbiol 37:169–73
84. Sperber WH. 2007. Role of microbiological guidelines in the production and commercial use
of milled cereal grains: a practical approach for the 21st century. Journal of Food Protection.
70:1041–53.
85. Spicher, G., 1986. Merkpunkte fu r die Beurteilung der mikrobiolo- gisch-hygienischen
ualita t von Weisenmehlen ( udging the microbiological-hygienic quality of white flour).
Die Mu hle Mischfuttertechnik 33: 449.
86. Subirade, I. 1996. Fate of ochratoxin A during breadmaking. Food Addit Contam 13:25–26.
87. Sugita-Konishi, Y., Park, B.J., Kobayashi-Hattori, K., Tanaka, T., Chonan, T., Yoshikawa K
et al. 2006. Effect of cooking process on the deoxynivalenol content and its subsequent
cytotoxicity in wheat products. Biosci Biotechnol Biochem 70:1764–1768.
88. Syeda A.B., Naseem R., S.S.Tahir, Razia K. 2012. Microbial and Physico-chemical
contamination in the wheat flour of the twin cities of Pakistan. Internet Journal of Food
Safety. 14, 75-82.
89. Thompson JM, Waites WM, Dodd CER. 1998. Detection of rope spoilage in bread caused
by Bacillus species. J Appl Microbiol 85:481–6.
90. U.S. Food & Drug Administration. 2005. Bulletin to the Food Service and Retail Food Store
Industry Regarding Cake Batter Ice Cream and Similar Products.
91. V Roscoe, G A Lombaert, V Huzel, G Neumann, J Melietio, D Kitchen, S Kotello, T
Krakalovich, R Trelka, P M Scott. 2008. Mycotoxins in breakfast cereals from the Canadian
retail market: a 3-year survey. Food Additives and Contaminants. 25(3): 347–355.
92. Valentino Palpacelli, Luca Beco, and Maurizio Ciani. 2007. Vomitoxin and Zearalenone
Content of Soft Wheat Flour Milled by Different Methods. Journal of Food Protection.
70:509–513.
Page 45
36
93. Valerio, F., De Bellis, P., Di Biase, M., Lonigro, S.L., Giussani, B., Visconti, A. 2012.
Diversity of spore-forming bacteria and identification of Bacillus amyloliquefaciens as a
species frequently associated with the ropy spoilage of bread. International Journal of Food
Microbiology. 156:278–285.
94. Vidal, A. (b), Marin, S., Morales, H., Ramos, A.J., Sanchis, V. 2014. The fate of
deoxynivalenol and ochratoxin A during the breadmaking process, effects of sourdough use
and bran content. Food and Chemical Toxicology. 68: 53–60.
95. Vidal, A., Morales, H., Sanchis, V., Ramos, A., Marin, S. 2014. Stability of DON and OTA
during the breadmaking process and determination of process and performance criteria. Food
Control. 40:234-242.
96. Visconti, A., & Pascale, M. 2010. An overview on Fusarium mycotoxins in the durum wheat
pasta production chain. Cereal Chemistry. 87:21-27.
97. Visconti, A., Haidukowski, E. M., Pascale, M., & Silvestri, M. 2004. Reduction of
deoxynivalenol during durum wheat processing and spaghetti cooking. Toxicology Letters.
153:181-189.
98. Weidenbörner, M., Wieczorek, C., Appel, S., Kunz, B. 2000. Whole wheat and white wheat
flour—the mycobiota and potential mycotoxins. Food Microbiology. 17:103–107.
99. Yazdanpanah, H. Zarghi, A. Shafaati, A.R., Foroutan, S.M., Aboul-Fathi, F. Khoddam, A.
and Nazari, F. 2012. Exposure Assessment of the Tehran Population (Iran) to Zearalenone
Mycotoxin. Iranian Journal of Pharmaceutical Research. 11:251-256.
100. Zhang G, Ma L, Patel N, Swaminathan B, Wedel S, Doyle MP. 2007. Isolation of
Salmonella typhimurium from outbreak-associated cake mix. Journal of Food Protection.
70:997–1001.
101. Neal, G. 2009. An outbreak of human salmonella caused by flour. Proceedings of the
Sixteenth Australian HACCP Conference, 24 to 28 August, Sydney, Australia.
Page 46
37
102. Bennett RW, Belay N. 2001. Bacillus cereus. In: Microbiological Examination of Foods,
(Eds. PF Downes, K Ito), American Public Health Association, Washington DC, pp. 311-
324.
103. Doyle, M. and Buchanan, R. 2013. Food Microbiology: Fundamentals and Frontiers.
Washington, DC: ASM Press, c2013
104. Birck, N., Lorini, I., Scussel, V. Fungus and mycotoxins in wheat grain at post harvest.
105. Bensassi, F., Mahdi, C., Bacha, H., Hajlaoui, M.R. 2011. Survey of the mycobiota of freshly
harvested wheat grains in the main production areas of Tunisia. African Journal of Food
Science. 5:292-298.
106. Youssef, O., Masril, S.A., Youssef, H., Nehlawi, A. 2012. Primary study of mycobiota
contaminating wheat grains during storage period. Journal of King Abdulaziz University.
1(23). 157
107. Gallo, G., Lo Bianco, M., Bognanni, R., & Saimbene, G. 2008. Mycotoxins in durum Wheat
grain: Hygienic-health quality of sicilian production. Journal of Food Science, 73, T42–T47.
108. Jelinek, C., Pohland, A., & Wood, G. 1989. Worldwide occurrence of mycotoxins in foods
and feeds an update. Journal of the Association of Official Analytical Chemists. 72:223–230.
109. Bento, J. M. V., Pena, A., Lino, C. M., & Pereira, J. A. 2009. Determination of ochratoxin A
content in wheat bread collected from the Algarve and Bragance regions, Portugal: Winter
2007. Microchemical Journal. 91:165–169.
110. Muller, H. M., and Schwadorf, K. 1993. A survey of the natural occurrence of Fusarium
toxins in wheat grown in south east of Germany. Mycopathologia. 121:115–121.
111. Muthomi, . W., Ndung’u, . K., Gathumbi, . K., Mutitui, E. W., and Wagacha, . M. 2008.
The occurrence of Fusarium species and mycotoxins in Kenyan wheat. Crop Protection.
27:1215–1219.
Page 47
38
112. Juan, C., Pena, A., Lino, C., Moltó, J. C., and Mañes, J. 2008. Levels of ochratoxin A in
wheat and maize bread from the central zone of Portugal. International Journal of Food
Microbiology. 127:284–289.
113. Chandelier, A.; Nimal, C.; André, F.; Planchon, V.; Oger, R. 2011. Fusarium species and
DON contamination associated with head blight in winter wheat over a 7-year period 92003–
2009) in Belgium. Eur. J. Plant Pathol. 130:403–414.
114. Kriss, A.B.; Paul, P.A.; Madden, L.V. 2010. Relationship between yearly fluctuations in
Fusarium head blight intensity and environmental variables: A window-pane analysis.
Phytopathology. 100:784–797.
115. Desjardins, A.E. 2006. Fusarium Mycotoxins. Chemistry, Genetics, and Biology; American
Phytopathological Society: St. Paul, MN, USA.
116. Rayman, M.K., J-Y. D´Aoust, B. Aris, C. Maishment, and R. Wasik. 1979. Survival of
microorganisms in stored pasta. Journal of Food Protection. 42:330-334.
Page 48
39
EFFECTS OF WEATHER VARIABLES ON THE MICROBIOLOGICAL QUALITY
OF HARD RED WINTER WHEAT *
L. Sabillón, J. Stratton, and A. Bianchini
Department of Food Science and Technology
University of Nebraska – Lincoln, Lincoln, NE, USA
Corresponding author:
Andréia Bianchini, Department of Food Science and Technology
The Food Processing Center, University of Nebraska – Lincoln
University of Nebraska – Lincoln, Lincoln, NE, USA
Phone: (402) 472-3114, Fax: (402) 472-1693
[email protected]
* Scientific manuscript formatted to meet guidelines for the Journal of Food Protection
Page 49
40
ABSTRACT
The meteorological conditions in farm fields during grain ripening have shown to have a
strong influence on microbial development in wheat grain. In this study the effects of weather
variables on the microbiological quality of wheat grain were evaluated over two consecutive
seasons in the state of Nebraska, USA. Three hard red winter wheat cultivars were planted in
three meteorologically contrasting regions to ensure developing seeds were exposed to different
weather conditions. The natural microbial flora, mycotoxin, moisture content, and water activity
of 54 freshly harvested wheat samples were analyzed and correlated with the weather conditions
that prevailed from flowering to harvesting. In both growing seasons, localized areas of high
rainfall occurred in the Southeastern district, while low precipitation rates were registered in the
Panhandle district. There was considerable variation in the microbial load of the wheat harvested
as the planting site moved from the western to the eastern part of the state. For the 2012 season,
Aerobic plate count (APC), Enterobacteriaceae counts (Eb), yeast and mold counts, and internal
mold infection (IMI) were lowest in grain samples collected from Panhandle and highest in grain
from the South Central and Southeastern districts. For the 2013 season, there were no significant
differences in the yeast counts found in grain collected from different districts, but levels of IMI
and mold counts differed significantly between samples from the Southeastern district and the
Panhandle district. Deoxynivalenol (DON) was detected in all districts, however, in very low
concentrations. Among the climatic variables, relative humidity positively correlated with APC,
Eb, yeasts, molds, and IMI. Molds counts were also positively correlated with mean minimum
temperatures. A strong positive correlation was found between precipitation levels and the
moisture content of the grain. In general, microbial load in wheat grain tended to decrease in
those areas with lower relative humidity and lower maximum temperatures.
Page 50
41
INTRODUCTION
The prevailing environmental conditions during the growing season not only determine
how quickly or slowly the wheat plant develops but also the amount and type of microbial flora
that might be present. Once the grain head emerges from the flag leaf sheath, it is exposed to
multiple sources of contamination, including air, dust, water, insects, and animal feces; therefore,
there is ample opportunity for microbes to colonize the developing grain. Thus, wheat grain may
harbor a large and varied microflora that includes bacteria, yeasts, and molds (3, 5).
The availability of water is one of the most important factors driving the dynamics of
these microbial populations. Therefore, weather may influence the rate of microbial colonization
of grain. Under favorable conditions, bacteria begin to colonize the ripening grain, closely
followed by yeasts and filamentous fungi (12). However, the colonization of grain by individual
groups of microorganisms is highly variable and depends on the prevailing climatic conditions.
Thus, the dominant species in warmer climates may differ from those in colder climates (12).
Weather related variables, such as daily average relative humidity and total daily precipitation
have been positively correlated with mold infection and mycotoxin production (7, 11, 14). The
intensity of fungal diseases in wheat, such as Fusarium head blight (FHB) produced primarily by
Fusarium graminearum Schwabe, is mainly determined by meteorological conditions (8, 19, 28).
Indeed, particular weather conditions have been associated with some phases of the FHB disease
cycle. For instance, maturation of perithecia in infested wheat is favored by prolonged periods of
warm temperatures and high moisture or relative humidity (9, 10). In addition, the formation and
density of ascospores on wheat spikes has been associated with high rain intensity and moderate
warm temperatures (19). Besides the economic importance of FHB and other fungal diseases,
colonization of the wheat spikes by fungal species also represents a food safety concern due to the
production of mycotoxins. Moreover, statistical correlations between patterns of solar activity and
microbiological quality of cereals have been reported (17). Weather patterns in the winter wheat-
Page 51
42
producing regions in the High Plains of the United States have experienced cycles of drought and
flooding, and extreme temperatures over the last decades. These fluctuations in environmental
factors have likely made a significant impact on the amount and type of microflora associated
with harvested wheat crops (24, 25).
There is a substantial amount of research that has associated specific environmental
conditions in farm fields with fungal diseases development in wheat. However, much less effort
have been directed towards evaluating the relationship between weather variables and overall
microbiological quality of wheat grain. To fill this knowledge gap, the climatic conditions
prevailing from flowering to harvesting of three winter wheat cultivars (Triticum aestivum L.) at
three locations along a west-east transect of the state of Nebraska, USA, were evaluated to
determine its impact on microbial load, mycotoxin, moisture content, and water activity of
harvested wheat grain. In addition, the environmental variables most associated with annual
fluctuation of microbial load in wheat were determined.
MATERIALS AND METHODS
Winter wheat variety trial locations. The University of Nebraska – Lincoln divides the
state of Nebraska into five districts for the purpose of wheat variety testing (Fig. 1). The trials
described in this study were conducted in the southeastern and western part of the state, since
weather conditions change significantly from east to west. Three hard red winter wheat cultivars,
two commercial lines (Overland and McGill) and one experimental line (NW07505), were
planted in the Southeast district at Saunders County, South Central district at Clay Center County,
and Panhandle district at Box Butte County, during two growing seasons, 2011-2012 and 2012-
2013. Wheat cultivars were planted in a single day at each location, but planting dates varied
among districts (Table 1). The sowing followed a randomized complete block design with three
replications. Each plot was 15 ft x 35 ft with six rows. Plants were grown under rainfed
conditions and the plots were well fertilized before sowing.
Page 52
43
FIGURE 1. Winter wheat-producing
districts in the State of Nebraska, United
States. ● Study locations.
Sample collection. Wheat samples were collected over the 2011-2012 and 2012-2013
growing seasons. The Department of Agronomy and Horticulture at University of Nebraska-
Lincoln, NE, USA, randomly collected samples (~2.0 kg) directly from the planting site during
harvest, reflecting the condition of the grain at the point of origin. Wheat cultivars were harvested
in a single day at each location, but harvesting dates varied among districts (Table 1). Three
samples were collected for each wheat cultivar, with a total of 9 samples collected during harvest
from each district. In total, 27 samples for each growing season were collected.
Meteorological data. Climate data throughout each growing season were obtained from
the Automated Weather Data Network (AWDN) of the High Plains Regional Climate Center
(HPRCC) for each location. Weather variables monitored included maximum and minimum daily
air temperature, daily total precipitation, and daily relative humidity. In this study, only the
weather conditions prevailing from flowering to harvesting were considered, since it is when the
grain is exposed to the environment.
The flowering dates of the winter wheat cultivars were estimated based on the amount of
heat energy that plants had received over the growing season, known as growing degree days
(GDD) concept. The lower developmental threshold or base temperature and upper temperature
threshold were set to 32°F and 86°F, respectively (16). The starting point for the accumulation of
GDD was the seeding date. The basic equation used was:
Page 53
44
GDD = Σ [(daily maximum temperature + daily minimum temperature)/2] – base temperature
Because wheat does not grow significantly when temperatures are below freezing, GDD
was considered to be zero if (daily maximum temperature + daily minimum temperature)/2 was
less than 32ºF. In addition, if (daily maximum temperature + daily minimum temperature)/2 was
greater than 86°F, GDD was considered to be equal to 86°F, the upper temperature threshold.
Moisture and water activity analysis. The moisture content of all wheat samples was
determined using the Approved Method 44-15A (AACC International 2002), and the water
activity was measured using an Aqualab® S-3 TE water activity meter (Decagon, Pullman,
Washington, USA).
Microbial and mycotoxin analysis. Microbial and mycotoxin analysis were conducted
on all samples collected in both growing seasons. Wheat samples were analyzed for mesophilic
aerobic bacteria (Aerobic Plate Count; APC), yeasts, molds, coliform, generic E. coli, and
Enterobacteriaceae (Eb). In addition, samples were also examined for the presence of Salmonella
spp. and E. coli O157:H7. Both APC and yeast/mold counts were determined by the spread
plating technique according to standard methods described in the U.S. Food and Drug
Administration’s Bacteriological Analytical Manual (15, 26). The aerobic bacteria plates were
incubated at 35 C for 48 h, and the yeast/mold plates were incubated at 25 C in the dark for 5
days. Coliform/E. coli and Enterobacteriaceae counts were determined according to AOAC
official methods 991.14 and 2003.01, respectively, using Petrifilm™ (3M Microbiology, St. Paul,
MN). For Salmonella spp., samples were inoculated in enrichment medium (Buffered Peptone
Water) and incubated at 37 C for 24 h. After incubation, 1 ml of sample was transferred to 9 ml
of selective enrichment medium (Tetrathionate Broth, Acumedia) and incubated at 41 C for 24 h.
For E. coli O157:H7, samples were directly inoculated in selective enrichment medium (Modified
Tryptone Soya Broth with Novobiocin, Acumedia) and incubated at 37 C for 24 h. The presence
or absence of Salmonella spp. and E. coli O157:H7 was determined using RapidChek™ (Romer
Page 54
45
Labs) and Neogen Reveal™ (Neogen Corporation, Lansing, MI) lateral flow ELISA tests,
respectively. Internal Mold Infection (IMI) and Internal Fusarium Infection (IFI) were
determined by first randomly selecting 50 kernels from each sample, which were then surface
disinfected and aseptically plated as described by Manthey et al. (13), with the exception that
dichloran rose bengal chloramphenicol (DRBC) agar and czapek-dox iprodione dichloran (CZID)
agar were used to determine IMI and IFI, respectively. Plates were incubated for 5 days, without
light at room temperature. Deoxynivalenol (DON) concentration was determined using Neogen
Veratox® 2/3 (Neogen Corporation, Lansing, MI) competitive direct ELISA test, following the
USDA-GIPSA method for sample preparation and extraction (27).
Data analysis. Data was analyzed using the Statistical Analysis System SAS; (version
9.3, SAS Institute, Cary, NC, USA) where a general linear model of variance at the 5% level
followed by Tukey’s test was used to determine significant differences between cultivars,
microbial load, and growing seasons. The correlation between weather variables and microbial
load was determined based on Pearson’s correlation coefficients, which were also obtained using
SAS.
RESULTS AND DISCUSSION
There was a large variation in environmental conditions between the two growing
seasons. Warmer than normal temperatures and low precipitation rates occurred during the 2011-
2012 growing season, leading plants to develop at a greater rate and reach maturity 20-21 days
earlier in 2012 as compared with 2013 (Tables 1 and 2). In contrast, the 2012-2013 growing
season was dominated by moist and cool conditions, which resulted in a longer growing period
and disease incidence above normal. The comparison between the precipitation levels between
districts and growing seasons is illustrated in Figure 2. Despite weather differences between
growing seasons, both years show localized areas of high rainfall in the Southeastern district,
while lower precipitation rates were confined to the Panhandle district.
Page 55
46
TABLE 1. Name, latitude, and longitude of study locations, and sowing, flowering and harvesting dates during both growing seasons at each
location.
Farm Location Season 2011-2012 Season 2012-2013
District Location a Longitude Latitude Sowing Flowering Harvesting Sowing Flowering Harvesting
Southeast Ithica 41.161 -96.414 Sept 26
th,
2011
May 17th,
2012
June 28th,
2012
Sept 25th,
2012
June 18th,
2013
July 18th,
2013
South
Central Harvard 40.576 -98.134
Sept 23th,
2011
May 17th,
2012
June 22th,
2012
Sept 19th,
2012
June 14th,
2013
July 09th,
2013
Panhandle Hemingford 42.249 -103.01 Sept 20
th,
2011
June 10th,
2012
July 04th,
2012
Sept 17th,
2012
June 25th,
2013
July 23th,
2013 a Ithica, NE (UNL ARDC) located in Saunders county; Harvard, NE (South Central Res. & Ext. Center) located in Clay Center county;
Hemingford, NE (Cullan Farms) located in Box Butte county.
Page 56
47
Phenological changes in wheat plants are governed mainly by temperature (29), thus
plant growth and flowering depend on the accumulated temperature over the growing season (20).
The accumulated GDD were used to estimate the date of the flowering stage of winter wheat
cultivars according to the Zadoks scale (30). Previous studies that evaluated the amount of energy
that wheat requires to progress through the different growth stages in the High Plains region have
determine that from planting to flowering (Zadoks stage 69) approximately 3200 GDD are
required (16). Therefore, the date of wheat flowering was estimated for each field by assuming
that cultivars have the same base temperature for growth and development, and that growth
response to temperature was the same among cultivars (Table 1).
The flowering date of winter wheat is mainly a function of spring temperatures but may
also be affected by other environmental conditions (29). Earlier than usual flowering dates were
observed in 2012 due to warmer temperatures and wetter conditions during spring and summer in
the region (Table 1 and 2). In addition to differences observed on amount of rainfall amount
between both growing seasons, the distribution of the rainfall throughout the growing season was
also different between years. Higher precipitation levels from wheat flowering to harvesting were
observed in the 2011-2012 season, with about 10 to 33 percent of the total rainfall occurring
during this period (Table 2). In contrast, only 3 to 7 percent of the total rainfall occurred in the
same period during the 2012-2013 season. However, lower mean temperatures and lower relative
humidity from wheat flowering to harvesting were registered in the 2011-2012 season when
compared with the 2012-2013 season.
Page 57
48
FIGURE 2. 2011-2012 (a) and 2012-2013 (b) growing season precipitation levels (in) for
Nebraska. ● Study locations.
Southeast
South Central
Panhandle
Southeast
South Central
Panhandle
(a)
(b)
Page 58
49
TABLE 2. Average high and low temperature (T-Max, T-Min), relative humidity (RH), and total
precipitation (Precip) distribution during the two growing seasons at each district.
Season District
Throughout the Growing Season From Flowering to Harvest
Precip
(in)
T-Max
(°F)
T-Min
(°F)
RH
(%)
Precip
(in)
T-Max
(°F)
T-Min
(°F)
RH
(%)
2011-
2012
Southeast 14.79 60.69 34.45 64.24
4.87 83.86 58.24 60.92
South Central 12.87 60.99 33.19 65.75
3.95 83.45 56.71 61.51
Panhandle 7.34 60.19 28.92 54.96
0.75 91.12 56.00 42.96
2012-
2013
Southeast 17.80 56.59 32.85 69.99 1.28 87.74 64.53 66.67
South Central 16.50 56.61 31.37 69.42
0.53 88.42 63.34 62.93
Panhandle 8.48 57.91 28.36 61.04 0.49 88.67 56.69 55.45
Table 3 summarizes the microbial analysis of winter wheat samples for the 2011-2012
growing season. According to the results, there was considerable variation in the microbial load
of the wheat as the planting site moved from the western to the eastern part of the state. Mean
TPC, Eb, yeasts, molds, and IMI were lowest in grain samples collected from Panhandle and
highest in grain collected from the South Central and Southeastern districts. Coliform and E. coli
were not detected in samples collected from the Panhandle district, but low levels were found in
samples from the Southeastern and South Central districts. Salmonella spp. and E. coli O157:H7
were not detected in any of the samples analyzed. Levels of IFI did not differ among districts.
In general, there was no statistical difference in the microbial load found among cultivars
in each location, indicating that microbiological quality is more dependent on weather conditions
than wheat varieties. Local weather conditions prevailing from flowering to harvesting in South
Central and Southeastern districts were characterized by high precipitation levels, high relative
humidity and cooler temperatures. In contrast, post-flowering weather conditions in Panhandle
districts were dominated by low precipitation rates and relative humidity, and warmer
temperatures. Mean relative humidity during the post-flowering period in South Central and
Southeastern districts was approximately 61% compared with 43% in Panhandle district (Table
2).
Page 59
50
TABLE 3. Mean and standard deviation (SD) for microbial counts in winter wheat samples from the 2011-2012 growing season a
District Cultivar APC Coliform/E. coli Eb Yeasts Molds IMI IFI
Mean (SD) Mean (SD) Mean (SD) Mean (SD) Mean (SD) Mean (SD) Mean (SD)
Southeast
Overland 5.64 (0.09) Ab ND (ND) B 4.31 (0.15) B 4.08 (0.02) B 3.33 (0.17) A
b 100 (0.00) A 17.14 (2.86) A
McGill 5.71 (0.10) A 0.78 (0.68) B 4.65 (0.09) B 4.07 (0.10) B 3.51 (0.26) A 100 (0.00) A 18.10 (5.95) A
NW07505 5.69 (0.12) A 0.56 (0.98) B 4.65 (0.15) B 4.09 (0.14) B 3.50 (0.07) A 100 (0.00) A 15.98 (6.20) A
South
Central
Overland 6.01 (0.02) A 2.46 (0.73) A 5.30 (0.03) A 4.63 (0.10) A 3.11 (0.11) A 98.67 (1.15) A 15.24 (6.60) A
McGill 6.05 (0.11) A 1.80 (2.54) A 5.12 (0.34) A 4.65 (0.13) A 3.51 (0.17) A 100 (0.00) A 7.14 (2.02) A
NW07505 5.89 (0.04) A 2.00 (1.74) A 4.84 (0.16) A 4.54 (0.05) A 3.40 (0.26) A 99.33 (1.15) A 12.38 (5.95) A
Panhandle
Overland 3.09 (0.65) B ND (ND) B c 1.55 (0.21) C 2.62 (0.05) C 2.34 (0.07) B 48.00 (5.66) B 15.89 (2.27) A
McGill 2.83 (0.56) B ND (ND) B 1.51 (1.14) C 2.78 (0.16) C 2.33 (0.03) B 51.00 (18.38) B 12.50 (10.61) A
NW07505 3.18 (0.53) B ND (ND) B 2.14 (0.69) C 2.43 (0.14) C 2.13 (0.21) B 45.00 (5.66) B 11.25 (5.30) A
a APC, Aerobic plate counts; Coliform/E. coli; Eb, Enterobacteriaceae, Yeasts, and Molds log CFU/g for counts. IMI, percentage of internal mold
infection; IFI, percentage of internal Fusarium infection. b Different letters within the same column indicate differences based on P < 0.05.
c ND, none detected.
Page 60
51
Differences in the microbial load of wheat from different districts noticeably reflect the
amount of precipitation and temperature that prevailed from flowering to harvesting (Figure 1 and
Table 2). This pattern was also evident in the data presented by Seiler (25) where a steady
decrease in bacterial and mold counts was observed as warm dry weather conditions prevailed
during wheat ripening and a steep increase in microbial counts was observed in wheat grown
under wetter conditions.
Table 4 summarizes the results for DON, moisture content, and water activity of grain
samples collected during the 2011-2012 growing season. DON was found in all districts,
however, in very low concentrations. Grain samples collected from the Southeastern and South
Central districts contained higher moisture content than samples collected from Panhandle
district. The high precipitation levels and high relative humidity from wheat flowering to harvest
observed in the Southeastern and South Central districts in the 2011-2012 season may have
contributed to the higher moisture content encountered in samples from these districts.
TABLE 4. Mean and standard deviation (SD) for Deoxynivalenol, moisture content and water
activity in winter wheat samples from the 2011-2012 growing season
District Cultivar Deoxynivalenol (µg/g) Moisture content (%) Water activity
Mean (SD) Mean (SD) Mean (SD)
Southeast
Overland 0.10 (0.09) Aa 13.26 (0.39) A 0.63 (0.03) A
McGill 0.05 (0.09) A 13.33 (0.24) A 0.63 (0.03) A
NW07505 0.07 (0.12) A 13.38 (0.25) A 0.65 (0.01) A
South
Central
Overland 0.03 (0.06) A 12.84 (0.29) A 0.58 (0.01) B
McGill ND (ND) A b 12.96 (0.25) A 0.60 (0.01) B
NW07505 0.12 (0.20) A 13.35 (0.40) A 0.63 (0.04) B
Panhandle
Overland 0.13 (0.04) A 11.95 (0.09) B 0.60 (0.02) AB
McGill 0.08 (0.11) A 11.81 (0.04) B 0.61 (0.02) AB
NW07505 0.20 (0.07) A 12.27 (0.19) B 0.63 (0.00) AB a
Different letters within the same column indicate differences based on P < 0.05. b ND, none detected.
Page 61
52
Table 5 provides the results for the microbial analysis of winter wheat samples for the
2012-2013 growing season. Unlike the 2011-2012 growing season, the climate conditions that
prevailed from flowering to harvesting in the 2012-2013 growing season were dominated by a
very low precipitation levels, high relative humidity and warmer temperatures. As an example,
mean relative humidity during post-flowering period in Panhandle district increased from 43% in
2012 to 55% in 2013 (Table 2). However, weather patterns were similar among districts for both
growing season. In both seasons, the South Central and Southeastern districts were characterized
by higher levels of precipitation, higher relative humidity and warmer temperatures than the
registered in the Panhandle district.
The variability in microbial counts among districts in the 2012-2013 season was less
pronounced compared with the 2011-2012 season. Coliform/E. coli and APC were found at
highest concentrations in grain samples collected from Southeast district. Salmonella spp. and E.
coli O157:H7 were not detected in any of samples analyzed. There were not significant
differences in the yeast counts found in grain collected among districts.
As in the 2011-2012 season, for the 2012-2013 growing season there was no statistical
differences in the microbial load among cultivars. In general, the microbial counts in the samples
collected in the different districts in the 2012-2013 growing season were higher than the
microbial counts found in the 2011-2012 growing season, except for IFI which showed higher
values in the 2011-2012 season than in the 2012-2013 season.
Page 62
53
TABLE 5. Mean and standard deviation (SD) for microbial loads in winter wheat samples from the 2012-2013 growing season a
Cultivars
APC Coliform/E. coli Eb Yeasts Molds IMI IFI
Mean (SD) Mean (SD) Mean (SD) Mean (SD) Mean (SD) Mean (SD) Mean (SD)
Southeast
Overland 6.14 (0.38) Ab 3.84 (0.04) A 5.09 (0.72) A 4.79 (0.25) A 4.40 (0.04) A
b 100 (0.00) A 9.00 (1.41) A
McGill 6.00 (0.26) A 4.17 (0.30) A 4.89 (0.32) A 4.69 (0.05) A 4.20 (0.00) A 100 (0.00) A 7.00 (1.41) A
NW07505 6.42 (0.15) A 4.02 (0.09) A 4.38 (0.13) A 4.76 (0.05) A 4.48 (0.03) A 100 (0.00) A 10.00 (2.83) A
South
Central
Overland 4.60 (0.36) B ND (ND) B c 2.87 (0.71) B 4.34 (0.02) A 3.67 (0.03) B 99.00 (1.41) A 6.00 (2.83) AB
McGill 4.73 (0.31) B ND (ND) B 3.43 (0.05) B 4.93 (0.58) A 3.59 (0.11) B 99.00 (1.41) A 6.00 (0.00) AB
NW07505 5.04 (0.33) B ND (ND) B 3.22 (0.28) B 4.59 (0.11) A 3.73 (0.16) B 100 (0.00) A 8.00 (5.66) AB
Panhandle
Overland 5.82 (0.13) AB ND (ND) B 5.47 (0.21) A 5.16 (0.04) A 3.54 (0.01) C 85.00 (4.24) B 5.00 (1.41) B
McGill 5.67 (1.58) AB ND (ND) B 3.98 (0.45) A 4.76 (0.09) A 3.64 (0.01) C 71.00 (12.73) B 3.00 (1.41) B
NW07505 5.05 (0.10) AB ND (ND) B 4.45 (0.08) A 4.74 (0.01) A 3.46 (0.01) C 72.00 (5.66) B 3.00 (1.41) B
a APC, Aerobic plate counts; Coliform/E. coli; Eb, Enterobacteriaceae, Yeasts, and Molds log CFU/g for counts. IMI, percentage of internal mold
infection; IFI, percentage of internal Fusarium infection. b Different letters within the same column indicate differences based on P < 0.05.
c ND, none detected.
Page 63
54
Table 6 illustrates the results for DON, moisture content, and water activity of samples
collected during the 2012-2013 growing season. DON was not detected in samples collected from
Panhandle but was found in very low concentrations in the Southeastern and South Central
districts. Grain samples collected from the South Central district contained higher moisture
content than samples collected from the Panhandle district. Water activity was lowest in grain
collected in the Panhandle district. In general, the moisture level of wheat harvested in 2012-2013
season was lower (Table 6) than samples from the 2011-2012 season (Table 4), the low
precipitation levels during post-flowering periods in the 2012-2013 season may have contributed
to the lower moisture content encountered in wheat harvest in this period.
TABLE 6. Mean and standard deviation (SD) for Deoxynivalenol, moisture content and water
activity in winter wheat samples from the 2012-2013 growing season
District Cultivars Deoxynivalenol (µg/g) Moisture content (%) Water activity
Mean (SD) Mean (SD) Mean (SD)
Southeast
Overland 0.35 (0.07) Aa 11.23 (0.54) AB 0.60 (0.01) A
McGill 0.10 (0.14) A 11.57 (0.24) AB 0.59 (0.03) A
NW07505 1.10 (0.42) A 11.06 (0.32) AB 0.58 (0.00) A
South
Central
Overland 0.15 (0.14) B 11.72 (0.34) A 0.59 (0.02) A
McGill ND (ND) B b 10.87 (0.86) A 0.59 (0.01) A
NW07505 0.10 (0.14) B 11.55 (0.28) A 0.60 (0.00) A
Panhandle
Overland ND (ND) B 10.39 (0.12) B 0.53 (0.00) B
McGill ND (ND) B 10.97 (0.91) B 0.55 (0.01) B
NW07505 ND (ND) B 10.17 (0.06) B 0.53 (0.01) B a Different letters within the same column indicate differences based on P < 0.05.
b ND, none detected.
Wheat varieties were combined for correlation analysis, since there was no differences
between them. Correlation coefficients between weather variables and microbial counts, moisture
content, and water activity are summarized in Table 7. A significant positive correlations between
relative humidity and all microbial indicators was observed, except for coliform/E. coli and IFI.
In general, the microbial load of winter wheat samples increased with an increase in the relative
Page 64
55
humidity of the environment during flowering to harvest. A strong positive correlation was also
found between precipitation levels and the moisture content of the grain. As the precipitation
rates from flowering to harvesting increased, the final moisture content in the harvested wheat
grain also increased. Mold counts were positively correlated with the mean minimum
temperatures; therefore, mold counts increased with an increase in the mean minimum
temperature recorded. Among all of the correlations, the strongest ones were observed between
mold counts and relative humidity and IMI and relative humidity.
TABLE 7. Correlation coefficients for weather variables versus microbial loads, moisture
content, and water activity for winter wheat samples.
Weather
Variables a
Microbial Indicators a Moisture
content
Water
Activity APC Coliform/E. coli Eb Yeast Mold IMI IFI
Precip 0.446 0.169 0.473 0.050 0.029 0.471 0.752 0.905*b 0.680
T-Max -0.719 -0.299 -0.749 -0.438 -0.337 -0.739 -0.433 -0.716 -0.410
T-Min 0.338 0.500 0.197 0.441 0.762* 0.569 -0.295 -0.323 -0.021
RH 0.869* 0.591 0.802* 0.834* 0.926* 0.971* -0.172 0.045 -0.003 a
Precip, precipitation; T-Max, highest air temperature; T-Min, Lowest air temperature; RH,
relative humidity; APC, aerobic plate count; Eb, Enterobacteriaceae; IMI, internal mold
infection; IFI, internal Fusarium infection. b * Significant at P < 0.05
As a raw agricultural commodity, wheat grain is vulnerable to microbial infection shortly
after head emergence and remains susceptible until harvesting or until climate conditions are not
favorable for microbial growth. Flowering has been considered by many authors as the key stage
for mold infection in the field (6, 21), and previous studies have reported on the correlation
between mold infection and weather conditions. For instance, FHB infection occurs by the
penetration of infectious hyphae on the inner surfaces of the floret (4), and is favored by low
temperatures and high humidity (22). Reis (23) and Panisson (18) reported that peaks in
Gibberella zeae counts were associated with rain events and high relative humidity. These reports
are in agreement with the positive correlation between mold counts and weather variables
Page 65
56
described here, which implies that mold counts increases as minimum temperature and relative
humidity increases. Because relative humidity has a strong positive correlation with IMI, the
higher levels of relative humidity in the 2012-2013 season in the Panhandle may explain why
samples from this area had a much higher incidence of IMI when compared with samples from
the same region in the previous year.
In conclusion, the results of the present study indicated that average minimum
temperature and relative humidity during post-flowering periods play an important role on the
microbiological quality and safety of wheat grain. The microbial flora of wheat can therefore be
greatly influenced by the weather conditions during this period and an annual variation in
microbial load may be expected. In general, microbial load in wheat grain tended to be lower in
those areas with lower relative humidity and lower minimum temperatures. Besides weather
conditions, other variables such as type of soil, use of fertilizers or foliar chemicals to treat
diseases may also affect the number and type of microorganisms present. This study contributes
to a better understanding on how environmental conditions may affect the microbial load of
wheat. In addition, provides to grain buyers and processors the post-flowering weather conditions
as an additional parameter to consider when selecting for higher microbiological quality grain.
Page 66
57
REFERENCES
1. AACC International. 2002. Approved Methods of Analysis. (11th ed.). St. Paul, MN:
AACC International (Method 44-15A).
2. AOAC. 2013. Approved Methods of Analysis. Enumeration for Coliforms and generic E.
coli, and Enterobacteriaceae. (Methods 991.14 and 2003.01).
3. Berghofer, L.K., Hocking, A.D., Miskelly, D., and Jansson, E. 2003. Microbiology of
wheat and flour milling in Australia. Int. J. Food Microbiology. 85:137.
4. Buerstmayr, H., Steiner, B., Hartl, L., Griesser, M., Angerer, N., Lengauer, D., Miedaner,
T., Schneider, B., and Lemmens, M. 2003. Molecular mapping of QTLs for Fusarium
head blight resistance in spring wheat. II. Resistance to fungal penetration and spread.
Theoretical and Applied Genetics 107: 503—508.
5. Bullerman, Lloyd B. and Andreia Bianchini. 2009. The Microbiology of Cereals and
Cereal Products. Chapter 15. John Wiley&Sons
6. Champeil, A., Dore, T, and Fourbet, J. F. 2004. Fusarium head blight: epidemiological
origin of the effects of cultural practices on head blight attacks and the production of
mycotoxins by Fusarium in wheat grains. Plant Science 166(6): 1389.
7. Chandelier, A.; Nimal, C.; André, F.; Planchon, V.; Oger, R. 2011. Fusarium species and
DON contamination associated with head blight in winter wheat over a 7-year period
92003–2009) in Belgium. Eur. J. Plant Pathol. 130:403–414.
8. De Wolf, E. D., Madden, L. V., and Lipps, P. E. 2003. Risk assessment models for wheat
Fusarium head blight epidemics based on within-season weather data. Phytopathology
93:428-435.
9. Dufault, N. S., De Wolf, E. D., Lipps, P. E., and Madden, L. V. 2006. Role of
temperature and moisture in the production and maturation of Gibberella zeae perithecia.
Plant Dis. 90:637-644.
Page 67
58
10. Gilbert, J., Woods, S. M., and Kromer, U. 2008. Germination of ascospores of Gibberella
zeae after exposure to various levels of relative humidity and temperature.
Phytopathology. 98:504-508.
11. Kriss, A.B.; Paul, P.A.; Madden, L.V. 2010. Relationship between yearly fluctuations in
Fusarium head blight intensity and environmental variables: A window-pane analysis.
Phytopathology. 100:784–797.
12. Lacey, J., Magan, N. 1991. Fungi in cereal grains: their occurrence and water and
temperature relationships. In Cereal Grain Mycotoxins, Fungi and Quality in Drying and
Storage. Elsevier, Amsterdam, London, New York. 77-118.
13. Manthey, F.A., Wolf-Hall, C. E., Yalla, S., Viajayakumar, C., and Carlson, D. 2004.
Microbial loads, mycotoxins, and quality of durum wheat from the 2001 harvest of the
North Plains region of the United States. Journal of Food Protection. 67:772-780.
14. Mansuetus, A.S.B., Odvody, G.N., Frederiksen, R.A., Leslie, J. 1997. Biological species
in the Gibberella fujikuroi species complex (Fusarium section Liseola) recovered from
sorghum in Tanzania. Mycological Research. 101:815-20.
15. Maturin, L.J. and Peeler, J.T. 1998. Aerobic plate count. Ch. 3. In Food and Drug
Administration Bacteriological Analytical Manual, 8th ed. (revision A), Available at:
http://www.cfsan.fda.gov/-ebam/bam-3.html.
16. McMaster, G.S., Smika, D.E., 1988. Estimation and evaluation of winter wheat
phenology in the central Great Plains. Agric. For. Meteorol. 43:1-18.
17. Neskorozhenyi, B.F., Zelenskaya, O.B. 1991. The solar activity as a means of estimation
and prediction of long-term brown rust dynamics in wheat. Mikologiya I Fitopatologiya.
25:550-555.
18. Panisson, E., Reis, E.M. Boller, W. 2002. Quantificação de propágulos de Gibberella
zeae no ar e infecção de anteras em trigo. Fitopatologia Brasileira 27:484-488.
Page 68
59
19. Paul, P. A., Lipps, P. E., De Wolf, E., Shaner, G., Buechley, G., Adhikari, T., Ali, S.,
Stein, J., Osborne, L., and Madden, L. V. 2007. A distributed- lag analysis of the
relationship between Gibberella zeae inoculum density on wheat spikes and weather
variables. Phytopathology. 97:1608-1624.
20. Peñuelas, J., Filella, I., 2001. Responses to a warming world. Science 294, 793–794.
21. Pugh, G. W., Johann, H. and Dickson, J. G. 1933. Factors affecting infection of wheat
heads by Gibberella saubinetii. Journal of Agricultural Research. 46:771—797.
22. Rapilly, F., Lemaire, J.M., and Cassini, R. 1973. Les Fusarioses, in: Les maladies des
céréales—Principales maladies cryptogamiques. Institut national de la recherche
agronomique-Institut technique des céréales et des fourrages (INRA-ITCF), 119 pp.
23. REIS, E.M. 1990. Effects of rain and relative humidity on the release of ascospores and
on the infection of wheat heads by Gibberella zeae. Fitopatologia Brasileira 15:339-343.
24. Richter KS, Dorneanu E, Eskridge KM, Rao C. 1993. Microbiological quality of flours.
Cereal Foods World. 38:367–369.
25. Seiler, D.A. 1986. The microbial content of wheat and flour, p. 35-40. In B. Flannigan
(ed), Proceedings of the spring meeting of the Biodeterioration Society on spoilage and
mycotoxins of cereals and other stored products. C.A.B. International, Slough, UK.
26. Tournas, V., Stack, M. E., Mislivec, P. B., Koch, H. A., & Bandler, R. 1998. Yeasts,
molds, and mycotoxins. In Bacteriological Analytical Manual, edition 8, revision A.
Available at:
http://www.fda.gov/Food/ScienceResearch/LaboratoryMethods/BacteriologicalAnalytical
ManualBAM/um071435.htm.
27. USDA GIPSA; www.gipsa.usda.gov (Grain Inspection, Packers and Stockyards
Administration). Available at:
http://www.gipsa.usda.gov/publications/fgis/handbooks/don/chapter_21.pdf
Page 69
60
28. Xu, X., and Nicholson, P. 2009. Community ecology of fungal pathogens causing wheat
head blight. Annu. Rev. Phytopathol. 47:83-103.
29. Xue, Q.W., Weiss, A., Baenziger, P.S., 2004. Predicting phenological development in
winter wheat. Climate Res. 25, 243–252. Cao, W., Moss, D.N., 1997. Modeling phasic
development in wheat: a conceptual integration of physiological components. J. Agric.
Sci. 129:163–172.
30. Zadoks, J.C., Chang, T.T., Konzack, C.F., 1974. A decimal code for the growth stages of
cereals. Weed Res. 14:415–421.
Page 70
61
EFFECT OF THE MILLING STEPS ON THE MICROBIAL LOAD OF WHEAT
MILLED PRODUCTS FROM DIFFERENT WHEAT VARIETIES *
L. Sabillón, J. Stratton, D.J. Rose, R.A. Flores, and A. Bianchini
Department of Food Science and Technology
University of Nebraska – Lincoln, Lincoln, NE, USA
Corresponding author:
Andréia Bianchini, Department of Food Science and Technology
The Food Processing Center, University of Nebraska – Lincoln
University of Nebraska – Lincoln, Lincoln, NE, USA
Phone: (402) 472-3114, Fax: (402) 472-1693
[email protected]
* Scientific manuscript formatted to meet guidelines for the International Journal of
Food Microbiology
Page 71
62
ABSTRACT
Microbial contaminants are hosted and concentrated mainly on the surface of the grain
and from there they may reach flour during wheat milling. In this study, samples taken during the
milling process of four wheat varieties were analyzed for mesophilic aerobic bacteria (APC),
yeasts, molds, and Enterobacteriaceae (Eb), to evaluate the effect of cleaning, tempering and
milling stages on microbial load. Based on the results, the removal of foreign materials using a
Dockage tester did not affect the microbial load of wheat grain. The conditioning process under
aseptic conditions did not cause significant changes in the microbial populations of wheat grain,
since the water activity during this process does not reach the minimum needed for microbial
growth. When wheat from all four varieties was conditioned with sterile water and milled, the
microbial load was distributed into the different milled fractions. As the layers of the kernel were
separated, surface contaminants were concentrated in the bran (APC increased on average by
0.66, yeast and mold by 0.88 and 0.74, respectively, and Eb by 0.45 log CFU/g); while counts
remained the same in the wheat germ. The inner endosperm had a lower microbial load; since the
fractions obtained from break rolls and reduction rolls (break flour and reduction flour) had
counts substantially lower than the conditioned wheat. When both fractions were combined to
produce flour, the average reduction obtained for APC was 1.54 log CFU/g, Eb counts was 1.88
log CFU/g, and for yeast and mold counts were 1.10 and 0.16 log CFU/g, respectively. Among
the different microbial groups the least redistribution was observed with molds. When comparing
microbial counts at any given fraction, there were no differences among varieties. Although the
milling process removes much of the outer layers of the wheat kernel, removing the majority of
the microflora, flour can still retain significant amounts of microbial contamination representing a
potential risk for consumers’ health.
Page 72
63
1. INTRODUCTION
Throughout the production chain, including harvest, storage and transport, wheat is
exposed to multiple sources of microbial contamination (14). Thus, wheat kernels usually host a
large and varied microbial flora, including pathogenic and spoilage microorganisms (3, 8). Most
of these microbial contaminants are located in the outer layers of the kernel, the pericarp;
although some species may reach the inner part through mechanical damage that may be caused
during harvesting (6, 7).
Wheat arriving in the mill usually contains foreign material, such as sticks, stones,
adhered dust, wood, insects, or metal, which may contain a significant microbial load and
represent a potential hazard for the milling operation. Therefore, flour milling begins with
removal of these impurities through a sequence of operations based on physical characteristics
(11). The wheat-cleaning system varies greatly among milling operations regarding the sequence,
number, and complexity of the methods used. Over time, new grain cleaning technologies have
been introduced such as infrared or ultraviolet optical sorters; however, traditional mechanical
methods for removing impurities based on size, shape and density are the basis of most cleaning
operations. The foreign matter separated during the cleaning process may contribute to improve
the safety of wheat prior to milling by reducing microbial load and mycotoxin concentrations
(4,8). However, the extent of the reduction in the microbial load may be variable since
microorganisms are strongly adhered to the surface of the grain (7).
After the initial cleaning, the next step in wheat preparation for milling is conditioning,
which involves the addition of water to bring the wheat to its optimum milling moisture. To
ensure even penetration and distribution of moisture into the kernels, wheat is held in large
conditioning bins during specific holding periods (3, 11). This adjustment in moisture content
mellows the endosperm and toughens the bran, ensuring an easier separation later in the milling
Page 73
64
process. Conditioning is a critical step in milling operations, since an improper handling and poor
sanitary conditions can encourage microbial growth in the wheat kernels (3).
Once conditioned, wheat undergoes a series of reduction, grinding, sifting and purifying
operations to separate the germ and the bran fractions from the endosperm (11). During this
grinding process, the microorganisms are redistributed and concentrated in certain milled
fractions, particularly in germ and bran (3, 13). Therefore, the majority of microorganisms
originally present on the wheat kernels might be expected to be present in the milled products
(15). Moreover, the physical separation of the grain components (bran, endosperm, and germ) and
the subsequent reduction of the endosperm to flour generate heat and thus moisture condensation
is likely to occur, which may lead to build-up of flour residues in the milling equipment, which
supports bacterial growth that can also be a source of contamination to the product.
A thorough review of the scientific literature has shown the lack of reports that compare
wheat varieties and their effect on microbial load distribution during milling. Therefore, the
objectives of this study were (i) to evaluate the effect of cleaning and conditioning on the
microbial load of wheat grain, (ii) to examine the influence of the milling stages on the
microbiological quality of milled fractions, and (iii) to evaluate the effect of wheat variety on
microbial load distribution during milling.
2. MATERIALS AND METHODS
2.1 Wheat samples
Four hard red winter wheat varieties, two commercial lines (Overland and McGill) and
two experimental lines (NW07505 and NW03666) were obtained from the 2012 winter wheat
trials in the state of Nebraska, USA. Trials were conducted in the South Central district at Clay
Center County during the period September 23th, 2011 (Sowing) – June 22
th, 2012 (Harvesting).
Samples were provided by Husker Genetics, the University of Nebraska-Lincoln Foundation Seed
Division.
Page 74
65
2.2 Sample cleaning
The wheat samples (1100 g each) were cleaned using a dockage tester (CDT/B; Carter-
Day International, Minneapolis, Minn., USA) to remove shrunken and broken kernels, sticks,
stones, lighter particles like chaff and straw, and other foreign materials according to their particle
size. Dockage tester was equipped with a no. 25 riddle and a no. 2 and no.8 sieves.
2.3 Conditioning
The initial moisture content of wheat samples was determined using a forced-air oven
method 44-15A (AACCI 2002) and the water activity was measured using an Aqualab® S-3 TE
water activity meter (Decagon, Pullman, Washington, USA). The amount of tempering water
needed was calculated based on the initial moisture content of each wheat sample. A one-stage
tempering procedure was used to achieve a good repeatability of milling results (Method 26-
10.02, AACCI 2002). Three cleaned samples (1000 g) from each wheat variety were placed in
sterile plastic bags and tempered to 15.5% moisture using sterile distilled water under aseptic
conditions (Biosafety cabinet). Tempering water was applied to wheat using an atomizer to
ensure even distribution. Samples were shaken vigorously during the first two hours after the
addition of water and were left to stand for 24 hr under controlled conditions (23-24°C and 60%
relative humidity).
2.4 Experimental milling
Nine hundred grams of each tempered wheat sample were milled using an Buhler
experimental mill (Buhler, Minneapolis, MN) according to method 26-21.02 (AACCI 2002).
Milled fractions (flour, bran, and shorts) were collected in sterile plastic bags, as they were
coming out of the mill. Flour fractions were recombined in a tumbling mixer for 3 min to obtain
straight-grade flour. The tumbling mixer consisted of a sterile cylindrical container, which was
held at a 45º angle and rotated at 6.7 rpm on a circular axis. The water activity of each milled
Page 75
66
fraction was determined using a forced-air oven method 44-15A (AACCI 2002) and an
Aqualab® S-3 TE water activity meter (Decagon, Pullman, Washington, USA), respectively.
2.5 Microbiological analysis
Microbial analysis was performed in wheat samples collected directly from growers, after
cleaning, after tempering, in each of the milled fractions, and in the final flour. Samples were
analyzed for mesophilic aerobic bacteria (Aerobic Plate Counts, APC), yeasts, molds, and
Enterobacteriaceae (Eb). An initial dilution was prepared from each sample by mixing 25 g
sample into 225 ml 0.1% aqueous peptone solution. For APC, serial dilutions were spread plated
on Standard Methods Agar (SMA, Acumedia) and incubated at 35 C for 48 hr, according to the
U.S. Food and Drug Administration’s Bacteriological Analytical Manual (9). For yeast and mold
counts, appropriate dilutions were spread plated onto Dichloran Rose Begal Chloramphenicol
agar (DRBC, Acumedia) and incubated at 25 C in the dark for 5 days, according to the U.S. Food
and Drug Administration’s Bacteriological Analytical Manual (16). Enterobacteriaceae counts
were determined according to AOAC official method 2003.01, using Petrifilm™ (3M
Microbiology, St. Paul, MN). Serial dilutions were inoculated onto Eb Petrifilm™ and incubated
at 37 C for 24 hr.
2.6 Statistical analysis
The microbiological counts obtained were subjected to analysis of variance at 95% level
of confidence. To determine significant differences among samples, a generalized linear mixed
model analysis of variance followed by a Tukey’s test was used. Significance was defined as
P<0.05. The statistical software SAS version 9.3 (SAS Institute, Cary, NC, USA) was used to
analyze the data.
Page 76
67
3. RESULTS AND DISCUSSION
3.1 Wheat cleaning
The removal of unwanted materials from wheat grain prior to milling is the first step in
any milling operation. In the milling industry, wheat is cleaned thorough a sequence of
operations, including magnetic separators, separators, aspirators, disc separators, and scourers,
which separate foreign matter and remove firmly attached soiling. Dockage tester removes
impurities like stones, sticks and other coarse and fine materials by the action of reciprocating
screens and aspiration. Target microorganisms were detected in all wheat samples at very similar
levels before and after cleaning as shown in Table 1. Cleaning dirty grain with a dockage tester
did not significantly affect the microbial counts in none of the wheat samples analyzed.
Therefore, the removal of coarse and fine materials did not have any significant effect on
reducing microbial counts in wheat grain.
However, the addition of dry scourers and brushes to the cleaning system has
shown to cause a small reduction in microbial counts, since these operations scour off impurities
and remove more firmly attached soiling on wheat grain. Manthey et al. (8) demonstrated that
cleaning dirty grain with a dockage tester followed by a cyclone grain cleaner may reduce, on
average, aerobic bacterial counts in 1.0 log CFU/g. Similar trends of overall reduction in yeast
and mold counts were also observed. In another study, Seiler (14) also observed small reductions
in counts of bacteria and mold in wheat when evaluating different dry scourers, aspirators and
brushes. By contrast, Riba et al. (12) observed no differences in the fungal contamination
between unclean durum wheat and durum wheat after cleaning, with fungal counts varying from
2.7 to 2.9 log CFU/g. Therefore, the extent of the reduction in microbial counts by the cleaning
step is variable and may depend on the type and number of cleaning methods used.
Page 77
68
Table 1. Mean and standard deviation (SD) for different groups of microorganisms in wheat samples before and after cleaning (categorized by
wheat variety) a
Wheat
variety
APC
Yeasts
Molds
Eb
Dirty b Clean
c
Dirty Clean
Dirty Clean
Dirty Clean
Mean (SD) Mean (SD)
Mean (SD) Mean (SD)
Mean (SD) Mean (SD)
Mean (SD) Mean (SD)
Overland 6.01 (0.03) Ad 6.16 (0.07) A
4.73 (0.10) A 4.69 (0.13) A
3.11 (0.11) A 3.25 (0.12) A
5.30 (0.03) A 5.02 (0.25) A
McGill 6.05 (0.11) A 5.93 (0.10) A
4.65 (0.13) A 4.27 (0.30) A
3.51 (0.17) A 3.30 (0.12) A
5.12 (0.34) A 5.05 (0.33) A
NW03666 6.32 (0.21) A 5.95 (0.13) A
4.73 (0.04) A 4.47 (0.09) A
3.50 (0.30) A 3.26 (0.21) A
5.25 (0.18) A 4.80 (0.39) A
NW07505 5.89 (0.05) A 6.00 (0.16) A
4.54 (0.05) A 4.75 (0.07) A
3.41 (0.26) A 3.41 (0.24) A
4.84 (0.16) A 4.95 (0.18) A
Average 6.04 (0.18) A 6.02 (0.14) A
4.66 (0.11) A 4.58 (0.23) A
3.36 (0.25) A 3.31 (0.17) A
5.11 (0.25) A 4.96 (0.24) A a APC (Aerobic plate counts), Yeasts, Molds, and Eb (Enterobacteriaceae) log CFU/g for counts.
b Sample as collected
c Sieved grain
d Different letters within the same row and microorganism indicate differences based on P < 0.05.
Page 78
69
3.2 Wheat conditioning
The availability of water is one of the most important factors determining the
growth of microorganisms. Usually, wheat kernels have a water activity below the minimum
needed (0.90) for microbial growth (Fig. 1); however, microorganisms may survive in states of
minimal metabolic activity for long periods of time. The presence of nutrients or the increase in
water availability may stimulate the exit from dormancy of microbial cells; therefore, the addition
of water to condition the wheat kernels prior to milling may encourage microbial growth if not
properly managed. As a result of the addition of water for tempering, the water activity of wheat
kernels increase (Fig. 1); however, still remains at levels (0.73) below the minimum needed to
support the growth of microorganisms.
Table 2 illustrates the mean counts for all target microorganisms before and after the
conditioning process. After conditioning, the mean counts of target microbial populations
decreased in most samples, although this change was not statistically relevant. However, in two
wheat varieties (NW07505 and Overland), the amount of mold was reduced significantly after
conditioning. In these samples, the mean mold counts decreased from 3.25 to 2.78 log CFU/g and
from 3.41 and 2.88 log CFU/g for varieties Overland and NW07505, respectively. Moreover, the
mean yeast count in NW07505 was reduced from 4.75 to 3.84 log CFU/g. A similar trend was
also observed by Berghofer et al. (3), who reported that the populations of Bacillus spp., yeasts
and molds were reduced after conditioning. In this later study, the percentage of wheat samples
containing more than 3.0 log CFU/g of mold counts were reduced by up to 26% after
conditioning.
Page 79
70
Table 2. Mean and standard deviation (SD) for different groups of microorganisms in wheat samples before and after tempering (categorized by
wheat variety) a
Wheat
variety
APC
Yeasts
Molds
Eb
Beforeb After
c
Before After
Before After
Before After
Mean (SD) Mean (SD)
Mean (SD) Mean (SD)
Mean (SD) Mean (SD)
Mean (SD) Mean (SD)
Overland 6.16 (0.07) Ad 5.95 (0.08) A
4.69 (0.13) A 4.28 (0.19) A
3.25 (0.12) A 2.78 (0.03) B
5.01 (0.27) A 5.34 (0.16) A
McGill 5.93 (0.10) A 5.83 (0.14) A
4.27 (0.30) A 3.85 (0.23) A
3.30 (0.12) A 2.81 (0.11) A
5.05 (0.33) A 5.11 (0.19) A
NW03666 5.95 (0.13) A 6.03 (0.09) A
4.47 (0.09) A 3.88 (0.08) A
3.26 (0.21) A 2.78 (0.20) A
4.80 (0.39) A 4.90 (0.23) A
NW07505 6.00 (0.16) A 5.87 (0.23) A
4.75 (0.07) A 3.84 (0.19) B
3.41 (0.24) A 2.88 (0.15) B
4.95 (0.18) A 5.03 (0.15) A
Average 6.01 (0.10) A 5.92 (0.09) A
4.55 (0.22) A 3.96 (0.21) A
3.31 (0.07) A 2.81 (0.05) B
4.95 (0.11) A 5.10 (0.18) A a APC, Yeasts, Molds, and Eb log CFU/g for counts.
b Clean wheat before being conditioned
c Wheat after conditioning
d Different letters within the same row and microorganism indicate differences based on P < 0.05.
Page 80
71
0.400.450.500.550.600.650.700.750.80
Before
conditioning
After
conditioning
Bran Break flour Reduction
flour
Germ Straight-grade
flour
Wa
ter a
ctiv
ity
Overland McGill NW03666 NW07505
The conditioning process under aseptic conditions did not cause significant changes in the
microbial populations of wheat kernels prior to milling. As previously mentioned, the minimum
water activity requirement for growth of most bacteria is 0.90; while yeasts and molds are able to
grow at lower water activities, such as 0.80 and 0.72, respectively (10). The relatively short
holding period used in these experiments (24 hr) and the low water activity of about 0.70-0.75
found on wheat grain after conditioning (Fig. 1), supports the findings that the tempering process
by itself may not promote microbial growth. However, an inspection survey carried out by
Berghofer et al. (3) in commercial mills found an increase in mesophilic aerobic counts after
conditioning and the presence of microorganisms that were not previously detected in wheat
grain. Nevertheless, the same survey detected build-up of grain residues in conditioning and
storage bins used for the process, which may contain a significant microbial load. Therefore, the
observed increases in microbial load were most likely due to transfer from poorly cleaned bins
and equipment and not necessarily due to the tempering process itself.
Figure 1. Average water activity of wheat grain before and after conditioning and milling end
products for all wheat varieties. Error bars denote ± standard deviation.
3.3 Wheat milling
Once conditioned, wheat passes through the various systems in the mill, allowing the
removal of the endosperm from the bran and germ, and the reduction in particle size of the
isolated endosperm. The milling process may differ among milling operations, depending on
Page 81
72
process flow and the type of wheat used. However, all milling systems cause a physical
separation of the grain components, thus the microorganisms originally present in the grain may
be distributed across the milled fractions.
Figure 2 illustrates the distribution of APC, yeasts, molds and Eb counts among milled
fractions, along with end product flour observed in the different wheat varieties. As a general
trend, as the outer grain layers are separated by the corrugated rolls in the break system, microbial
contaminants are concentrated in the bran and wheat germ fractions, with flour milled from the
inner endosperm in the reduction system being the least contaminated end-product of the milling
process (Fig. 2).
In the bran fraction, when compared to wheat kernels, APC increased by 0.7 log CFU/g,
on average; while yeast and mold counts increased, on average, by 0.9 log CFU/g and 0.7 log
CFU/g, respectively. The microbial counts in the germ fraction remained relatively unchanged
when compared with that originally present on the conditioned grain. Berghofer et al. (3) reported
that the bran and germ fractions showed higher microbial counts than the wheat entering the
milling system, with APC increasing from 6.0 to 7.0 log CFU/g in the bran portion.
The flour obtained from the inner endosperm tends to have lower microbial counts, since
most microorganisms are located in the outer layers of the grain (7, 8). In this study, mean counts
were reduced significantly for all microorganisms in the flour fractions. Aerobic bacterial counts
decreased, on average, by 1.7 log CFU/g in the reduction flour when compared to tempered
wheat; while yeast and mold counts were reduced by 1.5 log CFU/g and 0.4 log CFU/g,
respectively. The mean Eb counts in the reduction flour also decreased significantly when
compared with tempered wheat (2.1 log CFU/g). Berghofer et al. (3) reported in the same study,
that maximum aerobic bacterial count decreased from 7.0 to 5.0 log CFU/g, yeast counts from 6.0
to 3.0 log CFU/g, and mold counts from 6.0 to 4.0 log CFU/g after fine reduction.
Page 82
73
-2.0-1.5-1.0-0.50.00.51.01.52.02.53.0
Bran Germ Break Flour Reduction
Flour
Straight-grade
flour
AP
C l
og
CF
U/g
red
uct
ion
Overland
McGill
NW03666
NW07505
-2.0-1.5-1.0-0.50.00.51.01.52.02.53.0
Bran Germ Break Flour Reduction
Flour
Straight-grade
flour
Eb
log
CF
U/g
red
uct
ion
Overland
McGill
NW03666
NW07505
-2.0-1.5-1.0-0.50.00.51.01.52.02.53.0
Bran Germ Break Flour Reduction
Flour
Straight-grade
flour
Yea
st l
og
CF
U/g
red
uct
ion
Overland
McGill
NW03666
NW07505
-2.0-1.5-1.0-0.50.00.51.01.52.02.53.0
Bran Germ Break Flour Reduction
Flour
Straight-grade
flour
Mold
log
CF
U/g
red
uct
ion
Overland
McGill
NW03666
NW07505
Figure 2. Comparison of the distribution of APC, Eb, yeasts, and molds among milled fractions
and milling end-product (straight-grade flour) in the different wheat varieties. Error bars denote ±
standard deviation. No differences among varieties for each fraction and microorganisms were
observed.
Page 83
74
During the milling process, there was a clear redistribution in the population of all
microorganisms tested among the product fractions, which led to significant differences among
the microbial loads of the different fractions for all wheat varieties tested. Among the different
microbial groups the least redistributions were observed with molds (Fig. 2). Hesseltime (5)
showed that the dry-milling process reduced bacterial counts in flour, but have minimal impact on
fungal counts since they remained relatively unchanged when compared to that originally present
on the conditioned wheat.
When both flour fractions were combined to produce straight-grade flour, the microbial
load was significantly lower than that of conditioned wheat. A survey by Seiler (14) revealed that
the mold count in flour (3.7 log CFU/g) was about 10 times lower than in the corresponding
wheat (4.3 log CFU/g). Richter et al. (13) provided a comprehensive microbiological profile for
more than 4,000 commercial wheat flour samples of four different types (hard red winter, spring,
soft red winter, and durum) collected throughout the United States. On average, flour samples had
counts of 2.1 log CFU/g and 2.9 log CFU/g for yeast and mold, respectively. These counts are
lower than the ones obtained in the present study. When comparing microbial counts at any given
fraction, there was no difference among varieties. Therefore, wheat varieties did not show any
difference in the microbial distributions obtained.
In conclusion, this study contributes to a better understanding on how the general
operations involved in the milling process affect the microbial load of the wheat milled products
when compared with the wheat entering the system. Results indicated that removing foreign
materials will not reduce microbial load in wheat grain. However, the incorporation of abrasive
cleaning methods may cause a slight reduction in microbial counts as reported by some authors
(3). The water activity encountered in wheat grain after tempering is not enough to support
microbial growth, thus the tempering process by itself does not encourage microbial growth if
proper sanitary conditions exist. The milling process causes a redistribution of the microbial load
Page 84
75
into the different milled fractions, with the flour fractions showing lower microbial load when
compared to conditioned wheat. However, although the milling process removes much of the
outer layers of the wheat kernel, removing the majority of the microflora, flour can still retain
unsafe contaminants representing a potential risk for consumers’ health. The distribution of
microorganisms, originally present in the kernels, during the milling process is not affected by
wheat variety.
Page 85
76
REFERENCES
1. AACC International. 2002. Approved Methods of Analysis. (11th ed.). St. Paul, MN:
AACC International (Methods 44-15A, 26-10.02, 26-21.02).
2. AOAC. 2013. Approved Methods of Analysis. Enumeration of Enterobacteriaceae.
Methods 2003.01.
3. Berghofer, L.K., Hocking, A.D., Miskelly, D., and Jansson, E. 2003. Microbiology of
wheat and flour milling in Australia. Int. J. Food Microbiology. 85:137.
4. Bullerman, L. B., & Bianchini, A. 2007. Stability of mycotoxins during food processing.
International Journal of Food Microbiology. 119:140-146.
5. Hesseltime, C.W. 1968. Flour and wheat: research on their microbiological flora. Bakers
Dig. 42:40-46.
6. International Commission of Microbiological Specification for Foods (ICMSF). 1980.
Cereals and cereal products. In Microbial ecology of foods, Vol. 2, Food commodities.
New York: Academic Press, Inc.
7. Laca, A., Mousia, Z., Diaz, M., Webb, C., and Pandiella, S.S. 2006. Distribution of
microbial contamination within cereal grains. J. Food Eng. 72:332.
8. Manthey, F.A., Wolf-Hall, C. E., Yalla, S., Viajayakumar, C., and Carlson, D. 2004.
Microbial loads, mycotoxins, and quality of durum wheat from the 2001 harvest of the
North Plains region of the United States. J. Food Prot. 67:772-780.
9. Maturin, L.J. and Peeler, J.T. 1998. Aerobic plate count. Ch. 3. In Food and Drug
Administration Bacteriological Analytical Manual, 8th ed. (revision A), Available at:
http://www.cfsan.fda.gov/-ebam/bam-3.html.
10. Pitt, J.I., Hocking, A.D. 1997. Fungi and food spoilage. 2nd
ed. Aspen Publishing,
Gaithersburg, MD, USA.
Page 86
77
11. Posner, E.S., and Hibbs, A.N. 1997. Wheat Flour Milling. AACC International, St. Paul,
MN.
12. Riba, A., Mokrane, S., Mathieu, F., Lebrihi, A., and Sabaou. N. 2008. Mycoflora and
ochratoxin A producing strains of Aspergillus in Algerian wheat. International Journal of
Food Microbiology. 122:85–92.
13. Richter KS, Dorneanu E, Eskridge KM, Rao C. 1993. Microbiological quality of flours.
Cereal Foods World. 38:367–369.
14. Seiler, D.A. 1986. The microbial content of wheat and flour, p. 35-40. In B. Flannigan
(ed), Proceedings of the spring meeting of the Biodeterioration Society on spoilage and
mycotoxins of cereals and other stored products. C.A.B. International, Slough, UK.
15. Sperber WH. 2007. Role of microbiological guidelines in the production and commercial
use of milled cereal grains: a practical approach for the 21st century. J Food Prot.
70:1041–53.
16. Tournas, V., Stack, M. E., Mislivec, P. B., Koch, H. A., & Bandler, R. 1998. Yeasts,
molds, and mycotoxins. In Bacteriological Analytical Manual, edition 8, revision A.
Available at:
http://www.fda.gov/Food/ScienceResearch/LaboratoryMethods/BacteriologicalAnalytical
ManualBAM/um071435.htm.
Page 87
78
EFFECT OF NOVEL TEMPERING SOLUTIONS ON REDUCING MICROBIAL
LOAD IN WHEAT PRIOR TO MILLING *
L. Sabillón, J. Stratton, D.J. Rose, R.A. Flores, and A. Bianchini
Department of Food Science and Technology
University of Nebraska – Lincoln, Lincoln, NE, USA
Corresponding author:
Andréia Bianchini, Department of Food Science and Technology
The Food Processing Center, University of Nebraska – Lincoln
University of Nebraska – Lincoln, Lincoln, NE, USA
Phone: (402) 472-3114, Fax: (402) 472-1693
[email protected]
* Scientific manuscript formatted to meet guidelines for the Journal of Food Protection
Page 88
79
ABSTRACT
The microbial flora of wheat kernels is the primary contamination source for milled
products; therefore, reducing the microbial load is desirable before or during processing. In this
study, the efficacy of adding organic acids and salt (NaCl) to tempering water to reduce microbial
contamination in hard wheat prior to milling was evaluated. Hard red winter wheat (12.2%
moisture) was tempered to 15.5% moisture by adding sterile distilled water (control) or tempering
solutions containing organic acids (acetic, citric, lactic, or propionic; 1.0%, 2.5% or 5.0% v/v) or
NaCl (26%, or 52% w/v) and holding for 24 hr at 23-24°C and 60% relative humidity. After
tempering, the initial microbial load was reduced significantly by all the acid and salt treatments
when compared to the control which was tempered with water. Tempering of wheat with organic
acids at the 1.0% concentration level resulted, on average, in a significant reduction of 0.9 log
CFU/g in the initial counts of Eb. The greatest reduction (2.7 log CFU/g) in the number of Eb
when compared to incoming wheat was achieved by wheat tempered with lactic acid at 5.0%.
Lactic and propionic acid at the 5.0% concentration level reduced APC by 2.0 and 1.7 log CFU/g
reduction, respectively. The greatest reduction (4.7 log CFU/g) in the number of yeasts was
achieved by lactic acid treatment at the 5.0% level, which resulted in counts below the limit of
detection of the method. Similarly, the greatest reduction (3.8 log CFU/g) in mold counts was
achieved by acetic, propionic, and lactic acid treatments at the 5.0% concentration level, which
also resulted in counts below the limit of detection. Saline solutions were as effective as organic
acid solutions at the concentration levels tested. The milling process of hard wheat tempered with
organic acids and saline solutions may provide milled products with improved microbiological
quality when compared with the traditional tempering process which uses water.
Page 89
80
1. INTRODUCTION
As a raw agricultural commodity, wheat is subject to naturally-occurring microbiological
threats; therefore, wheat kernels usually harbor substantial amounts of microbial contamination
(7). Although the usual water activity of wheat grain and the storage practices normally used by
the milling industry are not conducive to the growth of microorganisms, pathogenic and spoilage
microorganisms may survive in a dormant state for long periods of time (13). Indeed, several
studies have documented the presence of enteric pathogens, such as Salmonella spp., Escherichia
coli, and the food poisoning spore-former Bacillus cereus (5, 13). Moreover, mycotoxin-
producing molds, such as Aspergillus spp., Fusarium spp., and Penicillium spp. are commonly
isolated from wheat grain (6, 25). In addition to pathogenic or toxigenic microorganisms, a wide
variety of food spoilage bacteria are among the natural microbial flora of wheat kernels (5).
The milling steps, including cleaning, tempering and grinding have no direct impact on
the level of contamination present in wheat. As wheat passes through the various systems in the
mill, microbial contaminants are redistributed and concentrated in certain milled fractions,
particularly in germ and bran (26, 33). Thus, the majority of microorganisms originally present on
the wheat might be expected to be present in the milled products. Therefore, the microbial flora of
the kernels is the primary contamination source for milled products; consequently, flour with
higher microbial counts are usually obtained from wheat of inferior microbiological quality (5).
The increased incidence of foodborne disease outbreaks caused by products containing
flour has highlighted the importance of high microbiological quality of wheat prior to milling.
Since the microbial load is concentrated in the outer bran layer of the grain (19), some strategies
to reduce microbial counts have been focused on pre-milling interventions. Chlorinated water
(600 to 700 mg/L) has been widely used to disinfect wheat grain during tempering, for instance
(9, 15). However, there has been some safety concerns about the use of chlorine since under
Page 90
81
certain circumstances it may induce formation of potentially harmful by-products due to its
reactivity with organic matter (4). Therefore, other methods have been evaluated to reduce the
microbial load of wheat, rather than using chlorine-based sanitizers. Studies have focused on the
application of ozonated water or acidified ozonated water as antimicrobial treatment for wheat
during tempering (8, 9, 11, 17). Approaches evaluated include physical methods such as washing,
soaking, and fluidization with ozonated water (10, 18).
Strategies other than chlorination and ozonation during tempering have not been
employed to reduce microbial load in wheat prior to milling. Since, there is a growing interest in
exploring and developing practical and effective antimicrobial treatments to improve safety and
quality of wheat prior to milling, the objectives of this research were (i) to determine the efficacy
of adding organic acids and NaCl to tempering water to reduce microbial load in hard wheat prior
to milling, and (ii) to compare each organic acid and salt´s ability to decrease microbial load in
tempered wheat.
2. MATERIALS AND METHODS
2.1 Materials
Hard red winter wheat (McGill) samples were obtained from the 2013 growing season in
the state of Nebraska, USA. Samples were provided by Husker Genetics, the University of
Nebraska-Lincoln Foundation Seed Division. Lactic acid (86%) and citric acid granular were
obtained from Mallinckrodt Pharmaceuticals. Propionic acid (99%) was obtained from Alfa Aesar
Company. Glacial acetic acid was obtained from EM Science. Sodium chloride was obtained
from Fisher Scientific.
Page 91
82
2.2 Preparation of tempering solutions
A 100 ml stock solution for each organic acid (acetic, citric, lactic, and propionic) and
salt (NaCl) at each desired concentration level was prepared. To prepare each organic acid
solution, the respective organic acid and sterile distilled water were mixed in appropriate
proportions to yield a solution wherein the final acid concentration was 1.0%, 2.5%, and 5.0%
(v/v), respectively. For the saline solutions, concentrations used were 1.0% and 2.0% flour basis
(% of flour weight on a 14% moisture basis). To prepare each saline solution, NaCl and sterile
distilled water were mixed in appropriate proportions to yield a solution wherein the final salt
concentration was 0.26 g/ml (26% w/v ~ 1% flour basis) or 0.52 g/ml (52% w/v ~ 2% flour
basis). The solutions were always prepared fresh prior to tempering and under aseptic conditions.
2.3 Application of tempering solutions
The initial moisture content of the wheat samples was determined using a forced-air oven
method 44-15A (AACCI 2012). The amount of tempering solution needed was calculated based
on the initial moisture content of the wheat samples (12.2 %). Three samples (150 g) for each
treatment were placed in sterile plastic bags and tempered to 15.5% moisture by adding sterile
distilled water (control) or replacing the tempering water with solutions containing acid (acetic,
citric, lactic, or propionic; 1.0%, 2.5% or 5.0% v/v) or NaCl (26%, or 52% w/v), under aseptic
conditions (Biosafety cabinet). Tempering solutions were applied to wheat using an atomizer to
ensure even distribution. Samples were shaken vigorously during the first two hours after the
addition of tempering solutions and were left to stand for 24 hr under controlled conditions (23-
24°C and 60% relative humidity).
2.4 Microbial analysis
To determine the microbial load of wheat before and after tempering under various
experimental conditions, 25 g of wheat with 225 ml of phosphate-buffered saline solution was
Page 92
83
placed in a stomacher bag and mixed for 90 seconds. Serial decimal dilutions were prepared with
phosphate-buffered saline solution and analyzed for aerobic mesophilic bacteria (Aerobic Plate
Counts (APC)), yeasts, molds, and Enterobacteriaceae (Eb). For APC, dilutions were surface
plated in triplicate on Standard Methods Agar (SMA, Acumedia) and incubated at 35 C for 48 hr,
according to the U.S. Food and Drug Administration’s Bacteriological Analytical Manual (21).
For yeast and mold counts, dilutions were spread plated in triplicate on Dichloran Rose Begal
Chloramphenicol agar (DRBC, Acumedia) and incubated at 25 C in the dark for 5 days,
according to the U.S. Food and Drug Administration’s Bacteriological Analytical Manual (34).
Enterobacteriaceae counts were determined according to AOAC official method 2003.01 (3),
using Petrifilm™ (3M Microbiology, St. Paul, MN). Dilutions were inoculated in triplicate on Eb
Petrifilm™ and incubated at 37 C for 24 hr.
2.5 Statistical analysis
Data was analyzed using the statistical software SAS version 9.3 (SAS Institute, Cary,
NC, USA). Differences on microbial counts caused by the tempering solutions were assessed at a
0.05 level of significance by analysis of variance (ANOVA), followed by a multiple comparison
Tukey’s test.
3. RESULTS AND DISCUSSION
The dry milling process of wheat involves three general operations: cleaning, tempering,
and milling. Of all these operations, the tempering step has the greatest potential to minimize
microbial safety hazards in the milling end products. Therefore, in this study the tempering water
was used as a vehicle for delivery of antimicrobial agents, specifically organic acids and sodium
chloride (NaCl).
A thorough review on the sodium and salt content in food products revealed that baked
goods commonly contain 0.5-2.0% NaCl flour basis (16). Moreover, AACCI approved methods
Page 93
84
10-10.02 and 10-13.03 suggest 1.5% NaCl flour basis in bread (1). Therefore, we restricted the
NaCl treatments to 1.0% and 2.0% flour basis. Regarding organic acids, these substances have
been accepted as GRAS (Generally Recognized As Safe) food additives, due to the absence of
toxicological effects. In the United States, acetic acid (21 CFR 184.1005), citric acid (21 CFR
184.1033), lactic acid (21 CFR 184.1061), and propionic acid (21 CFR 184.1081) are approved as
GRAS food additives. In accordance with the Code of Federal Regulations, these additives are
used in food with no limitation other than current good manufacturing practices. Therefore,
different concentration levels were evaluated to find the minimum but effective concentration to
reduce the microbial counts during wheat tempering. The ability to reduce microbial counts
among organic acid treatments was compared at equivalent concentrations (1.0%, 2.5%, and
5.0% v/v); while salt treatments, were at 1.0% and 2.0% flour basis, which are equivalent to 26%
and 52% w/v, respectively.
Table 1 summarize the range and mean counts obtained for all microorganisms tested in
the incoming wheat, as well as after tempering with water (control). Mean APC, yeasts, molds
and Eb counts after tempering with water remained similar to those in the incoming wheat. The
results in the previous manuscript demonstrated that the tempering process under aseptic
conditions does not cause significant changes in the microbial populations of wheat kernels,
which agrees with the findings of this study. Moreover, Dhillon et al. (11) found no significant
changes in the microbial load of wheat after washing for 3 min with distilled water at 2L/kg.
Table 1. Range, mean and standard deviation (SD) for different groups of microorganisms in
winter wheat samples a
Sample APC
b Yeasts Molds Eb
b
Mean (SD) Mean (SD) Mean (SD) Mean (SD)
Incoming wheat 5.87 (0.04)
4.71 (0.03)
3.81 (0.02)
4.69 (0.03)
Controld 5.76 (0.12) 4.38 (0.05) 3.63 (0.04) 4.69 (0.03)
a Microbial counts are presented in log10 CFU/g
b APC, aerobic plate counts; Eb, Enterobacteriaceae counts
d Control, wheat tempered with sterile distilled water
Page 94
85
The reductions of microorganisms by organic acids starts with the lowering of the pH in
the environment and disruption of the permeability of the cytoplasmatic membrane, thus affecting
metabolic functions by the accumulation of anions and protons in the cytoplasm and depletion of
cellular energy (27). Figure 1 illustrates the effect of tempering solutions on the total aerobic
mesophilic microflora. The initial microbial load was reduced significantly by all the acid and salt
treatments compared to the control. Wheat samples tempered with 1.0% organic acid solution
resulted, on average, in 1.0 log CFU/g reduction in the population of aerobic mesophilic bacteria.
There was no difference in the reduction achieved among the citric acid levels evaluated;
therefore, increasing the citric acid concentration beyond 1.0 % had no significant impact on
reducing microbial counts in wheat grain.
Increasing the acid concentration from 1.0 % to 2.5% did not significantly increase the
reduction in aerobic mesophilic bacteria. In fact, there were no significant differences in the
reductions achieved by the different organic acids at the concentration levels of 1.0% or 2.5%.
Likewise, increasing the acetic and citric acid concentration from 2.5% to 5.0% did not affect
significantly the microbial counts. However, increasing lactic and propionic acid up to 5.0%
significantly decreased the microbial counts, resulting in 2.0 and 1.7 log CFU/g reduction,
respectively.
The antimicrobial action of sodium chloride is mainly due to the reduction of water
activity in the substrate in which salt is added, thus causing an osmotic shock to the bacterial cell
(32); however, studies have suggested other possible mechanisms of microbial inhibition,
including alteration of pH, toxicity of sodium and chloride ions, limitation of oxygen solubility to
the microbial cell and interference with substrate utilization in microorganisms (30, 31).
Page 95
86
0.0
0.5
1.0
1.5
2.0
2.5
3.0
3.5
4.0
4.5
5.0
Acetic acid Citric acid Lactic acid Propionic acid NaCl
AP
C l
og
10
CF
U/g
red
uct
ion
Treatments
Control
1.0% v/v
2.5% v/v
5.0% v/v
26% w/v
52% w/v
Figure 1. Effect of organic acid and saline solutions on aerobic plate counts (APC) during wheat
tempering. Error bars denote ± standard deviation. One log reduction is equivalent to a 90%
reduction in CFU per gram of wheat grain. Log reduction values with the same letter are not
significantly different (P >0.05).
The tempering solution with 26% NaCl (~1% flour basis) reduced the mesophilic bacteria
population by 1.0 log CFU/g, which was not significantly different to the reduction obtained by
the organic acid solutions at the concentration levels of 1.0% and 2.5%. Increasing the NaCl
concentration from 26% to 52% (~2% flour basis) slightly further reduced microbial counts,
although the change was not statistically relevant. In addition, the reduction achieved by the 52%
NaCl tempering solution was not significantly different from the one obtained by the acetic,
citric, and propionic acid solutions at the 2.5% or 5.0% concentration levels. A saturated solution
will contain 26.5g NaCl in 100 g of water (28). Significantly high amounts of NaCl are needed to
cause bacteriostatic effects in foods; for instance, a 16.54% salt solution is needed to bring the
water activity to 0.90, the minimum required for bacterial growth (28), which explains the results
found here, since the concentration of NaCl used in the tempering water was higher than 16.54%,
thus may induce a bactericidal effect on wheat grain.
a
f f f f
de
bcd
abc
e d
e cde
de
bcd
e
e d
e ab
f
de
bcd
Page 96
87
Dhillon et al. (11) reported a 3.0 and 0.2 log CFU/g reduction in APC after washing
wheat kernels for 3 min with acetic acid (1.0%) and ozonated water (16.5 mg/L) at 2L/Kg,
respectively. Since an acidic pH may increase the dissolution of ozone in water, a powerful
oxidizing agent, Dhillon et al. (11) also treated wheat kernels with a combination of ozonated
water (20.5 mg/L) and acetic acid (1%) for 3 min. The addition of acetic acid enhanced the
antimicrobial power of the ozonated solution, although the reduction in APC achieved by this
treatment was not significantly different compared with acetic acid (1.0%) alone.
Ozone is widely used in the food industry as antimicrobial agent; therefore, the influence
of ozone on the microbial load of wheat grain has been the subject of interest of many
researchers. Ibanoglu (18) after washing wheat kernels with ozonated water (1.5 mg/L) for 30
min found a reduction of approximately 1 log CFU/g in aerobic mesophilic bacterial counts.
Dhillon et al. (9) used a 2-step tempering procedure with resting time of 6 hours after each step,
to temper durum wheat and hard red spring wheat using ozonated water at 10 and 16 mg/L.
However, ozone treatments did not significantly affect microbial load (less than 0.5 log CFU/g
reduction in APC) compared with distilled water tempering treatment. In a follow-up study,
Dhillon et al. (10) developed a fluidized bed system for wheat disinfection. In this later study, the
tempering solution that was a combination of acetic acid (0.5%) and ozonated water (26 mg/L)
was the most effective against APC, with an average reduction of 1.6 log CFU/g.
The effects of tempering treatments on Enterobacteriaceae population are shown in
Figure 2. Reduction trends of Enterobacteriaceae counts in wheat tempered with organic acids
and saline solutions were similar to those observed for APC counts. Tempering of wheat grain
with organic acids at the 1.0% concentration level resulted, on average, in a significant reduction
of 0.9 log CFU/g when compared to the initial counts of Enterobacteriaceae. As in APC, there
was no significant difference in the microbial reduction achieved by the organic acids at the 1.0%
concentration level. Increasing the citric and lactic acid concentration from 1.0 % to 2.5%
Page 97
88
0.0
0.5
1.0
1.5
2.0
2.5
3.0
3.5
4.0
4.5
5.0
Acetic acid Citric acid Lactic acid Propionic acid NaCl
Eb
lo
g1
0 C
FU
/g r
ed
uct
ion
Treatments
Control
1.0% v/v
2.5% v/v
5.0% v/v
26% w/v
52% w/v
significantly reduced the number of Enterobacteriaceae by 1.4 and 1.6 log CFU/g, respectively.
In contrast, increasing the acetic and propionic acid concentration from 1.0 % to 2.5% did not
significantly affect the population of Enterobacteriaceae. Nevertheless, there were no significant
differences in the reductions achieved between organic acids at the 2.5% concentration level.
There were significant differences between the concentrations tested for citric acid and
for lactic acid, where an increase in the concentration levels of these acids resulted in a greater
reduction of Enterobacteriaceae counts. Akbas et al. (2) found that 5ml/L lactic acid and 5g/L
citric acid solution reduced the numbers of Enterobacteriaceae in fresh-cut iceberg lettuce by 1.5
to 2.0 log CFU/g. The lowest Enterobacteriaceae counts were found in lactic acid-dipped lettuce.
Likewise, in this study the greatest reduction (2.7 log CFU/g) in the number of
Enterobacteriaceae when compared to the incoming wheat was achieved by lactic acid at 5.0%,
although not statistically different than the reduction achieved (2.3 log CFU/g) by acetic acid at
the same level. In fact, lactic acid exhibits a broad-spectrum of antimicrobial activity against
Gram-positive and Gram-negative bacteria including Enterobacteriaceae (2).
Figure 2. Effects of organic acids and saline solutions on Enterobacteriaceae (Eb) counts during
wheat tempering. Error bars denote ± standard deviation. One log reduction is equivalent to a
90% reduction in CFU per gram of wheat grain. Log reduction values with the same letter are not
significantly different (P >0.05).
g
g g
g g
def
cd
ab
f cd
e b
f c
a
def
cd
b
ef
c
Page 98
89
The tempering solution with 26% NaCl (~1% flour basis) reduced the
Enterobacteriaceae population by 0.9 log CFU/g, which was not significantly different than the
reduction achieved by the organic acid solutions at the 1.0% concentration level (Fig. 2).
Increasing the NaCl concentration from 26% to 52% (~2% flour basis) significantly reduced
Enterobacteriaceae counts (1.7 log CFU/g) compared to control. In addition, the reduction
achieved by the 52% NaCl tempering solution was not significantly different from the one
obtained by the organic acids at the 2.5% concentration level.
Populations of yeasts and molds in wheat, as affected by tempering treatments, are
represented in Figures 3 and 4, respectively. Similar reduction trends were observed in both
microbial populations. In general, tempering wheat with organic acid and saline solutions resulted
in a significant reduction in the initial population of yeasts and molds when compared to control.
The greatest reduction (4.7 log CFU/g) in the number of yeasts was achieved by lactic acid
treatment at the 5.0% level, which resulted in counts below the detection limit of the method for
this group of microorganisms (Fig. 3). However, the reduction was not significantly different than
the one achieved by acetic acid at the same concentration level. Similarly, the greatest reduction
(3.8 log CFU/g) in mold counts was achieved by the acetic acid, propionic acid, and lactic acid
treatments at the 5.0% concentration level, which also resulted in counts below the limit of
detection (Fig. 4).
Lactate compounds have demonstrated strong antifungal activity against Aspergillus spp.
(14), and acetic acid have shown to have a strong inhibition effect against many fungi (22). For
any given concentration, the greatest reduction in yeast and mold counts was achieved by the
acetic acid treatments. In fact, acetic acid was the most active chemical food preservative when
compared with other chemical preservatives in inhibiting the growth of food-associated fungi
(23).
Page 99
90
0.0
0.5
1.0
1.5
2.0
2.5
3.0
3.5
4.0
4.5
5.0
Acetic acid Citric acid Lactic acid Propionic acid NaCl
Yea
st l
og
10
CF
U/g
red
uct
ion
Treatments
Control
1.0% v/v
2.5% v/v
5.0% v/v
26% w/v
52% w/v
Figure 3. Effects of organic acids and saline solutions on yeast during wheat tempering. Error
bars denote ± standard deviation. One log reduction is equivalent to a 90% reduction in CFU per
gram of wheat grain. Log reduction values with the same letter are not significantly different (P
>0.05).
Similar reduction levels were reported by Dhillon et al. (10), although using a fluidized
bed system. Under the conditions tested by them, a combination of gaseous ozone (6 ppm), acetic
acid (0.5%), and ozonated water (26 mg/L) was the most effective in reducing yeast and mold
counts by 3.3 log CFU/g. In another study, Dhillon et al. (11) reported that a combination of
acetic acid (1.0%) and ozonated water (20.5 mg/L) was the most effective treatment with yeast
and mold reductions in the order of 4.1 log CFU/g.
In this study, there was significant difference between the concentrations evaluated for
acetic acid, lactic acid, and propionic acid; therefore, increasing the concentration levels of these
acids resulted in a greater reduction of yeast and mold counts (Fig. 3 and 4). Published reports
show that effectiveness of acetic acid increases as concentration increases and pH decreases (24),
which agrees with these findings. Doyle et al. (12) reported the antifungal activity of acetic acid
against Aspergillus spp., Penicillium spp., Rhizopus spp., and some strains of Saccharomyces.
hi
j j j j j
de
c ab
hi
hi
i
hi
ef
a
fg
d
bc
gh
Page 100
91
0.0
0.5
1.0
1.5
2.0
2.5
3.0
3.5
4.0
4.5
5.0
Acetic acid Citric acid Lactic acid Propionic acid NaCl
Mo
ld l
og
10
CF
U/g
red
uct
ion
Treatments
Control
1.0% v/v
2.5% v/v
5.0% v/v
26% w/v
52% w/v
Lind et al. (20) studied the antifungal activity of propionic, acetic and lactic acid produced by
propionibacteira, and reported that propionic acid, followed by acetic and lactic acid were the
most potent antifungal acid.
Tempering wheat with citric acid was the least effective treatment for reducing the
number of yeasts and molds. When comparing the reduction on yeast counts given by the citric
acid treatments, there was no difference among concentration levels. The reduction in mold
counts obtained from wheat after tempering with citric acid at 2.5% level were not different than
those obtained with the traditional tempering process using water (Fig. 4). These results are in
agreement with Pundir et al. (23) who found that citric acid was the least effective antimicrobial
against food associated fungi isolated from bakery products and pickles. The tempering solution
with 26% NaCl (~1% flour basis) reduced the yeast and mold populations by 1.4 and 1.0 log
CFU/g, respectively. Increasing the NaCl concentration level from 26% to 52% did not
significantly change the reduction in counts obtained for yeast and mold.
Figure 4. Effects of organic acids and saline solutions on mold counts during wheat tempering.
Error bars denote ± standard deviation. One log reduction is equivalent to a 90% reduction in
CFU per gram of wheat grain. Log reduction values with the same letter are not significantly
different (P >0.05).
d
e e e e e
b
a a
d
e c
d
c a
cd
b
a
cd
Page 101
92
Several report describe lower reduction in counts than the ones obtained in this study with
the most effective tempering solutions. Dhillon et al. (11) reported a 0.5 log CFU/g reduction of
yeast and mold counts in wheat after washing with ozonated water (16.5 mg/L). In the same
study, 1.9 log CFU/g reduction in yeast and mold counts was achieved with chlorinated water
(700 mg/L) washing. Similar results were shown by Ibanoglu (18), who found a slight reduction
in yeast and mold counts (0.4 log CFU/g) after washing hard and soft wheat with ozonated water
(1.5 mg/L) for 30 min. In an earlier study, Ibanoglu (17) also reported that tempering of wheat
with ozonated water (11.5 mg/L) resulted in 1.0 log CFU/g reductions in yeast and mold counts.
Reductions obtained with washing treatments may be the result of a combined antimicrobial
effect of ozone and/or chloride and the removal of more firmly attached soiling from the wheat
kernels.
When comparing the effect of ozonated water on the microbial load present in wheat and
produce like fruits and vegetables, ozonated water may be less effective on wheat, since the rough
surface and crevices of the kernels may partially shield microorganisms from the ozone (11).
However, although the washing treatments used by some authors may increase the exposure of
grain surfaces, resulting in uniform and quick contact of grain with antimicrobial agents, it has
the drawback of increasing the moisture content thus an additional drying step may be needed to
achieve an optimum milling moisture.
In conclusion, the results of this study revealed that organic acid and saline solutions
were capable of effectively reducing the microflora of wheat kernels when compared with the
traditional tempering process using water. Therefore, these solutions could be useful as surface
sanitizers while the kernels reach the optimum milling moisture, thus reducing the risk of
microbial contamination in the milled products. In general, lactic acid at 5.0% level was found to
be the most effective treatment to reduce the numbers of APC, Enterobacteriaceae, yeasts and
molds. Saline solutions were shown to be as effective as organic acid solutions at the lower
Page 102
93
concentrations tested. However, further studies are needed to define the effects of these tempering
solutions on the functional properties of flour, and to establish weather organic acids in
combination with sodium chloride would result in greater microbial reduction.
Page 103
94
REFERENCES
1. AACC International. 2012. Approved Methods of Analysis. (11th ed.). St. Paul, MN:
AACC International (Methods 10-10.02, 10-13.03, 44-15A)
2. Akbas, M.Y., Olmez, H. 2007. Effectiveness of organic acid, ozonated wáter and chlorine
dippings on microbial reduction and storage quality of fresh-cut iceberg lettuce. J. Sci.
Food Agric. 87:2609–2616.
3. AOAC. 2013. Approved Methods of Analysis. Enumeration of Enterobacteriaceae.
Methods 2003.01.
4. Beltran, D., Selma, M. V., Marin, A., Gil, M. I., 2005. Ozonated water extends the shelf
life of fresh-cut lettuce. Journal of Agricultural and Food Chemistry. 53:5654-5663.
5. Berghofer, L.K., Hocking, A.D., Miskelly, D., and Jansson, E. 2003. Microbiology of
wheat and flour milling in Australia. International Journal of Food Microbiology. 85:137.
6. Birck, N., Lorini, I., Scussel, V. Fungus and mycotoxins in wheat grain at post harvest.
International Working Conference on Stored Product Protection.
7. Deibel, K.E., Swanson, K.J. 2001. Cereal and cereal products. Microbiological
Examination of Foods (Ed PF Downes, K), American Public Health Association,
Washington DC, pp. 549- 552.
8. Desvignes, C., Chaurand, M., Dubois, M., Sadoudi, A., Abecassis, J., and Lullien-
Pellerin, V. 2008. Changes in common wheat grain milling behavior and tissue
mechanical properties following ozone treatments. Journal of Cereal Science. 47:245-
251.
9. Dhillon, B., Sandhu, H., Wiesenborn, D., Manthey, F., and Wolf-Hall, C. 2007. A
comparison between chlorinated water and ozonated water as an antimicrobial treatment
during tempering of wheat. American Society of Agricultural and Biological Engineers,
St. Joseph, MI. 1-10.
Page 104
95
10. Dhillon, B., Wiesenborn, D., Dhillon, H., and Wolf-Hall, C. 2010. Development and
evaluation of a fluidized bed system for wheat grain disinfection. Journal of Food
Science. 75:E372.
11. Dhillon, B., Wiesenborn, D., Wolf-Hall, C., and Manthey, F. 2009. Development and
evaluation of an ozonated water system for antimicrobial treatment of durum wheat.
Journal of Food Science. 74:E396.
12. Doyle MP, Beuchat LR, Montville TJ. 2002. Food Microbiology: Fundamentals and
Frontiers, 2nd ed. ASM Press, Washington, D. C., pp. 768.
13. Eglezos, S. 2010. Microbiological Quality of Wheat Grain and Flour from Two Mills in
Queensland, Australia. Journal of Food Protection. 73:1533-1536.
14. El-Gazzar, E.F., Rusul, G., Marth, E.H. 1987. Growth and aflatoxin production by
Aspergillus parasiticus NRRL 2999 in the presence of lactic acid and at different initial
pH values. J. Food Protection. 50:940-944.
15. EPRI. 2000. Ozone and UV for Grain Milling Systems. Rep. No. 1000591. EPRI, Palo
Alto, CA.
16. Heidolph, B. B., Ray, D. K., Roller, S., Koehler, P., Weber, J., Slocum, S., & Noort, M.
W. . 2011. Looking for my lost shaker of salt…replacer: Flavor, function, future. Cereal
Foods World. 65:5-19.
17. Ibanoglu, S. 2001. Influence of tempering with ozonated water on the selected properties
of wheat flour. J. Food Eng. 48:345.
18. Ibanoglu, S. 2002. Wheat washing with ozonated water: Effects on selected flour
properties. International Journal of Food Science Technology. 37:579.
19. Laca, A., Mousia, Z., Diaz, M., Webb, C., and Pandiella, S.S. 2006. Distribution of
microbial contamination within cereal grains. J. Food Eng. 72:332-338.
20. Lind H, Jonsson H, Schnürer J. 2005. Antifungal effect of dairy propionibacteria
contribution of organic acids. Int. J. Food Microbiol. 98:157-165.
Page 105
96
21. Maturin, L.J. and Peeler, J.T. 1998. Aerobic plate count. Ch. 3. In Food and Drug
Administration Bacteriological Analytical Manual, 8th ed. (revision A), Available at:
http://www.cfsan.fda.gov/-ebam/bam-3.html.
22. Moon, N.J. 1983. Inhibitation of the growth of acid tolerant yeasts by acetate, lactate and
propionate and their synergistic mixtures. J. Appl. Bacteriol. 55:453-460.
23. Pundir, R.K., Jain, P. 2011. Evaluation of five chemical food preservatives for their
antibacterial activity against bacterial isolates from bakery products and mango pickles. J.
Chem. Pharm. Res. 3(1):24-31.
24. Ray, B., Sandine, W.E. 1992. Acetic, propionic, and lactic acids of stater culture bacteria
as biopreservatives. In Food Biopreservatives of Microbial Origin, ed B. Ray, pp. 103-
136. Boca Raton, FL: CRC Press, Inc.
25. Riba, A., Mokrane, S., Mathieu, F., Lebrihi, A., and Sabaou,. N. 2008. Mycoflora and
ochratoxin A producing strains of Aspergillus in Algerian wheat. International Journal of
Food Microbiology 122, 85–92.
26. Richter KS, Dorneanu E, Eskridge KM, Rao C. 1993. Microbiological quality of flours.
Cereal Foods World. 38:367–369.
27. Ricke, S.C. 2003. Perspective on the Use of Organic Acids and Short Chain Fatty Acids
as antimicrobials. Poultry Science. 82:632-639.
28. Robinson, R.A., Stokes, R.H. 1959. Electrolyte solutions. The measurement and
interpretation of conductance, chemical potential and diffusion in solutions of simple
electrolytes. London: Butterworths.
29. Sabillón, L. 2014. Effect of the milling steps on the microbial load of wheat milled
products from different wheat varieties. Master Thesis, University of Nebraska-Lincoln.
30. Shelef, L. A., and J. Seiter. 2005. Indirect and miscellaneous antimicrobials. In
Antimocrobials in food. 3rd ed., edited by P. M. Davidson, J. N. Sofos, and B. A. Larry.
Boca Raton, FL: Taylor and Francis. 573-598.
Page 106
97
31. Smith, J.L., Maurer, M.J., Bencivengo, M.M., and Kunsch, C.A. 1987. Effect of sodium
chloride on uptake of substrate by Staphylococcus aureus 196E. Journal of Food
Protection. 50:968-974.
32. Sperber, W.H. 1983. Influence of water activity on foodborne bacteria: a review. Journal
of Food Protection. 46:142-150.
33. Sperber, W.H. 2007. Role of microbiological guidelines in the production and
commercial use of milled cereal grains: a practical approach for the 21st century. Journal
of Food Protection. 70:1041–53.
34. Tournas, V., Stack, M. E., Mislivec, P. B., Koch, H. A., & Bandler, R. 1998. Yeasts,
molds, and mycotoxins. In Bacteriological Analytical Manual, edition 8, revision A.
Available at:
http://www.fda.gov/Food/ScienceResearch/LaboratoryMethods/BacteriologicalAnalytical
ManualBAM/um071435.htm.
Page 107
98
PRE-MILLING INTERVENTIONS TO REDUCE THE MICROBIAL LOAD OF
STRAIGHT-GRADE AND WHOLE GRAIN FLOUR WITH MINIMAL IMPACT ON
FLOUR FUNCTIONALITY *
L. Sabillón, D.J. Rose, J. Stratton, R.A. Flores, and A. Bianchini
Department of Food Science and Technology
University of Nebraska – Lincoln, Lincoln, NE, USA
Corresponding author:
Andréia Bianchini, Department of Food Science and Technology
The Food Processing Center, University of Nebraska – Lincoln
University of Nebraska – Lincoln, Lincoln, NE, USA
Phone: (402) 472-3114, Fax: (402) 472-1693
[email protected]
* Scientific manuscript formatted to meet guidelines for the International Journal of
Food Microbiology
Page 108
99
ABSTRACT
The initial microbial load of the grain is a safety concern for wheat-based products. The purpose
of this study was to determine the efficacy of adding organic acids and NaCl to tempering water
to reduce microbial load in wheat prior to milling, and to determine the impact that these
treatments might have on the microbial quality and functional properties of straight-grade and
whole grain flours. To accomplish this, wheat was tempered to 15.5% moisture under controlled
(24h, 23-24°C, 60% RH), aseptic conditions by adding water (control) or tempering solutions
containing acid (acetic or lactic; 2.5% and 5% v/v) and NaCl (~1% and ~2% flour basis (fb)).
Wheat was analyzed before and after tempering for Aerobic Plate Counts (APC), yeasts, molds,
and Enterobacteriaceae (Eb). The microbial load of the tempered wheat was significantly
reduced by all organic acid-NaCl treatments. The combination of lactic acid (5%) and NaCl
(~2%) was the most effective against APC and Eb, with an average reduction of 4.3 and 4.7 log
CFU/g, respectively. After experimental milling, fractions were collected and recombined to
obtain straight-grade or whole grain flour. All combinations of organic acid-NaCl were effective
in reducing the microbial load of the final milled product. Even though some significant
differences in mixing, pasting, and baking properties were observed, their impact on functionality
was minimal. For example, whole grain flour from wheat tempered with acids at 5% required
longer times (5.3 min) for optimum dough development compared to the control (4.5 min).
Additionally, dough mixing tolerance in both types of flour was not affected, regardless the acid
level. When bread made with any of the straight-grade flour samples, the cell structure
characteristics of bread slides were uniform. Therefore, implementation of organic acids and
NaCl in tempering water provides milled products with improved microbiological quality,
without compromising functionality.
Page 109
100
1. INTRODUCTION
The safety level offered by wheat flour-based products has been questioned over the last
decade in light of several food safety incidents. Although regarded as a low-risk commodity for
microbial contamination, flour-based mixes have been implicated in foodborne disease outbreaks
caused by Salmonella and Escherichia coli O157:H7 infections (Gilbert et al. 2010; NZFSA,
2008; Neil, 2012). Furthermore, spore-forming Bacillus spp. and other spoilage microorganisms
(e.g., lactic acid bacteria, yeasts and molds) are among the microbial flora of wheat flour, which
have been associated with the spoilage of flour-containing foods (Sorokulova et al. 2003). Even
though the usual water activity of wheat milled products are not conducive to microbial growth,
microbial contaminants may survive at minimal metabolic activity levels representing a potential
health hazard (Eglezos, 2010).
Throughout the wheat production chain there is an ample opportunity for microbes to
colonize the surface of the grain; thus, wheat kernels usually harbor a large and varied microbial
flora (Laca et al. 2006). Indeed, these microorganisms are considered to be the primary
contamination source for milled products. The steps involved in the milling operations, including
cleaning, tempering, and grinding, have shown to have a minimal impact on the microbial load of
wheat grain (Seiler, 1986). Several studies have documented that the grinding process may cause
a redistribution of microbial contaminants across the milled fractions, being the germ and the
bran fractions where the microorganisms tend to be concentrated, although flour can still contain
a significant amount of microbial contamination (Berghofer et al. 2003).
The sanitary conditions during the tempering and grinding operations may also play an
important role in the ultimate safety and quality of milled products. Inspections surveys in
commercial milling operations have detected the presence of encrusted grain dust in the
tempering bins and build-up of flour residues within the mills, which may harbor a significant
Page 110
101
microbial load, thus increasing the risk of microbial contamination during processing (Berghofer
et al. 2003). Consequently, the final microbiological quality of wheat milled products can be
greatly influenced by these residues if they are not properly controlled.
The susceptibility of flour components (e.g., gluten and starch) to deterioration have
limited the number of treatments that may be applied, either to the wheat kernel or to the flour
itself, to improve safety. However, some methods have been evaluated to reduce the microbial
counts in wheat kernels prior to milling, including chlorination and ozonation of tempering water,
and irradiation of wheat kernels (Ibanoglu, 2002; Dhillon et al. 2010). In the previous chapter, the
value of adding antimicrobial agents such as organic acids and salt (NaCl) to tempering water as a
mean of reducing microbial contamination in wheat grain prior to milling was studied. In this
later study, the tempering solutions containing either lactic acid or acetic acid at 5.0% level were
remarkably effective at reducing microbial contamination.
Since the use of organic acid and saline solutions during tempering have shown
promising results in reducing the microbial load of wheat prior to milling, the objectives of this
study were (i) to evaluate the effectiveness of combining organic acid and salt (NaCl) to reduce
microbial load in hard wheat during tempering, (ii) to determine the impact that these treatments
might have on the microbiological quality and functional properties of straight-grade and whole
grain flour, and (iii) to evaluate if a consistent use of wheat tempered with these tempering
solutions would reduce microbial establishment within the mill.
2. MATERIALS AND METHODS
2.1 Materials
Hard red winter wheat (McGill) samples were obtained from the 2013 growing season in
the state of Nebraska, USA. Samples were provided by Husker Genetics, the University of
Nebraska-Lincoln Foundation Seed Division. Food grade lactic acid (85%) and sodium chloride
Page 111
102
were obtained from Fisher Scientific. Food grade glacial acetic acid was obtained from BDH
Chemicals.
2.2 Preparation of tempering solutions
Individual organic acids and salt (NaCl) were combined in an aqueous solution to
examine whether they showed any synergistic effects. Each organic acid (acetic or lactic, at a
concentration of 2.5% and 5% v/v) was combined with NaCl (at a concentration of 26% w/v and
52% w/v) to yield a total of 8 different treatment combinations. To prepare each organic acid/salt
solution, a 500 ml stock saline solution for each desired concentration was prepared by mixing
NaCl and sterile distilled water in appropriate proportions to yield a solution wherein the final salt
concentration was 0.26 g/ml (1% flour basis) or 0.52 g/ml (2% flour basis). Then, the respective
organic acid and the stock saline solution were mixed in appropriate proportions to yield a
solution (100 ml) wherein the final acid concentration was 2.5% and 5.0% (v/v) and the final salt
concentration was approximately 1% and 2% (flour basis, fb), respectively. The solutions were
always prepared fresh prior to tempering and under aseptic conditions.
2.3 Application of tempering solutions
The initial moisture content of the wheat samples was determined using a forced-air oven
method 44-15A (AACCI 2002). The amount of tempering solution needed was calculated based
on the initial moisture content of the wheat samples (12.2 %). Three samples (1000 g) for each
treatment were placed in sterile plastic bags and tempered to 15.5% moisture by adding sterile
distilled water (control) or tempering solutions containing acid (acetic or lactic; 2.5% and 5.0%
v/v) and NaCl (~1% and ~2% fb), under aseptic conditions (Biosafety cabinet). Tempering
solutions were applied to wheat using an atomizer to ensure even distribution. Samples were
shaken vigorously during the first two hours after the addition of tempering solutions and were
left to stand for 24 hr under controlled conditions (23-24°C and 60% relative humidity).
Page 112
103
Moreover, to evaluate the effectiveness of these solutions in reducing microbial establishment
within the mill, sixteen additional samples (1000 g) were tempered with a solution containing
lactic acid (5.0%) and NaCl (~1% fb) under the same conditions previously described.
2.4 Experimental milling
The milling experiment was limited to those samples tempered with solutions containing
a ~1% (fb) NaCl concentration. Nine hundred grams of each tempered wheat sample were milled
using an Buhler experimental mill (Buhler, Minneapolis, MN) according to method 26-21.02
(AACCI 2002). Milled fractions (flour, bran, and shorts) were collected in sterile plastic bags and
recombined in appropriate proportions in a tumbling mixer for 3 min to obtain straight-grade and
whole grain flour, respectively. The tumbling mixer consisted of a sterile cylindrical container,
which was held at a 45º angle and rotated at 6.7 rpm on a circular axis. To evaluate the
effectiveness in reducing the microbial load within the mill, sixteen consecutive samples
(tempered with lactic acid (5.0%) and NaCl (~1% fb)) were milled and the milled fractions were
collected in sterile plastic bags every three runs.
2.5 Evaluation of flour properties and functionality
2.5.1 pH and acidity of flour
pH and total titratable acidity of straight-grade and whole grain flour were determined
using the Thermo Scientific Orion 2-Star Benchtop pH meter. A 10g sample was blended with 90
ml distill water and the suspension was then titrated with a 0.1 mol/L NaOH to a final pH of 7.0.
The total titratable acidity was expressed as the amount (ml) of NaOH used.
2.5.2 Dough and gluten properties
Dough and gluten properties of straight-grade and whole grain flour were evaluated in
duplicate using a Ten g Mixograph (National Manufacturing, Lincoln, NE, USA) according to
Page 113
104
AACCI approved method 54.40. (AACC International 2002). The optimum water absorption
used during the experiment was estimated based on the equation Y= 1.5X + 43.6, in which X is
flour protein content on a 14% moisture basis; however, for whole grain flour a +1.8%
adjustment in the optimum water absorption was made (Bruinsma et al. 1978). Mixing time, peak
height, and right of peak slope were calculated by the Mixograph software (National
Manufacturing, Lincoln, NE, USA).
2.5.3 Pasting properties
Pasting properties of straight-grade and whole grain flour were evaluated by rapid
viscosity analyzer (RVA). A 3.50 g flour sample (adjusted to 14% moisture basis) and 25 ml
distilled water were mixed in an RVA canister by vigorously jogging the stirrer through the
sample for 30 s to avoid formation of clumps during the analysis. The mixed samples were then
analyzed by RVA (Model 4S, Newport Scientific, Warriewood, NSW, Australia), using Standard-
1 profile, following AACCI Approved Method 76-21 (AACC International 2002). Peak viscosity,
breakdown, final viscosity, setback, peak time and pasting temperature were recorded by the
RVA software (Newport Scientific, Warriewood, NSW, Australia).
2.5.4 Baking properties
Baking quality of straight-grade and whole grain flour were determined using the AACCI
approved methods 10-10B and 10-13A, respectively (AACC International 2002), except that the
water absorption and mixing time were estimated from the Mixograph data (National
Manufacturing, Lincoln, NE, USA; AACCI approved method 54.40). Addition of NaCl to the
flour mix formulation was adjusted to maintain equivalent levels of salt and flour in the dough of
the treatments and the control. Loaf volume was determined according to AACCI approved
method 10-05 (AACC International 2002) after cooling for about 1 hr. Loaves were sliced, 12.5
mm thick per slice, using an electric knife and a bread slicing guide (Black & Decker
Page 114
105
Corporation, Towson, MD USA). Bread slices were analyzed for firmness according to AACCI
approved method 74-10A (AACC International 2002), and their images were analyzed using a C-
Cell imaging system (Calibre Control International Ltd., UK) following the manufacturer’s
instructions.
2.6 Microbial analysis
Microbial analysis was performed in wheat samples before and after tempering, in each
milled fraction, and in the straight-grade and whole grain flour. To determine the microbial load
in each sample, 25 g of sample along with 225 ml of phosphate-buffered saline solution was
placed in a stomacher bag and mixed for 90 seconds. Serial decimal dilutions were prepared with
phosphate-buffered saline solution and analyzed for aerobic mesophilic bacteria (Aerobic Plate
Counts (APC)), yeasts, molds, and Enterobacteriaceae (Eb). For APC, dilutions were surface
plated in triplicate on Standard Methods Agar (SMA, Acumedia) and incubated at 35 C for 48 hr,
according to the U.S. Food and Drug Administration’s Bacteriological Analytical Manual
(Maturin et al. 1998). For yeast and mold counts, dilutions were spread plated in triplicate on
Dichloran Rose Begal Chloramphenicol agar (DRBC, Acumedia) and incubated at 25 C in the
dark for 5 days, according to the U.S. Food and Drug Administration’s Bacteriological Analytical
Manual (Tournas et al. 1998). Enterobacteriaceae counts were determined according to AOAC
official method 2003.01 (AOAC, 2013), using Petrifilm™ (3M Microbiology, St. Paul, MN).
Dilutions were inoculated in triplicate on Eb Petrifilm™ and incubated at 37 C for 24 hr. In
addition to APC, yeasts, molds, and Eb, each milled fraction was also analyzed for coliform and
generic E. coli according to the AOAC official method 991.14 (AOAC, 2013), using Petrifilm™
(3M Microbiology, St. Paul, MN). Dilutions were inoculated in triplicate on coliform Petrifilm™
and incubated at 37 C for 24 hr.
Page 115
106
2.7 Statistical analysis
Data was analyzed using the statistical software SAS version 9.3 (SAS Institute, Cary,
NC, USA). To determine differences among treatments, the dough, pasting and baking properties
of flour, as well as the microbiological counts obtained were assessed at a 0.05 level of
significance by analysis of variance (ANOVA), followed by a multiple comparison Tukey’s test.
3. RESULTS AND DISCUSSION
3.1 Combined antimicrobial effects
The previous manuscript showed that the addition of organic acids or NaCl to tempering
water was effective in reducing the microbial load of wheat prior to milling. Because the mode of
inhibition across the acid-antimicrobials is similar, but differs from salt, it was hypothesized that
the interactive effects of two different mechanisms of microbial inhibition would be more
effective in reducing microbial load. Therefore, in the present study the combination of organic
acid (lactic or acetic) and NaCl was evaluated.
In general, the antimicrobial effect of organic acids, including acetic and lactic, have been
attributed to the ability of its protonated (undissociated) form to freely permeate the cell
membrane, thus acidifying the cytoplasm and affecting the proton gradient and chemical transport
across the membrane (Ricke, 2003). However, the antimicrobial activity may vary among acids
depending upon concentration, dissociation level, environmental pH, and temperature (Ricke,
2003). On the other hand, the antimicrobial mechanisms of sodium chloride differ from organic
acids, and are mainly due to the reduction in water activity in the product and the toxicity of
sodium and chloride ions, when present in excess inside the cytoplasm (Shelef et al. 2005).
Moreover, injury of bacterial cells at high concentrations of NaCl could be due to extreme
plasmolysis, resulting in indirect damage to the cell outer membrane (Smith et al. 1987).
Page 116
107
0.0
0.5
1.0
1.5
2.0
2.5
3.0
3.5
4.0
4.5
5.0
Acetic acid + NaCl Lactic acid + NaCl
AP
C l
og
10
CF
U/g
red
uct
ion
Treatments
Control
2.5% (v/v) + 1.0% (fb)
2.5% (v/v) + 2.0% (fb)
5.0% (v/v) + 1.0% (fb)
5.0% (v/v) + 2.0% (fb)
The effects of tempering solutions containing a combination of organic acid and NaCl, on
the total aerobic mesophilic microflora are shown in Figure 1. The mesophilic bacterial
population present in wheat was reduced significantly by all organic acid-NaCl treatments. The
combination of lactic acid (5.0%) and NaCl (~2.0%) was the most effective against APC with an
average reduction of 4.3 log CFU/g. In contrast, tempering wheat with a combination of acetic
acid-NaCl was, in general, the least effective treatments for reducing the number of mesophilic
bacteria, with reductions ranging from 1.9 to 2.6 log CFU/g.
The previous manuscript demonstrated the ability of individual organic acids and NaCl to
reduce the microbial load of wheat during tempering. In such a study, tempering solutions
containing lactic acid at 2.5% and 5.0% (v/v) reduced aerobic plate counts by 1.4 and 2.0 log
CFU/g, respectively. Similarly, solutions containing NaCl at the concentration levels of 1% and
2% (flour basis) produced a reduction in bacterial counts by 1.0 and 1.4 log CFU/g, respectively.
Figure 1. Effect of the combined addition of organic acid and NaCl in tempering water on
reducing aerobic plate counts (APC). Error bars denote ± standard deviation. One log reduction is
equivalent to a 90% reduction in CFU per gram of wheat grain. Log reduction values with the
same letter are not significantly different (P >0.05).
f f
e
d
d
e
c
d c
b b
a
Page 117
108
In the present study, the combined effect of lactic acid and NaCl on reducing APC was
significantly greater than the individual effect of the two antimicrobial compounds alone at any
given concentration (Fig. 1). When different concentrations of NaCl (~ 1.0% and 2.0% fb) were
added to the solution containing 5.0% lactic acid, an additional reduction in APC was observed
compared to lactic acid alone. The observed additional reductions varied from 1.5 (5.0% lactic
acid + ~1.0% NaCl) to 2.3 log CFU/g (5.0% lactic acid + ~2.0% NaCl). Interestingly, increasing
the NaCl concentration at any given lactic acid level significantly further reduced the microbial
counts. The reductions obtained by all the lactic acid-NaCl combination treatments were
significantly greater than the algebraic sum of the reductions obtained by the individual
antimicrobial agent reported in the previous manuscript (Sabillón, 2014), which suggests a
synergistic interaction. A synergistic interaction occurs when the effect of two compound taken
together is greater than the sum of their separate effect at the same concentration levels.
The previous study reported a reduction of 1.4 and 1.7 log CFU/g in APC using
tempering solutions containing acetic acid at the concentration levels of 2.5% and 5.0%,
respectively (Sabillón, 2014). Adding NaCl at 1.0% or 2.0% (fb) to the tempering solutions
containing acetic acid slightly further reduced the mesophilic bacteria population compared with
the previous study (Sabillón, 2014). However, increasing the acetic acid concentration from 2.5%
to 5.0% at any given NaCl level did not affect significantly the microbial counts (Fig. 1). Unlike
the combination lactic acid-NaCl, the reductions in APC obtained by any given combination of
acetic acid-NaCl were not significantly different from the algebraic sum of the reductions
achieved by their individual parts, which suggests at the most an additive interaction.
Possible mechanisms underlying the antimicrobial activity of acetic acid are similar to
lactic acid, in which the undissociated form of the acid can also traverse the lipid membrane and
release protons into the cytoplasm (Guldfeldt et al. 1998); however, the antimicrobial activity
Page 118
109
vary with different acids what could explain the different results between acetic and lactic acid
reported here.
Previous studies have shown lower levels of microbial reduction than in this experiment.
For example, the effect of ozonated or chlorinated washing on microbial load in wheat at different
concentration levels was investigated by Dhillon et al. (2009). At 16.5 mg/L ozone concentration,
the washing treatment (2L/Kg) reduced APC by 0.2 log CFU/g. Ibanoglu (2002) reporter a
reduction of 1.0 in APC after washing wheat kernels with ozonated water (1.5 mg/L) for 30 min.
Figure 2 illustrates the effect of tempering treatments on Enterobacteriaceae population.
The greatest reduction (4.7 log CFU/g) in Eb counts was achieved by lactic acid-NaCl treatments,
with one of the combinations potentially being able to reduce Eb population even more since it
resulted in counts below the limit of detection. As in APC, in general, the least effective
treatments for reducing the number of Eb were the tempering solutions containing a combination
of acetic acid and NaCl.
In the previous manuscript reduction levels in Eb counts by 1.6 and 2.7 log CFU/g using
tempering solutions containing lactic acid at 2.5% and 5.0% level, respectively, were reported.
Likewise, tempering solutions containing NaCl at the concentration levels of 1% and 2% (flour
basis) reduced Eb counts by 1.5 and 2.3 log CFU/g, respectively. In the same study, reductions of
1.5 and 2.3 log CFU/g in Eb counts were achieved by tempering solutions containing acetic acid
at the concentration levels of 2.5% and 5.0%, respectively.
Page 119
110
0.0
0.5
1.0
1.5
2.0
2.5
3.0
3.5
4.0
4.5
5.0
Acetic acid + NaCl Lactic acid + NaCl
Eb
lo
g1
0 C
FU
/g r
ed
uct
ion
Treatments
Control
2.5% (v/v) + 1.0% (fb)
2.5% (v/v) + 2.0% (fb)
5.0% (v/v) + 1.0% (fb)
5.0% (v/v) + 2.0% (fb)
Figure 2. Effect of the combined addition of organic acid and NaCl in tempering water on
reducing Enterobacteriaceae counts (Eb). Error bars denote ± standard deviation. One log
reduction is equivalent to a 90% reduction in CFU per gram of wheat grain. Log reduction values
with the same letter are not significantly different (P >0.05).
As observed with the reductions in APC, a similar synergistic effect between lactic acid
and NaCl was observed for Eb counts. The addition of NaCl, regardless the concentration level,
to the tempering solution containing lactic acid at 5.0% caused a significant and synergistic
additional reduction in Eb counts when compared to lactic acid alone. However, this synergistic
effect was not observed by the combination containing lactic acid (2.5%) and NaCl (~1.0%).
Even though the Eb counts were significantly further reduced by the addition of NaCl, this
reduction was not bigger than the additive effect of both antimicrobials. Likewise, the reductions
in the number of Eb obtained by any given combination of acetic acid-NaCl were not
significantly different from the algebraic sum of the reductions achieved by their individual parts.
In fact, the addition of NaCl at 1.0% to the tempering solutions containing acetic acid it seems not
to have an impact, since the reduction in Eb counts was very similar when compared to the
reduction achieved by the acetic acid alone in the previous manuscript (Sabillón, 2014).
f f
e
d
c b
c
a a a
Page 120
111
The permeabilizing nature of the protonated form of lactic acid not only reduces the
intracellular pH and disrupt the transmembrane proton-motive force, but also has a potent outer
membrane-disintegrating effect on Gram-negative bacterial cells by releasing lipopolysaccharide
of the outer layer, thus increasing the permeability of the cell membrane (Alakomi et al. 2000). A
synergistic antimicrobial effect against enteric pathogens was reported with a combination of
lactic acid and copper. Ibrahim et al. (2008) found that the effectiveness of a 0.2% lactic acid
treatment on inhibiting the growth of Salmonella spp. and E. coli O157:H7 on carrot juice was
increased when combined with copper sulfate (50 ppm). When a combination of lactic acid
(0.2%) and copper (40 ppm) was sprayed on the surface of previously inoculated lettuce and
tomatoes with E. coli O157:H7, the population of E. coli was reduced significantly by 3.93 and
3.39 log CFU/g, respectively (Gyawali et al. 2011). The authors of these studies suggested that
the destabilization of cell membrane caused by lactic acid and its permeabilizer properties
facilitate the entrance of copper ions into the bacterial cells which cause a toxic effect, therefore
producing a synergistic effect against enteric pathogens. The synergistic effect observed between
lactic acid and NaCl in the present study may be explain by the disruptive action of the lactic acid
in the outer cell membrane that may have contributed to a greater diffusion and accumulation of
NaCl ions into the cytoplasm, thus causing a toxic effect.
The effect of tempering treatments on the populations of yeasts and molds are represented
in Figures 3 and 4, respectively. The tempering solution containing either acetic or lactic acid at
the 5.0% level, regardless the NaCl concentration, were the most effective in reducing the number
of yeasts and molds originally present in wheat.
Page 121
112
0.0
0.5
1.0
1.5
2.0
2.5
3.0
3.5
4.0
4.5
5.0
Acetic acid + NaCl Lactic acid + NaCl
Yea
st l
og
10
CF
U/g
red
uct
ion
Treatments
Control
2.5% (v/v) + 1.0% (fb)
2.5% (v/v) + 2.0% (fb)
5.0% (v/v) + 1.0% (fb)
5.0% (v/v) + 2.0% (fb)
Figure 3. Effect of the combined addition of organic acid and NaCl in tempering water on
reducing yeast counts. Error bars denote ± standard deviation. One log reduction is equivalent to
a 90% reduction in CFU per gram of wheat grain. Log reduction values with the same letter are
not significantly different (P >0.05).
The previous manuscript reported a reduction of 2.3 and 4.7 log CFU/g in yeast counts
using tempering solutions containing lactic acid at the concentration levels of 2.5% and 5.0%,
respectively (Sabillón, 2014). In addition, these tempering solutions also achieved a reduction in
mold counts of 1.5 and 3.4 log CFU/g, respectively. Although, adding NaCl at 1.0% or 2.0% (fb)
to the tempering solutions containing lactic acid at 2.5% further reduced the yeast and mold
counts, compared with lactic acid alone (Sabillón, 2014), the reduction achieved was not greater
than the sum of the individual effects, which suggests at the most an additive interaction.
In contrast, an antagonist effect of acetic acid and sodium chloride was observed for yeast
and mold counts when NaCl, either at 1.0% or 2.0% (fb), was added to the solutions containing
acetic acid at 2.5%, since the best reductions achieved for yeasts (~2.4 log CFU/g) and molds
(~1.8 log CFU/g) with the combination of antimicrobials (acid/NaCl) was lower than the
previously reported reduction of 3.9 and 3.4 log CFU/g, respectively, achieved by acetic acid
alone (Sabillón, 2014).
e e
d
d
a
b a
b
c
b
c
a
b a
Page 122
113
Sodium chloride (NaCl) has been shown to work as a synergist and an antagonist under
different conditions with other antimicrobial components, such as acetic acid. An antagonist
effect of acetic acid and sodium chloride has been reported, in which E. coli O157:H7 and
Salmonella were found to be protected by the hyperotonicity from acetic acid (Chapman et al.
2009; Lee et al. 2010). Also, combinations of acetic acid and salt were less effective at reducing
E. coli O157:H7 counts in cucumber puree than did treatment with acetic acid alone (Lee et al.
2010). A similar antagonistic effect observed for the combination of lactic acid and salt for E. coli
and E. coli O157:H45 has been reported by Casey et al. (2002). According to the authors of these
studies, several physiological responses of the microorganisms to a hypertonic and acidic
environment could explain the protective effect observed. Bacteria may be able to maintain
intracellular pH in the presence of NaCl by coupling the import of Na+ ions to the H
+ export
(Casey et al. 2002). Hypertonic solutions containing 10% sucrose or 3% NaCl were more
protective than 0.5% NaCl. This suggests that an increase in osmotic pressure may induce a
slightly plasmolysed physiological state, thus diffusion of protonated acetic acid into the
cytoplasm may be slowed by a more rigid cell membrane (Chapman et al. 2009).
The reduction levels in microbial load obtained in the present study are similar to those
reported by Dhillon et al. (2009), who studied the influence of combining ozone with acetic acid
in tempering water, and found that washing wheat with a combination of acetic acid (1.0%) and
ozonated water (20.5 mg/L) was remarkably effective against yeast and mold, with a reduction of
4.1 log CFU/g. Similar reduction levels were obtained in a follow-up study by Dhillon et al.
(2010), although using a fluidized bed system. In this later study, washing wheat with an
increased concentration of ozone (26 mg/L) in combination with acetic acid (0.5%) was effective
in reducing the number of APC and yeasts/molds, with an average reduction of 3.3 log CFU/g.
Page 123
114
0.0
0.5
1.0
1.5
2.0
2.5
3.0
3.5
4.0
4.5
5.0
Acetic acid + NaCl Lactic acid + NaCl
Mo
ld l
og
10
CF
U/g
red
uct
ion
Treatments
Control
2.5% (v/v) + 1.0% (fb)
2.5% (v/v) + 2.0% (fb)
5.0% (v/v) + 1.0% (fb)
5.0% (v/v) + 2.0% (fb)
Figure 4. Effect of the combined addition of organic acid and NaCl in tempering water on
reducing mold counts. Error bars denote ± standard deviation. One log reduction is equivalent to
a 90% reduction in CFU per gram of wheat grain. Log reduction values with the same letter are
not significantly different (P >0.05).
Therefore, combinations of lactic acid and acetic acid with NaCl resulted in different
antimicrobial effects against different groups of microorganisms. The antimicrobial synergism
observed against certain groups of the wheat microbial flora, for example with the combinations
of lactic acid and NaCl could be explained by the permeabilizing and disrupting ability of lactic
acid in the cell membrane, thus facilitating the entrance and accumulation of Na+ and Cl
- ions into
the cytoplasm, which eventually results in a cascade of events that is catastrophic to microbial
cell viability. On the other hand, the antagonist or in some cases additive effect observed by the
combination of acetic acid and NaCl, could be explained by an increase in membrane rigidity,
thus slowing the diffusion of acetic acid into the cytoplasm.
d d
c c
a a
b
c
a
b a a
Page 124
115
3.2 Effect of tempering solutions on reducing microbial load within the mill
Once conditioned, wheat passes through the various systems in the mill to separate the
endosperm from the outer grain layers and to reduce the particle size of the endosperm fractions
(Posner et al. 1997). The initial process in wheat grinding is the break system, which is designed
to remove the endosperm from the bran and germ by the action of corrugated rolls. The ground
material is then separated by size and density by a set of sieves or purifiers. The large endosperm
particles are reduced into fine particle of flour in the reduction system by the action of smooth
rolls. The isolated bran and germ are further process in the millfeed system to remove any
adhered endosperm and to purify and separate each fraction.
The milling process may vary among milling operations depending upon the type of
wheat used and the end-use of the milled product. However, regardless of the variations in the
milling system, wheat kernels experience a shearing action as well as a crushing action to break
apart the bran and endosperm, and later in the process the isolated endosperm also experiences a
crushing action to reduce the particle size. This grinding operation creates a considerable amount
of heat; hence moisture condensation is likely to occur throughout the milling system, especially
in the break and reduction rolls, which may lead to build-up of flour residues inside the milling
equipment (Berghofer et al. 2003).
Wheat kernels usually harbor a large and varied microbial flora, which are usually not
affected by the traditional cleaning and tempering procedures prior to milling (Berghofer et al.
2003). Therefore, wheat entering the milling system may contain significant amounts of microbial
contaminant, which may become established in the build-up residues and in the surface of the
milling equipment, thus increasing the risk of microbial contamination during milling. Berghofer
et al. (2003) reported that 47 out of 58 wheat samples tested positive for Bacillus cereus;
however, after milling a higher proportion of milled products (93% of flour and 94% of bran
Page 125
116
samples) tested positive for B. cereus, thus indicating that B. cereus spores may be present in the
milling equipment.
Figure 5 illustrates the postprocessing contamination levels of wheat milled products
during sixteen consecutive runs in a Buhler experimental mill. The wheat entering the milling
system was of a superior microbiological quality, since the tempering solution containing lactic
acid (5.0%) and NaCl (~1.0%), which reduced the microbial population of wheat kernels to
below the limit of detection used for this evaluation (data not shown). Since microbial
contamination could not be detected in wheat after tempering, it was hypothesized that a
consistent use of this wheat, over time, would reduce microbial establishment within the mill.
Target microorganisms that were not detected in wheat grain after tempering, were
detected in all milled fractions after milling, which suggested a recontamination as wheat passed
through the various systems in the mill (Fig. 5). Since the microbial load is concentrated in the
surface of the grain, the mill sections where the bran and germ pass through may be expected to
be the most contaminated sections of the mill. Indeed, as the wheat passed through the mill on the
first run the fractions that were recontaminated the most were the germ and the bran fractions. For
any given fraction, the least reduction in microbial counts was observed for APC and molds.
After sixteen consecutive runs, the APC counts in the germ fraction were reduced from 5.2 to 2.9
log CFU/g. However, as a general trend, as wheat samples were milled in consecutive runs, the
microbial load within the mill was reduced by the wheat samples as indicated by the microbial
load of each milled fraction. After sixteen consecutive runs, the yeast and Eb counts were below
the detection limit used for evaluation of these two groups of microorganisms in all milled
fractions.
Page 126
117
In a Buhler experimental mill, coarse bran particles comes off the top of the sieves of the
last break stage, while the germ (shorts) comes off the top of the sieves of the last reduction stage
(Posner et al. 2005). Among milled fractions, the germ fraction spends the highest amount of time
in the milling system and also contains the highest amount of lipids (~11%), which could explain
why this fraction suffered the most recontamination after the first run and in general required the
most amount of runs to allow for a reduction in its microbial load.
Therefore, these results suggests that the use of wheat with a higher microbiological
quality, over time, may contribute to reduce the microbial establishment within the mill, thus
reducing the risk of microbial contamination or recontamination of the milled fractions during
processing.
Page 127
118
0.0
1.0
2.0
3.0
4.0
5.0
6.0
1 4 7 10 13 16
log
10
CF
U/g
Run#
Germ fraction APC
Eb
Coliform
Yeasts
Molds
0.0
1.0
2.0
3.0
4.0
5.0
6.0
1 4 7 10 13 16
log
10
CF
U/g
Run#
Bran fraction
APC
Eb
Coliform
Yeasts
Molds
0.0
1.0
2.0
3.0
4.0
5.0
6.0
1 4 7 10 13 16
log
10
CF
U/g
Run#
Break flour
APC
Eb
Coliform
Yeasts
Molds
0.0
1.0
2.0
3.0
4.0
5.0
6.0
1 4 7 10 13 16
log
10
CF
U/g
Run#
Reduction flour
APC
Eb
Coliform
Yeasts
Molds
Figure 5. Microbial load of different wheat milling end products during sixteen consecutive runs
in a Buhler experimental mill. a APC, Aerobic plate counts; Eb, Enterobacteriaceae.
a
Page 128
119
3.3 Effect of tempering solutions on the microbiological quality of flour
The microbiological quality and properties of flour were examined on all tempering
solutions containing ~1% NaCl. Although effective as antimicrobial treatment, the combinations
using ~2% NaCl were not included for further analysis as they presented saturation issues (lack of
ability to completely dissolve the salt content); making them not useful in larger scale from a
practical standpoint.
Table 1 illustrates the microbial load of straight-grade and whole grain flour obtained
from the different treatments. All combinations of organic acid-NaCl were effective in reducing
the microbial load of the final milled product. In general, whole grain flour presented higher
microbial counts than straight-grade flour. Since the microbial contaminants are concentrated in
the bran, it was expected that the microbiological quality of whole grain flour would be lower
than the flour obtained just from the inner endosperm. Tempering solutions containing organic
acids at the 5.0% level were the most effective in reducing the number of yeasts, and molds in the
whole grain flour.
Table 1. Mean values and standard deviation for the microbial load of straight-grade and whole
grain flour 1
Flour type Treatments 2
Final Counts (Log CFU/g) 3
APC Yeasts Molds Eb
Straight-
grade flour
Control (water) 3.27 (0.03)a 4 2.80 (0.08)a 2.59 (0.03)a 2.37 (0.10)a
Lactic acid 2.5% 2.62 (0.22)b 1.54 (0.13)b 2.07 (0.16)b 1.81 (0.18)bc
Lactic acid 5.0% 2.28 (0.07)c 1.07 (0.19)c 1.51 (0.16)c 1.56 (0.27)bc
Acetic acid 2.5% 2.59 (0.12)bc 1.37 (0.04)bc 1.95 (0.03)b 1.99 (0.21)b
Acetic acid 5.0% 2.45 (0.06)bc 1.13 (0.10)c 1.34 (0.10)c 1.49 (0.13)c
Whole
grain flour
Control (water) 4.39 (0.04)a 3.64 (0.10)a 3.00 (0.03)a 3.12 (0.03)a
Lactic acid 2.5% 3.39 (0.12)b 1.96 (0.11)b 2.34 (0.10)b 2.64 (0.10)b
Lactic acid 5.0% 3.26 (0.08)b 1.23 (0.16)c 1.73 (0.13)c 2.28 (0.15)c
Acetic acid 2.5% 3.48 (0.16)b 1.91 (0.05)b 2.26 (0.01)b 2.64 (0.09)b
Acetic acid 5.0% 3.32 (0.10)b 1.22 (0.03)c 1.88 (0.12)c 2.43 (0.10)bc 1 Values denote mean±(standard deviation)
2 The tempering treatments also contain ~1.0% NaCl, except the control
3 APC, Aerobic Plate Counts; Eb, Enterobacteriaceae
4 Means followed by the same letter, within the same column and type of flour, are not
significantly different (p > 0.05).
Page 129
120
3.4 Effect of tempering solutions on flour properties and functionality
3.4.1 pH and acidity of straight-grade and whole grain flour
Table 2 summarizes the pH and acidity of straight-grade and whole grain flour obtained
from the different treatments. As a general trend, as the acid concentration increased from 2.5 to
5.0% the pH of the flour decreased and the total acid concentration (titratable acidity) increased,
except for lactic acid treatments in straight-grade flour. The titratable acidity provides a good
estimate of the total acid content, and based on the results the organic acids used in tempering
solutions seem to be concentrated in the outer bran layer of the kernel, since the acid content in
whole grain flour was higher than in straight-grade flour.
Table 2. Mean values and standard deviation for pH and acidity of straight-grade and whole grain
flour 1
Test Treatments Flour type
Straight-grade flour Whole grain flour
Flour pH
Control (water) 5.74 (0.04)a 2 6.25 (0.02)a
Lactic acid 2.5% + NaCl 1.0% 5.73 (0.02)a 5.79 (0.02)b
Lactic acid 5.0% + NaCl 1.0% 5.58 (0.01)b 5.51 (0.05)c
Acetic acid 2.5% + NaCl 1.0% 5.40 (0.02)c 5.74 (0.01)b
Acetic acid 5.0% + NaCl 1.0% 5.28 (0.02)d 5.41 (0.02)d
Tritratable
Acidity
(ml 0.1N NaOH)
Control (water) 1.50 (0.28)c 1.53 (0.07)e
Lactic acid 2.5% + NaCl 1.0% 1.43 (0.06)c 2.90 (0.00)d
Lactic acid 5.0% + NaCl 1.0% 1.60 (0.00)c 4.23 (0.15)b
Acetic acid 2.5% + NaCl 1.0% 2.00 (0.00)b 3.16 (0.06)c
Acetic acid 5.0% + NaCl 1.0% 2.28 (0.04)a 4.59 (0.02)a 1 Values denote mean±(standard deviation)
2 Means followed by the same letter, within the same column and test, are not significantly
different (p > 0.05).
However, trace amounts of acid, especially acetic acid, seems to be able to traverse the
outer layer and reach the inner endosperm, since the total acid content in the straight-grade flour
obtained from wheat tempered with acetic acid was higher than the flour obtained from lactic acid
treatments and the control.
Page 130
121
Food labeling regulations is an important part that needs to be addressed when adding
additives to foods or their processing. The Code of Federal Regulations 21CFR101.100 provide
guidelines about the exemptions from food labeling requirements regarding processing aids and
incidental additives. According to the code, incidental additives that are present in a food at
insignificant levels and do not have any technical or functional effect in that food may be exempt
from compliance with the food labeling requirements. According to 21CFR101.00, incidental
additives are: ‘‘substances that are added to a food during processing, are converted into
constituents normally present in the food, and do not significantly increase the amount of the
constituents naturally found in the food’’. Therefore, based on the total acid content found in the
flour samples, straight-grade flour tempered with 2.5% or 5.0% lactic acid in combination with
~1.0% NaCl would not require labeling declaration; however, all the other treatments, especially
the ones applied to produce whole grain flour might require labeling declaration, since the acids
are retained by the outer layers of the grain (bran), it is added back to the flour when producing
whole grain flour which leads to an increase in the amount of acid naturally present in the wheat
kernel.
3.4.2 Dough and gluten properties
The mixing properties of straight-grade and whole grain flour are shown in Table 3.
Whole grain flour from wheat tempered with acetic acid at 5.0% required longer time (5.3 min)
for optimum dough development (peak time) compared to the control (4.5 min). In contrast,
organic acid-NaCl treatments did not affect dough-development time for straight-grade flour.
Galal et al. (1978) reported that a combination of six organic acids isolated from sourdough and
NaCl (1.5%) increased dough-development time and dough stability of hard red winter wheat
flour, although using a Farinograph. Similar results were also observed by Bakhoum et al. (1982),
Page 131
122
who found that mixing time and stability were increased as acid and salt were added to hard red
winter flour.
Straight-grade flour obtained from all treatments showed higher maximum force for
mixing than the control flour (peak height), but that was not observed in whole grain flour.
Additionally, dough mixing tolerance (right of peak slope) in both straight-grade and whole grain
flour was not affected, regardless the acid level.
No significant differences were found in the water absorption between the different
treatments in the straight-grade flour. However, whole grain flour obtained from wheat tempered
with acetic acid at 5.0% showed a lower water absorption compared to the control flour, which
may account for the longer time required to reach optimum dough development (peak time).
Galal et al. (1978) found that the water absorption decreased significantly when organic acid and
NaCl were added to the flour, regardless the level of NaCl (1.0 to 1.5%). The author argued that
acids would create a repulsive force by increasing the number of positively charged sites in the
protein structure thus causing the coiled part of the molecule to unfold, while NaCl would tighter
the unfolded part of the protein by suppressing the repulsion force, thus reducing the water
absorption.
Results presented here suggest that even though some significant differences in mixing
properties were observed, their impact on functionality was minimal. Perhaps because organic
acids seems to be retained by the bran (Table 2), slight variations, if any, in mixing properties are
more likely to occur in whole grain flour than in straight-grade flour.
Page 132
123
Table 3. Mean values and standard deviation for dough and gluten properties of straight-grade
and whole grain flour 1
Mixograph Treatments
Flour Type
Parameter Straight-grade flour Whole grain flour
Peak Time
(min)
Control (water) 5.75 (0.32)a 2 4.48 (0.61)b
Lactic acid 2.5% + NaCl 1.0% 5.58 (0.41)a 4.61 (0.24)ab
Lactic acid 5.0% + NaCl 1.0% 5.29 (0.43)a 5.05 (0.35)ab
Acetic acid 2.5% + NaCl 1.0% 5.10 (0.36)a 4.68 (0.26)ab
Acetic acid 5.0% + NaCl 1.0% 5.23 (0.28)a 5.32 (0.73)a
Peak Height
(%)
Control (water) 49.36 (0.87)b 45.33 (1.00)a
Lactic acid 2.5% + NaCl 1.0% 51.55 (2.02)a 45.85 (1.23)a
Lactic acid 5.0% + NaCl 1.0% 53.18 (0.48)a 45.56 (0.69)a
Acetic acid 2.5% + NaCl 1.0% 52.31 (0.44)a 45.58 (0.99)a
Acetic acid 5.0% + NaCl 1.0% 52.41 (0.69)a 45.95 (1.03)a
Right of Peak
Slope
(%/m)
Control (water) -1.08 (0.51)a -0.88 (0.47)a
Lactic acid 2.5% + NaCl 1.0% -0.52 (1.16)a -1.42 (1.04)a
Lactic acid 5.0% + NaCl 1.0% -1.23 (0.59)a -1.42 (0.75)a
Acetic acid 2.5% + NaCl 1.0% -0.43 (1.14)a -1.05 (1.05)a
Acetic acid 5.0% + NaCl 1.0% -1.16 (0.64)a -1.58 (0.65)a
Predicted Water
Absorption
(%)
Control (water) 57.14 (0.01)a 64.35 (0.18)a
Lactic acid 2.5% + NaCl 1.0% 57.13 (0.01)a 64.13 (0.14)ab
Lactic acid 5.0% + NaCl 1.0% 57.12 (0.03)a 64.13 (0.19)ab
Acetic acid 2.5% + NaCl 1.0% 57.11 (0.06)a 64.16 (0.05)ab
Acetic acid 5.0% + NaCl 1.0% 57.12 (0.02)a 64.10 (0.09)b 1 Values denote mean±(standard deviation)
2 Means followed by the same letter, within the same column and Mixograph parameter, are not
significantly different (p > 0.05).
Page 133
124
3.4.3 Pasting properties
Pasting properties of straight-grade and whole grain flour are presented in Table 4. The
peak viscosity indicates the water-binding capacity of the starch granules or mixtures, and this
parameter in the straight-grade flour obtained from wheat tempered with acetic acid at the 5.0%
level did show a significant reduction in the peak when compared to the control flour. Moreover,
the use of organic acids and NaCl, at any concentration level, did not significantly affect the peak
viscosity of whole grain flour compared to the control flour. Published reports suggested a
significant increase in the peak height of wheat starch with the inclusion of NaCl (1 to 3.5%)
(Ganz, 1965; Medcalf et al. 1966; D'Appolonia, 1972). The authors of these studies argue that the
presence of NaCl causes the starch granules to remain intact for a longer period of time before
breaking apart. However, in the presence of high ascorbic acid concentrations, a decrease in peak
height was observed in starch mixtures by D'Appolonia (1972), who attributed the change in the
pasting characteristics to accelerated hydration of the starch. In the present study, in general, no
such changes were observed possibly because the organic acids and NaCl were not directly
applied to the flour itself and the final organic acid and NaCl concentration in the flour was not
enough to cause a detrimental effect.
Once the starch granules reach peak viscosity, a progressive decrease in viscosity occurs
as a result of the physical destruction of swollen starch granules under constant high temperature
and mechanical shear stress. The breakdown viscosity (difference between “peak viscosity” and
“trough viscosity”) represents the granules’ susceptibility to applied shear and heat. Based on
results shown in Table 4, no appreciable differences were noted in the breakdown viscosity of the
straight-grade and whole grain flour in any of the treatments compared to the control flour.
The final viscosity indicates the ability of the starch granules or mixtures to form a
viscous paste or gel after cooking and cooling. In addition, it is largely determined by the
Page 134
125
retrogradation tendency of the soluble amylose on cooling (Olkku et al. 1978). The final viscosity
of the straight-grade flour obtained from wheat tempered with acetic acid at the 5.0% level was
significantly lower than the one obtained with the control flour. Moreover, the final viscosity of
the whole grain flour obtained from all the organic acid-NaCl treatments was also significantly
lower than the control flour. Similar results were observed by Wu et al. (2010), although in
nonwaxy rice flour. In their study, a significant decrease in final viscosity was noticed with the
addition of 0.1 mM organic acid (acetic, lactic, malic and citric) when compared to control.
Ohishi et al. (2007) also found that final viscosity and setback of rice flour were significantly
decreased with addition of 0.05–0.2 M acetic acid.
The setback is a measure of the degree of retrogradation, or re-association, of the starch
molecules during cooling. No statistical difference was observed in the level of retrogradation
among the different straight-grade flour samples, including the control flour. However, as in the
final viscosity, whole grain flour obtained from tempering treatments showed lower setback
tendencies than the control flour, which suggest that tempering wheat with organic acids and
NaCl may produce flour with less tendency to retrograde.
The peak time indicate the time required for a mixture to reach its peak viscosity. There
was no statistically significant difference in the time required among straight-grade flour to reach
such peak viscosity. However, less time compared to control was required for the whole grain
flour obtained from the organic acid-NaCl treatments to reach the peak viscosity. As shown in
Table 2, organic acids seem to be concentrated in the outer bran layer of the wheat kernel, thus
reducing the pH of the whole grain flour-water mixture, which may cause starch granules to
became fragile and break down relatively rapidly after acidification, thus reducing the time
required to reach the peak viscosity. The pasting temperature, which indicates the onset of the rise
in viscosity, did not differ among treatments for straight-grade or whole grain flour.
Page 135
126
Table 4. Mean values and standard deviation for RVA pasting parameters of straight-grade and
whole grain flour 1
RVA Treatments
Flour type
Parameter Straight-grade flour Whole grain flour
Peak
Viscosity
(cp)
Control (water) 3459.33 (37.86)a 2 2232.66 (12.50)a
Lactic acid 2.5% + NaCl 1.0% 3403.66 (73.66)ab 2077.33 (24.83)a
Lactic acid 5.0% + NaCl 1.0% 3353.00 (59.23)ab 2011.66 (25.42)a
Acetic acid 2.5% + NaCl 1.0% 3340.33 (24.03)ab 2266.33 (245.70)a
Acetic acid 5.0% + NaCl 1.0% 3309.00 (59.30)b 2073.00 (26.23)a
Trough
(cp)
Control (water) 1824.66 (60.19)a 1154.33 (27.30)a
Lactic acid 2.5% + NaCl 1.0% 1868.00 (31.19)a 1043.00 (17.35)ab
Lactic acid 5.0% + NaCl 1.0% 1833.67 (100.6)a 981.000 (37.51)b
Acetic acid 2.5% + NaCl 1.0% 1895.00 (108.0)a 1094.67 (104.6)ab
Acetic acid 5.0% + NaCl 1.0% 1740.00 (50.57)a 972.000 (53.67)b
Breakdown
(cp)
Control (water) 1634.66 (29.87)a 1078.33 (17.90)a
Lactic acid 2.5% + NaCl 1.0% 1535.66 (65.43)a 1034.33 (23.03)a
Lactic acid 5.0% + NaCl 1.0% 1519.33 (99.03)a 1030.66 (18.58)a
Acetic acid 2.5% + NaCl 1.0% 1445.33 (96.78)a 1171.66 (142.1)a
Acetic acid 5.0% + NaCl 1.0% 1569.00 (84.18)a 1101.00 (28.58)a
Final
Viscosity
(cp)
Control (water) 2892.33 (39.17)a 2015.66 (19.30)a
Lactic acid 2.5% + NaCl 1.0% 2859.33 (37.22)ab 1749.33 (4.160)b
Lactic acid 5.0% + NaCl 1.0% 2858.66 (43.62)ab 1665.33 (39.26)b
Acetic acid 2.5% + NaCl 1.0% 2849.33 (70.49)ab 1764.67 (147.5)b
Acetic acid 5.0% + NaCl 1.0% 2730.66 (45.32)b 1672.66 (49.10)b
Setback
(cp)
Control (water) 1067.66 (94.77)a 861.33 (8.620)a
Lactic acid 2.5% + NaCl 1.0% 991.3300 (6.03)a 706.33 (13.80)b
Lactic acid 5.0% + NaCl 1.0% 1025.00 (62.23)a 684.330 (4.93)b
Acetic acid 2.5% + NaCl 1.0% 954.330 (42.22)a 770.00 (69.86)b
Acetic acid 5.0% + NaCl 1.0% 990.660 (22.50)a 700.660 (6.51)b
Peak Time
(min)
Control (water) 6.02 (0.04)a 6.04 (0.08)a
Lactic acid 2.5% + NaCl 1.0% 6.04 (0.04)a 5.84 (0.04)b
Lactic acid 5.0% + NaCl 1.0% 6.04 (0.08)a 5.88 (0.04)b
Acetic acid 2.5% + NaCl 1.0% 6.06 (0.07)a 5.80 (0.07)b
Acetic acid 5.0% + NaCl 1.0% 6.00 (0.07)a 5.82 (0.08)b
Pasting
Temperature
(ºC)
Control (water) 52.11 (1.76)a 52.65 (4.12)a
Lactic acid 2.5% + NaCl 1.0% 51.00 (1.43)a 51.51 (1.32)a
Lactic acid 5.0% + NaCl 1.0% 50.43 (0.49)a 52.15 (0.52)a
Acetic acid 2.5% + NaCl 1.0% 50.95 (0.85)a 50.83 (0.75)a
Acetic acid 5.0% + NaCl 1.0% 52.08 (0.49)a 53.00 (2.30)a 1 Values denote mean±(standard deviation)
2 Means followed by the same letter, within the same column and RVA parameter, are not
significantly different (p > 0.05).
Page 136
127
3.3.4 Baking quality
Table 5 summarizes the loaf volume and firmness of bread made from straight-grade and
whole grain flour. In loaves made from straight-grade flour, no significant differences in volume
and firmness were observed. Bread firmness was higher when whole grain flour obtained from
wheat tempered with organic acid, either lactic or acetic, at the 2.5% level was used. However, as
the acid concentration increased to 5.0% the firmness decreased, up to a point where it was not
significantly different than the control bread. Bakhoum et al. (1982) using white flour observed
that, in the presence of NaCl, loaf volume may increase with increasing acid concentration up to a
certain level. However, this effect was not evident in this study for neither type of flour evaluated,
since organic acids may not reach the inner endosperm in sufficient amounts to cause the same
raising effect and whole grain flour contains a number of non-functional components (i.e., bran
and germ) which also may interfere with bread volume (Table 2).
Table 5. Mean values and standard deviation for straight-grade and whole grain bread loaf
volume and firmness 1
Bread Analysis Treatments
Bread type
Parameter Straight-grade bread Whole grain bread
Loaf Volume
(cc)
Control (water) 609.67 (34.27)a 2 358.67 (4.27)a
Lactic acid 2.5% + NaCl 1.0% 612.00 (12.96)a 358.33 (5.89)a
Lactic acid 5.0% + NaCl 1.0% 605.50 (20.53)a 367.83 (15.04)a
Acetic acid 2.5% + NaCl 1.0% 626.17 (14.63)a 355.00 (12.70)a
Acetic acid 5.0% + NaCl 1.0% 622.00 (24.08)a 367.50 (12.29)a
Bread Firmness
(N)
Control (water) 0.79 (0.09)a 4.09 (0.75)b
Lactic acid 2.5% + NaCl 1.0% 0.81 (0.07)a 4.76 (0.92)a
Lactic acid 5.0% + NaCl 1.0% 0.79 (0.11)a 4.43 (0.72)ab
Acetic acid 2.5% + NaCl 1.0% 0.73 (0.12)a 4.85 (0.40)a
Acetic acid 5.0% + NaCl 1.0% 0.80 (0.09)a 3.91 (0.42)b
1 Values denote mean±(standard deviation)
2 Means followed by the same letter, within the same column and bread analysis parameter, are
not significantly different (p > 0.05).
Table 6 illustrates the image analysis of bread slices made from straight-grade and whole
grain flour. Some parameters, including slice area, height, brightness, and number of air cells,
Page 137
128
presented some differences among the treatments, especially in bread made from whole grain
flour.
Table 6. Mean values and standard deviation for straight-grade and whole grain bread image
analysis 1
Bread Analysis Treatments
Bread type
Parameter Straight-grade bread Whole grain bread
Slice Area
(mm2)
Control (water) 5381.50 (273.98)a 2 3553.16 (264.54)a
Lactic acid 2.5% + NaCl 1.0% 5452.16 (118.55)a 3363.55 (231.86)b
Lactic acid 5.0% + NaCl 1.0% 5362.00 (171.16)a 3453.72 (186.29)ab
Acetic acid 2.5% + NaCl 1.0% 5477.11 (154.23)a 3438.16 (96.730)ab
Acetic acid 5.0% + NaCl 1.0% 5402.16 (176.20)a 3562.77 (109.20)a
Slice Height
(mm)
Control (water) 63.97 (1.43)a 65.46 (4.37)a
Lactic acid 2.5% + NaCl 1.0% 64.69 (2.06)a 61.58 (4.98)b
Lactic acid 5.0% + NaCl 1.0% 64.01 (1.47)a 63.25 (2.21)ab
Acetic acid 2.5% + NaCl 1.0% 64.86 (1.95)a 64.92 (1.47)a
Acetic acid 5.0% + NaCl 1.0% 64.72 (1.05)a 66.10 (1.79)a
Slice
Brightness
Control (water) 165.27 (4.22)a 92.01 (3.71)a
Lactic acid 2.5% + NaCl 1.0% 159.25 (6.75)b 89.43 (1.34)b
Lactic acid 5.0% + NaCl 1.0% 156.92 (5.34)b 88.00 (1.88)b
Acetic acid 2.5% + NaCl 1.0% 159.76 (2.95)b 89.53 (2.10)b
Acetic acid 5.0% + NaCl 1.0% 160.52 (3.77)b 88.45 (2.08)b
Number of
Cells
Control (water) 2881.11 (151.15)a 1913.55 (169.42)b
Lactic acid 2.5% + NaCl 1.0% 2947.44 (176.01)a 1903.00 (125.00)b
Lactic acid 5.0% + NaCl 1.0% 2990.83 (153.79)a 1966.50 (116.10)ab
Acetic acid 2.5% + NaCl 1.0% 2916.05 (101.24)a 1956.72 (82.820)ab
Acetic acid 5.0% + NaCl 1.0% 2981.55 (109.75)a 1984.11 (62.530)a
Cell Diameter
(mm)
Control (water) 2.39 (0.19)a 2.39 (0.16)a
Lactic acid 2.5% + NaCl 1.0% 2.35 (0.12)a 2.24 (0.11)b
Lactic acid 5.0% + NaCl 1.0% 2.28 (0.15)a 2.18 (0.11)b
Acetic acid 2.5% + NaCl 1.0% 2.34 (0.13)a 2.18 (0.13)b
Acetic acid 5.0% + NaCl 1.0% 2.30 (0.10)a 2.14 (0.10)b
Average Cell
Elongation
(mm)
Control (water) 1.70 (0.03)a 1.75 (0.06)a
Lactic acid 2.5% + NaCl 1.0% 1.71 (0.03)a 1.74 (0.06)a
Lactic acid 5.0% + NaCl 1.0% 1.70 (0.04)a 1.79 (0.05)a
Acetic acid 2.5% + NaCl 1.0% 1.70 (0.04)a 1.77 (0.05)a
Acetic acid 5.0% + NaCl 1.0% 1.68 (0.03)a 1.78 (0.05)a 1 Values denote mean±(standard deviation)
2 Means followed by the same letter, within the same column and bread analysis parameter, are
not significantly different (p > 0.05).
Page 138
129
Differences in cell structure among the loaves made from straight-grade flour were not
readily apparent; in fact, straight-grade flour provided, regardless of the treatment, bread slices
with more cell uniformity than bread slices made from whole grain flour, including diameter,
elongation and number of cells (Table 6).
Treated whole grain flour provided bread slices with smaller cell diameter than the
control flour; however, the average cell elongation did not differ from the control. However,
treated straight-grade and whole grain flour provided darker bread slices. Usually, blackness is
related to the occurrence of air cells which may be a consequence of a higher loaf volume.
However, in this study the loaf volume obtained with treated flour did not differ from control
(Table 5).
In conclusion, the milling process of hard red winter wheat tempered with organic acids
and saline solutions provided milled products with improved microbiological quality when
compared with the traditional tempering process using water. Even though some significant
differences in mixing, pasting and baking properties were observed, the impact of tempering
solutions on functionality was minimal. Furthermore, a consistent use of wheat with high
microbiological quality may contribute to reducing the microbial establishment and growth
within the mill, thus reducing the risk of microbial contamination during milling.
Page 139
130
REFERENCES
AACC International. 2002. Approved Methods of Analysis. (11th ed.). St. Paul, MN: AACC
International (Methods 10-10.02, 10-13.03, 44-15A)
Alakomi, H.L., Skytta, E., Saarela, M., Mattila-Sandholm, T., Latva-kala, K., Helander, I.M.
2000. Lactic Acid Permeabilizs Gram-Negative Bacteria by Disrupting the Outer Membrane.
Applied and environmental microbiology, 66 (5): 2001–2005.
AOAC. 2013. Approved Methods of Analysis. Enumeration of Enterobacteriaceae and Coliform.
Methods 2003.01 and 991.14.
Bakhoum, M.T., Ponte, G.J. 1982. Combined effects of sodium chloride and hydrochloric acid on
wheat flour strength. Cereal Chem. 59(1): 37-40.
Berghofer, L.K., Hocking, A.D., Miskelly, D., and Jansson, E. 2003. Microbiology of wheat and
flour milling in Australia. International Journal of Food Microbiology. 85:137-149.
Bruinsma, B.L., Anderson, P.D., Rubenthaler, G.L. 1978. Rapid method to determine quality of
wheat with the mixograph. Cereal Chem. 55:732-735.
Casey, P. and Condon, S. 2002. Sodium chloride decreases the bacteriocidal effect of acid pH on
Escherichia coli O157:H45. Int J Food Microbiol. 76:199–206.
Chapman, B., T. Ross. 2009. Escherichia coli and Salmonella enterica are protected against
acetic Acid, but not hydrochloric acid, by hypertonicity. Applied & Environmental
Microbiology. 75:3605-3610.
Chaveerach, P., D. A. Keuzenkamp, H. A. Urlings, L. J. A. Lip man, and F. van Knapen. 2002. In
vitro study on the effect of organic acids on Campylobacter jejuni/coli populations in
mixtures of water and feed. Poult. Sci. 81:621–628.
D'Appolonia B.L. 1972. Effect of bread ingredients on starch-gelatinization properties as
measured by the amylograph. Cereal Chem. 49:532-543.
Page 140
131
Dhillon, B., Wiesenborn, D., Dhillon, H., and Wolf-Hall, C. 2010. Development and evaluation
of a fluidized bed system for wheat grain disinfection. Journal of Food Science. 75:E372.
Dhillon, B., Wiesenborn, D., Wolf-Hall, C., and Manthey, F. 2009. Development and evaluation
of an ozonated water system for antimicrobial treatment of durum wheat. Journal of Food
Science. 74:E396.
Eglezos, S. 2010. Microbiological Quality of Wheat Grain and Flour from Two Mills in
Queensland, Australia. J. Food Prot. 73:1533-1536.
Galal, M.A., Varriano-Marston, E., Johnson, A.J. 1978. Rheological dough properties as affected
by organic acids and salt. Cereal Chem. 55(5): 683-691.
Ganz, A. J. 1965. Effect of sodium chloride on the pasting of wheat starch granules. Cereal
Chem. 42:429-431.
Gilbert, S., R. Lake, P. Cressey, N. King, 2010. Risk profile: Salmonella in cereal grains. New
Zealand safety authority. Available at:
http://www.foodsafety.govt.nz/elibrary/industry/salmonella-in-cereals.pdf Accessed 1 May
2014.
Guldfeldt, L.U., Arneborg, N. 1998. Measurement of the effects of acetic acid and extracellular
pH on intracellular pH of nonfermenting, individual Saccharomyces cerevisiae cells by
fluorescence microscopy. Appl. Environ. Microbiol. 64: 530-534.
Gyawali, R., Ibrahim, A. S., Hasfa Abu, S.H., Smqadri, Q. S., Haik, Y. 2011. Antimicrobial
activity of copper alone and in combination with lactic acid against Escherichia coli O157:H7
in laboratory medium and on the surface of the lettuce and tomatoes. Journal of Pathogens.
2011:1-9.
Ibanoglu, S. 2002. Wheat washing with ozonated water: Effects on selected flour properties.
International Journal of Food Science Technology. 37:579-584.
Page 141
132
Ibrahim, S.A., Yang, H., Seo, C.W. 2008. Antimicrobial activity of lactic acid and copper on
growth of Salmonella and Escherichia coli O157:H7 in laboratory medium and carrot juice.
Food Chemistry 109: 137-143.
Laca, A., Mousia, Z., Diaz, M., Webb, C., and Pandiella, S.S. 2006. Distribution of microbial
contamination within cereal grains. J. Food Eng. 72:332.
Lee, S. Y., M. S. Rhee, R. H. Dougherty, and D. H. Kang. 2010. Antagonistic effect of acetic acid
and salt for inactivating Escherichia coli O157:H7 in cucumber puree. J. Appl. Microbiology.
108 (4): 1361-1368.
Maturin, L.J. and Peeler, J.T. 1998. Aerobic plate count. Ch. 3. In Food and Drug Administration
Bacteriological Analytical Manual, 8th ed. (revision A), Available at:
http://www.cfsan.fda.gov/-ebam/bam-3.html.
Medcalf, D.G., Gilles, K.A.1966. Effect of a lyotropic ion series on the pasting characteristics of
wheat and corn starches. Staerke. 4:101-105.
Neil, K.P., G. Biggerstaff, J. K. MacDonald, E. Trees, C. Medus, K. A. Musser, S. G. Stroika, D.
Zink, M. J. Sotir. 2012. A Novel Vehicle for Transmission of Escherichia coli O157:H7 to
Humans: Multistate Outbreak of E. coli O157:H7 Infections Associated With Consumption
of Ready-to-Bake Commercial Prepackaged Cookie Dough--United States, 2009. Clinical
Infectious Diseases. 54:511-518.
New Zealand Food and Safety Authority (NZFSA). 2008. Flour batch believed linked to
Salmonella outbreak. New Zealand Food and Safety Authority press release. Available at:
http://foodsafety.govt.nz/elibrary/industry/Flour_Batch-Investigations_Into.htm. Accessed 7
May 2014.
Nikaido, H. 1996. Outer membrane, p. 29–47. In F. C. Neidhardt et al. (ed.), Escherichia coli and
Salmonella: cellular and molecular biology, 2nd ed., vol. 1. American Society for
Microbiology, Washington, D.C.
Page 142
133
Ohishi, K., Kasai, M., Shimada, A. and Hatae, K. 2007. Effects of acetic acid on the rice
gelatinization and pasting properties of rice starch during cooking. Food Res. Int. 40:224–
231.
Olkku, J. and Rha, C. 1978. Gelatinization of starch and wheat flour starch-a review. Food Chem.
3:293–317.
Ricke, S.C. 2003. Perspective on the Use of Organic Acids and Short Chain Fatty Acids as
antimicrobials. Poultry Science. 82:632-639.
Sabillón, L. 2014. Effect of novel tempering solutions on reducing microbial load in wheat prior
to milling. Thesis. University of Nebraska-Lincoln.
Seiler, D.A. 1986. The microbial content of wheat and flour, p. 35-40. In B. Flannigan (ed),
Proceedings of the spring meeting of the Biodeterioration Society on spoilage and
mycotoxins of cereals and other stored products. C.A.B. International, Slough, UK.
Shelef, L. A., and J. Seiter. 2005. Indirect and miscellaneous antimicrobials. In Antimocrobials in
food. 3rd ed., edited by P. M. Davidson, J. N. Sofos, and B. A. Larry. Boca Raton, FL: Taylor
and Francis. Pp. 573-598.
Smith, J.L., Maurer, M.J., Bencivengo, M.M., and Kunsch, C.A. 1987. Effect of sodium chloride
on uptake of substrate by Staphylococcus aureus 196E. J. Food Prot. 50:968-974. Posner,
E.S., and Hibbs, A.N. Wheat Flour Milling. AACC International, St. Paul, MN, 1997.
Sorokulova IB, Reva ON, Smirnov VV, Pinchuk IV, Lapa SV, Urdaci MC. 2003. Genetic
diversity and involvement in bread spoilage of Bacillus strains isolated from flour and ropy
bread. Lett Appl Microbiol 37:169–73
Tournas, V., Stack, M. E., Mislivec, P. B., Koch, H. A., & Bandler, R. 1998. Yeasts, molds, and
mycotoxins. In Bacteriological Analytical Manual, edition 8, revision A. Available at:
http://www.fda.gov/Food/ScienceResearch/LaboratoryMethods/BacteriologicalAnalyticalMa
nualBAM/um071435.htm.
Page 143
134
Wu, W.S., Tsai, Y.H., Wei, C.I., Pan Sun, B. Huang, T.C. 2010. Effects of organic acids on the
pasting properties of rice flour from waxy and nonwaxy varieties. Journal of Food Quality.
33:137-154.