Understanding the role of collateral in financial markets Brookings Institution, Feb 23 rd , 2015 Manmohan Singh Senior Economist, International Monetary Fund Views expressed are of the author only and not attributable to the IMF.
Transcript
Understanding the role of collateral in financial markets
Brookings Institution, Feb 23rd, 2015
Manmohan Singh Senior Economist, International Monetary Fund
Views expressed are of the author only and not attributable to the IMF.
Summary of key messages: Financial collateral metrics are at par with money metrics and an
integral part of financial lubrication; collateral metrics complement what is discussed in textbooks on money metrics.
Monetary Policy at ZLB (with QE) has interfered with financial plumbing by silo-ing good collateral; unwind of CB balance sheets opens a new chapter “collateral and monetary policy”
Regulations (Basel/Dodd Frank Act etc) and QE are likely to lead
to un-intended consequences. OTC derivatives market and CCPs; break-down in this plumbing? Shadow banking should not be a pejorative term; also uses capital QE/regulations overlap in a “changing collateral space” Safe assets: is there really a shortage? collateral re-use rate (velocity)
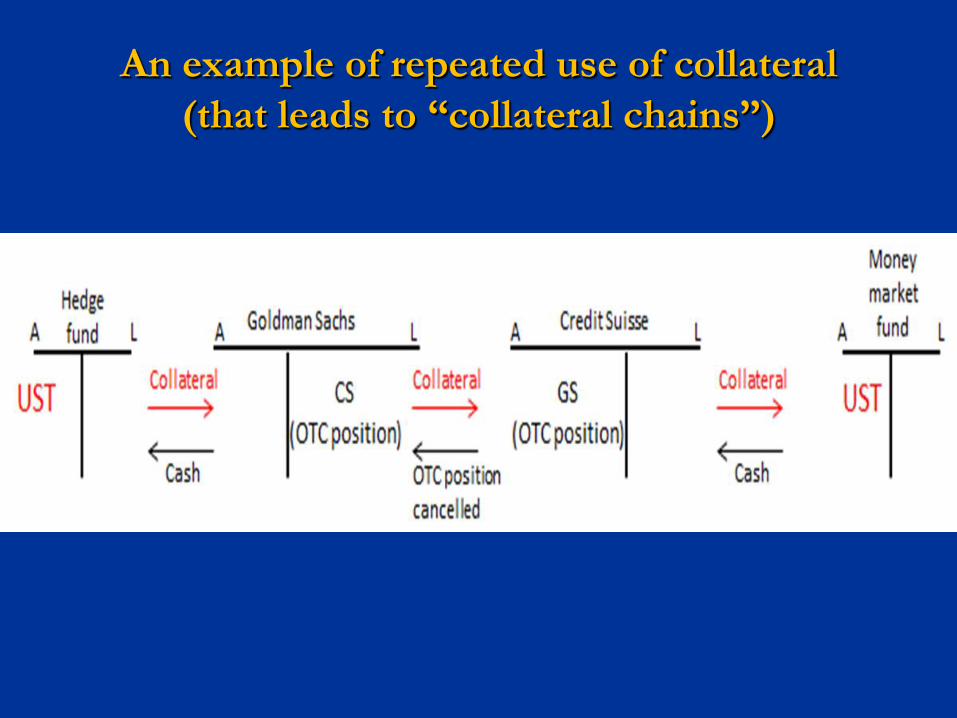
Pledged Collateral for re-use does not appear on Balance Sheet but only in footnotes—
thus, this is not picked up in Flow of Funds, or Call reports
The typical language, in all large banks active in collateral
funding appears as follows (from Lehman’s last annual report below):
As of November 30, 2007, the fair value of securities received as
collateral that were permitted to sell or re-pledged was approximately $798 billion….(of which) the firm sold or re-pledged approximately$725 billion as of November 30, 2007
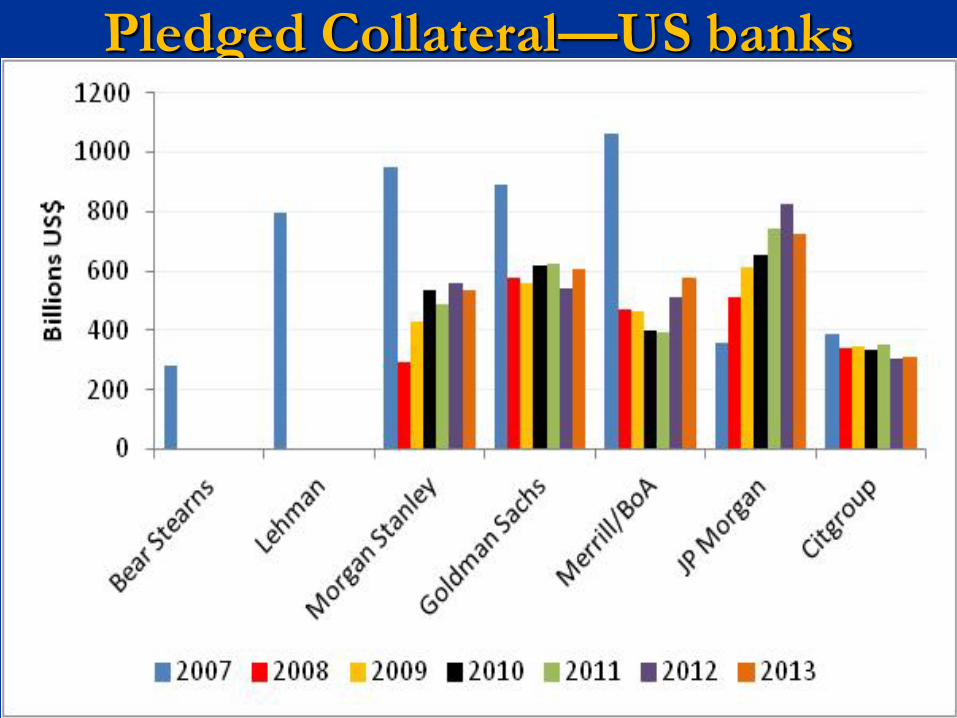
Pledged Collateral—US banks
Pledged Collateral—European banks (plus Nomura)
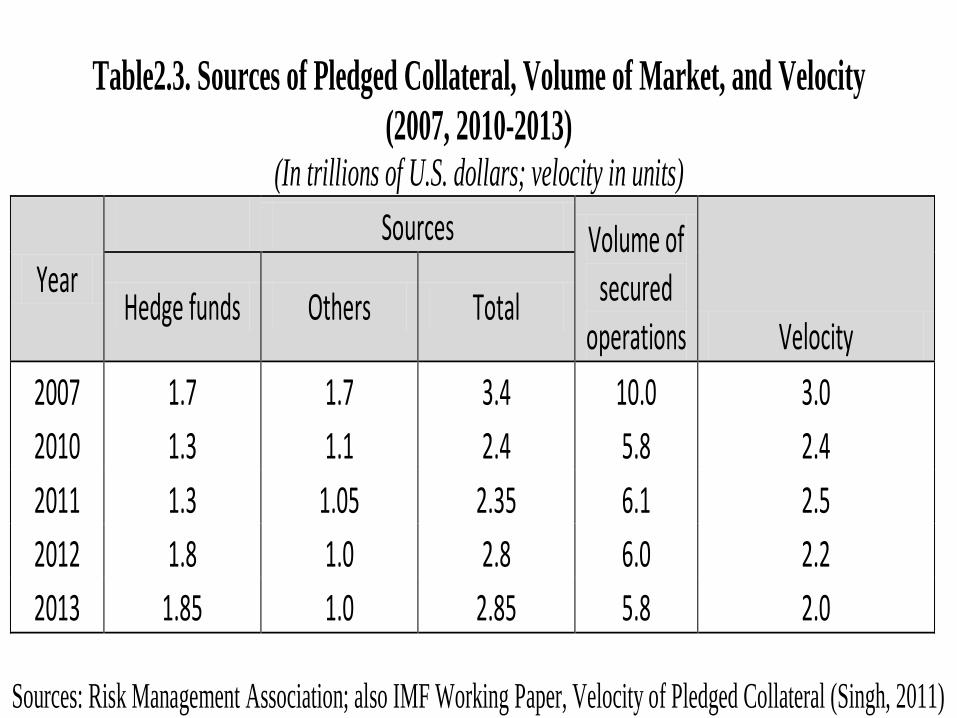
Collateral from Hedge Funds— biggest single source of pledged collateral to market
Hedge Funds largely finance their positions in two ways: First, they can either pledge collateral for reuse to their prime broker in
lieu of cash borrowing from the prime broker (via rehypothecation) Note--in the U.S., SEC’s Rule 15c3a and Regulation T generally limits PB’s use of
rehypothecated collateral from a client. Non US jurisdictions such as UK via English Law do not have any limits.
Second, HFs also fund their positions via repo(s) with dealers who may
or may not be their PBs. HF collateral “to the street” from PB and repo was about $1.7
trill (2007) and down to about $1.35 trill in recent years. Most recently with AUM growing sizably, leverage rebouding…. collateral from HF to street about $ 1.85 trillion end-2013
The “non-hedge fund” source of collateral—declining due to counterparty risk etc
Sources: Risk Management Association; also IMF Working Paper, Velocity of Pledged Collateral (Singh, 2011)
Overall Financial Lubrication— Money and Collateral…….some intuition
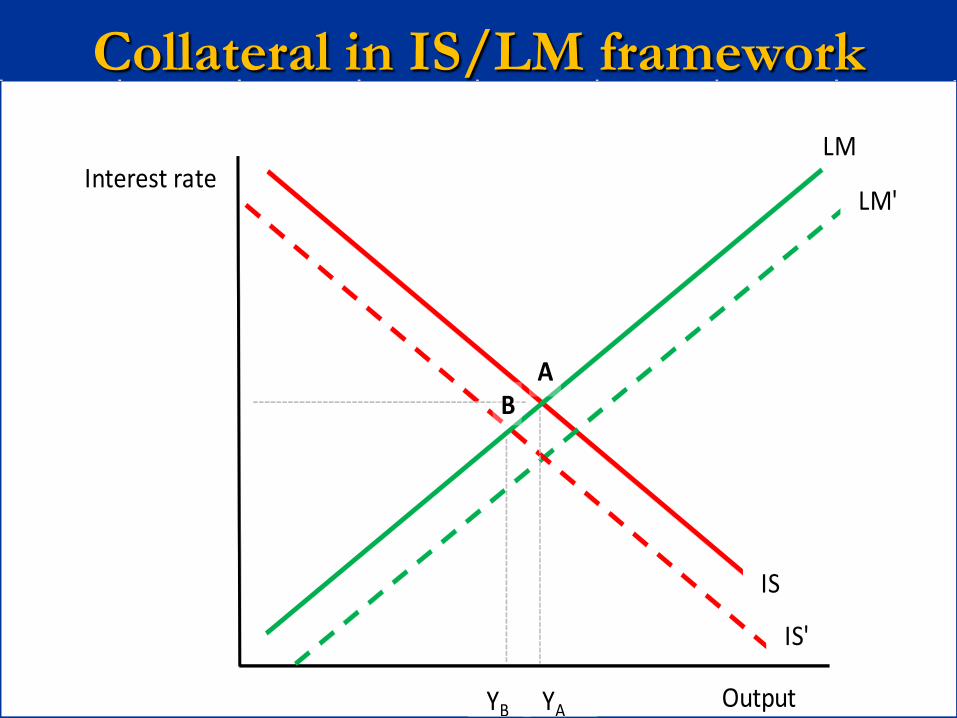
Collateral in IS/LM framework
Output
Interest rate
YAYB
LM
LM'
IS
IS'
AB
IS/LM and pledged collateral market crash; IS shifts “in” sizably; LM shifts “out” via QE etc
Output
Interest rate
Negative interest rate
YAYB
LM
LM'
IS
IS'
A
B
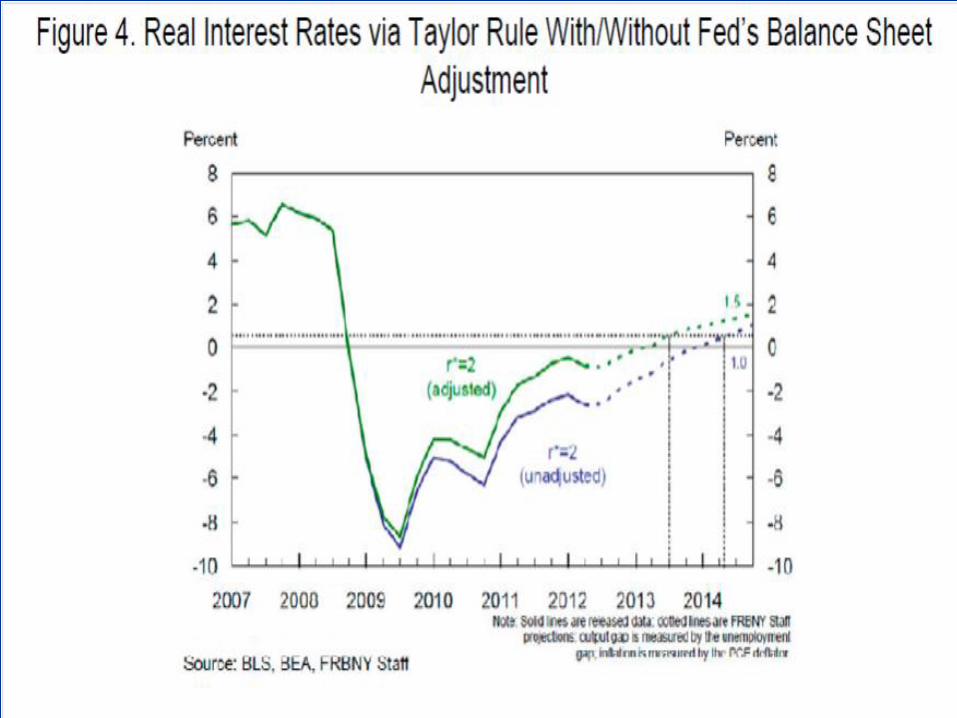
Pre-Lehman GC (general collateral)repo rate vs. Fed Funds rate (GC repo rate is secured funding via collateral that is mostly liquid US Treasuries and/or MBS; the Triparty framework is used for GC repo)
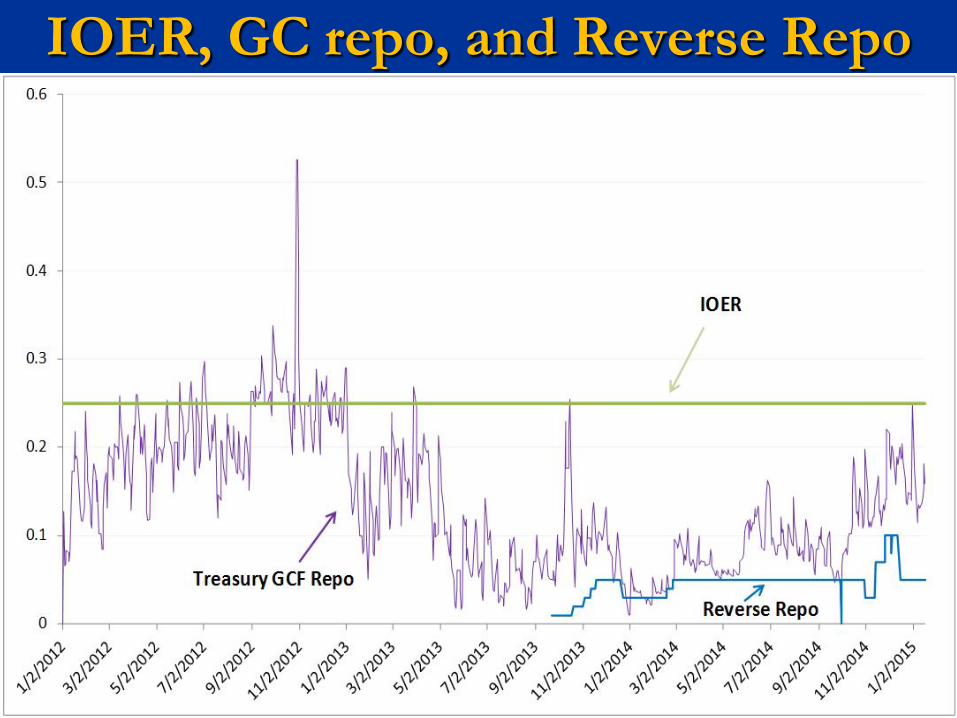
IOER, GC repo, and Reverse Repo
Eurozone ‘good collateral’ rates and Eonia (their Fed Funds rate); since Sept ’14,deposit rate at minus 20 bps
QE resulted in Fed printing and nonbanks selling UST and MBS to Fed.
The bank deposit market is sizable—in fact the top 4 bank holding companies (Bank of America, Wells Fargo, Citibank and JPMorgan) hold about $3.8 trillion in deposits as per FDIC’s June 2014 data, relative to $1.9 trillion as of June 2008.
The top 50 bank holding companies (including foreign) hold $7 trillion as of June 2014, relative to $4 trillion as of June 2008.
QE largely explains the growth in deposits (Carpenter et al 2013)
Banks do not want these deposits, as Basel rules are implemented; banks want “balance sheet space”
The “old plumbing” …..in blue area
The critical pieces of the plumbing are the repo markets and the bank deposit market.
The U.S. bilateral repo market is a market for
collateral: securities for possession and use, (incidentally against cash).
The Tri-party repo (TPR) market in the U.S. is a
market for funding: money for broker dealers/banks (incidentally collateralized by securities).
The new-plumbing: RRP short-circuits the “nonbank/bank” plumbing
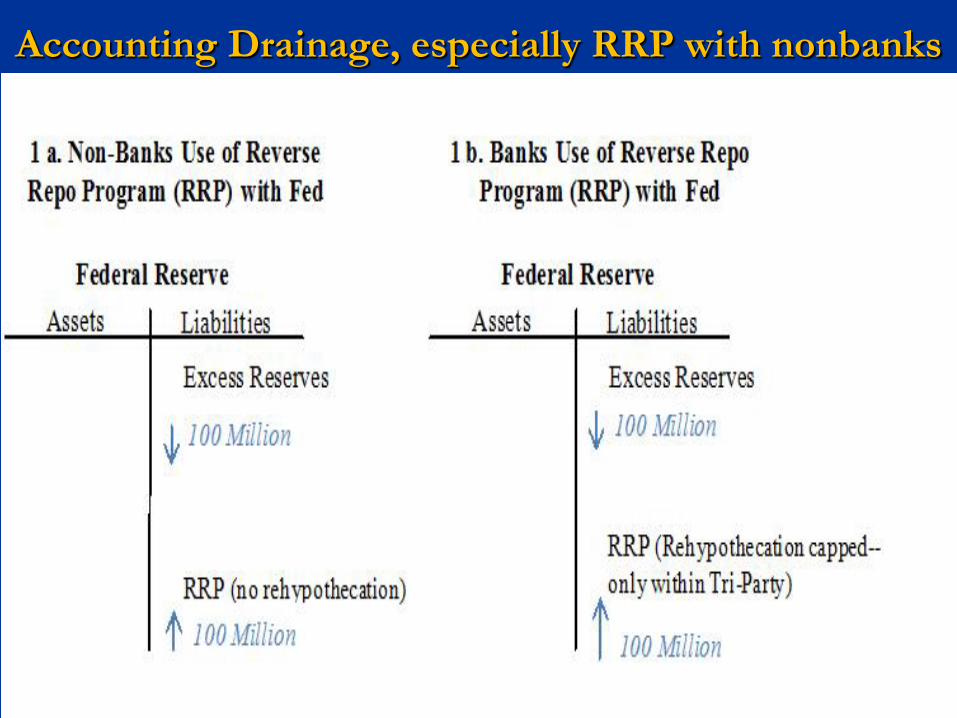
Accounting Drainage, especially RRP with nonbanks
Assets LiabilitiesExcess
RRP
100 Million
100 Million
Federal Reserve
a. Non-Banks Use of Reverse Repo Program (RRP) with Fed
Assets LiabilitiesExcess
RRP (if term RRP, rehypothecationmay add to collateral velocity)
100 Million
100 Million
Federal Reserve
b. Banks Use of Reverse Repo Program (RRP) with Fed
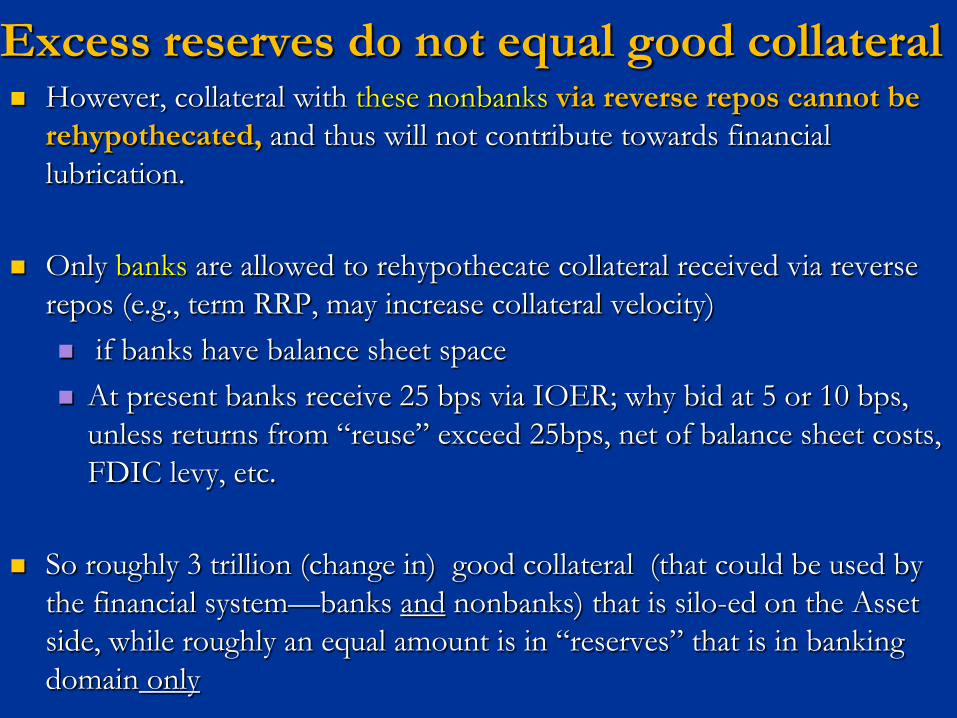
Excess reserves do not equal good collateral However, collateral with these nonbanks via reverse repos cannot be
rehypothecated, and thus will not contribute towards financial lubrication.
Only banks are allowed to rehypothecate collateral received via reverse repos (e.g., term RRP, may increase collateral velocity) if banks have balance sheet space At present banks receive 25 bps via IOER; why bid at 5 or 10 bps,
unless returns from “reuse” exceed 25bps, net of balance sheet costs, FDIC levy, etc.
So roughly 3 trillion (change in) good collateral (that could be used by
the financial system—banks and nonbanks) that is silo-ed on the Asset side, while roughly an equal amount is in “reserves” that is in banking domain only
Recent speech by NY Fed president Dudley, May 20, 2014, New York
“Also, with an exceptionally large balance sheet there
will be considerable attention on the methods that the FOMC will likely use in order to exert control over the level of short-term rates”
[ intuitively, from an overall financial lubrication angle
(i.e., money+collateral), if collateral velocity has already been reduced from approx 3 to 2, there may be less tightening needed from monetary policy cycle.]
Collateral Transformation and Financial Stability —should safe assets be produced as a public good? by whom? why?
Dealers are interested in collateral transformation. In fact they may
be the only actor in the financial space to bridge the likely demand/supply gap. However transforming a BB to AA/AAA may be constrained due to Basel III
The final definition of leverage/LCR ratios will matter, especially if ratios “pick up” all off-balance sheet pledged collateral transactions.
The re-use of collateral is fundamental to bridging the gap between demand and supply. Academia has so far ignored this aspect in their models. Fed’s RRP is another example of supplying safe assets. Similar angle for Reserve Bank of Australia’s facility.
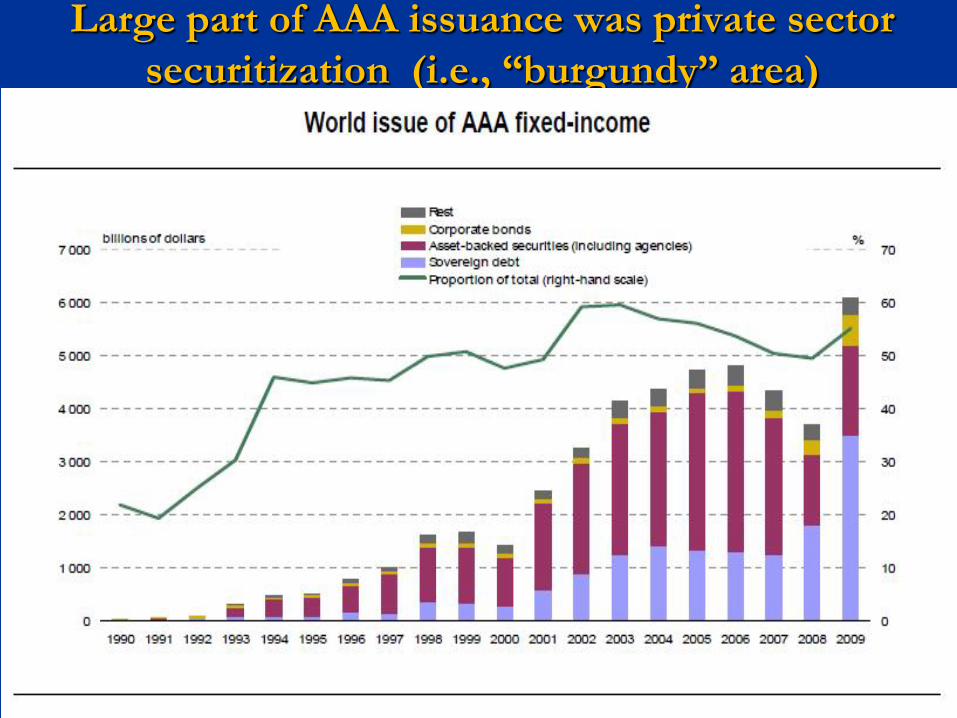
Large part of AAA issuance was private sector securitization (i.e., “burgundy” area)
Regulatory focus—so far… To date, regulatory efforts have focused on fortifying the equity base
(ei) of the banking system and limiting the banking system’s leverage (λ i) through leverage caps.
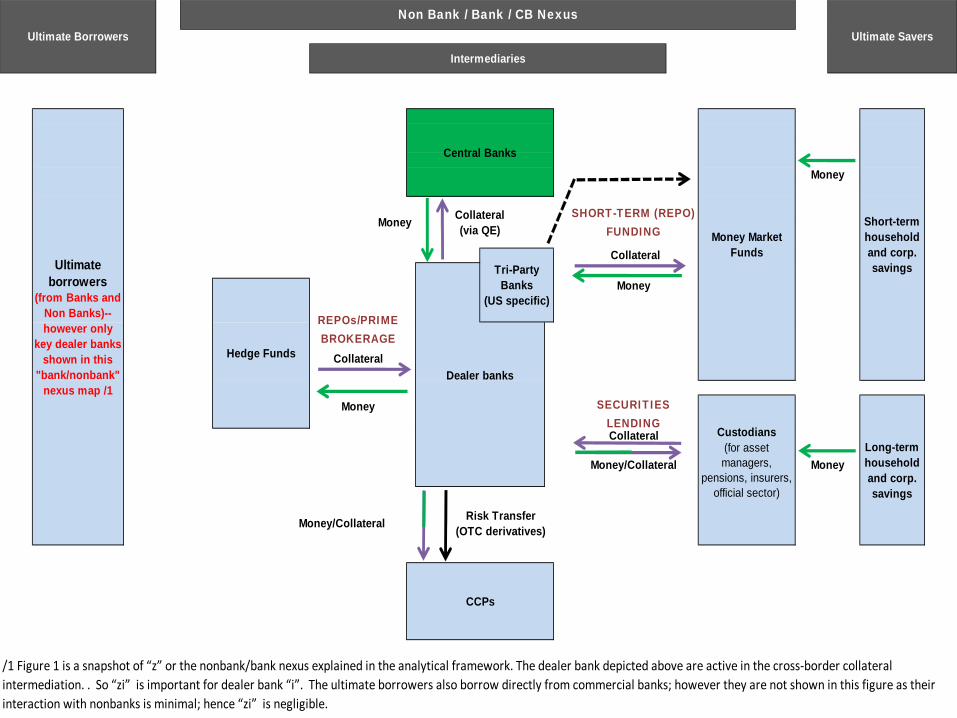
Non-bank funding to banks was assumed to be “sticky” and mainly in the form of household deposits.
Regulatory efforts have not focused on sizable volumes of bank funding from non-banks . Since the money holdings of asset managers (pension, insurers, MMFs etc) are ultimately the claims of households, it follows that households ultimately fund banks through both M2 and non-M2 instruments
While households’ direct holdings of M2 instruments reflect their own investment decisions, their indirect holdings of non-M2 instruments are not a reflection of their direct investment choices, but the portfolio choice of their fiduciary asset managers.
CCPs
Collateral
Money/Collateral
Risk Transfer(OTC derivatives)
/1 Figure 1 is a snapshot of “z” or the nonbank/bank nexus explained in the analytical framework. The dealer bank depicted above are active in the cross-border collateral intermediation. . So “zi” is important for dealer bank “i”. The ultimate borrowers also borrow directly from commercial banks; however they are not shown in this figure as their interaction with nonbanks is minimal; hence “zi” is negligible.
Money/Collateral
Long-term household and corp. savings
Money
Custodians(for asset managers,
pensions, insurers, official sector)
Dealer banks
Central Banks
Hedge Funds
SECURITIES LENDING
Money
Collateral (via QE)Money
Ultimate borrowers
(from Banks and Non Banks)--however only
key dealer banks shown in this
"bank/nonbank" nexus map /1
Intermediaries
SHORT-TERM (REPO) FUNDING
Collateral
Money
Short-term household and corp. savings
Ultimate Borrowers
Non Bank / Bank / CB NexusUltimate Savers
Tri-Party Banks
(US specific)
Money
Money Market Funds
Collateral
REPOs/PRIME BROKERAGE
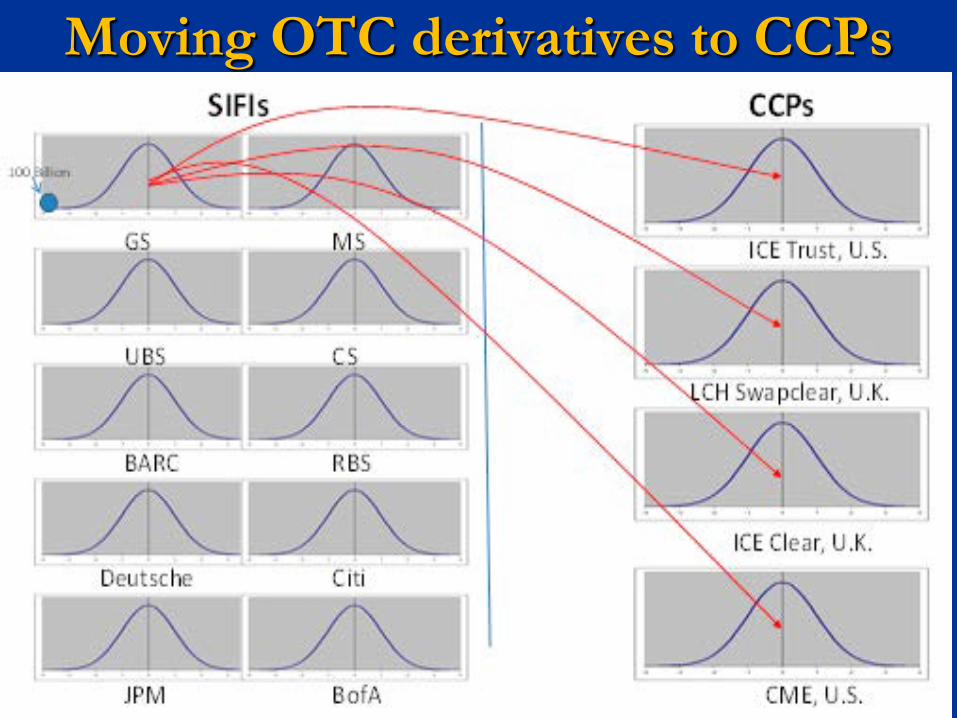
Moving OTC derivatives to CCPs
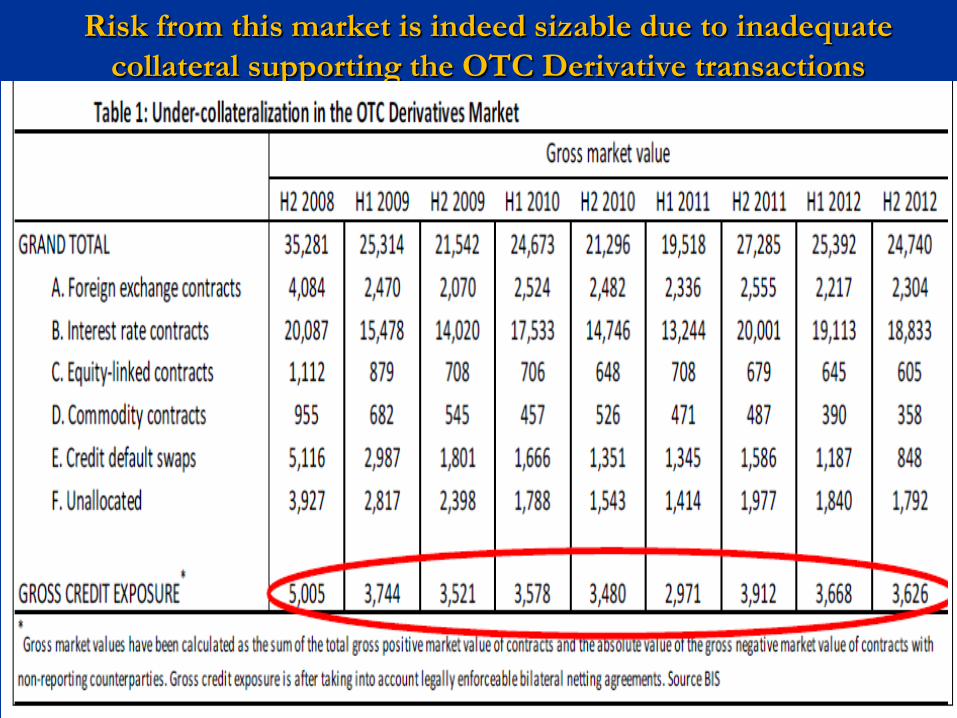
Risk from this market is indeed sizable due to inadequate
collateral supporting the OTC Derivative transactions
CCP and shifting taxpayer “put” Generally speaking, large losses stemming to a bank from their OTC
derivative positions—if it results in bank bailout —will typically be picked up by taxpayer from the jurisdiction in which the bank is located. For example, derivative losses at branches of a Canadian bank in a foreign
jurisdiction (e.g., London) is a Canadian taxpayer liability. Ditto for say Deutsche Bank branch in London (liability is of German taxpayer)
However, moving OTC derivatives positions form say a Canadian bank
to a foreign CCP that is owned/incorporated in a foreign jurisdiction (UK), shifts some of the Canadian taxpayer liability related to cleared OTC contracts to a UK taxpayer liability if UK had to bail-out the CCP.
Benefits vs. Costs of building this infrastructure?
When plumbing breaks… Should nonbanks be bailed out?
Recent SIFI designation to insurers, CCPs…. ( and perhaps) asset
managers? Nonbank/bank nexus: regulators trying to understand this
(data gaps? working groups on repo vs rehypothecation/sec lending/OTC derivatives/shadow banking etc.)
Recent regulations will likely shrink banks; however bailing out nonbanks (MMMF, CCPs etc.) would be going back to square one!
VMGH proposal for CCPs (largely a UK initiative)—a “bail-in” for nonbanks but only embraced marginally, even in UK!.
(forthcoming, RBA analytical study shows VMGH-related contagion to be minimal)