The Heinz Endowments response to a scientific study of the region’s air quality by the Clean Air Task Force Pittsburgh, PA March 9, 2011 Understanding Western Pennsylvania’s Air Pollution Problem CLEARING THE HAZE:
Transcript
The Heinz Endowments response to a scientific study of the region’s air quality by the Clean Air Task Force
Pittsburgh, PA
March 9, 2011
Understanding Western Pennsylvania’s Air Pollution Problem
Clearing the haze:
1
Clearing the haze: understanding western pennsylvania’s air pollution problem
n the 16 years since The Heinz Endowments created an Environment Program, one of its most important goals has been to help southwestern Pennsylvania recover from a legacy of industrial pollution issues. The foundation has been steadfast in the belief that clean air, clean water and well-protected ecosystems are essential to success in other efforts to improve the quality of life for people of this region. Two years ago, the Endowments began a detailed assessment of the $25 million in grant making since 1994 that has supported organizations and programs committed to ridding the region’s air of pollution, especially local sources of pollution.
Understanding Western Pennsylvania’s Air Pollution Problem
Clearing the haze:
2
Staff obtained data from its several grantee organizations working across the spectrum of the air pollution problem, and also examined independent analyses of the city’s and region’s air quality. One of the most alarming report cards was the American Lung Association’s annual State of the Air report. For each of the past six years, the Pittsburgh Metropolitan Statistical Area has landed among the five worst cities for year-round and short-term particulate pollution in the United States. In two of those years’ annual assessments, the region had the dubious title of worst in the country for short-term particulate pollution. Pittsburgh’s poor air quality has landed it on other lists as well, and these independent scientific assessments match the Endowments’ findings from its own self-examination: While considerable progress has been made from its grant making on air pollution remediation, the region is still in the danger zone for a range of pollutants, and has fallen behind most other sections of the country. It also has not been improving at a rate that is keeping pace with federal clean-air standards and regulations, which become more stringent with each new batch of public health studies that offer more evidence of these pollutants’ harmful effects. Alarmed by slower-than-expected progress in its air pollution work, lack of public awareness about the problem, and questioning on the part of leaders from many sectors about its severity, the Endowments commissioned fresh research to provide more information.
3
Clearing the haze: understanding western pennsylvania’s air pollution problem
The ReseaRch PRojecT
In January 2010, the Boston-based Clean Air Task Force was
commissioned by the Endowments to investigate the nature of
the air quality problem in western Pennsylvania and determine
its severity relative to other metro regions across the country.
The organization is internationally known for a science-
centric approach to assessing and reducing atmospheric pollution
through research, advocacy and private sector collaboration.
The Task Force first became a grantee of the Endowments in
1996, as the result of a joint project with the Pew Charitable
Trusts in which both foundations funded the organization to
develop strategies that would lead to sharp reductions in harmful
air pollution from the country’s power plants.
A companion piece to the regional air pollution research
task was: Is the Pittsburgh region’s air pollution problem
as serious as what is asserted in annual reports issued by the
American Lung Association? To answer this question,
Dr. John Graham, a senior scientist with the Task Force and
the primary researcher in the study, relied on the same federal
Environmental Protection Agency (EPA) air quality datasets
used by the Lung Association, along with existing reports
and analyses from the EPA and the Allegheny County Health
Department (ACHD).
The project involved six months of research and analysis of
Pittsburgh regional air data. The work was examined by other
Task Force scientists and then reviewed by air quality experts at
Pittsburgh-based academic and other nonprofit groups before
Pittsburgh’s air pollution problem is among the most serious in the country.
• air quality in Pittsburgh relative to the rest of the country has been consistently poor throughout the last decade.
• despite marked improvement in air quality for Pittsburgh and other u.s. cities for fine particulate matter and ozone, Pittsburgh currently has some of the worst levels in the country for these pollutants.
• currently, data from more than half the PM2.5 monitors in the region rank in the worst 10 percent of monitors across the united states for annual averages; the cleanest monitored areas in the Pittsburgh region have slid further behind, with daily PM2.5 levels worse than three-fourths of the rest of the united states.
• The cleanest measured air quality in the region ranks nationwide in the worst quarter for daily and the worst two-fifths for annual fine particulate pollution.
• Region-wide ozone levels have improved relative to the rest of the country — from the worst third to the worst half — although one monitor has regressed into the worst 10 percent.
• Poor air quality is not isolated to one location, although some areas are worse than others.
What
Was
learned
5
Clearing the haze: understanding western pennsylvania’s air pollution problem
Figure 1
Trends in Annual PM2.5 Percentile Ranking for Monitoring Sites in Western Pennsylvania Six of the region’s monitors fall into the worst 10 percent of monitors in the country.
The shaded area shows the worst 10 percent in the United States., or the 59 monitors that measured the highest pollution over three years.
With worse air quality than most metro areas in the United States, Pittsburgh residents are at greater risk for a range of serious health problems.
• Federal national ambient air Quality standards (naaQs) represent the true test of this region’s air quality, although relative pollution levels from region to region help place it in context.
• The Pittsburgh region fails to meet current air quality standards for fine particulate and ozone, which means that the people living in the region continue to breathe harmful levels of air pollution.
• over time, health studies have found stronger associations between air pollution and serious health problems, with indications of harm at concen-trations previously believed to be safe. Researchers have not identified a level below which exposure to fine particulate pollution is considered safe.
• The current amount of pollution in the Pittsburgh region is at the limit of or greater than the federal level deemed not harmful to human health. That situation is expected to worsen, as ePa officials likely will increase the stringency of federal standards as new research evidence warrants.
What
Was
learned
7
Clearing the haze: understanding western pennsylvania’s air pollution problem
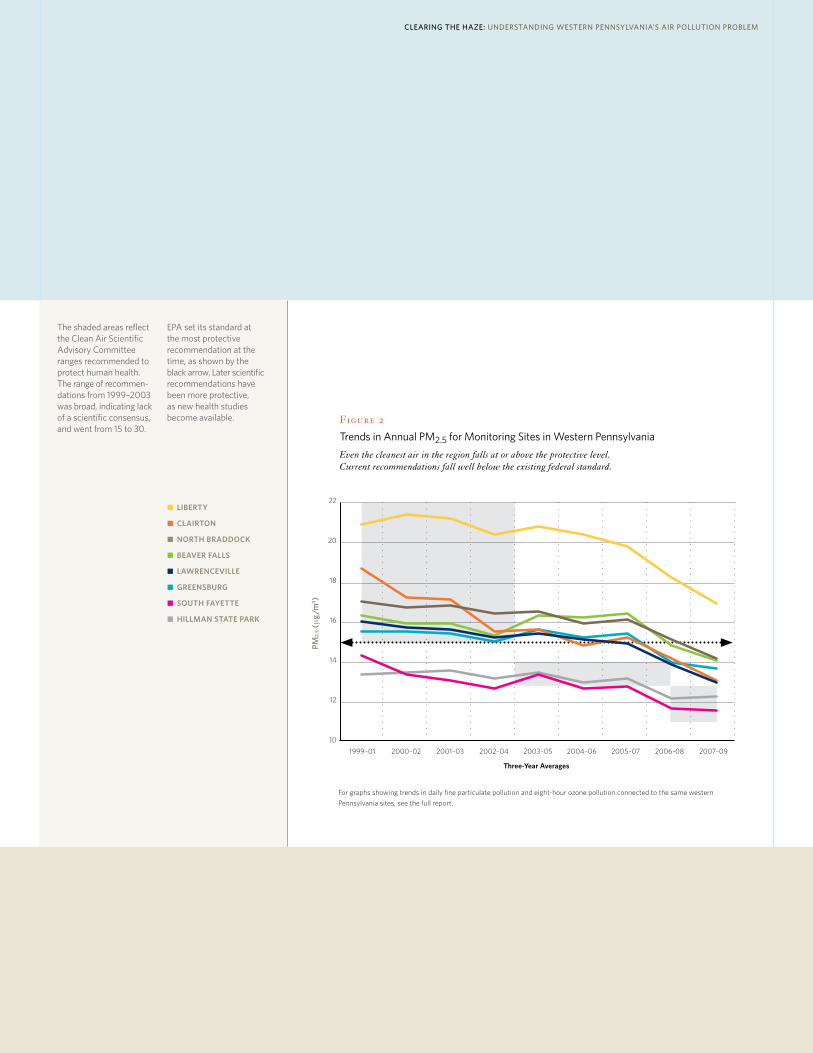
Figure 2
Trends in Annual PM2.5 for Monitoring Sites in Western PennsylvaniaEven the cleanest air in the region falls at or above the protective level. Current recommendations fall well below the existing federal standard.
The shaded areas reflect the Clean Air Scientific Advisory Committee ranges recommended to protect human health. The range of recom mendations from 1999–2003 was broad, indicating lack of a scientific consensus, and went from 15 to 30.
EPA set its standard at the most protective recom mendation at the time, as shown by the black arrow. Later scientific recommendations have been more protective, as new health studies become available.
LiBeRTy
cLaiRTon
noRTh BRaddocK
BeaVeR FaLLs
LawRenceViLLe
GReensBuRG
souTh FayeTTe
hiLLMan sTaTe PaRK
PM2.
5 (μ
g/m
3 )
8
Wind-carried pollution from neighboring states is a significant contributor to western Pennsylvania’s air problem, but failure to clean up in-state pollution prevents the region from improving as fast as other parts of the country.
• Pennsylvania sources may account for one-half to two-thirds of the PM2.5 monitored in the Pittsburgh region on average.
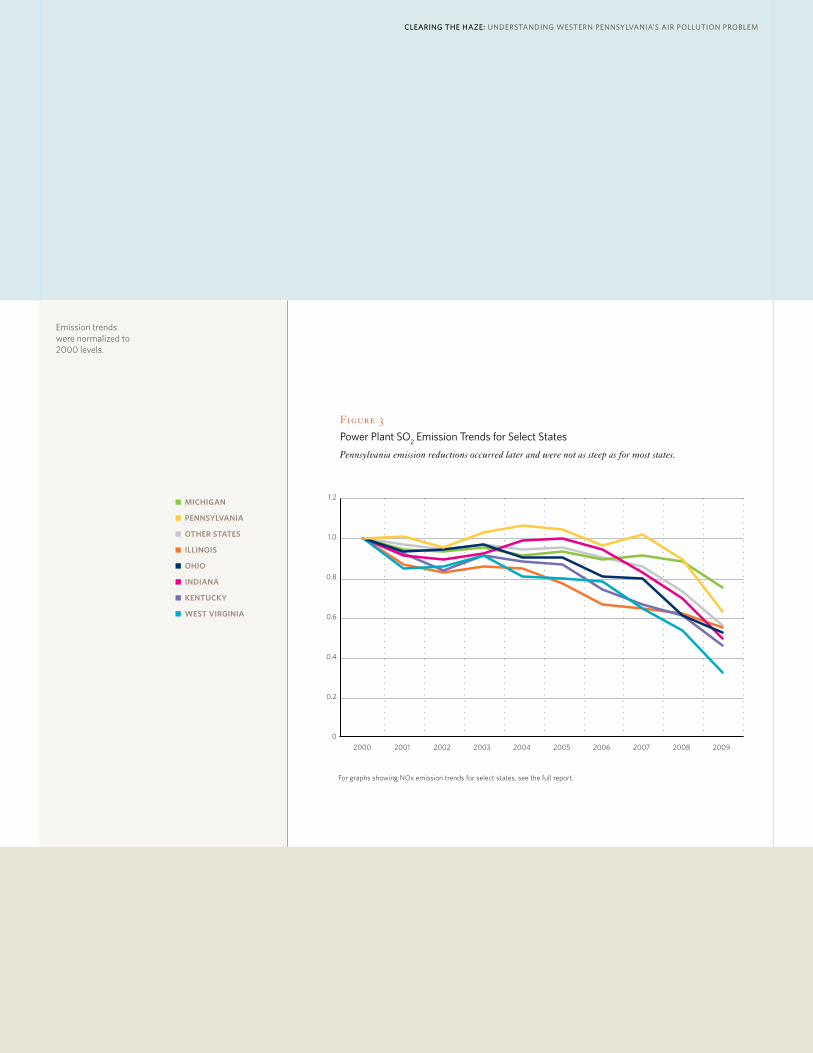
• eight states surpassed Pennsylvania in absolute reductions of sulfur dioxide (so2) emissions across the last decade. Pennsylvania so2 emissions did not start to trend down until 2008. For nitrogen oxides (nox), emissions from Pennsylvania ranked seventh at the beginning of the decade, but climbed to third by the end of the decade. Pennsylvania ranked 15th in absolute reductions of nox emissions.
• The reduction in emissions of so2 (39 percent) and nox (47 percent) from power plants in Pennsylvania from 2000 through 2009 lags the average reduction rate across the other 35 states in the eastern united states (49 percent and 65 percent reductions for so2 and nox, respectively).
• Recent ePa analyses estimate that 30 percent of sulfate fine particulate matter at allegheny county monitors originates from Pennsylvania so2 emissions.
• other ePa analyses estimate that 35 percent of nitrate fine particulate matter at allegheny county monitors originates from Pennsylvania nox emissions.
• Local industrial and mobile sources (cars and other motor vehicles) contribute substantially to air pollution in the region, ranging from 20 to 40 percent of the total fine particulate matter. (Basis is source apportionment modeling.)
• Local sources may account for two-thirds of the fine particulate pollution monitored in areas directly affected by local industry.
• Local sources may account for one-half of the fine particulate pollution monitored in or near urban centers.
What
Was
learned
9
Clearing the haze: understanding western pennsylvania’s air pollution problem
MichiGan
PennsyLVania
oTheR sTaTes
iLLinois
ohio
indiana
KenTucKy
wesT ViRGinia
Figure 3
Power Plant SO2 Emission Trends for Select StatesPennsylvania emission reductions occurred later and were not as steep as for most states.
Source Apportionment Results for Fine Particulate Matter at Two Locations in Allegheny County
Industrial and mobile sources are primarily of local origin. Ammonium sulfate and nitrate are 30–35 percent of local origin based on EPA air quality modeling. Local sources may account for half of the other source types. For fine particulate matter overall, nearly twothirds at Liberty and onehalf at Lawrenceville may be from local sources.
Secondary Ammonium Sulfate38%
Secondary Ammonium Nitrate20%
Crustal and Road Dust8%
MIxed Burning and Cooking17%
Industrial + Mobile Sources17%
Zinc-Rich Sources3%
Secondary Ammonium Sulfate26%
Secondary Ammonium Nitrate11%
Crustal and Road Dust6%
Vegetative Burning8%
Mobile Sources15%
Industrial Sources25%
Halogen-Rich Sources6%
Liberty Source Apportionment
Lawrenceville Source Apportionment
11
Clearing the haze: understanding western pennsylvania’s air pollution problem
To better protect the health of people and the environment, the region needs a more compre hensive air pollution monitoring system, and that system must be able to measure more than particulate matter and ozone pollution.
• The existing pollution monitoring network may not adequately reflect the full range of pollution effects in the region due to complex local terrain combined with local industrial and transportation sources.
• Monitoring networks are primarily designed to demonstrate attainment of air quality standards, and the region’s topography may frustrate the ability to accurately determine air quality for all locations. expanded monitoring is required to reflect the full range of PM2.5 impacts in the region.
• other unmonitored pollutants aside from fine particulate matter and ozone may adversely affect health.
concLusion and RecoMMendaTions
The Clean Air Task Force study presents clear and convincing evidence that the
Pittsburgh region has one of the country’s most serious air pollution problems.
The finding should eliminate any lingering questions about the severity of the
problem. While more research is needed to document the specific negative health
effects resulting from exposure to various pollutants, there is more than enough
evidence to warrant public officials taking immediate action to protect public health.
The study also demonstrates that there is no basis for the argument that the
region’s poor air pollution ranking is due to an outlier monitor in the measuring
system — the unit that, with its placement in Liberty Borough about a mile from
U.S. Steel Corp.’s Clairton Coke Works, registers some of the worst particulate pollution.
The study shows that even if measure ments from that monitor are discounted,
Pittsburgh still falls into the category of worst-polluted cities in the country.
What
Was
learned
12
• SupporttheuseofregulatorytoolssuchastheState
Implementation Plans to better identify local and regional
sources of pollution.
• Requirefollow-throughthatlinksambientairquality
improve ments to specific programmatic elements within