25
UNECA High Level Workshop UNECA High Level Workshop PPPs in Africa’s PPPs in Africa’s Energy Sector Energy Sector James Leigland UNECA Consultant June 29, 2011 Addis Ababa
| Date post: | 29-Dec-2015 |
| Category: |
Documents |
| Upload: | marilyn-pope |
| View: | 218 times |
| Download: | 2 times |
UNECA High Level Workshop UNECA High Level Workshop
PPPs in Africa’sPPPs in Africa’sEnergy SectorEnergy Sector
James Leigland
UNECA Consultant June 29, 2011 Addis Ababa

Questions
1. Why start with power?
2. Can PPPs help?
3. How much help is needed?
4. What are the key types of PPP projects in the power sector?
5. What is the biggest challenge for large power PPPs?
6. Conclusions
Why Start with Power?

Electricity infrastructure is central to economic growth and poverty reduction, but SSA’s…
“…is the least developed, least accessible, least reliable, most costly to operate, and, on average, highest priced of any region in the world.”
Source: U.S. International Trade Commission, 2009
Power sector in crisis
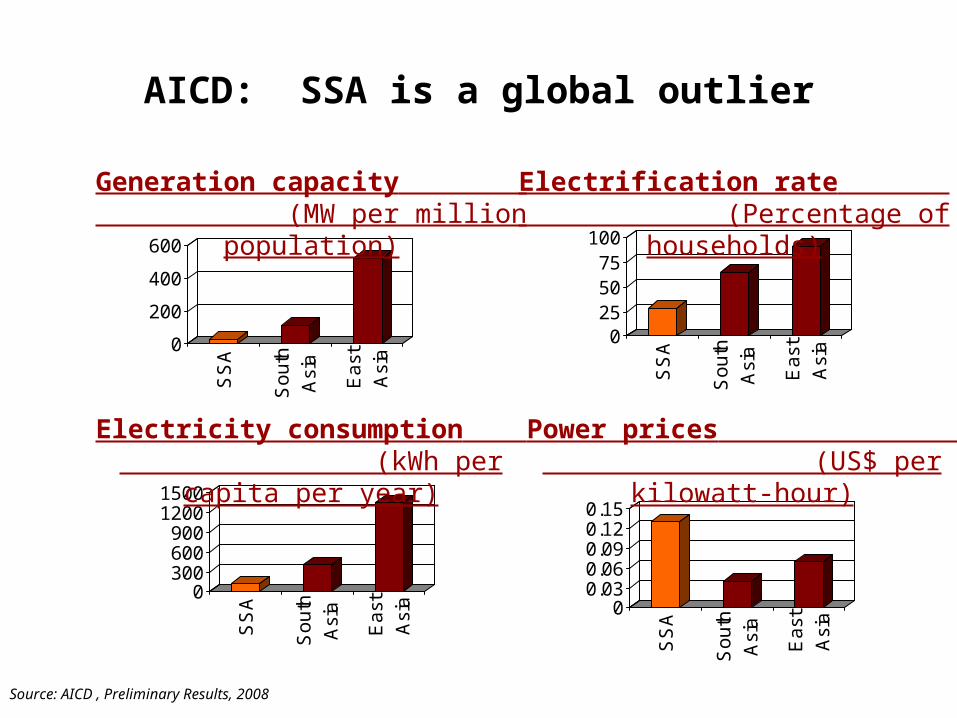
AICD: SSA is a global outlier
0
200
400
600SSA
South
Asia
East
Asia
0255075100
SSA
South
Asia
East
Asia
030060090012001500
SSA
South
Asia
East
Asia 0
0.030.060.090.120.15
SSA
South
Asia
East
Asia
Generation capacity (MW per million population)
Electrification rate (Percentage of households)
Electricity consumption (kWh per capita per year)
Power prices (US$ per kilowatt-hour)
Source: AICD , Preliminary Results, 2008

Impacts
• Business sector:o Face 56 days of outages per yearo Lost sales revenues
• 5-6% formal sector• 20% informal sector
o Equipment damage cost 1% sales revenueo Most large firms run generators $0.40/kwh
• Social services:o Lack of illumination/refrigeration in health serviceso Absence of lighting affects educationo Power disproportionately affects most other sectors

Causes
• Small systems:o 23 systems < 200 MW - 36 systems < 1,000 MW
• Inefficient technology:o SSA has 10% of world’s hydropower resources – less
than 1% exploited (65% coal)
• Management inefficiencies:o cost $6 billion per year
• Precipitating factors: o drought, conflict, oil price shock

Can PPPs help in
the power sector?

Widely used in developing countries
Source: PPI Project Database
Current US millions
-
10 000
20 000
30 000
40 000
50 000
60 000
70 000
80 000 19
95
1996
1997
1998
1999
2000
2001
2002
2003
2004
2005
2006
2007
2008
2009
Global
SSA
Globally, 45% of PPI went to power in 2009, in SSA only 3.5%

• Generation benefits: 2/3 of IPPs in 12 countries resulted in…
“…investment leading to power generation, at prices and quality levels that met reasonable government expectations”
(Woodhouse, 2005)
• Distribution benefits: 160 PPPs vs. 90 SOEs… decreased distribution losses by 11% increased bill collection rates by 45% increased the electricity sold per worker by 32% increased number of residential connections by 29%
(Gassner, et al., 2009)
Global performance
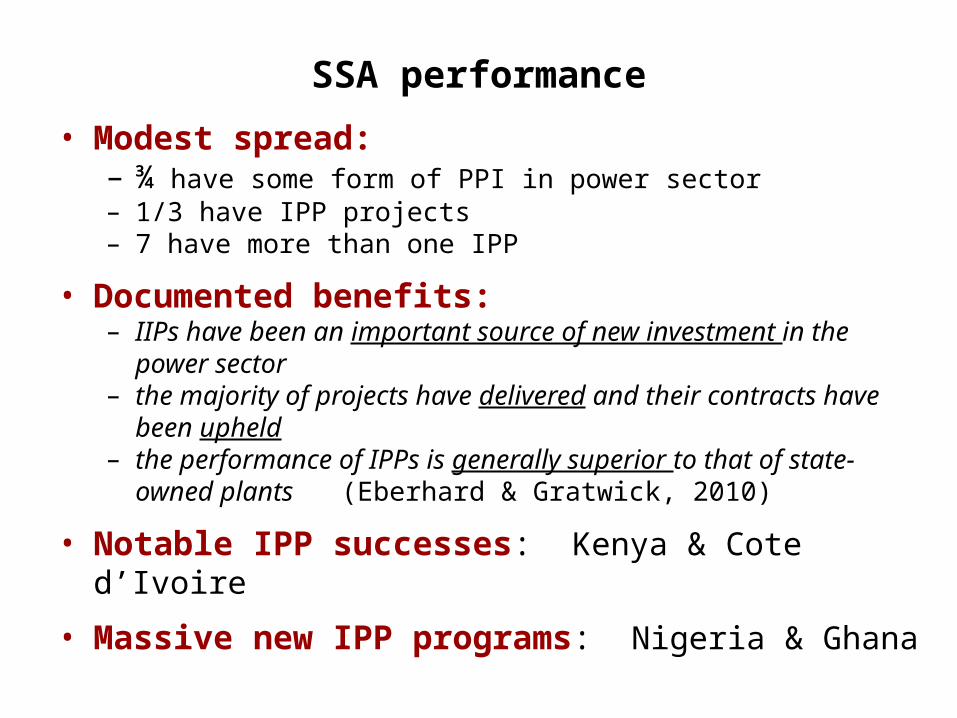
• Modest spread:– ¾ have some form of PPI in power sector – 1/3 have IPP projects– 7 have more than one IPP
• Documented benefits:– IIPs have been an important source of new investment in the
power sector – the majority of projects have delivered and their contracts have
been upheld– the performance of IPPs is generally superior to that of state-
owned plants (Eberhard & Gratwick, 2010)
• Notable IPP successes: Kenya & Cote d’Ivoire
• Massive new IPP programs: Nigeria & Ghana
SSA performance

How much help is needed?

Electricity ICT Irrigation Transport WSS TOTAL
Spending needs 40.8 9.0 3.4 18.2 21.9 93.3
O&M 14.1 2.0 0.6 8.8 7.0 33.0Capex 26.7 7.0 2.7 9.4 14.9 60.4
Existing spending 11.6 9.0 0.9 16.2 7.6 45.3
O&M 7.0 2.0 0.6 7.8 3.1 20.4Capex 4.6 7.0 0.3 8.4 4.5 24.9
Funding Gap 29.2 0.0 2.5 2.0 14.3 48.061% 0% 5% 4% 30% 100%
O&M 7.1 0.0 0.0 1.0 3.9 12.6Capex 22.1 0.0 2.4 1.0 10.4 35.5
SSA’s power sector needs = 61%of required new investment
Source: AICD 2010
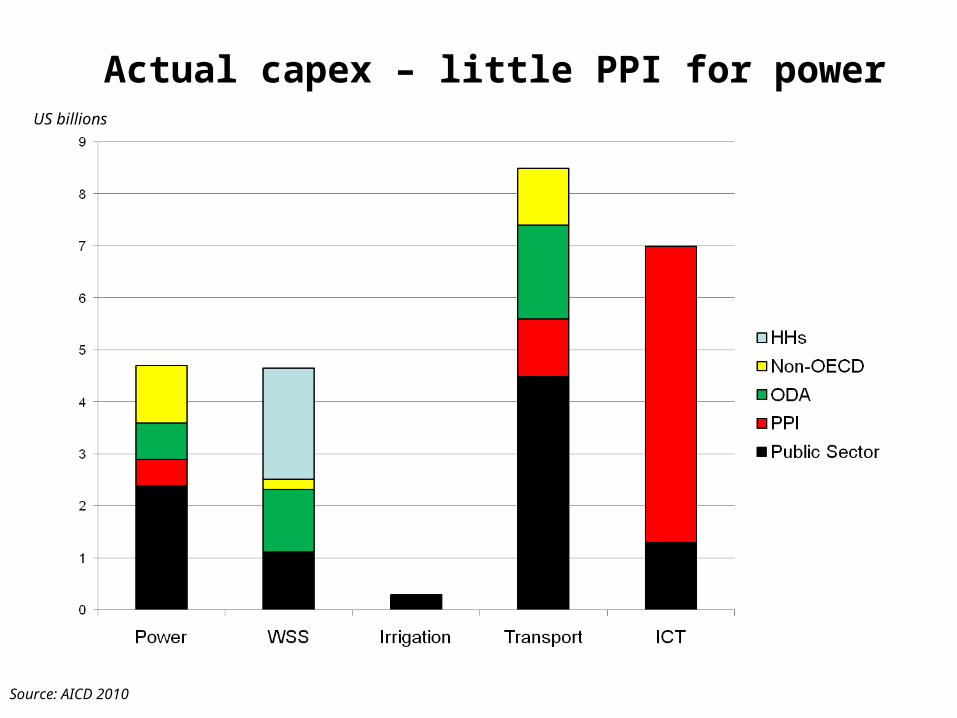
Actual capex – little PPI for power
Source: AICD 2010
US billions

Additional funding needed
Source: AICD 2010
US billions

Additional funding needed
Source: AICD 2010
US billions
What are the key types of
PPP projects in
the power sector?

Types of PPI projects in power
• 20 IPPs in 10 years; average size = 91 MW IPPs essential but remain marginal in SSA
SAA’s available generating capacity (without SA) (less than Argentina, Thailand, or Turkey)
• 7 distribution concessions in 10 years Important because of massive rehab needs (60% of assets)
Huge risks require extensive mitigation
Example: Umeme in Uganda
• 8 mgmt or lease contracts in 10 years Efficiency improvements crucial Seem to meet targets but often blamed for sector-wide problems Examples: Tanesco and KPLC

Regional Hydro IPPs
• The need for hydro IPP projects is clear Nepad, AU, RECs recognize the need for large hydro IPPs Power projects much more attractive over 200mw Regional hydro would allow power trading
• But performance has been disappointing STAP unsuccessful Only two national-level hydro IPP in last decade (Bui & Bujagali) Key countries: DRC, Ethiopia, Guinea Need for power “exporters” and “importers” Inga III illustrates problems with truly regional hydro IPPs
• Key role of national governments• Will PIDA help?

What is the biggest
challenge for large
power PPPs? Project preparation funding
and expertise

Upstream Phase 1: Enabling Designing enabling legislation
Preparation Environment Designing regulatory approaches
Project relevant institutional reforms
Policy reforms
Capacity building to support projects
Consensus building re projects
Phase 2: Project Identification of desired outputs
Definition Prioritization vs. other projects
Identification of project champions
Action planning (TORs, etc.)
Pre-feasibility studies
Phase 3: Project Financial modeling
Feasibility Economic, Social, Technical, and
Environmental studies
Phase 4: Project Public/private options assessment
Downstream Structuring Project finance
Preparation Legal structuring
Phase 5: Transaction Procurement/ contract drafting
Support Financial/ legal negotiations
Phase 6: Post-Signing Post-signing financial arrangements
Support 5-year tariff reviews
Renegotiation/ refinancing
Upstream preparation adds to costs in SSA

Preparation in LICs – Hugely expensive
• How much does PPP preparation cost in the UK? 2005 study of downstream preparation costs on 55 UK PPPs:
o Government = 3.5%
o Winning bidder = 3.8%
o Losing bidders = 5.0%
About 12% of capital value
• How much does PPP preparation cost in a LIC? 2010 DFID-funded study of upstream costs plus downstream
preparation costs:o Government = 3-5% (for upstream prep)o Government = 4-5% (for downstream prep)o Winning bidder = 4-5%o Losing bidders = 6-7%o Premium = 2-3% (for new/difficult sectors)
About 19-25% of capital value
Minimum total govt prep costs on a $100m IPP (72 mw) > $8m

Project preparation – What is needed?
• Who has money for PPP project preparation?
DevCo/IFC Advisory, Nepad IPPF, DBSA prep funds, REC funds, EU-Africa ITF, InfraVentures, WB trust funds (PPIAF, GPOBA, etc.), PIDG facilities
But not enough money or expertise for large PPPs
• What happens if grant funding is insufficient? Delayed start-up, delayed draw-downs Rigidly sequential preparation Increased costs, overall delays, project misfires
• What is needed? Special donor funded facility for large project preparation To provide funding plus preparation expertise $300 million needed for 3-year pilot period – just for power

• Power is central to growth & poverty reduction• But SSA’s power sector is in crisis• PPI in power is important in other regions (44% of PPI)• But only 3.5% of total PPI in SSA – a fraction of total capex
needed in the sector• Regional power PPI needed for size, access to hydro
power, and power trading – but even more difficult to do (never been done)
• Changes needed in govt attitudes, capacity, and enabling environments to facilitate more PPPs
• More grant funding needed for project preparation• Minimum $300 million needed now for 3-year pilot facility –
just for power
Conclusions

Thank you


