Unequal Access to College in China: HowFar Have Poor, Rural Students Been LeftBehind?*Hongbin Li†, Prashant Loyalka‡, Scott Rozelle§, Binzhen Wu** and Jieyu Xie††
AbstractIn the 1990s, rural youth from poor counties in China had limited access tocollege. After mass college expansion started in 1998, however, it was unclearwhether rural youth from poor counties would gain greater access. The aim ofthis paper is to examine the gap in college and elite college access between ruralyouth from poor counties and other students after expansion. We estimate thegaps in access by using data on all students who took the college entranceexam in 2003. Our results show that gaps in access remained high even afterexpansion. Rural youth from poor counties were seven and 11 times less likelyto access any college and elite Project 211 colleges than urban youth, respect-ively. Much larger gaps existed for disadvantaged subgroups (female or ethnicminority) of rural youth from poor counties. We also find that the gaps in col-lege access were mainly driven by rural–urban differences rather than differ-ences between poor and non-poor counties within rural or urban areas.
Keywords: China; inequality; college access; rural; poor; college expansion
During the last century, a large number of developed and developing countriesunderwent higher education expansion.1 Since 1960, the number of students incollege worldwide increased by almost five times, from 29 to 141 million.2 This
* We would like to thank the Tsinghua University China Data Center for supporting this work. The sup-port of CK and Mei Liu is also gratefully acknowledged. Hongbin Li acknowledges financial supportfrom the National Natural Science Foundation of China (Project ID: 71025004 and 71121001). BinzhenWu acknowledges the support of the National Natural Science Foundation of China (Project ID:70903042 and 71373136).
Cambridge Core terms of use, available at https://www.cambridge.org/core/terms. https://doi.org/10.1017/S0305741015000314Downloaded from https://www.cambridge.org/core. Stanford Graduate School of Business, on 22 May 2018 at 22:31:47, subject to the
expansion has resulted in a much greater number of individuals, from a wide var-iety of social and economic backgrounds, accessing college and benefiting fromthe higher economic payoffs associated with college.3
Although expansion allows more students to access (and benefit from) college,it does not unambiguously reduce gaps in access between students from disadvan-taged (for example, poor, rural) and advantaged backgrounds. Empiricalresearch from specific countries shows, for example, that substantial gaps inaccess to college (especially elite colleges) may persist after expansion.4
Understanding whether gaps in access persist is important, since large gapsmay lead to greater social and intergenerational inequality, as well as have animpact on national economic development.5
Indeed, although China underwent one of most rapid college expansions in his-tory in 1998, researchers have not examined China’s post-expansion gaps in col-lege and elite college access accurately or in sufficient detail. For example, somestudies have shown a gap in college access between poor and non-poor house-holds.6 However, they have relied on survey samples that were not nationally rep-resentative and thus the findings of these studies might have suffered from sampleselection bias (either overestimating or underestimating the gap in college access)and/or might have lacked generalizability. One exception is Hongbin Li andBinzhen Wu, who use nationally representative data from 2003 to show thatonly 43 per cent of students who accessed elite Project 211 colleges7 and 18 percent of students who accessed China’s top two colleges were from rural areas(despite the population shares of rural students being higher than urban stu-dents).8 While these findings are important, they do not estimate the gap in col-lege access between more specific groups such as rural students from poorcounties and urban students from non-poor counties. Furthermore, with theexception of Li and Wu, we are unaware of any study that has examined gapsin elite college access. Moreover, no study we know of has used nationally repre-sentative data to examine the degree to which rural youth from poor countieswere able to access college and elite college versus more advantaged groups ofyouth.The overall goal of our paper is to examine the nature of access to college and
elite college for rural youth (students with a rural as opposed to an urban residen-tial permit or hukou 户口) from poor counties (one of the 592 counties that thegovernment in China designates as “poor”) and other youth in China. We usea unique set of micro-level data on all students (6.2 million) who took the college
3 Carnoy, Loyalka and Froumin 2013.4 Reimer and Pollack 2010; Shavit et al. 2007; Ayalon and Shavit 2004.5 Hannum and Buchmann 2003.6 Wang et al. 2007.7 In the 1990s, the Chinese government put forward a proposal to “enhance 100 colleges in the 21st cen-
tury,” which was later called Project 211. Although the proposal indicates only 100 colleges, in practice112 are covered by this project. Colleges covered by the Project have longer histories and offer high-quality education; more importantly, they also receive more financial support from the government.
8 Li and Wu 2012.
186 The China Quarterly, 221, March, 2015, pp. 185–207
Cambridge Core terms of use, available at https://www.cambridge.org/core/terms. https://doi.org/10.1017/S0305741015000314Downloaded from https://www.cambridge.org/core. Stanford Graduate School of Business, on 22 May 2018 at 22:31:47, subject to the
entrance exam in China in 2003 as well as supplemental data from the 2000Census to estimate differences in the proportion of rural youth from poor coun-ties (versus urban youth from non-poor counties) who were able to access (a) anycollege; (b) four-year colleges (benke 本科); or (c) various levels of elite colleges.In addition to examining access gaps for rural youth from poor counties (in gen-eral), we also estimate the nature of access to college and elite college for sub-groups in China’s poor areas (for example, female, ethnic minority). Unlikeprevious studies, our data allow us to examine nationwide inequalities in accessto college in general, and access to elite college in particular, at a period severalyears after Chinese policymakers initiated the mass expansion of collegeenrolments.According to our analysis, we find large and significant differences in the
degree to which rural youth from poor counties access college and elite collegescompared to more advantaged youth. We find that 7 per cent of rural youth frompoor counties could access any college in 2003, compared to 48 per cent of urbanyouth. In other words, urban youth were able to access (any) college at rates near-ly seven times more than rural youth from poor counties (48/7). The gap in accessto elite colleges was even wider. For example, only 0.6 per cent of rural youthfrom poor counties were able to access China’s elite Project 211 colleges com-pared to 7 per cent of urban youth (a gap of 11 times). Even wider gaps inelite college access existed for disadvantaged subgroups of rural youth frompoor counties. For example, only 0.4 per cent of rural, female, minority youthfrom poor counties could access an elite 211 college in 2003, compared to 7.5per cent of urban, male, Han youth from non-poor counties (a gap of 19times). Taken as a whole, the findings clearly indicate that, after expansion,youth from disadvantaged backgrounds were not accessing college (and elite col-lege) at rates anywhere near those of youth from advantaged backgrounds.
BackgroundCollege access was extremely limited in China in the 1990s. In 1990, the grossenrolment rate for college (the percentage of 18- to 22-year-olds in the populationthat attended college) was only 3.4 per cent.9 The gross enrolment rate was notonly much lower than that of developed countries such as the United States(71 per cent), but was even lower than that of developing countries such asBrazil (11 per cent) or India (6 per cent).10
The low college enrolment rate in China meant that disadvantaged studentshad fewer chances to access college than advantaged students.11 In 1990, rural19- to 22-year-olds were seven times less likely to access college compared to
9 NBS 1990.10 World Bank 1990.11 In China, disadvantaged means poor and rural. See World Bank 2000.
Unequal Access to College in China 187
Cambridge Core terms of use, available at https://www.cambridge.org/core/terms. https://doi.org/10.1017/S0305741015000314Downloaded from https://www.cambridge.org/core. Stanford Graduate School of Business, on 22 May 2018 at 22:31:47, subject to the
urban youth.12 The large gap in college access, in fact, persisted throughout the1990s. By 2000, rural youth were eight times less likely to access college com-pared to urban youth.13
In 1998, the dynamics of college access started to change as China’s policy-makers initiated one of the largest expansions in college enrolments in history.The number of students who could attend college increased from one millionto 5.7 million, or from 6 per cent to 22 per cent of the age cohort from 1998to 2007.14 The improved access to college led many to believe that rural studentsfrom poor counties would gradually obtain more equal access to college.15
Even with college expansion, however, there were reasons to believe that ruralstudents from poor counties would continue to have unequal access to college.First, along with expansion, college tuition rates rose. The rising tuition ratesmade it difficult for rural households from poor counties to afford a college edu-cation.16 Second, rural students from poor counties had fewer resources withwhich to prepare for China’s increasingly competitive high school and collegeentrance exams.17 Because rural students from poor counties tended to havelower exam scores than urban students from non-poor counties, they wereexpected to be less qualified for academic high schools, colleges and elite col-leges.18 Part of the problem was that rural students from poor counties hadunequal access to high quality kindergartens, primary schools and junior highschools, which could help to prepare them for competitive entrance exams.19
Poor preparation for competitive entrance exams combined with high and risingopportunity costs may have also caused many rural students from poor countiesto drop out before high school.20
In addition to having less access to college, rural students from poor counties mayhave had even less access to elite colleges. Policymakers in China expanded collegeenrolment quotas by five times from 1998 to 2006, but only expanded elite collegeenrolment quotas by 30 per cent.21 Thus, even if the expansion in enrolmentsimproved access to college for rural students from poor counties, it is not clear ifthe expansion movement did anything to improve their access to elite colleges.
Data and MethodsOur main source of information on access to college and elite colleges comesfrom a dataset that contains records on every student who took the college
12 Wu and Zhang 2010.13 Ibid.14 NBS various years.15 Rong and Shi 2001.16 Wang et al. 2007.17 Wu 2010.18 Sirin 2005.19 Liu et al. 2009; Wu 2010.20 Hannum and Wang 2006; Yi et al. 2012.21 NBS various years.
188 The China Quarterly, 221, March, 2015, pp. 185–207
Cambridge Core terms of use, available at https://www.cambridge.org/core/terms. https://doi.org/10.1017/S0305741015000314Downloaded from https://www.cambridge.org/core. Stanford Graduate School of Business, on 22 May 2018 at 22:31:47, subject to the
entrance exam (CEE). We call this dataset the 2003 CEE dataset. The datainclude records on the entire population of 6.2 million students who took the col-lege entrance exam in China in 2003. The 2003 CEE dataset contains informationin two blocks that allow us to achieve our objectives of documenting the educa-tion gaps (and the nature of the gaps) between rural students from poor countiesand other students in China.The first block of the 2003 CEE dataset contains detailed information on
student backgrounds. We have information on whether a particular student’shukou is urban or rural. Importantly, we also know each student’s county of resi-dence. If a student resides in one of the 592 nationally designated poor counties(as identified by the Chinese government in 2003), we determine that student tobe “from poor counties.”22 With the information on each student’s residentialpermit status and county name, we can identify whether the student is a rural stu-dent from a poor county. Other variables allow us to identify student gender andethnicity. In particular, we use the information on ethnicity to identify whether astudent belongs to one of China’s 55 minority groups or belongs to the Hanmajority.The 2003 CEE dataset also contains information on each student’s college
admissions outcome. China’s college admissions process assigns each studentto only one college (or to no college). After the admissions process is finished,students cannot transfer between colleges. By appropriately categorizing the col-lege admissions outcome for each student, we can calculate how many studentsfrom different backgrounds could access (a) any college; (b) four-year colleges;(c) elite Project 211 colleges; (d) elite Project 985 colleges;23 or (e) the top two col-leges in China (Peking University or Tsinghua University).To supplement information from the 2003 CEE dataset, we also use a 1 per
cent random sample of the 2000 Census data to calculate the number of youthfrom different backgrounds/localities in each age cohort. The number of youthin each age cohort represents the number of youth who could have gone to col-lege if college access was universal. In particular, we use the 2000 Census data toestimate the total number of 18-year-olds in 2003 (that is, by counting the num-ber of 15-year-olds in 2000). Because the Census data have the same informationon background characteristics as does the 2003 CEE dataset (gender, ethnicity,hukou and locality of residence), we can estimate the number of 18-year-oldswith different background characteristics in China’s population in 2003 (the num-ber of 15-year-olds from different backgrounds in 2000).By dividing the number of students from different backgrounds who can access
college and elite college (calculated using the CEE data) by the total number of
22 World Bank 2000.23 On 4 May 1998, then-president Jiang Zemin proposed that China needed to build up world class uni-
versities during the Peking University Centenary Celebration. Subsequently, the Chinese governmentlaunched a project to increase financial support for elite colleges. This project is typically referred toas the Project 985. In practice, 39 colleges are covered by this project. All colleges covered by Project985 must also be covered by Project 211.
Unequal Access to College in China 189
Cambridge Core terms of use, available at https://www.cambridge.org/core/terms. https://doi.org/10.1017/S0305741015000314Downloaded from https://www.cambridge.org/core. Stanford Graduate School of Business, on 22 May 2018 at 22:31:47, subject to the
18-year-olds from different backgrounds in China’s population (estimated usingthe 2000 Census data), we can estimate the proportion of 18-year-olds from dif-ferent backgrounds that were able to access college and elite colleges. Forinstance, we can estimate the number of rural students from poor counties whocan access college by using the CEE data and the total number of rural youth(18-year-olds) from poor counties by using the Census data. We can then estimatethe proportion of rural youth from poor counties that were able to access collegeby dividing the number of rural students from poor counties who can access col-lege by the total number of rural youth (18-year-olds) from poor counties. Withthe same method, we can estimate the proportion of urban youth from non-poorcounties that were able to access college.By comparing the proportion of rural students from poor counties and the pro-
portion of urban students from non-poor counties who were able to access col-lege, we are able to examine the college access gap between rural studentsfrom poor counties and urban students from non-poor counties. This informationcan also be used to look at the elite college access gap in China in 2003.To provide a baseline from which to compare the degree of college and
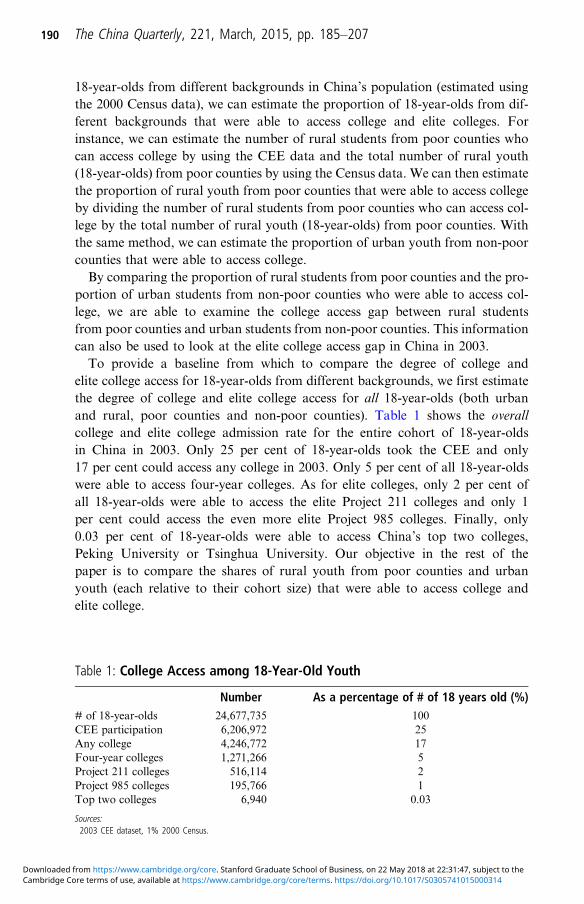
elite college access for 18-year-olds from different backgrounds, we first estimatethe degree of college and elite college access for all 18-year-olds (both urbanand rural, poor counties and non-poor counties). Table 1 shows the overallcollege and elite college admission rate for the entire cohort of 18-year-oldsin China in 2003. Only 25 per cent of 18-year-olds took the CEE and only17 per cent could access any college in 2003. Only 5 per cent of all 18-year-oldswere able to access four-year colleges. As for elite colleges, only 2 per cent ofall 18-year-olds were able to access the elite Project 211 colleges and only 1per cent could access the even more elite Project 985 colleges. Finally, only0.03 per cent of 18-year-olds were able to access China’s top two colleges,Peking University or Tsinghua University. Our objective in the rest of thepaper is to compare the shares of rural youth from poor counties and urbanyouth (each relative to their cohort size) that were able to access college andelite college.
Table 1: College Access among 18-Year-Old Youth
Number As a percentage of # of 18 years old (%)# of 18-year-olds 24,677,735 100CEE participation 6,206,972 25Any college 4,246,772 17Four-year colleges 1,271,266 5Project 211 colleges 516,114 2Project 985 colleges 195,766 1Top two colleges 6,940 0.03
Sources:2003 CEE dataset, 1% 2000 Census.
190 The China Quarterly, 221, March, 2015, pp. 185–207
Cambridge Core terms of use, available at https://www.cambridge.org/core/terms. https://doi.org/10.1017/S0305741015000314Downloaded from https://www.cambridge.org/core. Stanford Graduate School of Business, on 22 May 2018 at 22:31:47, subject to the
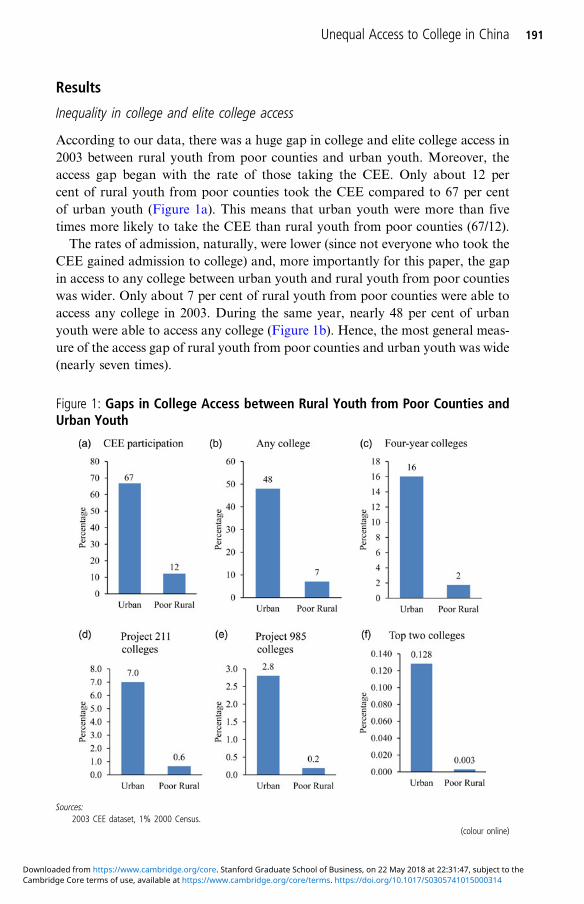
According to our data, there was a huge gap in college and elite college access in2003 between rural youth from poor counties and urban youth. Moreover, theaccess gap began with the rate of those taking the CEE. Only about 12 percent of rural youth from poor counties took the CEE compared to 67 per centof urban youth (Figure 1a). This means that urban youth were more than fivetimes more likely to take the CEE than rural youth from poor counties (67/12).The rates of admission, naturally, were lower (since not everyone who took the
CEE gained admission to college) and, more importantly for this paper, the gapin access to any college between urban youth and rural youth from poor countieswas wider. Only about 7 per cent of rural youth from poor counties were able toaccess any college in 2003. During the same year, nearly 48 per cent of urbanyouth were able to access any college (Figure 1b). Hence, the most general meas-ure of the access gap of rural youth from poor counties and urban youth was wide(nearly seven times).
Figure 1: Gaps in College Access between Rural Youth from Poor Counties andUrban Youth
Sources:2003 CEE dataset, 1% 2000 Census.
(colour online)
Unequal Access to College in China 191
Cambridge Core terms of use, available at https://www.cambridge.org/core/terms. https://doi.org/10.1017/S0305741015000314Downloaded from https://www.cambridge.org/core. Stanford Graduate School of Business, on 22 May 2018 at 22:31:47, subject to the
The gaps in access to four-year college and elite college between rural youth frompoor counties and urban youth were even larger. Only 2 per cent of rural youth frompoor counties could access four-year colleges compared to 16 per cent of urban youth(Figure 1c). Only 0.6 per cent of rural youth from poor counties could gain access toelite Project 211 colleges compared to 7 per cent of urban youth (Figure 1d). The gapin access to the most elite colleges was the widest. At the extreme, only 0.003 per centof rural youth from poor counties could access China’s top two colleges compared to0.13 per cent of urban youth (Figure 1f). In summary, rural youth from poor coun-ties were eight times, 11 times, and 43 times less likely to access four-year colleges,elite Project 211 colleges and the top two colleges than urban youth, respectively.To understand our results better, the gaps in college access between rural youth
from poor counties and all urban youth are further decomposed into three separ-ate components. The first component is gaps in college access between ruralyouth and urban youth. The second component is gaps in college access betweenrural youth from poor counties and rural youth from non-poor counties. Thethird component is gaps in college access between urban youth from poor coun-ties and urban youth from non-poor counties.To understand the gap between rural and urban better, we start by noting the
work undertaken by Li and Wu.24 According to Li and Wu, 52 per cent of stu-dents in any college were from rural areas. They also found that 49 per cent and43 per cent of students in four-year and elite Project 211 colleges were from ruralareas. However, they did not estimate the share of rural youth in the populationthat could access college and elite college (which is important in determining theaccess gap as we are defining it in this paper – since the population share of ruralyouth is higher than the population share of urban youth).When we estimate the first gap between rural and urban students, we find that
only 10 per cent of rural youth could access any college in 2003 compared to 48per cent of urban youth. Hence, rural youth (those in both poor and non-poorareas) were approximately five times less likely than urban youth to access any col-lege. The rural and urban gap was even wider in access to elite colleges. Only 3 percent of rural youth gained access to four-year colleges compared to 16 per cent ofurban youth (see Table 2, row 2). Moreover, only 1 per cent of rural youth accessedelite Project 211 colleges compared to 7 per cent of urban youth (Table 2, row 3).In other words, rural youth were five times less likely than urban youth to
access four-year colleges and seven times less likely than urban youth to accesselite Project 211 colleges. This first gap (between any rural youth and urbanyouth) is narrower than the overall access gap between poor, rural youth andurban youth for four-year colleges (eight times) and elite Project colleges (11times). However, a large part of the overall access gap in four-year college andelite college access between poor, rural youth and urban youth is owing to thegap in access between rural youth and urban youth.
24 Li and Wu 2012.
192 The China Quarterly, 221, March, 2015, pp. 185–207
Cambridge Core terms of use, available at https://www.cambridge.org/core/terms. https://doi.org/10.1017/S0305741015000314Downloaded from https://www.cambridge.org/core. Stanford Graduate School of Business, on 22 May 2018 at 22:31:47, subject to the
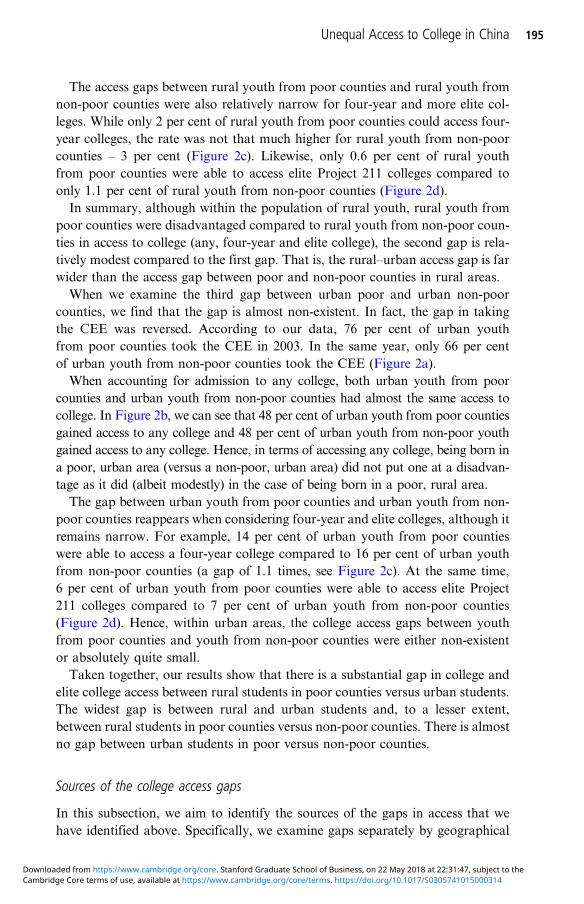
When we examine the second gap (between rural youth in poor versus non-poorcounties), we find significant but less stark differences in college and elite collegeaccess. In 2003, 7 per cent of rural youth from poor counties accessed any college.In the same year, 11 per cent of rural youth from non-poor counties accessed anycollege (Figure 2b). Hence, the access gap between rural youth from poor countiesand rural youth from non-poor counties was only about 1.5 times – 11/7).
Figure 2: Gaps in College Access between Urban Non-poor, Urban Poor, RuralNon-poor and Rural Poor Youth
Sources:2003 CEE dataset, 1% 2000 Census.
(colour online)
194 The China Quarterly, 221, March, 2015, pp. 185–207
Cambridge Core terms of use, available at https://www.cambridge.org/core/terms. https://doi.org/10.1017/S0305741015000314Downloaded from https://www.cambridge.org/core. Stanford Graduate School of Business, on 22 May 2018 at 22:31:47, subject to the
The access gaps between rural youth from poor counties and rural youth fromnon-poor counties were also relatively narrow for four-year and more elite col-leges. While only 2 per cent of rural youth from poor counties could access four-year colleges, the rate was not that much higher for rural youth from non-poorcounties – 3 per cent (Figure 2c). Likewise, only 0.6 per cent of rural youthfrom poor counties were able to access elite Project 211 colleges compared toonly 1.1 per cent of rural youth from non-poor counties (Figure 2d).In summary, although within the population of rural youth, rural youth from
poor counties were disadvantaged compared to rural youth from non-poor coun-ties in access to college (any, four-year and elite college), the second gap is rela-tively modest compared to the first gap. That is, the rural–urban access gap is farwider than the access gap between poor and non-poor counties in rural areas.When we examine the third gap between urban poor and urban non-poor
counties, we find that the gap is almost non-existent. In fact, the gap in takingthe CEE was reversed. According to our data, 76 per cent of urban youthfrom poor counties took the CEE in 2003. In the same year, only 66 per centof urban youth from non-poor counties took the CEE (Figure 2a).When accounting for admission to any college, both urban youth from poor
counties and urban youth from non-poor counties had almost the same access tocollege. In Figure 2b, we can see that 48 per cent of urban youth from poor countiesgained access to any college and 48 per cent of urban youth from non-poor youthgained access to any college. Hence, in terms of accessing any college, being born ina poor, urban area (versus a non-poor, urban area) did not put one at a disadvan-tage as it did (albeit modestly) in the case of being born in a poor, rural area.The gap between urban youth from poor counties and urban youth from non-
poor counties reappears when considering four-year and elite colleges, although itremains narrow. For example, 14 per cent of urban youth from poor countieswere able to access a four-year college compared to 16 per cent of urban youthfrom non-poor counties (a gap of 1.1 times, see Figure 2c). At the same time,6 per cent of urban youth from poor counties were able to access elite Project211 colleges compared to 7 per cent of urban youth from non-poor counties(Figure 2d). Hence, within urban areas, the college access gaps between youthfrom poor counties and youth from non-poor counties were either non-existentor absolutely quite small.Taken together, our results show that there is a substantial gap in college and
elite college access between rural students in poor counties versus urban students.The widest gap is between rural and urban students and, to a lesser extent,between rural students in poor counties versus non-poor counties. There is almostno gap between urban students in poor versus non-poor counties.
Sources of the college access gaps
In this subsection, we aim to identify the sources of the gaps in access that wehave identified above. Specifically, we examine gaps separately by geographical
Unequal Access to College in China 195
Cambridge Core terms of use, available at https://www.cambridge.org/core/terms. https://doi.org/10.1017/S0305741015000314Downloaded from https://www.cambridge.org/core. Stanford Graduate School of Business, on 22 May 2018 at 22:31:47, subject to the
regions to identify which region contributes most to the gaps. We examine twogaps in turn. We first examine the largest source of inequality in access – therural–urban gap. Then, we examine the gap between rural youth from poor coun-ties and rural youth from non-poor counties. Finally, we seek to understand whythere is almost no access gap between urban youth from poor counties and urbanyouth from non-poor counties.Sources of the gap between rural youth and urban youth. To gain insight into
why the gap in college access was so large between rural and urban youth, weexamine gaps separately for eastern, central, and western regions.25 In easternChina, urban youth were three times more likely to access any college thanrural youth (Figure 3). In central China, urban youth were five times more likelyto access any college. In western China, the rural–urban gap was six times. As foraccess to elite colleges across regions, urban youth in eastern China were fivetimes more likely to access elite Project 211 colleges than rural youth. In centralChina, urban youth were seven times more likely to access Project 211 collegesthan rural youth. In western China, the rural–urban gap in access to Project211 colleges was nine times. Hence, even though there was a large gap betweenrural and urban youth in access to any college, the major sources of the rural–urban gap were in central and western China.
Figure 3: Rural–Urban Gaps in College Access across Regions
Sources:2003 CEE dataset, 1% 2000 Census.
(colour online)
25 We define the regions as follows: eastern China includes Beijing, Tianjin, Liaoning, Shandong, Jiangsu,Zhejiang, Fujian and Guangdong; central China includes Heilongjiang, Jilin, Hebei, Henan, Shanxi,Shaanxi, Hunan, Hubei, Anhui, Jiangxi, Guangxi and Hainan; and western China includes InnerMongolia, Ningxia, Gansu, Qinghai, Xinjiang, Sichuan, Yunnan, Guizhou, Chongqing and Tibet.
196 The China Quarterly, 221, March, 2015, pp. 185–207
Cambridge Core terms of use, available at https://www.cambridge.org/core/terms. https://doi.org/10.1017/S0305741015000314Downloaded from https://www.cambridge.org/core. Stanford Graduate School of Business, on 22 May 2018 at 22:31:47, subject to the
There are two potential reasons for the differences in rural–urban access gapsby region. On one hand, urban youth in western China may be just as likely toattend college or elite college as those in eastern China, but rural youth in westernChina may be far less likely to attend college or elite college. Or, on the otherhand, it could be that rural youth are equally likely to attend college or elite col-lege across the region, but urban students in western China are far more likely toattend college or elite college.To determine further if the rural–urban gap across regions was coming from
urban differences across regions or rural differences across regions, we examinethe rate of college access for urban and rural youth separately in each region.Table 2 shows that in eastern, central, and western China, urban youth hadalmost the same chances to access any college, four-year colleges, elite Project211 colleges and Project 985 colleges (columns 3, 5 and 7, rows 1 to 4).However, college access for rural youth varied across regions. For example, 14per cent of rural youth in eastern China accessed any college compared to 9per cent of rural youth in central China. At the same time, only 7 per cent ofrural youth in western China accessed any college. The rural youth in easternChina were between 1.5 times and two times more likely to access four-yearand elite colleges than rural youth in central and western China (columns 4, 6and 8, rows 2 to 4). In summary, college access for all urban youth in each regionwas almost the same, while college access for rural youth in central and westernChina was lower than that for rural youth in eastern China. Differences in therate of college access for rural youth across regions were thus a major driver ofdifferences in the rural–urban gap across regions.We conduct a similar analysis across provinces. Table 3 shows that (with the
exception of Shanghai, where the extremely low percentage of rural studentsaccessing college may be a statistical anomaly) urban students are 1.7 (InnerMongolia) to 11.5 (Anhui) times more likely than rural students to access any col-lege. Urban students are also 2.7 (Inner Mongolia) to 18.6 (Hainan) times morelikely than rural students to access elite Project 211 colleges. Similar to the across-region comparison, differences in the rate of college access for rural youth acrossprovinces were a major driver of the rural–urban gap across provinces. Forexample, while the urban youth in Beijing were approximately four times morelikely to access elite Project 211 colleges than urban youth in Yunnan province,the rural youth in Beijing were approximately nine times more likely to accesselite colleges than rural youth in Yunnan province. In other words, althoughthe rate of college access differs for both urban youth and rural youth across pro-vinces, the across-province differences are even greater for rural youth.Sources of the gap between rural youth from poor counties and rural youth from
non-poor counties. Again, to determine the source of the college and elite collegeaccess gap between rural youth from poor counties and rural youth from non-poor counties, we examine the access gaps separately for central and westernChina. We do not do the same exercise for eastern China since there is only
Unequal Access to College in China 197
Cambridge Core terms of use, available at https://www.cambridge.org/core/terms. https://doi.org/10.1017/S0305741015000314Downloaded from https://www.cambridge.org/core. Stanford Graduate School of Business, on 22 May 2018 at 22:31:47, subject to the
one poor county in eastern China (while there are over 500 in central and westernChina).According to our data, the gap between rural youth from poor counties and
rural youth from non-poor counties could not be attributed to regional differ-ences in either central or western China. From Table 2 we can see that the gapbetween rural youth from poor counties and rural youth from non-poor countiesin central China was narrow for the three largest categories of college – any col-lege, four-year colleges and elite 211 colleges (columns 9 and 10, rows 1 to 3). Thegap ranged from 1.1 to 1.4 times. Similarly, the gaps between rural youth frompoor counties and rural youth from non-poor counties in western China forthese same three categories of colleges also were narrow (columns 11 and 12,rows 1 to 3). In western China, the access gap ranged from 1.3 to 1.5 times.The lesson from this table and the analysis above is that the majority of ruralyouth – those in central and western China and those in both poor and non-poorareas – were driving the rural–urban access gap in China (which in turn was thelargest segment of the gap in access between rural youth from poor counties andurban youth).Why was there no gap between urban youth from poor counties versus non-poor
counties?We now seek to understand why it is that the college access gap betweenurban youth from poor counties and urban youth from non-poor counties was sonarrow (as discussed above). The absence of a larger gap in college accessbetween urban youth from poor counties and urban youth from non-poor coun-ties may be surprising since, in the aggregate, there are large discrepancies inhousehold earnings between poor and non-poor areas; educational investmentsbetween poor and non-poor areas also differ sharply.26
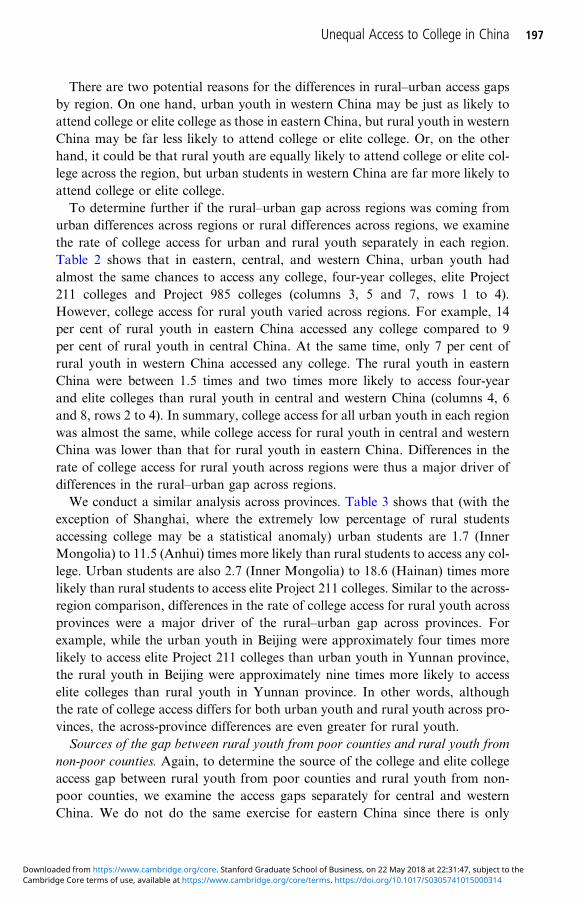
One reason for the narrow gap between urban youth from poor counties andurban youth from non-poor counties could have been the occupational structurein the urban areas of poor and non-poor regions. According to the 2000 Censusdata, a relatively large share of the parents of urban youth from poor counties (31per cent) were government officials, bureaucrats or state-owned enterprise cadresor professionals (ganbu干部). At the same time, only 28 per cent of the parents ofurban youth from non-poor counties were ganbu. The opposite is true for the caseof workers in both the manufacturing and service sectors (gongren 工人). Whileonly 50 per cent of the parents of urban youth from poor counties were workers,64 per cent of the parents of urban youth from non-poor counties were workers(see Figure 4). Since it is well documented in the international literature that theprofession of a parent (and their education) is a strong predictor of the education-al attainment of children,27 and since in China the average level of education ofganbu (13 years) is higher than the average level of education of workers (9 years),
26 Heckman 2005.27 Hanushek and Woessmann 2011.
200 The China Quarterly, 221, March, 2015, pp. 185–207
Cambridge Core terms of use, available at https://www.cambridge.org/core/terms. https://doi.org/10.1017/S0305741015000314Downloaded from https://www.cambridge.org/core. Stanford Graduate School of Business, on 22 May 2018 at 22:31:47, subject to the
the occupational structure in poor, urban areas and non-poor, urban areas seemsto be at least one reason why the access gap is narrow.28
Other gaps
When we extend the concept of disadvantaged to also include females and minor-ities, we find that disadvantaged subgroups of rural youth from poor countieswere severely limited in access to college and elite college. For example, 66 percent of urban, male, Han youth from non-poor counties took the CEE. TheCEE participation rate of urban, male, Han youth from poor counties waseven higher (85 per cent). This is consistent with our above findings that urbanyouth from poor counties were more active in taking the CEE than urbanyouth from non-poor counties, since urban youth from poor counties had a betterfamily background.However, as the most vulnerable subgroup of rural youth from poor counties,
only 7 per cent of rural, female, minority youth from poor counties took the CEE(see Table 4). In other words, urban, male, Han youth from poor counties were12 times more likely to take the CEE than rural, female, minority youth frompoor counties (85/7). Urban, male, Han youth from non-poor counties wereten times more likely to take the CEE than rural, female, minority youth frompoor counties (66/7). The subgroups of rural youth from poor counties weremore disadvantaged in access to any college. Only 5 per cent of rural, female,minority youth from poor counties accessed any college compared to 46 per
Figure 4: Occupational Structure in Poor, Urban Areas and Non-poor, Urban Areas
Sources:1% 2000 Census.
28 The average years of education is taken from the 2000 Census.
Unequal Access to College in China 201
Cambridge Core terms of use, available at https://www.cambridge.org/core/terms. https://doi.org/10.1017/S0305741015000314Downloaded from https://www.cambridge.org/core. Stanford Graduate School of Business, on 22 May 2018 at 22:31:47, subject to the
cent of urban, male, Han youth from non-poor counties (or an access gap of ninetimes).The subgroups of rural youth from poor counties had even less access to four-
year and elite colleges than their advantaged counterparts. For both urban, male,Han youth from non-poor counties and urban, male, Han youth from poor coun-ties, 16 per cent accessed four-year colleges in 2003. However, only 1 per cent ofrural, female, minority youth from poor counties gained access to four-year col-leges. At the same time, only 2 per cent of rural, male, minority youth from poorcounties accessed four-year colleges. This means that urban, male, Han youth,either from non-poor or poor counties, were 16 times more likely to access four-year colleges than rural, female, minority youth from poor counties (16/1). Thegap in elite college access was even larger. For example, 7.5 per cent of urban,male, Han youth from non-poor counties gained access to Project 211 collegescompared to 0.4 per cent of rural, female, minority youth from poor counties(or an access gap of 19 times). The gap in access to elite Project 211 collegeswas also nearly ten times between urban, male, Han youth from non-poor coun-ties and rural, male, minority youth from poor counties (7.5/0.8).Finally, the gap in access to the top two colleges in China was the widest.
Whereas 0.14 per cent of urban, male, Han youth from non-poor countiescould access China’s top two colleges, only 0.002 per cent of rural, female, minor-ity youth from poor counties and 0.003 per cent of rural, male, minority youthfrom poor counties could access the top two colleges (Table 4, column 6).Hence, urban, male, Han youth from non-poor counties were 70 and 45 timesmore likely to access China’s top two colleges than rural, female, minorityyouth from poor counties and rural, male, minority youth from poor counties(0.14/0.02; 0.14/0.03).When we examine the absolute numbers (instead of the proportions) of rural,
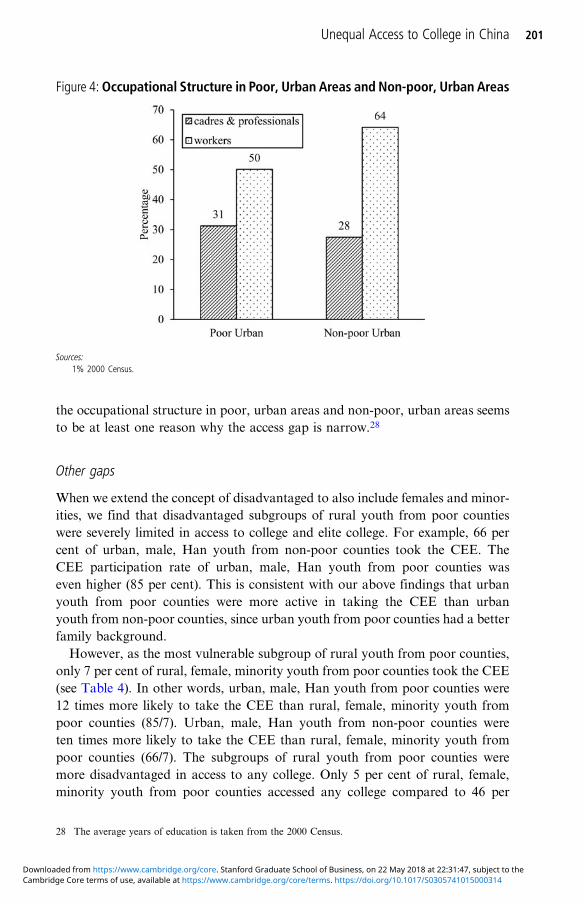
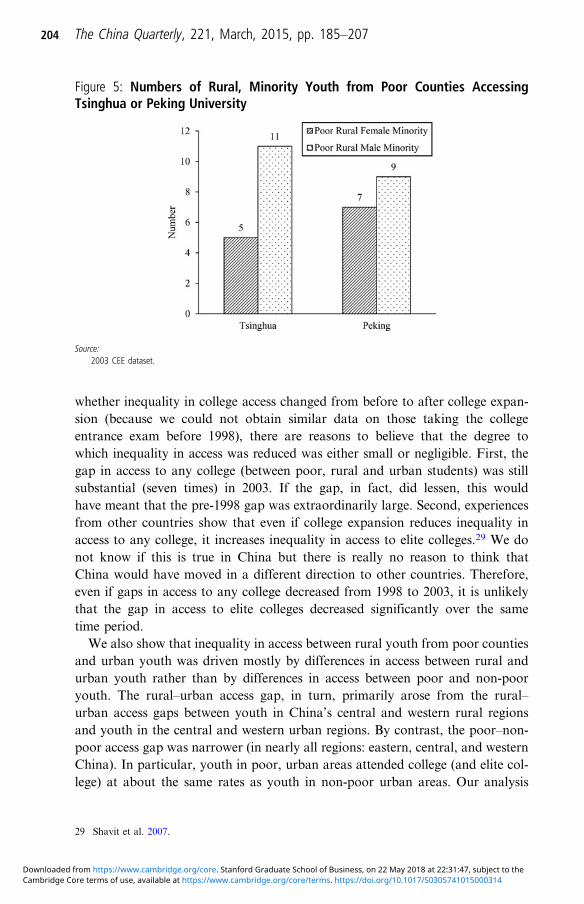
minority youth from poor counties who could access China’s top two colleges,the barriers to access appear even more formidable. In 2003, Peking Universityand Tsinghua University admitted around 6,600 students. However, in thatyear, only 12 rural, female, minority students from poor counties were admittedto these colleges. Of these 12, five gained access to Tsinghua University and sevenwere admitted to Peking University (see Figure 5). Only three of them came frompoor, western provinces. At the same time, only 20 rural, male, minority youthfrom poor counties gained access to the top two colleges: 11 to TsinghuaUniversity and nine to Peking University. Clearly, subgroups of rural youthfrom poor counties were left behind in the chance to access China’s top twocolleges.
ConclusionOur study shows that even after the mass expansion of college enrolments inChina, rural students from poor counties were still much less likely to go to col-lege and elite colleges than more advantaged students. Although we cannot show
Unequal Access to College in China 203
Cambridge Core terms of use, available at https://www.cambridge.org/core/terms. https://doi.org/10.1017/S0305741015000314Downloaded from https://www.cambridge.org/core. Stanford Graduate School of Business, on 22 May 2018 at 22:31:47, subject to the
whether inequality in college access changed from before to after college expan-sion (because we could not obtain similar data on those taking the collegeentrance exam before 1998), there are reasons to believe that the degree towhich inequality in access was reduced was either small or negligible. First, thegap in access to any college (between poor, rural and urban students) was stillsubstantial (seven times) in 2003. If the gap, in fact, did lessen, this wouldhave meant that the pre-1998 gap was extraordinarily large. Second, experiencesfrom other countries show that even if college expansion reduces inequality inaccess to any college, it increases inequality in access to elite colleges.29 We donot know if this is true in China but there is really no reason to think thatChina would have moved in a different direction to other countries. Therefore,even if gaps in access to any college decreased from 1998 to 2003, it is unlikelythat the gap in access to elite colleges decreased significantly over the sametime period.We also show that inequality in access between rural youth from poor counties
and urban youth was driven mostly by differences in access between rural andurban youth rather than by differences in access between poor and non-pooryouth. The rural–urban access gap, in turn, primarily arose from the rural–urban access gaps between youth in China’s central and western rural regionsand youth in the central and western urban regions. By contrast, the poor–non-poor access gap was narrower (in nearly all regions: eastern, central, and westernChina). In particular, youth in poor, urban areas attended college (and elite col-lege) at about the same rates as youth in non-poor urban areas. Our analysis
Figure 5: Numbers of Rural, Minority Youth from Poor Counties AccessingTsinghua or Peking University
Source:2003 CEE dataset.
29 Shavit et al. 2007.
204 The China Quarterly, 221, March, 2015, pp. 185–207
Cambridge Core terms of use, available at https://www.cambridge.org/core/terms. https://doi.org/10.1017/S0305741015000314Downloaded from https://www.cambridge.org/core. Stanford Graduate School of Business, on 22 May 2018 at 22:31:47, subject to the
suggests that, at least in part, the narrow poor and non-poor urban gap existsbecause a larger share of the parents of youth from poor, urban areas were pro-fessionals (and a smaller share were workers) than the parents of the youth innon-poor urban areas.What are the policy implications? Prior to the expansion of the university sys-
tem, policymakers in China hoped that expanding college enrolments would sub-stantially reduce inequalities in access.30 This paper, however, indicates that evenone of the most rapid expansions of college enrolments in history was not, in andof itself, able to reduce inequality in access substantially. If such inequalities inaccess have persisted over the last decade since 2003, policymakers may wishto take a more active role in helping poor, rural students from China’s centraland western regions in particular to gain access to college and elite college.Unfortunately, there are strong reasons to believe that the gaps in college
access have persisted over the last decade. The financial burden of attending aca-demic high school and college remained high for poor, rural students.31 Theopportunity costs of going to high school and college also grew substantially.32
Many youth from poor, rural areas dropped out of junior high school.33 Inmost general terms, China’s education system remained extremely competitiveand largely kept students in poor, rural areas from continuing on to higher levelsof schooling.34 Owing to the persistence of all of these factors, we suggest thatfuture studies continue to examine more recent trends in gaps in access to collegeand elite college and the sources of those gaps.Indeed, the inability of youth from poor, rural areas to gain more equal access
to college has implications for China’s future social and economic development.China has continued to shift from lower value-added to higher value-addedindustries, and its need for skilled labour has correspondingly increased.35
China is, in fact, already faced with a shortage of skilled technical labour.36
Moreover, approximately 78 per cent of children under the age of 14 in Chinaare from rural areas.37 These children constitute the majority of China’s futureworkforce. If those of relatively high ability are later unable to access collegeand elite colleges, it will hamper the efficiency of China’s human capital accumu-lation and economic growth. Ultimately, without a labour force with sufficientskills, China’s economy (like that of other developing countries, for example,Argentina after the Second World War) could stagnate.38
If the youth from poor, rural areas are unable to gain fair access to college,there will be implications for social inequality and ultimately social cohesion.
30 MOE 2010.31 Liu et al. 2009.32 Cai 2010.33 Yi et al. 2012.34 Loyalka et al. 201435 Heckman 2005.36 Simon and Cao 2009.37 NBS 2010.38 Hanushek and Woessman 2011; Hanushek and Woessman 2008; Mincer 1984.
Unequal Access to College in China 205
Cambridge Core terms of use, available at https://www.cambridge.org/core/terms. https://doi.org/10.1017/S0305741015000314Downloaded from https://www.cambridge.org/core. Stanford Graduate School of Business, on 22 May 2018 at 22:31:47, subject to the
The returns to attending college are high and have been increasing over the lasttwo decades in China.39 If poor, rural youth are unable to access college, they willbe unable to achieve the higher levels of social and economic status of theiradvantaged peers. Gaps in access to college will therefore continue to be animportant source of social inequality and intergenerational immobility.Furthermore, as poor, rural youth increasingly perceive that they are not ableto access college at the same rate as their more advantaged counterparts, theymay feel excluded from society.40 Thus, gaps in access to college could ultimatelybecome a source of social instability and a barrier to social cohesion.
摘摘要要: 在 20世纪 90年代, 中国贫困地区的农村青年上大学的机会非常有
限。即便 1998年大学扩招后, 贫困地区农村青年是否享有更多机会也不甚
明朗。本文目的在于检验大学扩招后, 贫困地区农村学生与其他学生在考
取大学乃至名牌大学上的差距。为此我们使用了 2003年全国参加高考学
生的数据。结论显示: 即便在扩招之后, 这种差距依然很大。具体地, 贫困
地区农村学生考取大学的机会比城市学生小 7倍; 考取 211名牌大学的机
会比城市学生小 11倍。这一差距在贫困地区农村学生的子群体中 (贫困
地区农村、女性、少数民族学生) 更大。我们也发现这些差距主要由城乡
差别, 而不是由贫困与非贫困地区差别所致。
关关键键词词: 不平等; 大学入学; 农村; 贫困; 中国; 大学扩招
ReferencesAyalon, Hanna, and Yossi Shavit. 2004. “Educational reforms and inequalities in Israel: the MMI
hypothesis revisited.” Sociology of Education 77(2), 103–120.Cai, Fang. 2010. “Wage gap between Chinese college grads, migrants dropping,” People’s Daily
Online, 22 November, http://english.peopledaily.com.cn/90001/90776/90882/7207145.html.Carnoy, Martin, Prashant Loyalka and Isak Froumin. 2013. “University expansion in the BRIC
countries and the global information economy.” Change: The Magazine of Higher Learning 45(4), 36–43.
Freeman, Richard B. 2009. “What does global expansion of higher education mean for the UnitedStates?” NBER Working Paper No. 14962.
Green, Andy, John Preston and Ricardo Sabates. 2003. “Education, equality and social cohesion: adistributional approach.” Compare 33(4), 453–470.
Hannum, Emily, and Claudia Buchmann. 2003. The Consequences of Global Educational Expansion.Cambridge, MA: American Academy of Art and Sciences.
Hannum, Emily, and Meiyan Wang. 2006. “Geography and educational inequality in China.” ChinaEconomic Review 17(3), 253–265.
Hanushek, Eric A., and Ludger Woessmann. 2008. “The role of cognitive skills in economic develop-ment.” Journal of Economic Literature 46(3), 607–668.
Hanushek, Eric A., and Ludger Woessmann. 2011. “The economics of international differences ineducational achievement.” Handbook of the Economics of Education 3, 89–200.
39 Carnoy, Loyalka and Froumin 2013.40 Green, Preston and Sabates 2003.
206 The China Quarterly, 221, March, 2015, pp. 185–207
Cambridge Core terms of use, available at https://www.cambridge.org/core/terms. https://doi.org/10.1017/S0305741015000314Downloaded from https://www.cambridge.org/core. Stanford Graduate School of Business, on 22 May 2018 at 22:31:47, subject to the
Heckman, James. 2005. “China’s human capital investment.” China Economic Review 16(1), 50–70.Li, Hongbin, and Binzhen Wu. 2012. “China’s educational inequality: evidence from college entrance
exams and admissions.” China Data Center at Tsinghua University Working Paper.Liu, Chengfang, Linxiu Zhang, Renfu Luo, Scott Rozelle, Brian Sharbono and Yaojiang Shi. 2009.
“Development challenges, tuition barriers and high school education in China.” Asia PacificJournal of Education 29(4), 503–520.
Loyalka, Prashant, James Chu, Jianguo Wei, Natalie Johnson, Joel Reniker and Scott Rozelle. 2014.“Inequalities in the pathway to college in China: when do students from poor areas fall behind?”REAP Working Paper No. 277, Stanford University.
Mincer, Jacob. 1984. “Human capital and economic growth.” Economics of Education Review 3(3),195–205.
MOE. 2010. “Education as a long-term priority,” 12 July, http://www.moe.gov.cn/publicfiles/business/htmlfiles/moe/moe_2862/201010/109030.html. Accessed 10 January 2015.
NBS (National Bureau of Statistics). 1990. Tabulation on the 1990 Population Census of the People’sRepublic of China. Beijing: China Statistics Press.
NBS. 2010. Tabulation on the 2010 Population Census of the People’s Republic of China, http://www.stats.gov.cn/tjsj/pcsj/rkpc/6rp/indexch.htm.
NBS. various years. China Statistical Yearbook (various years), http://www.stats.gov.cn/tjsj/ndsj/.Reimer, David, and Reinhard Pollak. 2010. “Educational expansion and its consequences for vertical
and horizontal inequalities in access to higher education in West Germany.” European SociologicalReview 26(4), 415–430.
Rong, Xue Lan, and Tianjian Shi. 2001. “Inequality in Chinese education.” Journal of ContemporaryChina 10(26), 107–124.
Schofer, Evan, and John Meyer. 2005. “The world-wide expansion of higher education in the twen-tieth century.” Center on Democracy, Development and the Rule of Law Working Paper No.32, Stanford University.
Shavit, Yossi, Hanna Ayalon, Svetlana Chachashvili-Bolotin and Gila Menahem. 2007. “Israel: diver-sification, expansion, and inequality in higher education.” In Yossi Shavit, Richard Arum andAdam Gamoran (eds.), Stratification in Higher Education: A Comparative Study. Stanford:Stanford University Press, 39–62.
Simon, Denis Fred, and Cong Cao. 2009. China’s Emerging Technological Edge: Assessing the Role ofHigh-end Talent. New York: Cambridge University Press.
Sirin, Selcuk R. 2005. “Socioeconomic status and academic achievement: a meta-analytic review ofresearch.” Review of Educational Research 75(3), 417–453.
Wang, Xiaojun, Belton M. Fleisher, Haizheng Li and Shi Li. 2007. “Access to higher education andinequality: the Chinese experiment.” Institute for the Study of Labor (IZA) Working Paper No.2823, University of Bonn.
World Bank. 1990. “World development indicators: school enrollment, tertiary (% gross),” http://data.worldbank.org/indicator/SE.TER.ENRR/countries?page=4.
Wu, Xiaogang. 2010. “Economic transition, school expansion and educational inequality in China,1990–2000.” Research in Social Stratification and Mobility 28(1), 91–108.
Wu, Xiaogang, and Zhuoni Zhang. 2010. “Changes in educational inequality in China, 1990–2005:evidence from the population census data.” In Emily Hannum, Hyunjoon Park and YokoGoto Butler (eds.), Research in the Sociology of Education (Vol. 17). Emerald Group Publishing.
Yi, Hongmei, Linxiu Zhang, Renfu Luo, Yaojiang Shi, Di Mo, Xinxin Chen, Carl Brinton andScott Rozelle. 2012. “Dropping out: why are students leaving junior high in China’s poor ruralareas?” International Journal of Educational Development 32(4), 555–563.
Unequal Access to College in China 207
Cambridge Core terms of use, available at https://www.cambridge.org/core/terms. https://doi.org/10.1017/S0305741015000314Downloaded from https://www.cambridge.org/core. Stanford Graduate School of Business, on 22 May 2018 at 22:31:47, subject to the