23
UNIFORM MOTION, SLOPE AND SPEED POSITION-TIME GRAPHS
| Date post: | 31-Dec-2015 |
| Category: |
Documents |
| Upload: | allyson-hudson |
| View: | 233 times |
| Download: | 4 times |

U N I F O R M M O T I O N , S LO P E A N D S P E E D
POSITION-TIME GRAPHS
REVIEW
1. What is distance? What is it measured in?2. What is displacement?3. What must you include when giving the
measurement of displacement? 4. What is the formula for displacement?5. What is time?6. What is time measured in?7. What is time interval?8. What is the formula for time interval?9. What directions are positive?10.What directions are negative?

UNIFORM MOTION
• Q: What do you think uniform motion is?
• A: Objects moving in uniform motion travel equal displacements in equal time intervals
• Basically, if a ball was rolling in uniform motion, it would not speed up, slow down or change directions – it would just keep on going

MOTION DIAGRAMS
MOTION DIAGRAMS
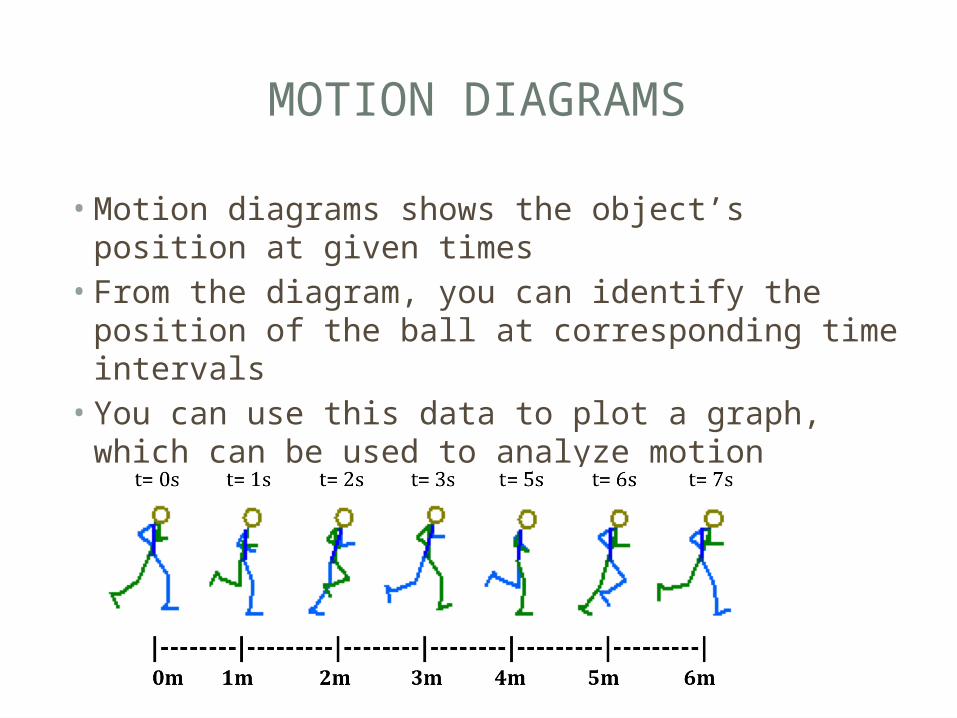
• Motion diagrams shows the object’s position at given times• From the diagram, you can identify the position of
the ball at corresponding time intervals• You can use this data to plot a graph, which can
be used to analyze motion

POSITION-TIME GRAPHS
• When you plot the TIME data on the x-axis and the POSITION data on the y-axis, you create a position-time graph
Time (s)
Position (m)
0 0
1 15
2 30
3 45
4 60
5 75
6 90
7 105
8 120
GRAPH REMINDERS
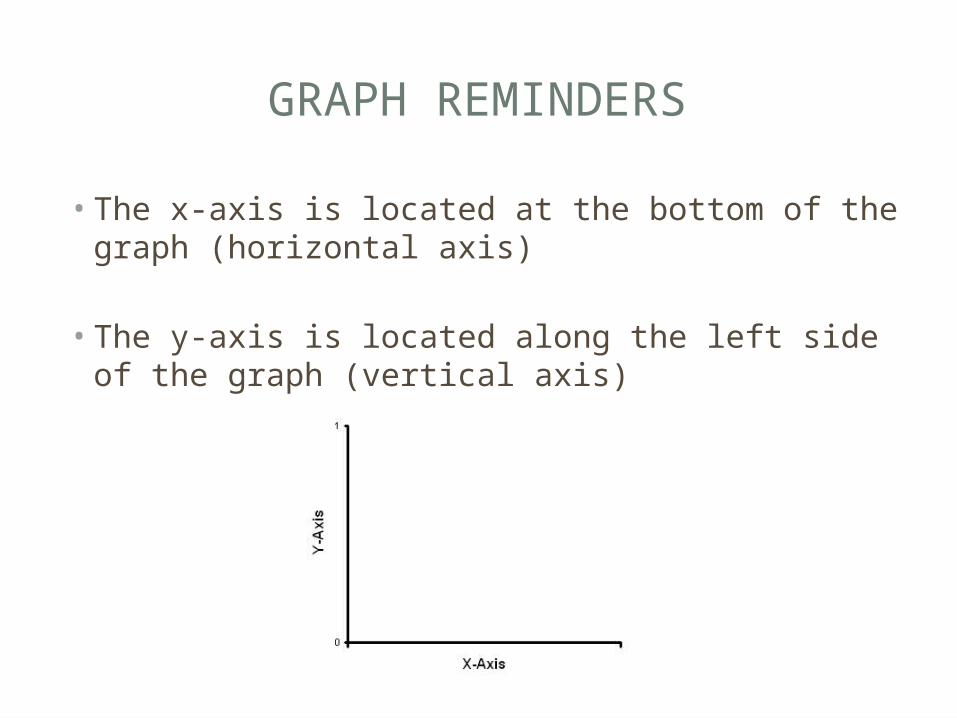
• The x-axis is located at the bottom of the graph (horizontal axis)
• The y-axis is located along the left side of the graph (vertical axis)
BEST-FIT LINE
• In uniform motion, the plots on a graph will line up in a straight line. In the real world, however, we rarely see uniform motion, so the plots on a graph may not line up
• It is useful to use a best-fit line that passes through as many of the points as possible
• A best-fit line is a smooth curve or straight line that most closely fits the general shape outlined by the points

BEST-FIT LINE
SLOPE
• The slope of a graph refers to the direction of a line on a graph
• The slope of a line can be either• Horizontal (zero)• Slanting up (positive)• Slanting down (negative)

POSITIVE SLOPE
• A positive slope on a position-time graph slants up to the right• This means that the object’s position from the
origin is increasing with respect to time
Example: flying in a plane
Each second you move further away from the origin (where you started)
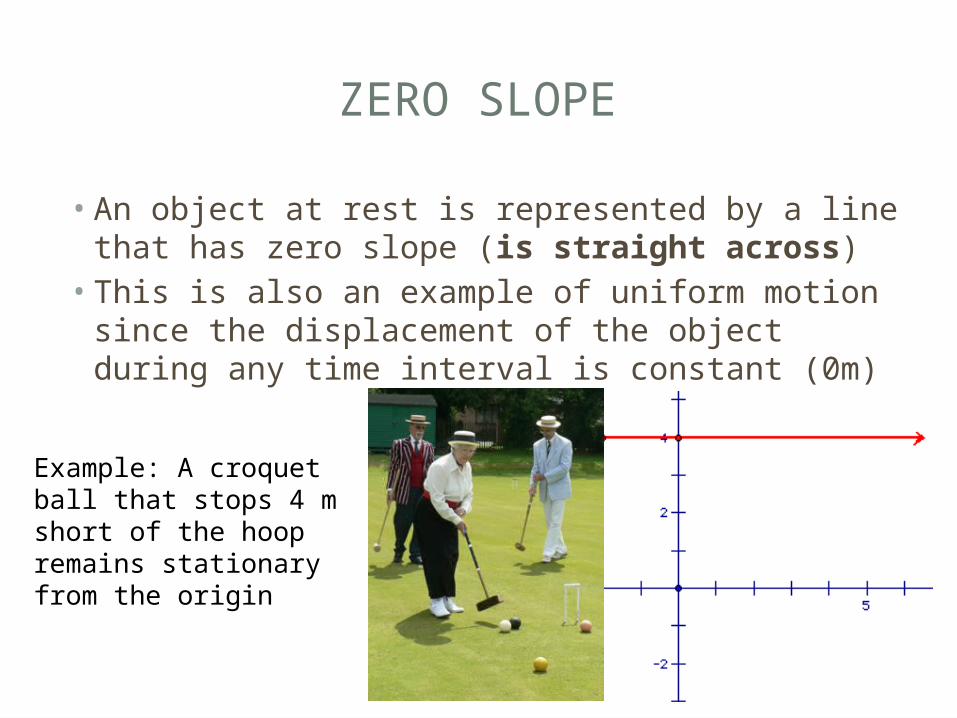
ZERO SLOPE
• An object at rest is represented by a line that has zero slope (is straight across)• This is also an example of uniform motion since
the displacement of the object during any time interval is constant (0m)
Example: A croquet ball that stops 4 m short of the hoop remains stationary from the origin

NEGATIVE SLOPE
• A negative slops on a position-time graph slants down to the right• This means that the object’s position moves
towards the origin (and past it in some cases)
• Example: Putting a golf ball towards the hole (if you make the hole the origin)

POSITION-TIME GRAPHS
Graph Movement
Positive Away from origin
Negative Towards origin
Zero Not moving
SPEED
• Speed describes how fast an object moves
• Speed is the distance an object travels during a given time interval divided by the time interval
• Speed is represented as: (v)
• Speed is measured in: metres per second (m/s)
• Speed is a scalar quantity (it does not indicate direction)
VELOCITY
• Velocity is the displacement of an object during a time interval divided by the time interval
• Velocity describes both the speed and the direction of motion
• Velocity is represented as: v
• Velocity is measured in: metres per second (m/s) and includes the direction of travel

VELOCITY
• Speed = how fast• Example: the speed limit is 100 km/h
• Velocity = how fast in what direction• Example: the escalator moves you upwards at 1m/s
• You can find velocity with this formula:
• Basically, velocity is the change in displacement divided by the change in time
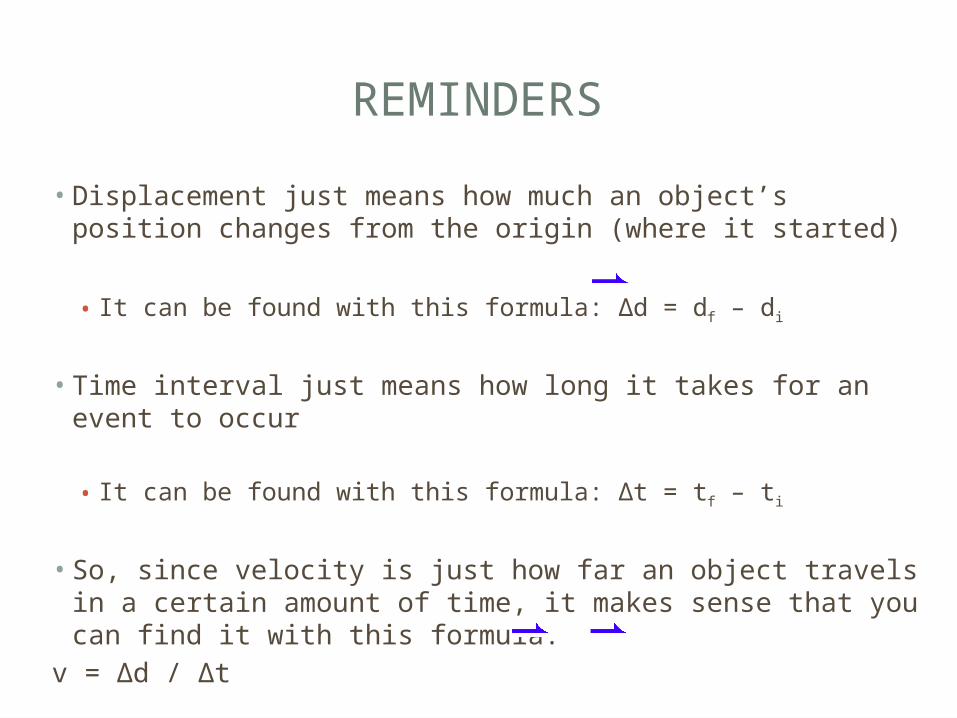
REMINDERS
• Displacement just means how much an object’s position changes from the origin (where it started)
• It can be found with this formula: Δd = df – di
• Time interval just means how long it takes for an event to occur
• It can be found with this formula: Δt = tf – ti
• So, since velocity is just how far an object travels in a certain amount of time, it makes sense that you can find it with this formula:
v = Δd / Δt
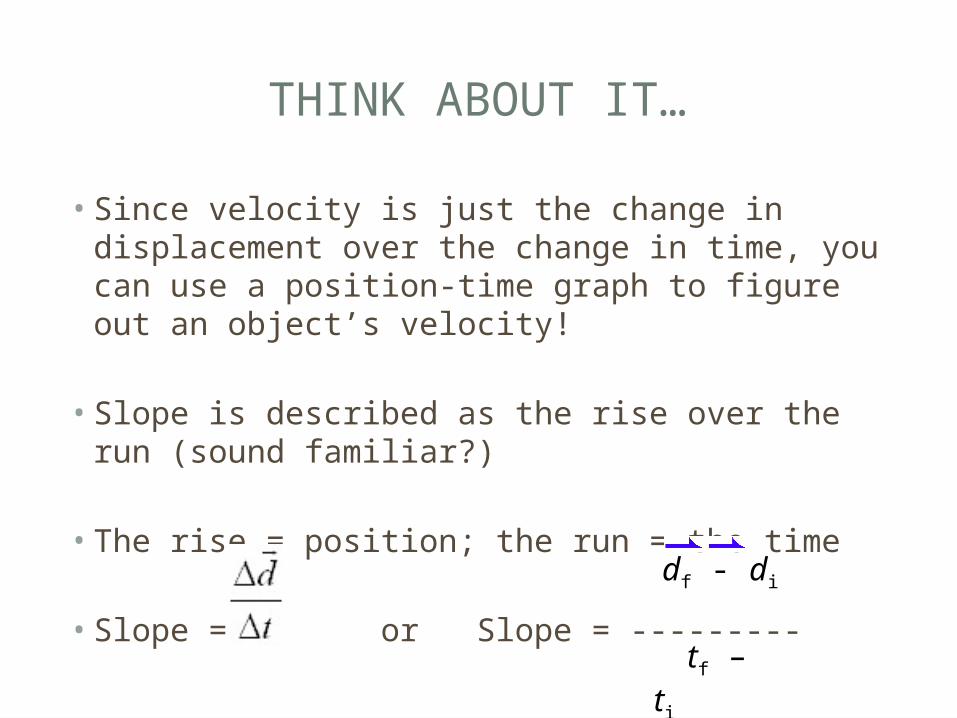
THINK ABOUT IT…
• Since velocity is just the change in displacement over the change in time, you can use a position-time graph to figure out an object’s velocity!
• Slope is described as the rise over the run (sound familiar?)
• The rise = position; the run = the time
• Slope = or Slope = --------- df - di
tf – ti
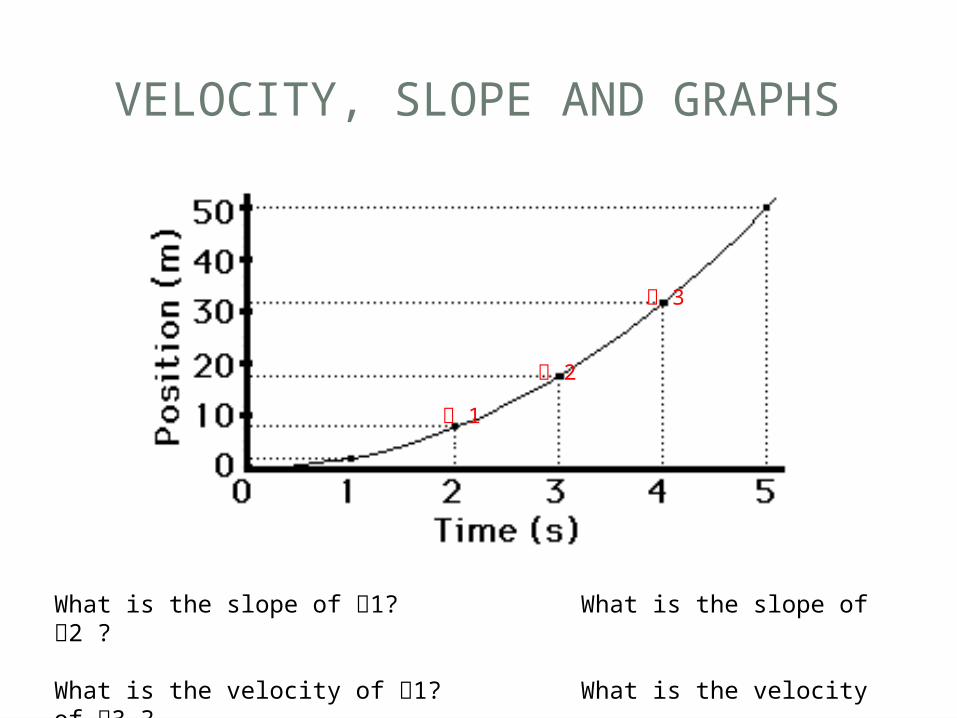
VELOCITY, SLOPE AND GRAPHS
1
2
3
What is the slope of 1? What is the slope of 2 ?
What is the velocity of 1? What is the velocity of 3 ?

Slope of 1
• Slope = = --------- = ------------ = ---- = 4m/s
1
df - di
tf – ti
8m – 0m
2s – 0s
8m
2s

Slope of 2
• Slope = = ---------- = ?
2
df - di
tf – ti
A: 6m/s

Velocity of 3
• Velocity = = ----------- = ?
3
df - di
tf – ti
A: 8m/s


