Introduction and DescriptionThis lesson uses the concept of opportunity cost todevelop a production possibilities curve. The pro-duction possibilities curve represents the choicesthat society faces. Opportunity cost is a fundamen-tal concept in economics and includes not onlyout-of-pocket costs but also the cost to society ofnot using the resources to produce an alternativeproduct or service. Alternative forms of theproduction possibilities curves illustrate differenttrade-offs. Activity 1 reinforces the concept ofopportunity cost and investigates the alternativeshapes of the production possibilities curve.
We use production possibilities curves to illus-trate the economic situation that nations face andthe advantages that exist if people or nations spe-cialize in the production of specific goods andservices and then trade for the goods and servicesthey want. The concept of comparative advantageunderlies trade and exchange within an economyand between different economies. Activity 2 pro-vides practice at determining absolute and compar-ative advantage.
Objectives1. Define scarcity and opportunity cost.2. Apply scarcity and opportunity cost to a num-
ber of everyday situations.3. Construct production possibilities curves using
hypothetical data.4. Apply the concept of opportunity cost to a pro-
duction possibilities curve.5. Analyze the different locations of points on,
outside and inside a production possibilitiescurve.
6. Demonstrate and explain different shaped pro-duction possibilities curves.
7. Define absolute advantage and comparativeadvantage.
8. Determine comparative advantage when givendata.
9. Explain how both parties gain from specializa-tion and exchange.
Time RequiredTwo class periods or 90 minutes
Materials1. Activities 1 and 22. Visuals 1.1, 1.2, 1.3 and 1.4
Procedure
1. Give a lecture on scarcity and opportunity cost.
(A) People have unlimited wants.
(B) Resources to fulfill these wants are limited.Resources are land, labor, capital and entre-preneurship.
(C) Here are some examples of scarcity youmight want to use:(i) A teenager wants to go to a soccer game
on Saturday night but also wants to catchup on late school assignments. Theteenager encounters the scarcity of time.
(ii) A family wants to take a vacation toMexico and build an addition on thehouse. They experience scarcity becausefamily income will not permit both tooccur.
2. Individuals and society must choose between thecompeting wants. They must make decisions.Opportunity cost emphasizes that people aremaking choices. People choose to do one activityand the cost is giving up another activity.
3. Use Visual 1.1 of a production possibilities curve(PPC) and emphasize the following points.
(A) The PPC is drawn assuming that
1 Macroeconomics LESSON 1 UNIT
Scarcity, Opportunity Cost, Production Possibilities andComparative Advantage
(i) all resources (land, labor, capital, entre-preneurship) are fully employed.
(ii) the technology is constant.
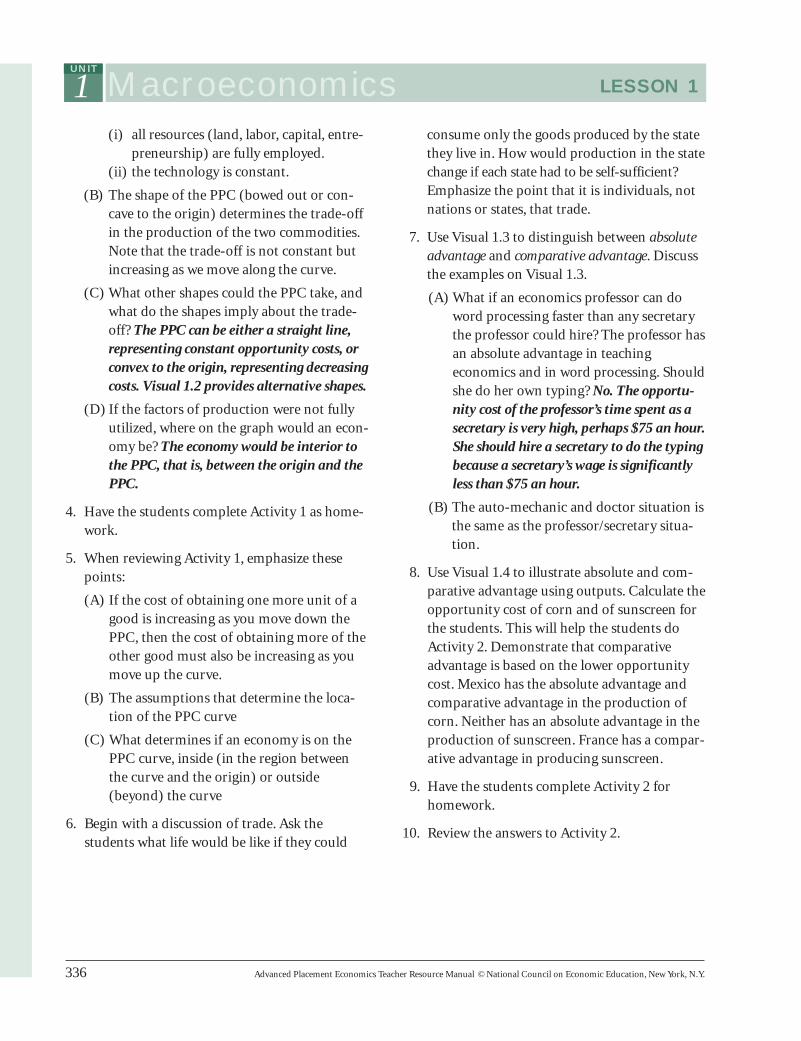
(B) The shape of the PPC (bowed out or con-cave to the origin) determines the trade-offin the production of the two commodities.Note that the trade-off is not constant butincreasing as we move along the curve.
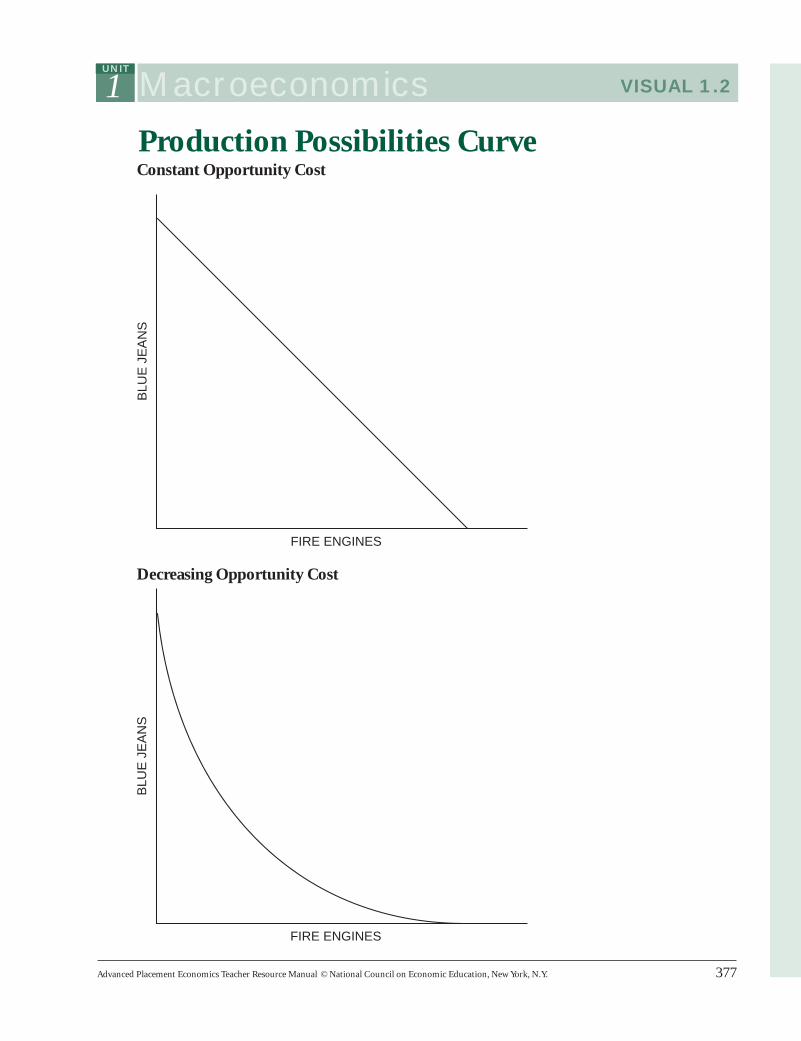
(C) What other shapes could the PPC take, andwhat do the shapes imply about the trade-off? The PPC can be either a straight line,representing constant opportunity costs, orconvex to the origin, representing decreasingcosts. Visual 1.2 provides alternative shapes.
(D) If the factors of production were not fullyutilized, where on the graph would an econ-omy be? The economy would be interior tothe PPC, that is, between the origin and thePPC.
4. Have the students complete Activity 1 as home-work.
5. When reviewing Activity 1, emphasize thesepoints:
(A) If the cost of obtaining one more unit of agood is increasing as you move down thePPC, then the cost of obtaining more of theother good must also be increasing as youmove up the curve.
(B) The assumptions that determine the loca-tion of the PPC curve
(C) What determines if an economy is on thePPC curve, inside (in the region betweenthe curve and the origin) or outside(beyond) the curve
6. Begin with a discussion of trade. Ask thestudents what life would be like if they could
consume only the goods produced by the statethey live in. How would production in the statechange if each state had to be self-sufficient?Emphasize the point that it is individuals, notnations or states, that trade.
7. Use Visual 1.3 to distinguish between absoluteadvantage and comparative advantage. Discussthe examples on Visual 1.3.
(A) What if an economics professor can doword processing faster than any secretarythe professor could hire? The professor hasan absolute advantage in teachingeconomics and in word processing. Shouldshe do her own typing? No. The opportu-nity cost of the professor’s time spent as asecretary is very high, perhaps $75 an hour.She should hire a secretary to do the typingbecause a secretary’s wage is significantlyless than $75 an hour.
(B) The auto-mechanic and doctor situation isthe same as the professor/secretary situa-tion.
8. Use Visual 1.4 to illustrate absolute and com-parative advantage using outputs. Calculate theopportunity cost of corn and of sunscreen forthe students. This will help the students doActivity 2. Demonstrate that comparativeadvantage is based on the lower opportunitycost. Mexico has the absolute advantage andcomparative advantage in the production ofcorn. Neither has an absolute advantage in theproduction of sunscreen. France has a compar-ative advantage in producing sunscreen.
9. Have the students complete Activity 2 forhomework.
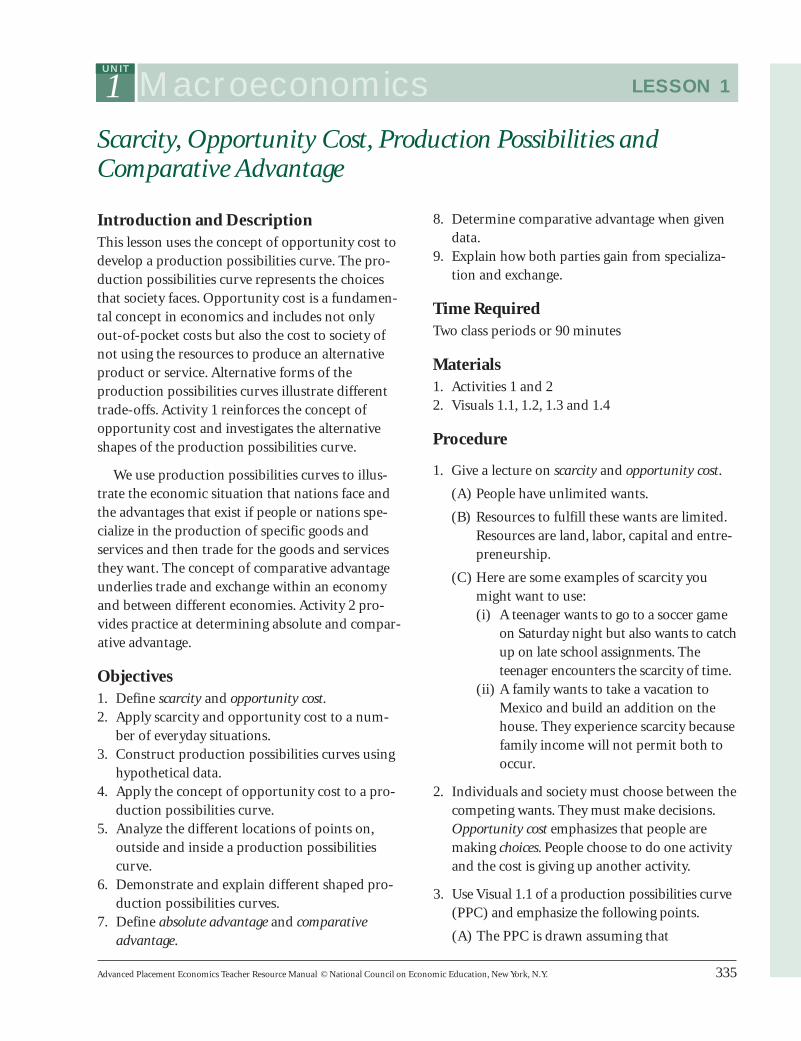
Scarcity, Opportunity Cost and Production Possibilities CurvesScarcity necessitates choice. Consuming or producing more of one commodity or service means con-suming or producing less of something else. The opportunity cost of using scarce resources for onecommodity or service instead of something else is often represented in graphical form as a productionpossibilities curve.
Part AUse Figures 1.1 and 1.2 to answer Questions 1 and 2. Fill in the answer blanks, or underline thecorrect answer in parentheses.
1. If the economy represented by Figure 1.1 is presently producing 12 units of Good B and zero unitsof Good A:
(A) The opportunity cost of increasing production of Good A from zero units to one unit is theloss of two unit(s) of Good B.
(B) The opportunity cost of increasing production of Good A from one unit to two units is theloss of two unit(s) of Good B.
(C) The opportunity cost of increasing production of Good A from two units to three units is theloss of two unit(s) of Good B.
(D) This is an example of (constant / increasing / decreasing / zero) opportunity cost per unit forGood A.
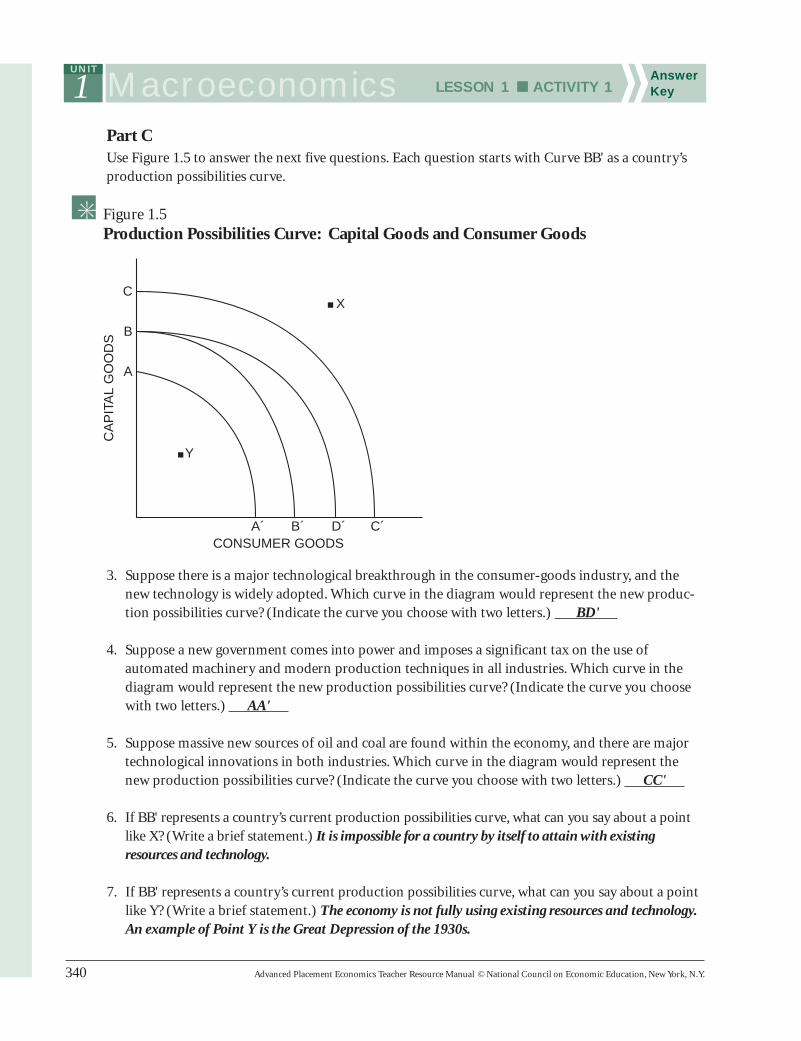
Part CUse Figure 1.5 to answer the next five questions. Each question starts with Curve BB' as a country’sproduction possibilities curve.
3. Suppose there is a major technological breakthrough in the consumer-goods industry, and thenew technology is widely adopted. Which curve in the diagram would represent the new produc-tion possibilities curve? (Indicate the curve you choose with two letters.) BD'
4. Suppose a new government comes into power and imposes a significant tax on the use ofautomated machinery and modern production techniques in all industries. Which curve in thediagram would represent the new production possibilities curve? (Indicate the curve you choosewith two letters.) AA'
5. Suppose massive new sources of oil and coal are found within the economy, and there are majortechnological innovations in both industries. Which curve in the diagram would represent thenew production possibilities curve? (Indicate the curve you choose with two letters.) CC'
6. If BB' represents a country’s current production possibilities curve, what can you say about a pointlike X? (Write a brief statement.) It is impossible for a country by itself to attain with existingresources and technology.
7. If BB' represents a country’s current production possibilities curve, what can you say about a pointlike Y? (Write a brief statement.) The economy is not fully using existing resources and technology.An example of Point Y is the Great Depression of the 1930s.
B
C
A´CONSUMER GOODS
CA
PIT
AL
GO
OD
S
B´ D´ C´
A
Y
X
Figure 1.5Production Possibilities Curve: Capital Goods and Consumer Goods
Opportunity Cost and Comparative AdvantagePart B: Questions
1. What is the difference between comparative advantage and absolute advantage? Absolute advantagestates that a particular individual or country can produce more of a specific commodity than an-other individual or country using the same amount of resources. Comparative advantage states thata particular country or individual can produce a specific commodity at a lower opportunity cost (interms of forgone production in an alternative commodity) than another country or individual.
2. You’re given the following information about a newlywed couple and the time it takes each ofthem to do two different chores: vacuuming a room or washing a load of dishes.
Mike Debbie
Vacuum a room 60 minutes 45 minutes
Wash a load of dishes 30 minutes 45 minutes
(A) What is Mike’s opportunity cost of vacuuming in terms of washing dishes? Washing two loads of dishes
(B) What is Mike’s opportunity cost of washing dishes in terms of vacuuming? Vacuuming 1/2 of a room
(C) What is Debbie’s opportunity cost of vacuuming in terms of washing dishes? Washing one load of dishes
(D) What is Debbie’s opportunity cost of washing dishes in terms of vacuuming? Vacuuming one room
(E) Who has the absolute advantage in vacuuming? Debbie
(F) Who has the absolute advantage in washing dishes? Mike
(G) Who has the comparative advantage in vacuuming? Debbie
(H) Who has the comparative advantage in washing dishes? Mike
(I) Who should do which chore and why? Base your answer only on the information above andon comparative advantage considerations. Mike should wash dishes and Debbie should vacu-um. They will finish their chores sooner by specializing according to their comparative advan-tage. The person with the lower opportunity cost should perform the chore.
3. Now, you’re given the following information about Andy and Hannah and the time it takes each ofthem to clean an office and clean a jail cell:
Andy Hannah
Cleaning offices 60 minutes 20 minutes
Cleaning jail cells 30 minutes 15 minutes
(A) What is Andy’s opportunity cost of cleaning offices in terms of cleaning jail cells? Cleaning two jail cells
(B) What is Hannah’s opportunity cost of cleaning offices in terms of cleaning jail cells? Cleaning 4/3 of a jail cell
(C) What is Andy’s opportunity cost of cleaning jail cells in terms of cleaning offices? Cleaning 1/2 of an office
(D) What is Hannah’s opportunity cost of cleaning jail cells in terms of cleaning offices? Cleaning 3/4 of an office
(E) Who has the absolute advantage in cleaning offices? Hannah
(F) Who has the absolute advantage in cleaning jail cells? Hannah
(G) Who has the comparative advantage in cleaning offices? Hannah
(H) Who has the comparative advantage in cleaning jail cells? Andy
(I) Who should do which chore and why? Base your answer only on the information above andon comparative advantage considerations. Hannah should clean offices and Andy should cleanjail cells, and they will finish sooner. The person with the lower opportunity cost shouldperform the chore.
4. Consider the following two countries. Assume they produce only these two goods. Note that pro-ductivity is now measured in how many goods can be produced per hour, the opposite of how wemeasured it in Questions 2 and 3.
United States Japan
Cars 12 10
Computers 4 6
(A) What is the United States’ opportunity cost of making cars? For every car, it must give up 1/3 of a computer.
(B) What is Japan’s opportunity cost of making cars? For every car, it must give up 3/5 of a computer.
(C) What is the United States’ opportunity cost of making computers? For every computer, it must give up three cars.
(D) What is Japan’s opportunity cost of making computers? For every computer, it must give up 5/3 of a car.
(E) Which country has the absolute advantage in cars? United States
(F) Which country has the absolute advantage in computers? Japan
(G) Which country has the comparative advantage in cars? United States
(H) Which country has the comparative advantage in computers? Japan
(I) Which country should produce which good and why? Base your answer only on the informa-tion above and on comparative advantage considerations. The United States should producecars, and Japan should produce computers because cars and computers would then beproduced by the lower-cost country. The total output of cars and computers will be higher.
5. Use the law of comparative advantage to explain why self-sufficiency leads to a lower standard ofliving. If people and nations do not trade on the basis of comparative advantage, there will be fewergoods and services for people to enjoy. People will be poorer. Less trade or self-sufficiency means alower standard of living.
Introduction and DescriptionThis lesson introduces the market system. Demandis half of a market and a demand schedule repre-sents the quantities that people are willing and ableto buy at alternative prices. The demand curve is agraphical representation of the demand schedule.Understanding a market is essential to success inAP Economics.
Activity 3 has the students graph a demandschedule and helps them understand the implica-tions of a shift in the demand curve. The activitythen focuses on the factors that shift the demandcurve. Activity 4 reinforces the factors that cause a demand curve to shift, the direction of the shiftand whether the shift represents an increase ordecrease in demand.
Objectives1. Define demand schedule and demand curve.2. Construct a demand curve using hypothetical
data.3. Explain why consumers buy more of a good or
service when the price decreases.4. Explain the difference between a shift in the
demand curve and a movement along thedemand curve.
5. Describe and analyze the forces that shift thedemand curve.
6. Explain why a demand curve would shift to theright or left given a scenario.
Time RequiredTwo class periods or 90 minutes
Materials1. Activities 3 and 42. Visual 1.5 and Visual 1.6
Procedure1. Begin with a discussion of demand. Have the
students tell you how much they are willing topay for various quantities of a commodity. Onepossibility is to use one student and tell this stu-dent that he or she has $10 to buy candy. Offerthis student a candy bar and ask how much heor she would be willing to pay for it; then askhow much he or she would be willing to pay fortwo, etc. Write the quantities and prices down;create a demand schedule and graph it. Note:The willingness to pay must be constrained by the$10 the student has as “income.”
2. Use Visual 1.5 and note that as the pricedecreases, the quantity demanded increases.
3. Use Visual 1.6. Show that an increase in demandis a shift to the right (and a decrease in demandis a shift to the left), and discuss the factors thatwill shift the demand curve. Changes in prefer-ences, incomes, expectations, population orprices of complementary or substitute goodswill shift the demand curve.
4. Have the students start Activity 3 in class andcomplete it for homework.
5. Review the answers to Activity 3.
6. Review the factors that shift the demand curve.
7. Have the students complete Activity 4 in class.
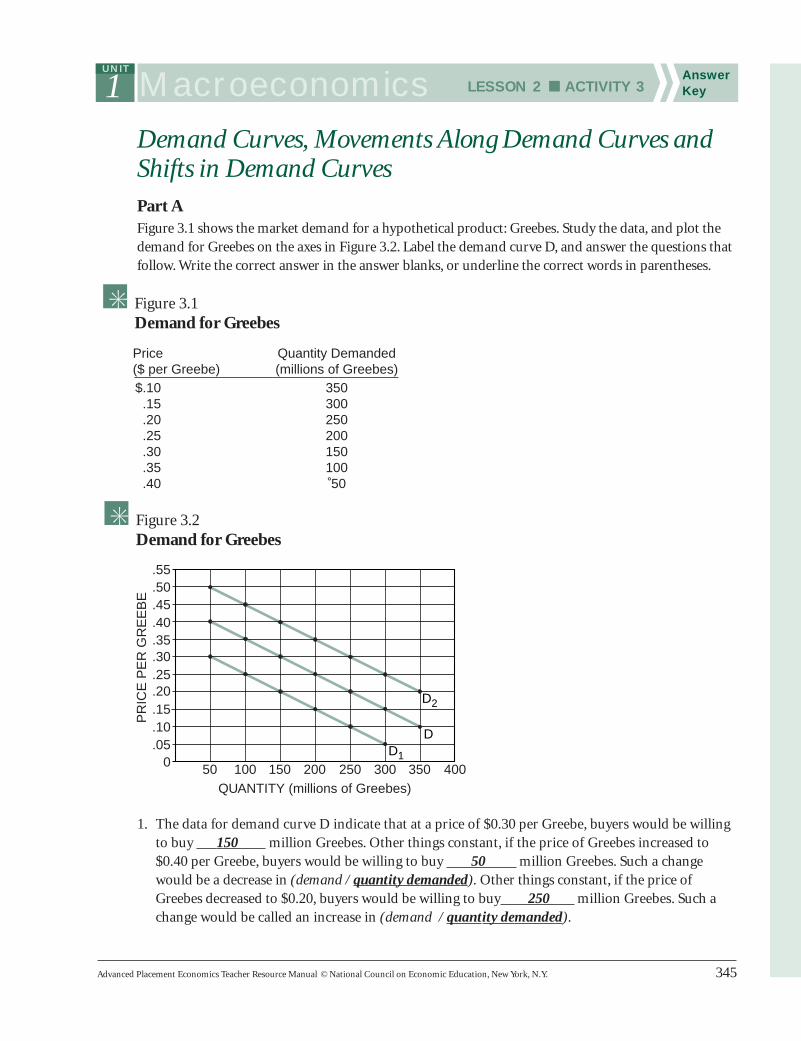
Demand Curves, Movements Along Demand Curves and Shifts in Demand CurvesPart AFigure 3.1 shows the market demand for a hypothetical product: Greebes. Study the data, and plot thedemand for Greebes on the axes in Figure 3.2. Label the demand curve D, and answer the questions thatfollow. Write the correct answer in the answer blanks, or underline the correct words in parentheses.
1. The data for demand curve D indicate that at a price of $0.30 per Greebe, buyers would be willingto buy 150 million Greebes. Other things constant, if the price of Greebes increased to$0.40 per Greebe, buyers would be willing to buy 50 million Greebes. Such a changewould be a decrease in (demand / quantity demanded). Other things constant, if the price ofGreebes decreased to $0.20, buyers would be willing to buy 250 million Greebes. Such achange would be called an increase in (demand / quantity demanded).
1 Macroeconomics LESSON 2 ■ ACTIVITY 3AnswerKey
UNIT
Figure 3.1Demand for Greebes
Price Quantity Demanded($ per Greebe) (millions of Greebes)$.10 350.15 300.20 250.25 200.30 150.35 100.40 50
2. Now, let’s suppose there is a dramatic change in federal income-tax rates that affects the dispos-able income of Greebe buyers. This change in the ceteris paribus (all else being equal) conditionsunderlying the original demand for Greebes will result in a new set of data, shown in Figure 3.3.Study these new data, and add the new demand curve for Greebes to the axes in Figure 3.2. Labelthe new demand curve D1 and answer the questions that follow.
3. Comparing the new demand curve (D1) with the original demand curve (D), we can say that thechange in the demand for Greebes results in a shift of the demand curve to the (left / right).
Such a shift indicates that at each of the possible prices shown, buyers are now willing to buy a (smaller / larger) quantity; and at each of the possible quantities shown, buyers are willing to offer a (higher / lower) maximum price. The cause of this demand curve shift was a(n) (increase / decrease) in tax rates that (increased / decreased) the disposable income of Greebe buyers.
4. Now, let’s suppose that there is a dramatic change in people’s tastes and preferences for Greebes. Thischange in the ceteris paribus conditions underlying the original demand for Greebes will result in a newset of data, shown in Figure 3.4. Study these new data, and add the new demand curve for Greebes tothe axes in Figure 3.2. Label the new demand curve D2 and answer the questions that follow.
Comparing the new demand curve (D2) with the original demand curve (D), we can say that thechange in the demand for Greebes results in a shift of the demand curve to the (left / right).
Figure 3.3New Demand for Greebes
Price Quantity Demanded($ per Greebe) (millions of Greebes)$.05 300.10 250.15 200.20 150.25 100.30 50
Figure 3.4New Demand for Greebes
Price Quantity Demanded($ per Greebe) (millions of Greebes)$.20 350.25 300.30 250.35 200.40 150.45 100.50 50
Such a shift indicates that at each of the possible prices shown, buyers are now willing to buy a (smaller / larger) quantity; and at each of the possible quantities shown, buyers are willing to offer a (lower / higher) maximum price. The cause of this shift in the demand curve was a(n) (increase / decrease) in people’s tastes and preferences for Greebes.
Part BNow, to test your understanding, underline the answer you think is the one best alternative in each ofthe following multiple-choice questions.
5. Other things constant, which of the following would not cause a change in the demand (shift inthe demand curve) for mopeds?
(A) A decrease in consumer incomes
(B) A decrease in the price of mopeds
(C) An increase in the price of bicycles, a substitute for mopeds
(D) An increase in people’s tastes and preferences for mopeds
6. “Rising oil prices have caused a sharp decrease in the demand for oil.” Speaking precisely, and usingterms as they are defined by economists, choose the statement that best describes this quotation.
(A) The quotation is correct: An increase in price always causes a decrease in demand.
(B) The quotation is incorrect: An increase in price always causes an increase in demand, not adecrease in demand.
(C) The quotation is incorrect: An increase in price causes a decrease in the quantity demanded,not a decrease in demand.
(D) The quotation is incorrect: An increase in price causes an increase in the quantity demanded,not a decrease in demand.
7. “As the price of domestic automobiles has inched upward, customers have found foreign autos tobe a better bargain. Consequently, domestic auto sales have been decreasing, and foreign auto saleshave been increasing.” Using only the information in this quotation and assuming everything elseconstant, which of the following best describes this statement?
(A) A shift in the demand curves for both domestic and foreign automobiles
(B) A movement along the demand curves for both foreign and domestic automobiles
(C) A movement along the demand curve for domestic autos, and a shift in the demand curve forforeign autos
(D) A shift in the demand curve for domestic autos, and a movement along the demand curve forforeign autos
8. You hear a fellow student say: “Economic markets are like a perpetual see-saw. If demand rises, theprice rises; if price rises, then demand will fall. If demand falls, price will fall; if price falls, demandwill rise and so on forever.” Dispel your friend’s obvious confusion in no more than one shortparagraph below.
The student is confusing a change in “demand” (shift in the curve) with a change in “quantitydemanded” (a movement along the curve). Part of the second sentence — “if price rises, thendemand will fall” — is wrong: The quantity demanded will fall; and since this is not a change indemand, the rest of the statement does not follow.
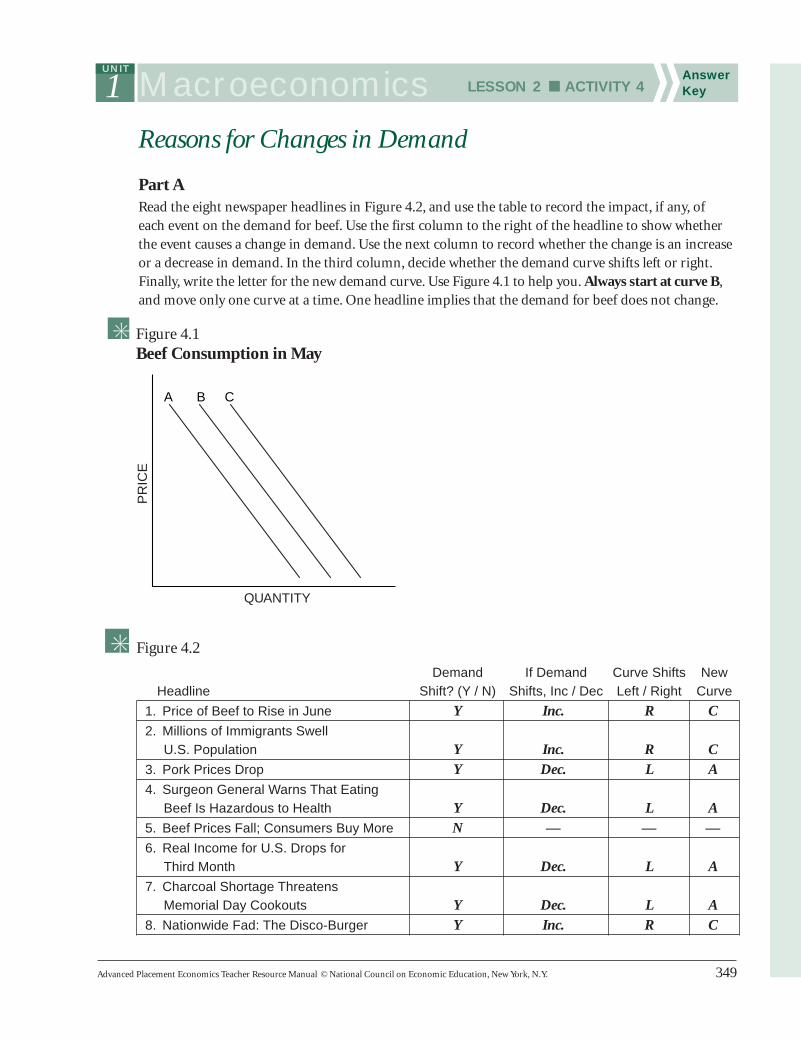
Part ARead the eight newspaper headlines in Figure 4.2, and use the table to record the impact, if any, ofeach event on the demand for beef. Use the first column to the right of the headline to show whetherthe event causes a change in demand. Use the next column to record whether the change is an increaseor a decrease in demand. In the third column, decide whether the demand curve shifts left or right.Finally, write the letter for the new demand curve. Use Figure 4.1 to help you. Always start at curve B,and move only one curve at a time. One headline implies that the demand for beef does not change.
Demand If Demand Curve Shifts NewHeadline Shift? (Y / N) Shifts, Inc / Dec Left / Right Curve
1. Price of Beef to Rise in June Y Inc. R C
2. Millions of Immigrants Swell U.S. Population Y Inc. R C
3. Pork Prices Drop Y Dec. L A
4. Surgeon General Warns That Eating Beef Is Hazardous to Health Y Dec. L A
5. Beef Prices Fall; Consumers Buy More N — — —
6. Real Income for U.S. Drops for Third Month Y Dec. L A
7. Charcoal Shortage Threatens Memorial Day Cookouts Y Dec. L A
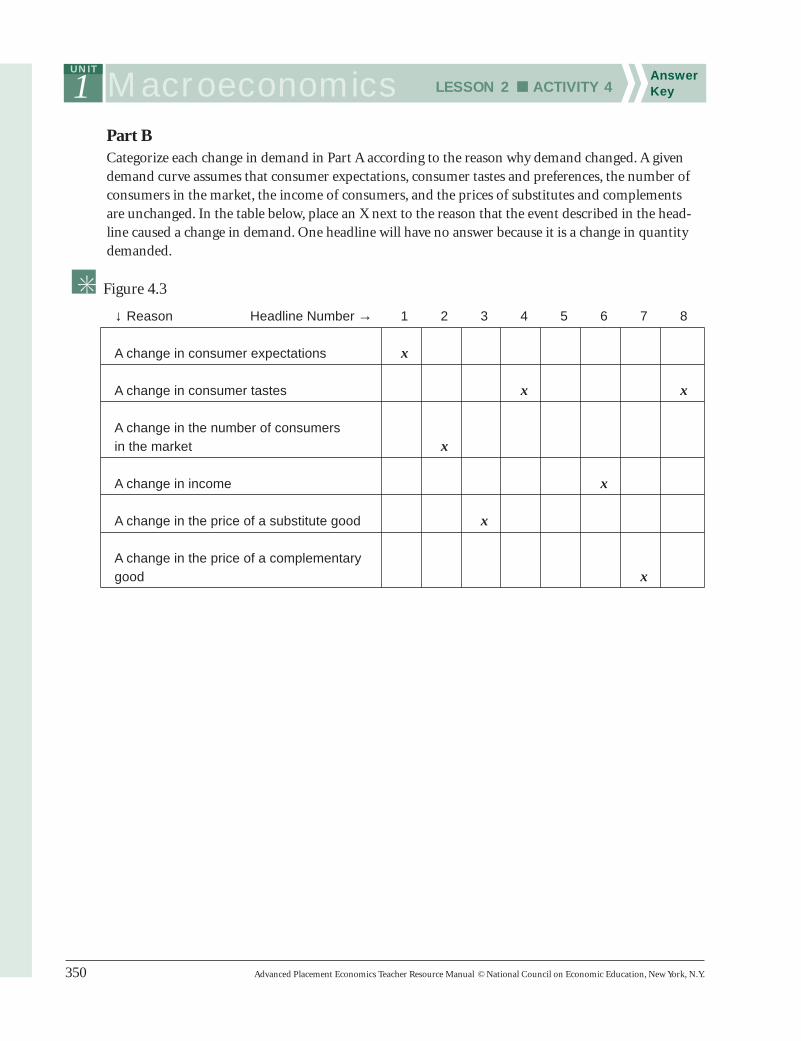
Part BCategorize each change in demand in Part A according to the reason why demand changed. A givendemand curve assumes that consumer expectations, consumer tastes and preferences, the number ofconsumers in the market, the income of consumers, and the prices of substitutes and complements are unchanged. In the table below, place an X next to the reason that the event described in the head-line caused a change in demand. One headline will have no answer because it is a change in quantitydemanded.
↓ Reason Headline Number → 1 2 3 4 5 6 7 8
A change in consumer expectations x
A change in consumer tastes x x
A change in the number of consumers in the market x
Introduction and DescriptionLesson 2 introduced demand. This lessonintroduces supply, the other half of the market sys-tem. A supply schedule represents the quantitiesthat firms are willing and able to supply at alterna-tive prices. A supply curve is a graphical represen-tation of the supply schedule. Understanding amarket is essential to success in AP Economics.
Activity 5 has the students graph a supplyschedule and helps them understand the implica-tions of a shift in the supply curve. The activity thenfocuses on the factors that shift the supply curve.Activity 6 reinforces the factors that cause a supplycurve to shift, the direction of the shift and whetherthe shift represents an increase or decrease in supply.
Objectives1. Define supply schedule and supply curve.2. Construct a supply curve using hypothetical
data.3. Explain why producers are willing to supply more
of a good or service when the price increases.4. Explain the difference between a shift in the
supply curve and a movement along the supplycurve.
5. Explain the difference between an increase insupply and an increase in the quantity supplied.
6. Describe and analyze the forces that shift thesupply curve.
7. Explain why a supply curve would shift to theright or left given specific changes in the economy.
Time RequiredTwo class periods or 90 minutes
Materials1. Activities 5 and 62. Visual 1.7 and Visual 1.8
Procedure1. Begin with a discussion of supply. Ask the stu-
dents what factors they think determine howmuch a firm will produce. Be sure to emphasizethat supply is not inventory or stock, but theamount producers are willing and able to bringto market at alternative prices.
2. Use Visual 1.7 and note that as the pricedecreases, the quantity supplied decreases.
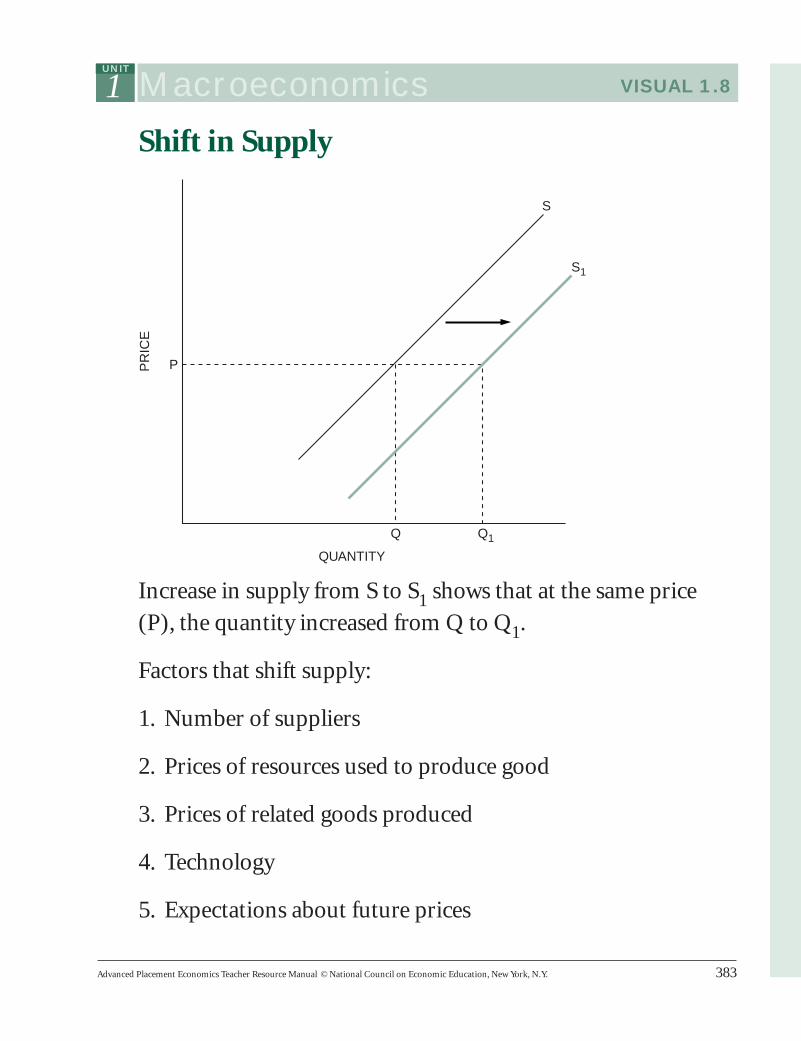
3. Use Visual 1.8. Show that an increase in supplyis a shift to the right (and a decrease in supply isa shift to the left), and discuss the factors thatwill shift the supply curve.
4. Have the students start Activity 5 in class andcomplete it for homework.
5. Review the answers to Activity 5.
6. Review the factors that shift the supply curve.
7. Have the students complete Activity 6 in class.
8. Review the answers to Activity 6 with thestudents.
Supply Curves, Movements Along Supply Curves and Shifts in Supply CurvesIn this activity and those that follow, we will assume that the long-run supply curve of Greebes is typ-ically upward sloping.
Part AStudy the data in Figure 5.1 and plot the supply of Greebes on the axes in Figure 5.2. Label the supplycurve S and answer the questions that follow. Write the correct answer on the answer blank, or under-line the correct answer in parentheses.
1. The data for supply curve S indicate that at a price of $0.25 per Greebe, suppliers would be willingto offer 200 million Greebes. Other things constant, if the price of Greebes increased to$0.30 per Greebe, suppliers would be willing to offer 250 million Greebes. Such achange would be an increase in (supply / quantity supplied).
Figure 5.1Supply of Greebes
Price Quantity Supplied($ per Greebe) (millions of Greebes)$.15 100
Other things constant, if the price of Greebes decreased to $0.20 per Greebe, suppliers would be willing to offer 150 million Greebes. Such a change would be called a decrease in (supply / quantity supplied).
2. Now, let’s suppose that there is a dramatic change in the price of several of the raw materials used inmaking Greebes. This change in the ceteris paribus conditions underlying the original supply ofGreebes will result in a new set of data, such as that shown in Figure 5.3. Study the data, and plot thissupply of Greebes on the axes in Figure 5.2. Label the new supply curve S1 and answer the questionsthat follow.
3. Comparing the new supply curve (S1) with the original supply curve (S), we can say that a changein the supply of Greebes results in a shift of the supply curve to the (left / right). Such a shift indi-cates that at each of the possible prices shown, suppliers are now willing to offer a (smaller / larger)quantity; and at each of the possible quantities shown, suppliers are willing to accept a (higher / lower) minimum price. The cause of this supply curve shift was a(n) (increase / decrease)in prices of several of the raw materials used in making Greebes.
4. Now, let’s suppose that there is a dramatic change in the price of Silopanna, a resource used in theproduction of Greebes. This change in the ceteris paribus conditions underlying the original supply ofGreebes will result in a new set of data shown in in Figure 5.4. Study the data, and plot this supply ofGreebes on the axes in Figure 5.2. Label the new supply curve S2 and answer the questions that follow.
Comparing the new supply curve (S2) with the original supply curve (S), we can say that the changein the supply of Greebes results in a shift of the supply curve to the (left / right). Such a shift indi-
Figure 5.3New Supply of Greebes
Price Quantity Supplied($ per Greebe) (millions of Greebes)$.20 50.25 100.30 150.35 200.40 250
Figure 5.4New Supply of Greebes
Price Quantity Supplied($ per Greebe) (millions of Greebes)$.10 150.15 200.20 250.25 300.30 350
cates that at each of the possible prices shown, suppliers are now willing to offer a (smaller / larger)quantity; and at each of the possible quantities shown, suppliers are willing to accept a (lower / higher) minimum price. The cause of this supply curve shift is a(n) (increase / decrease) in the price of Silopanna, a resource used in the production of Greebes.
Part BNow, to check your understanding, underline the answer you think is the one best alternative in eachof the following multiple-choice questions.
5. Other things constant, which of the following would not cause a change in the long-run supply ofbeef?
(A) A decrease in the price of beef
(B) A decrease in the price of cattle feed
(C) An increase in the price of cattle feed
(D) An increase in the cost of transporting cattle to market
6. “Falling oil prices have caused a sharp decrease in the supply of oil.” Speaking precisely, and usingterms as they are defined by economists, choose the statement that best describes this quotation.
(A) The quotation is correct: A decrease in price always causes a decrease in supply.
(B) The quotation is incorrect: A decrease in price always causes an increase in supply, not adecrease in supply.
(C) The quotation is incorrect: A decrease in price causes an increase in the quantity supplied,not a decrease in supply.
(D) The quotation is incorrect: A decrease in price causes a decrease in the quantity supplied,not a decrease in supply.
7. A multiyear drought in Florida has dried the land so that rampant wildfires have destroyed manyorange groves. Florida oranges supply much of the nation’s orange juice. Which statement belowis correct?
(A) The price of orange juice will rise because of a movement up the supply curve.
(B) The price of orange juice will rise because the supply curve will shift to the left.
(C) The price of orange juice will fall because of a movement down the supply curve.
(D) The price of orange juice will fall because the supply curve will shift to the right.
8. A popular movie star wears a certain style of sunglasses. If her fans want to copy her look,
(A) the price of the movie star’s brand of sunglasses will rise because of a movement up the supplycurve.
(B) the price of the movie star’s brand of sunglasses will rise because the supply curve will shift tothe left.
(C) the price of the movie star’s brand of sunglasses will fall because of a movement down thesupply curve.
(D) the price of the movie star’s brand of sunglasses will fall because the supply curve will shift tothe right.
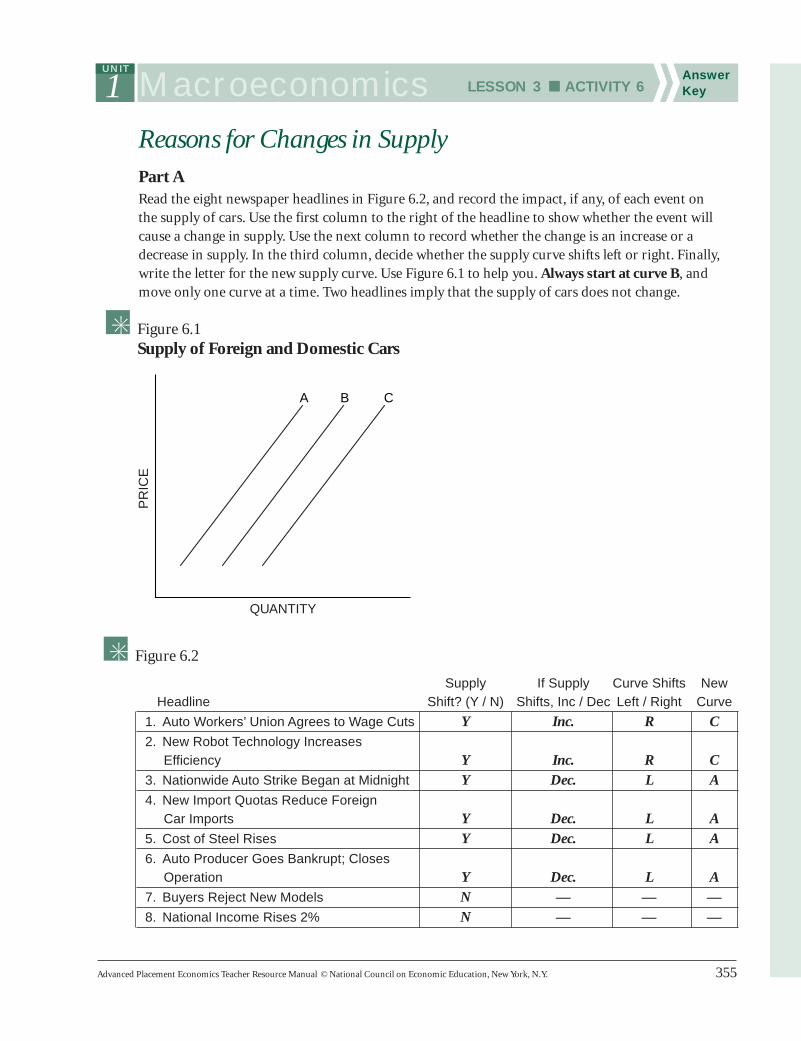
Reasons for Changes in SupplyPart ARead the eight newspaper headlines in Figure 6.2, and record the impact, if any, of each event on the supply of cars. Use the first column to the right of the headline to show whether the event willcause a change in supply. Use the next column to record whether the change is an increase or adecrease in supply. In the third column, decide whether the supply curve shifts left or right. Finally,write the letter for the new supply curve. Use Figure 6.1 to help you. Always start at curve B, andmove only one curve at a time. Two headlines imply that the supply of cars does not change.
Supply If Supply Curve Shifts NewHeadline Shift? (Y / N) Shifts, Inc / Dec Left / Right Curve
1. Auto Workers’ Union Agrees to Wage Cuts Y Inc. R C
2. New Robot Technology Increases Efficiency Y Inc. R C
3. Nationwide Auto Strike Began at Midnight Y Dec. L A
4. New Import Quotas Reduce Foreign Car Imports Y Dec. L A
5. Cost of Steel Rises Y Dec. L A
6. Auto Producer Goes Bankrupt; Closes Operation Y Dec. L A
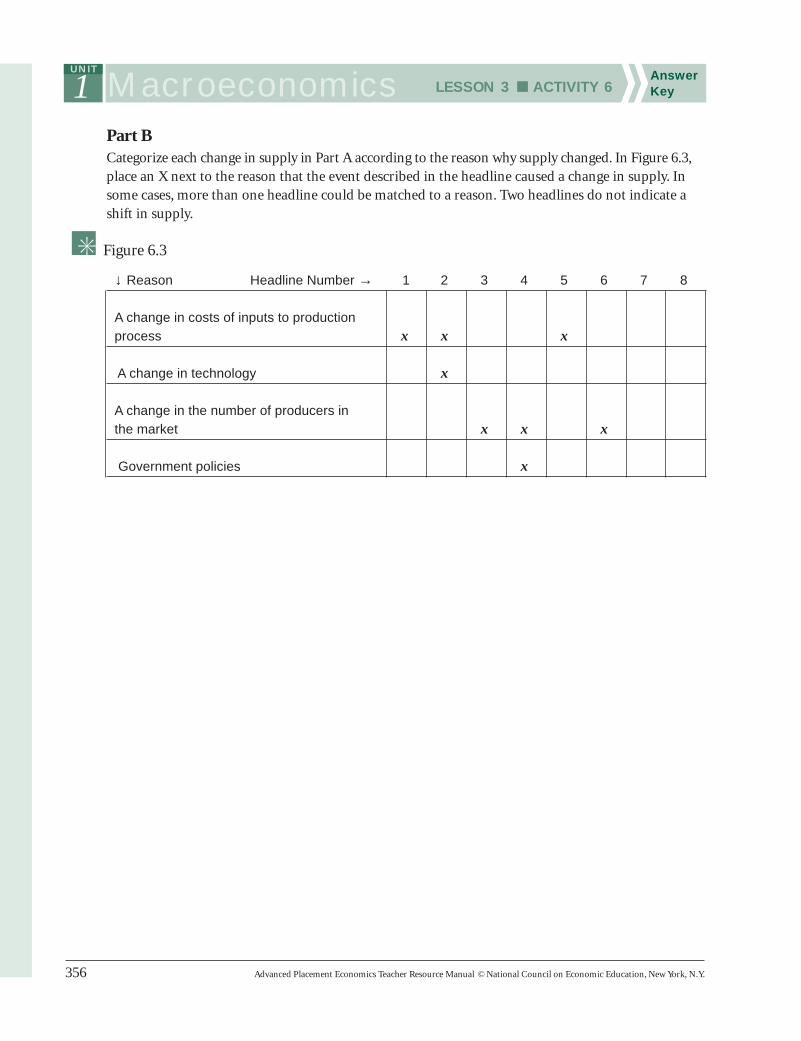
Part BCategorize each change in supply in Part A according to the reason why supply changed. In Figure 6.3,place an X next to the reason that the event described in the headline caused a change in supply. Insome cases, more than one headline could be matched to a reason. Two headlines do not indicate ashift in supply.
↓ Reason Headline Number → 1 2 3 4 5 6 7 8
A change in costs of inputs to production process x x x
A change in technology x
A change in the number of producers in the market x x x
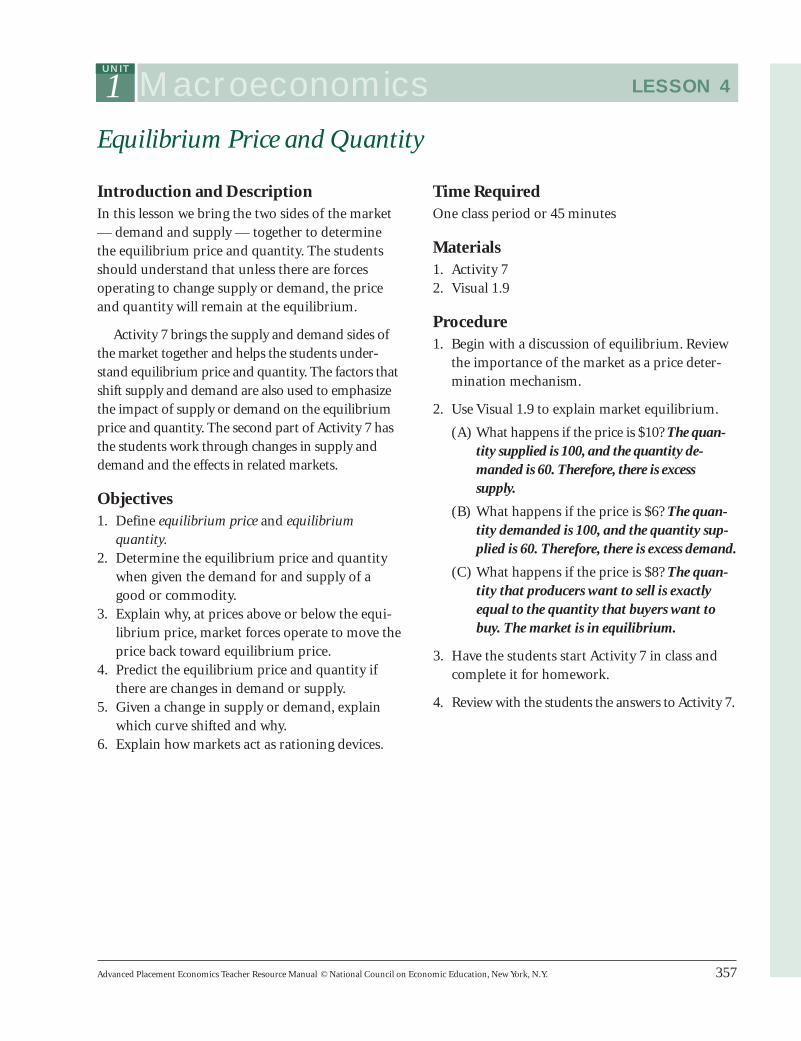
Introduction and DescriptionIn this lesson we bring the two sides of the market— demand and supply — together to determinethe equilibrium price and quantity. The studentsshould understand that unless there are forcesoperating to change supply or demand, the priceand quantity will remain at the equilibrium.
Activity 7 brings the supply and demand sides ofthe market together and helps the students under-stand equilibrium price and quantity. The factors thatshift supply and demand are also used to emphasizethe impact of supply or demand on the equilibriumprice and quantity. The second part of Activity 7 hasthe students work through changes in supply anddemand and the effects in related markets.
Objectives1. Define equilibrium price and equilibrium
quantity.2. Determine the equilibrium price and quantity
when given the demand for and supply of agood or commodity.
3. Explain why, at prices above or below the equi-librium price, market forces operate to move theprice back toward equilibrium price.
4. Predict the equilibrium price and quantity ifthere are changes in demand or supply.
5. Given a change in supply or demand, explainwhich curve shifted and why.
6. Explain how markets act as rationing devices.
Time RequiredOne class period or 45 minutes
Materials1. Activity 72. Visual 1.9
Procedure1. Begin with a discussion of equilibrium. Review
the importance of the market as a price deter-mination mechanism.
2. Use Visual 1.9 to explain market equilibrium.
(A) What happens if the price is $10? The quan-tity supplied is 100, and the quantity de-manded is 60. Therefore, there is excesssupply.
(B) What happens if the price is $6? The quan-tity demanded is 100, and the quantity sup-plied is 60. Therefore, there is excess demand.
(C) What happens if the price is $8? The quan-tity that producers want to sell is exactlyequal to the quantity that buyers want tobuy. The market is in equilibrium.
3. Have the students start Activity 7 in class andcomplete it for homework.
4. Review with the students the answers to Activity 7.
Equilibrium Price and Equilibrium QuantityPart AFigure 7.1 below shows the demand for Greebes and the supply of Greebes. Plot these data on theaxes in Figure 7.2. Label the demand curve D and label the supply curve S. Then answer the questionsthat follow. Fill in the answer blanks, or underline the correct answers in parentheses.
1. Under these conditions, competitive market forces would tend to establish an equilibrium price of $ 0.25 per Greebe and an equilibrium quantity of 200 million Greebes.
2. If the price currently prevailing in the market is $0.30 per Greebe, buyers would want to buy 150 million Greebes and sellers would want to sell 250 million Greebes. Under theseconditions, there would be a (shortage / surplus) of 100 million Greebes. Competitive marketforces would tend to cause the price to (increase / decrease) to a price of $0.25 per Greebe.
At this new price, buyers would now want to buy 200 million Greebes, and sellers now wantto sell 200 million Greebes. Because of this change in (price / underlying conditions),
Figure 7.1Demand for and Supply of Greebes
Price Quantity Demanded Quantity Supplied($ per Greebe) (millions of Greebes) (millions of Greebes)$.15 300 100.20 250 150.25 200 200.30 150 250.35 100 300
the (demand / quantity demanded) changed by 50 million Greebes, and the (supply / quantity supplied) changed by 50 million Greebes.
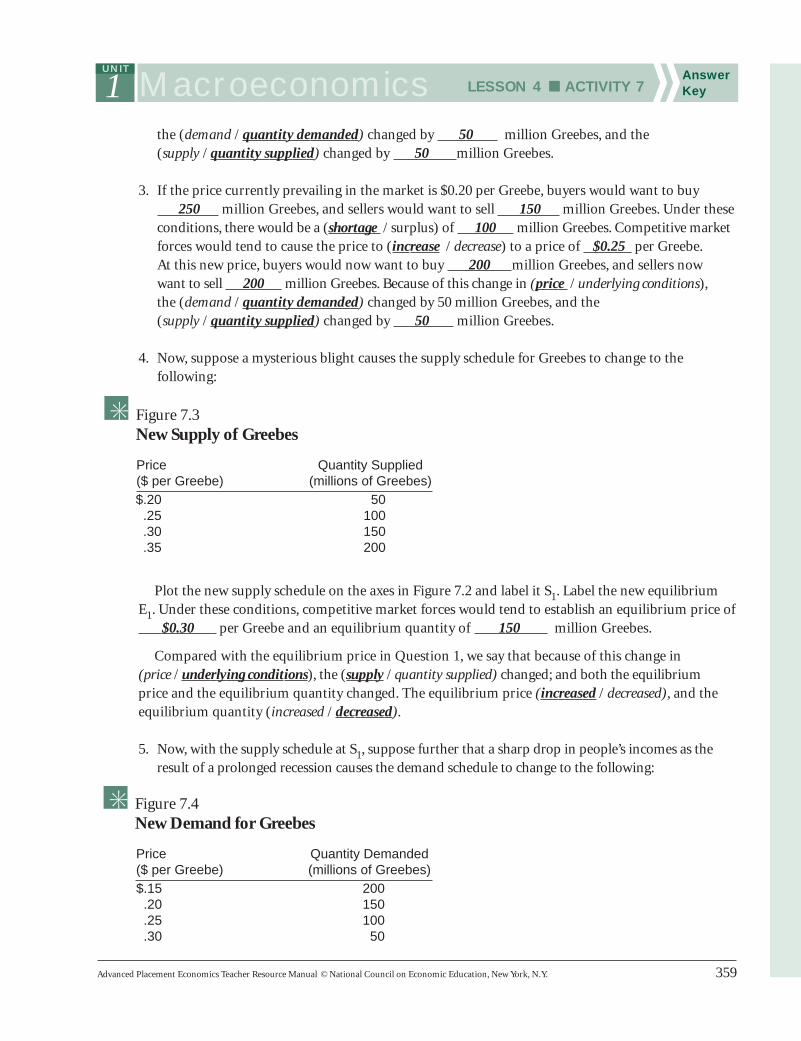
3. If the price currently prevailing in the market is $0.20 per Greebe, buyers would want to buy 250 million Greebes, and sellers would want to sell 150 million Greebes. Under theseconditions, there would be a (shortage / surplus) of 100 million Greebes. Competitive marketforces would tend to cause the price to (increase / decrease) to a price of $0.25 per Greebe.At this new price, buyers would now want to buy 200 million Greebes, and sellers now want to sell 200 million Greebes. Because of this change in (price / underlying conditions),the (demand / quantity demanded) changed by 50 million Greebes, and the (supply / quantity supplied) changed by 50 million Greebes.
4. Now, suppose a mysterious blight causes the supply schedule for Greebes to change to thefollowing:
Plot the new supply schedule on the axes in Figure 7.2 and label it S1. Label the new equilibriumE1. Under these conditions, competitive market forces would tend to establish an equilibrium price of
$0.30 per Greebe and an equilibrium quantity of 150 million Greebes.
Compared with the equilibrium price in Question 1, we say that because of this change in (price / underlying conditions), the (supply / quantity supplied) changed; and both the equilibriumprice and the equilibrium quantity changed. The equilibrium price (increased / decreased), and theequilibrium quantity (increased / decreased).
5. Now, with the supply schedule at S1, suppose further that a sharp drop in people’s incomes as theresult of a prolonged recession causes the demand schedule to change to the following:
Figure 7.3New Supply of Greebes
Price Quantity Supplied($ per Greebe) (millions of Greebes)$.20 50.25 100.30 150.35 200
Figure 7.4New Demand for Greebes
Price Quantity Demanded($ per Greebe) (millions of Greebes)$.15 200.20 150.25 100.30 50
Plot the new demand schedule on the axes in Figure 7.2 and label it D1. Label the new equilibriumE2. Under these conditions, with the supply schedule at S1, competitive market forces would tend toestablish an equilibrium price of $0.25 per Greebe and an equilibrium quantity of 100 million Greebes. Compared with the equilibrium price in Question 4, because of thischange in (price / underlying conditions), the (demand / quantity demanded) changed. Theequilibrium price (increased / decreased), and the equilibrium quantity (increased / decreased).
6. The movement from the first equilibrium price and quantity to the new equilibrium price andquantity is the result of a (price / nonprice) effect.
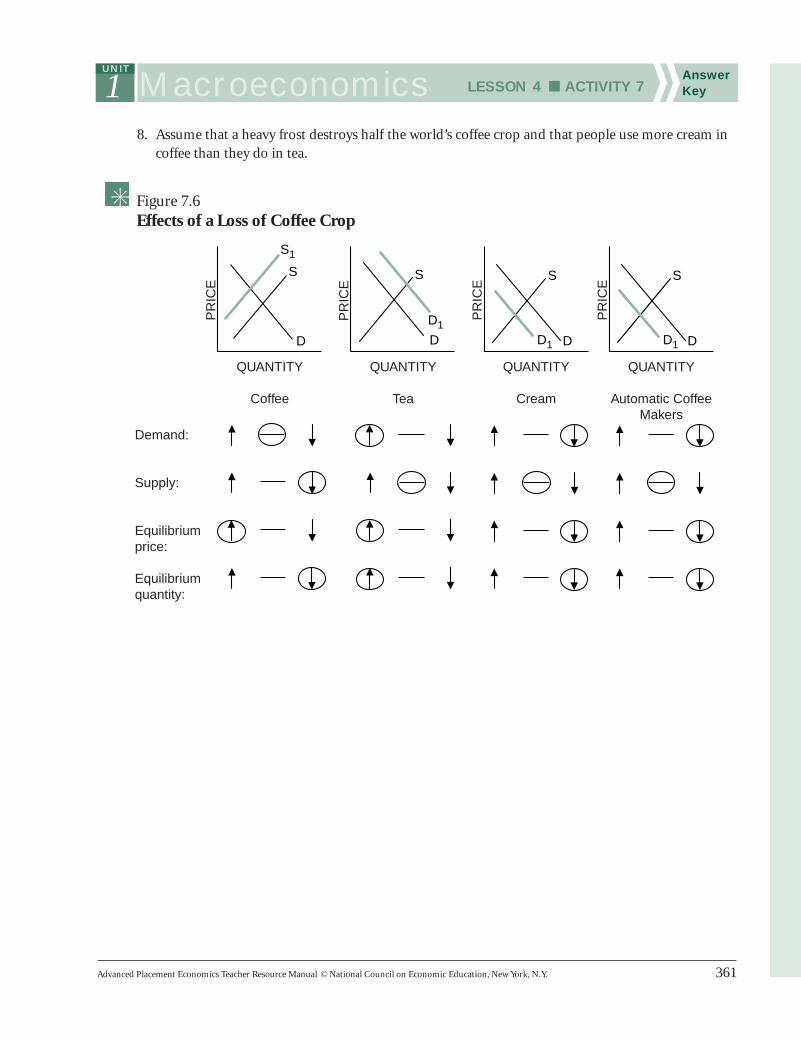
Part BThe following questions refer to a group of related markets in the United States during a given timeperiod. Assume that the markets are perfectly competitive and that the supply and demand model iscompletely applicable. The figures show the supply and demand in each market before the assumedchange occurs. Trace through the effects of the assumed change, other things constant. Work your wayfrom left to right. Shift only one curve in each market. For each market, draw whatever new supply ordemand curves are needed, labeling each new curve S1 or D1. Then circle the correct symbol undereach diagram (↑ for increase, — for unchanged, and ↓ for decrease). Remember to shift only onecurve in each market.
7. Assume that a new fertilizer dramatically increases the amount of wheat that can be harvestedwith no additional labor or machinery. Also assume that this fertilizer does not affect potato farm-ing and that people are satisfied to eat either bread made from wheat flour or potatoes.
Introduction and DescriptionIn many economic situations, producers and policymakers want to know more than simply the direc-tion in which price or quantity will move. The lawof demand tells producers that if price increases,the quantity demanded will decrease. This lawdoesn’t tell the producers by how much the quanti-ty demanded will decrease. The responsiveness ofone variable to changes in another variable isimportant information. Elasticity is a measurementof how much one variable will change if anothervariable changes.
Activity 8 focuses on the definition of elasticityand the calculation of the coefficient of elasticity. Theactivity then has the students see the difference be-tween elasticity of a curve and the slope of a curve.
Objectives1. Define price elasticity of demand and price elas-
ticity of supply.2. Calculate price elasticity using the arc method.3. Predict the effect on price and quantity given
demand curves with different elasticities.4. Explain the difference between slope of a line
and the elasticity between two points on a line.
Time RequiredOne class period or 45 minutes
Materials1. Activity 82. Visuals 1.10, 1.11 and 1.12
Procedure1. Begin with a discussion of elasticity. Review the
importance of the market as a price-determina-tion mechanism.
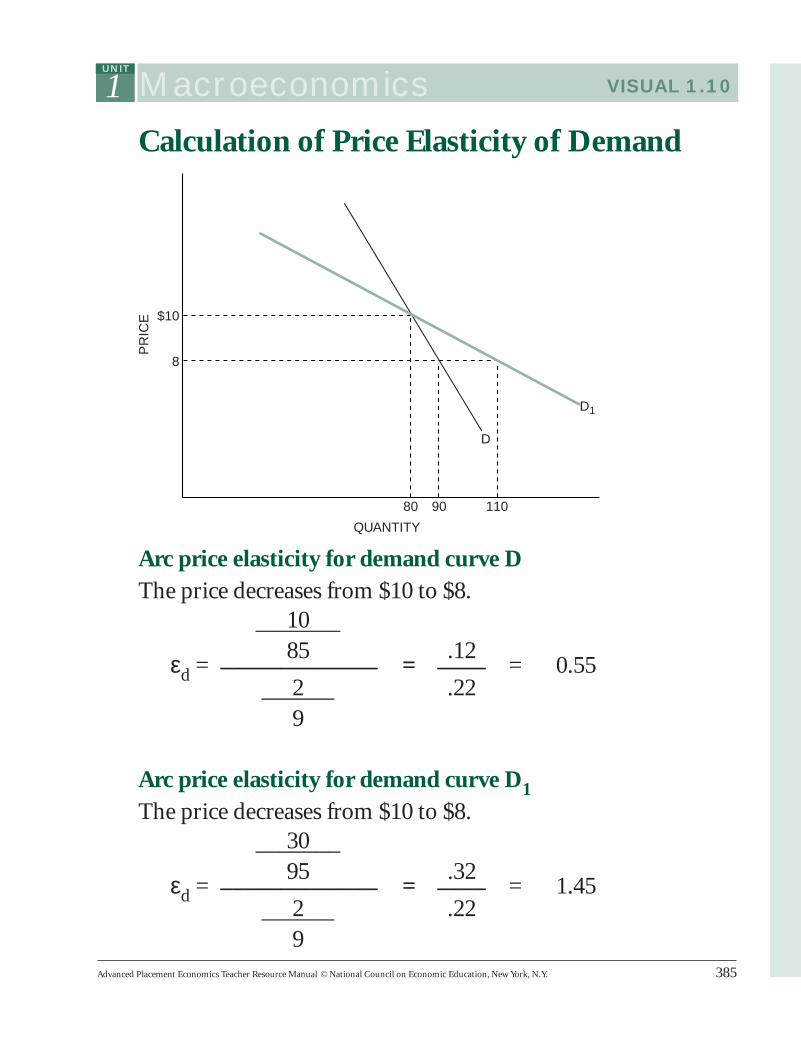
2. Provide several examples and demonstrate themethod to calculate the elasticity of each curve.Be sure to show elastic as well as inelastic demandcurves. Visual 1.10 contains two examples. Be sureto emphasize that demand elasticity is always neg-ative and supply elasticity is always positive. Forthis reason, we look at the absolute value of thecoefficient of elasticity and always talk about posi-tive values.
3. Emphasize by working through an example thatelasticity and slope are different concepts. UseVisual 1.11 to show that the elasticity of astraight line is not constant. Use this example toshow that slope of a straight line is constant.Emphasize that slope and elasticity are not thesame concept. The slope is 1 at both ends of thedemand curve.
4. Use Visual 1.12 to explain the effects of changeswith demand curves with different elasticities.
(A) Which demand curve is more inelastic? D
(B) What happens to the equilibrium price andquantity with an elastic demand curve ifsupply increases? With an elastic demandcurve, the price effect is smaller and thequantity effect is larger than with an in-elastic demand curve.
(C) What happens to the equilibrium price andquantity with an inelastic demand curve ifsupply increases? With an inelastic demandcurve, the price effect is greater and thequantity effect is smaller than with the elas-tic demand curve.
5. Have the students start Activity 8 in class andcomplete it for homework.
6. Review with the students the answers to Activity 8.
Part AProblems Involving Extra Credit1. Now, suppose that your economics teacher currently allows you to earn extra credit by submitting
answers to the end-of-the-chapter questions in your textbook. The number of questions you’rewilling to submit depends on the amount of extra credit for each question. How responsive youare to a change in the extra-credit points the teacher gives can be represented as an elasticity. Writethe formula for the elasticity of extra-credit problems submitted:
percentage change in number of questionsεps = _________________________________percentage change in extra-credit points
2. Now, consider that your teacher’s goal is to get you to submit twice as many questions:a 100-percent increase. Underline the correct answer in parentheses.
(A) If the number of chapter-end questions you submit is very responsive to a change in extra-credit points, then a given increase in extra credit elicits a large increase in questions submitted. In this case, your teacher will need to increase the extra-credit points by (more than / less than / exactly) 100 percent.
(B) If the number of chapter-end questions you submit is not very responsive to a change inextra-credit points, then a given increase in extra credit elicits a small increase in questionssubmitted. In this case, your teacher will need to increase the extra-credit points by (more than / less than / exactly) 100 percent.
Part DProblems Involving CoffeeSuppose Moonbucks, a national coffee-house franchise, finally moves into the little town of Middle-ofnowhere. Moonbucks is the only supplier of coffee in town and faces the following demand sched-ule each week. Write the correct answer on the answer blanks, or underline the correct answer inparentheses.
3. What is the arc price elasticity of demand when the price changes from $1 to $2? .18
So, over this range of prices, demand is (elastic / unit elastic / inelastic).
Note: Because the relationship between quantity demanded and price is inverse, price elasticity ofdemand would always be negative. Economists believe using negative numbers is confusing whenreferring to “large” or “small” elasticities of demand. Therefore, they use absolute or positive numbers,changing the sign on the negative numbers.
Part ENow, consider Figure 8.4, which graphs the demand schedule given in Figure 8.3.Recall the slope of a line is measured by the rise over the run: slope = rise / run = ∆P / ∆Q.
5. Using your calculations of ∆P and ∆Q from Question 3, calculate the slope of the demand curve. 1/20 or .05
6. Using your calculations of ∆P and ∆Q from Question 4, calculate the slope of the demand curve. 1 /20 or .05 This is the same slope as for Question 5. These calculations help the students
to understand in Question 7 that a demand curve of constant slope has several varying elasticities.
7. The law of demand tells us that an increase in price results in a decrease in the quantity demand-ed. Questions 5 and 6 remind us that the slope of a straight line is constant everywhere along theline. Along this demand curve, a change in price of $1 generates a change in quantity demanded of20 cups of coffee a week.
You’ve now shown mathematically that while the slope of the demand curve is related to elas-ticity, the two concepts are not the same thing. Briefly discuss the relationship between where youare along the demand curve and the elasticity of demand. How does this tie into the notion ofresponsiveness? At a higher price, you are in the price elastic portion of the demand curve. As youmove to a lower price along a demand curve, the demand curve becomes more price inelastic. Thus,at a high price, a small percentage change in price leads to a large percentage change in quantity. Asthe price decreases, the same percentage change in price generates a smaller percentage change inquantity, so the elasticity of demand decreases.
Answers to Sample Short Free-Response Questions1. True, false or uncertain, and explain why? “The economic concept of scarcity is not relevant to the
study of a modern economy such as that of the United States because the existence of unsold stocksof goods (books, cars, homes) is vivid evidence that we are surrounded by plenty, not scarcity.”False. Economic scarcity refers to the fact that there are a limited number of productive resourcesavailable to satisfy the unlimited wants of society.
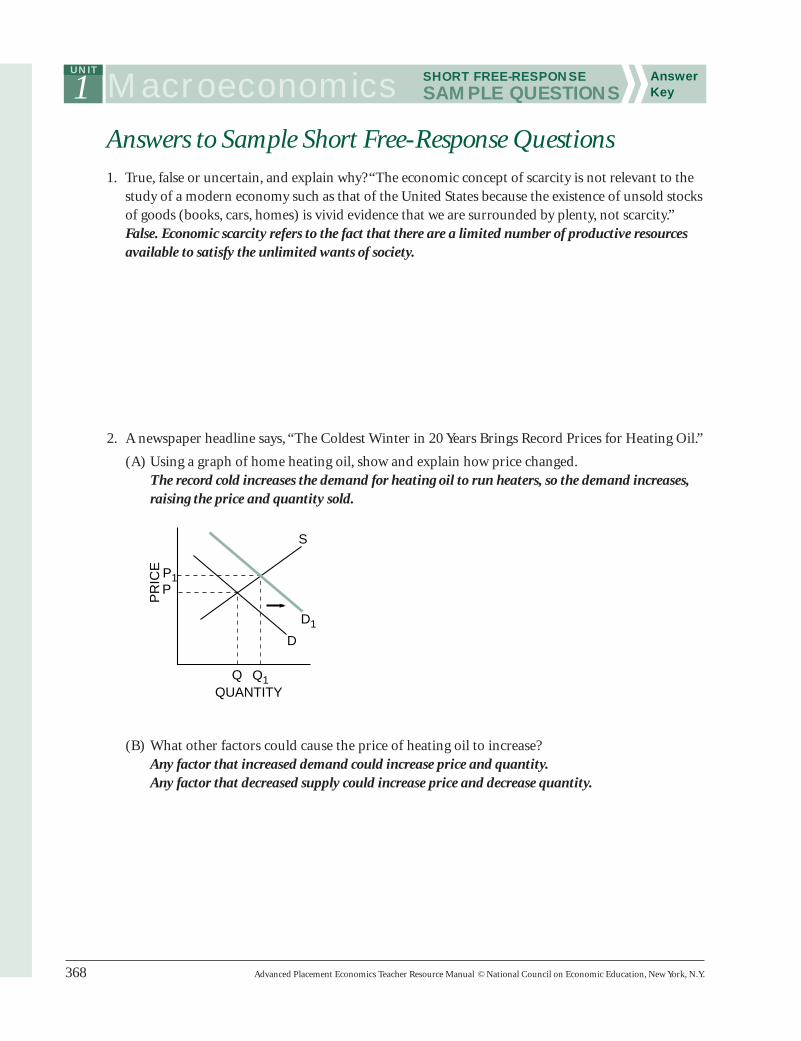
2. A newspaper headline says, “The Coldest Winter in 20 Years Brings Record Prices for Heating Oil.”
(A) Using a graph of home heating oil, show and explain how price changed.The record cold increases the demand for heating oil to run heaters, so the demand increases,raising the price and quantity sold.
(B) What other factors could cause the price of heating oil to increase?Any factor that increased demand could increase price and quantity.Any factor that decreased supply could increase price and decrease quantity.
1 Macroeconomics SHORT FREE-RESPONSESAMPLE QUESTIONS
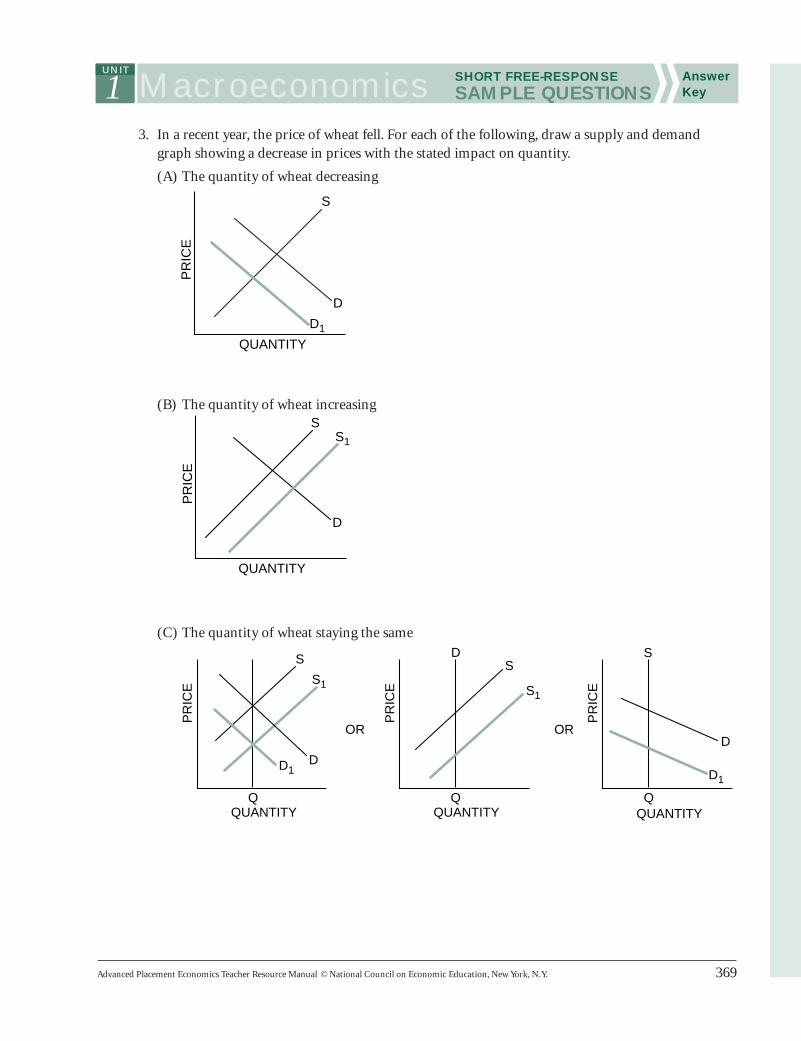
3. In a recent year, the price of wheat fell. For each of the following, draw a supply and demandgraph showing a decrease in prices with the stated impact on quantity.
(A) The quantity of wheat decreasing
(B) The quantity of wheat increasing
(C) The quantity of wheat staying the same
S
D1
D
QUANTITY
PR
ICE
SS1
D
QUANTITY
PR
ICE
Q
S
OR OR
S1
D
QUANTITY
PR
ICE
Q
D
S1
S
QUANTITY
PR
ICE
Q
S
D1D1
D
QUANTITY
PR
ICE
1 Macroeconomics SHORT FREE-RESPONSESAMPLE QUESTIONS
4. True, false or uncertain, and explain why? “If you won $1 million in the lottery, you wouldn’t havethe economic problem of scarcity.” False. People with $1 million cannot spend more than $1 mil-lion. Even if people had all the money they could use, time to use it would be scarce.
5. Explain what would have to be true in each case for the production possibilities curves to beshaped as they are in Graphs I, II and III.
In Graph I there are increasing costs. To move from B to C to D, the economy must give up increas-ing numbers of planes. The factors that produce butter and planes are not equally efficient in theproduction of both commodities.
In Graph II there are constant costs. To move from B to C to D, the economy must give up the samenumber of planes to gain the same amount of butter — for example, one plane for 25 pounds ofbutter.
In Graph III there are decreasing costs of production. To move from B to C to D, the economy has togive up decreasing numbers of planes to get the same amount of butter. In this situation, the econo-my would end up at one end or the other: at either Point A or Point E.
1 Macroeconomics SHORT FREE-RESPONSESAMPLE QUESTIONS
Answers to Sample Short Free-Response Questions1. True, false or uncertain, and explain why? “The economic concept of scarcity is not relevant to the
study of a modern economy such as that of the United States because the existence of unsold stocksof goods (books, cars, homes) is vivid evidence that we are surrounded by plenty, not scarcity.”False. Economic scarcity refers to the fact that there are a limited number of productive resourcesavailable to satisfy the unlimited wants of society.
2. A newspaper headline says, “The Coldest Winter in 20 Years Brings Record Prices for Heating Oil.”
(A) Using a graph of home heating oil, show and explain how price changed.The record cold increases the demand for heating oil to run heaters, so the demand increases,raising the price and quantity sold.
(B) What other factors could cause the price of heating oil to increase?Any factor that increased demand could increase price and quantity.Any factor that decreased supply could increase price and decrease quantity.
1 Macroeconomics SHORT FREE-RESPONSESAMPLE QUESTIONS
3. In a recent year, the price of wheat fell. For each of the following, draw a supply and demandgraph showing a decrease in prices with the stated impact on quantity.
(A) The quantity of wheat decreasing
(B) The quantity of wheat increasing
(C) The quantity of wheat staying the same
S
D1
D
QUANTITY
PR
ICE
SS1
D
QUANTITY
PR
ICE
Q
S
OR OR
S1
D
QUANTITY
PR
ICE
Q
D
S1
S
QUANTITY
PR
ICE
Q
S
D1D1
D
QUANTITY
PR
ICE
1 Macroeconomics SHORT FREE-RESPONSESAMPLE QUESTIONS
4. True, false or uncertain, and explain why? “If you won $1 million in the lottery, you wouldn’t havethe economic problem of scarcity.” False. People with $1 million cannot spend more than $1 mil-lion. Even if people had all the money they could use, time to use it would be scarce.
5. Explain what would have to be true in each case for the production possibilities curves to beshaped as they are in Graphs I, II and III.
In Graph I there are increasing costs. To move from B to C to D, the economy must give up increas-ing numbers of planes. The factors that produce butter and planes are not equally efficient in theproduction of both commodities.
In Graph II there are constant costs. To move from B to C to D, the economy must give up the samenumber of planes to gain the same amount of butter — for example, one plane for 25 pounds ofbutter.
In Graph III there are decreasing costs of production. To move from B to C to D, the economy has togive up decreasing numbers of planes to get the same amount of butter. In this situation, the econo-my would end up at one end or the other: at either Point A or Point E.
1 Macroeconomics SHORT FREE-RESPONSESAMPLE QUESTIONS
Answers to Sample Long Free-Response Questions1. Every society has the fundamental problem of scarcity.
(A) What is scarcity? Scarcity exists because there are limited resources to fulfill unlimited wants.
(B) What three questions must every society answer because of scarcity? What to produce andhow much of each good or service to produce, how to produce, and for whom to produce
(C) What are the three ways societies have dealt with the scarcity problem? Tradition, commandand market
(D) Give one example of how each way is used in the United States. Answers will vary.
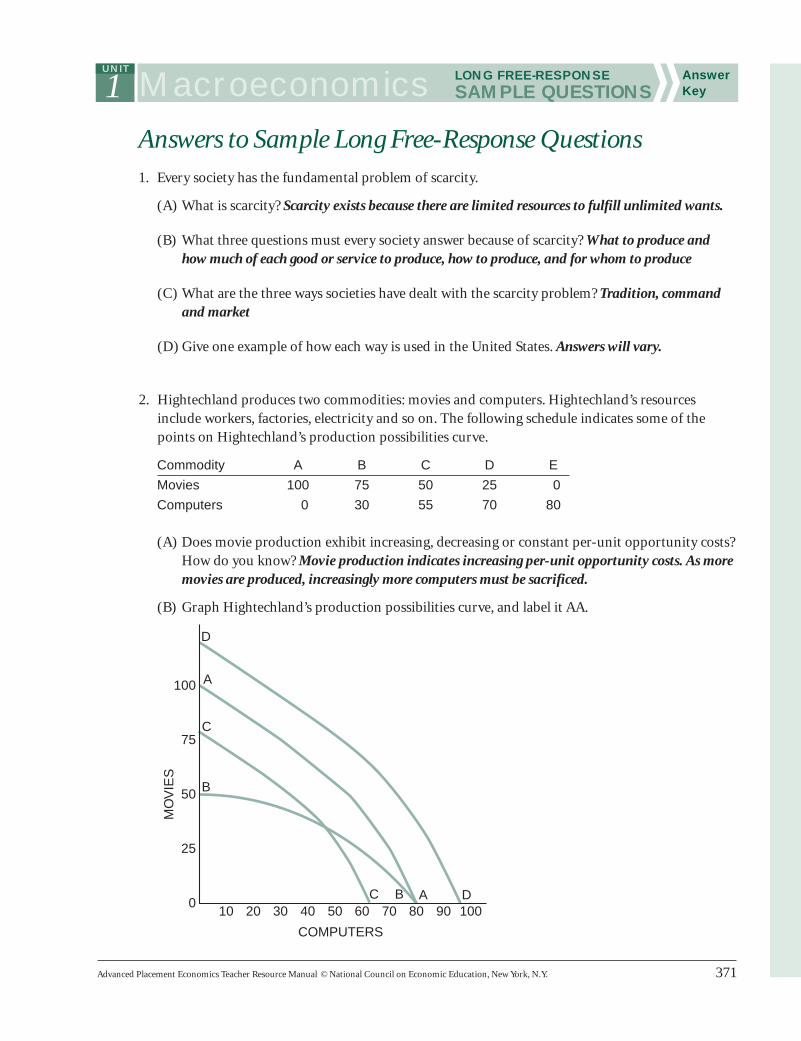
2. Hightechland produces two commodities: movies and computers. Hightechland’s resourcesinclude workers, factories, electricity and so on. The following schedule indicates some of thepoints on Hightechland’s production possibilities curve.
Commodity A B C D E
Movies 100 75 50 25 0
Computers 0 30 55 70 80
(A) Does movie production exhibit increasing, decreasing or constant per-unit opportunity costs?How do you know? Movie production indicates increasing per-unit opportunity costs. As moremovies are produced, increasingly more computers must be sacrificed.
(B) Graph Hightechland’s production possibilities curve, and label it AA.
100
25
50
75
B
C
A
D
100
20 30 40 50
COMPUTERS
60 70 80 90 100
MO
VIE
S
DAC B
1 Macroeconomics LONG FREE-RESPONSESAMPLE QUESTIONS
(C) Suppose Hightechland is operating at Point C but would like to alter production to Point D.What would be the per-unit opportunity cost of producing more computers? With a movefrom Point C to Point D, the per-unit opportunity cost of producing one additional computer is1 2/3 movies.
(D) Suppose Hightechland is operating at Point C but would like to alter production to Point B.What would be the per-unit opportunity cost of producing more movies? The per-unit oppor-tunity cost of producing one more movie as we alter the production from Point C to Point B isone computer.
(E) What will happen to Hightechland’s production possibilities curve if many of its movie setsare destroyed by fire? (Assume that the sets are not used in the production of computers.)Using the same graph you drew for Question 2(B), draw Hightechland’s new production pos-sibilities curve and label it BB. The point on the axis will shift inward for the movieproduction, but the point on the axis corresponding to computer production will not change.
(F) What will happen to Hightechland’s production possibilities curve if all the country’sresources are reduced (perhaps by natural disaster or war)? Using the same graph as inQuestion 2(B), draw Hightechland’s new production possibilities curve and label it CC.Shift the production possibilities curve to the left or inward.
(G) What will happen to Hightechland’s production possibilities curve if technology improvesboth the production of movies and the production of computers? Using the same graph as inQuestion 2(B), draw Hightechland’s new production possibilities curve and label it DD.Shift the production possibilities curve to the right or outward.
1 Macroeconomics LONG FREE-RESPONSESAMPLE QUESTIONS
3. The market for many commodities is seasonal in nature. Their sales (equilibrium quantity)increase dramatically during certain times of the year. Christmas cards and fresh strawberries, atleast in the North, are two examples. Christmas card sales increase during the last three months ofthe year, and the sales of fresh strawberries in the North increase during the summer months. Butthe (equilibrium) price movement of these two commodities is quite different during their peaksales season: Christmas cards increase in price during the last three months of the year, whereasstrawberries decrease in price during the summer.
(A) Show on the graph below how there can be an increase in the equilibrium quantity and anincrease in the equilibrium price of Christmas cards during the last three months of the year,and briefly explain what has happened.
With other things constant, there is an increase in the demand for Christmas cards in the lastthree months of the year. This causes a rightward shift of demand and causes the price andquantity sold to increase.
(B) Change the graph below for fresh strawberries in the North to show how there can be anincrease in the equilibrium quantity and a decrease in the equilibrium price of strawberries inthe summer, and briefly explain what has happened.
Other things constant, there is an increase in the supply for fresh strawberries in the northernareas of the United States in the warmer months when the berries are harvested in the northernareas. This causes a rightward shift in the supply curve and causes the price to fall and thequantity sold to increase.
1 Macroeconomics LONG FREE-RESPONSESAMPLE QUESTIONS
4. Explain how each of the following may affect the production possibilities curve of the UnitedStates or the point at which the economy is operating. Draw a production possibilities curve; put“Capital Goods” on the vertical axis and “Consumer Goods” on the horizontal axis. Now, add aPPC curve or point to the graph to illustrate each scenario.
(A) The Congress and the presidentdecide to provide more funding forhigher education with more studentsattending college and graduating.More education increases humancapital, a resource, and moves thecurve outward.
(B) New advances in medicine allow fora healthier lifestyle. Better medicineimproves human capital, a resource,and moves the curve outward.
(C) The United States agrees to be a partof a world-trade agreement that willfoster international trade. Interna-tional trade increases output becauseof the law of comparative advantageand moves the curve outward.
1 Macroeconomics LONG FREE-RESPONSESAMPLE QUESTIONS
(D) The unemployment rate increases inthe economy from 4.2 percent to 5.1percent of the labor force. The increasein the unemployment rate results inunderemployed resources, which is illus-trated by a point inside the curve. Theresources (workers) are still availablebut are not being employed.
(E) Computer viruses are out of control,and efficiency and output in theeconomy fall. The computer virusestake computers out of commission,which shifts the curve inward.
1 Macroeconomics LONG FREE-RESPONSESAMPLE QUESTIONS
Unit OverviewUnit 2 introduces the students to the goals of macroeconomic policies and the basic definitions ofmacroeconomic terms and explains how macroeconomics affects people’s lives. The College Boardattempts to have 8 percent to 12 percent of the Advanced Placement Examination based on this unit.A student’s understanding of the definitions of macroeconomic terms is essential for the analysis thatcomes in Units 3 through 6. Without an understanding of the definitions and goals of macroeconom-ic policies, the students cannot analyze the effects of different policies.
There are some critical points to be made in this unit. The AP Examination will probably never askthe students to calculate gross domestic product, net national product and the other national incomeaccounting concepts. Still, the students should know what is included in national income accountingconcepts, what is not and why. They need to know the relationships to understand other key conceptssuch as aggregate expenditures and the impact of changes in taxes on gross domestic product. Thestudents should also be able to explain
■ why there is unemployment at full employment,
■ the difference between a price level and inflation,
■ how price indexes are computed and
■ the difference between fluctuations in output and long-term economic growth.
The Lesson PlannerLesson 1 defines macroeconomics and describes the main components of the economy and their
interaction. It uses Activities 9 and 10 and Visuals 2.1, 2.2 and 2.3.
Lesson 2 focuses on measuring key economic variables. It uses Activities 11 and 12 and Visual 2.4.
Lesson 3 addresses a key macroeconomic goal in looking at the effects of inflation and how a priceindex is created. It uses Activities 13, 14 and 15.
Lesson 4 delves into how unemployment, employment and labor-force participation are defined.This lesson uses Activity 16 and Visuals 2.5 and 2.6.
Lesson 5 looks at the business cycle and pulls together all the concepts about economic growth, infla-tion and unemployment. It uses Activities 17 and 18 and Visual 2.7.


![PARENTHESES – {[( )]} EXPONENTS MULTIPLICATION or...P E MD AS ORDER OF OPERATIONS AGREEMENT PARENTHESES – If there are grouping symbols (parentheses, brackets, braces – {[( )]},](https://static.documents.pub/doc/80x56/5fd4bc03baec9b7728292675/parentheses-a-exponents-multiplication-or-p-e-md-as-order-of-operations.jpg)


