45
Unit 3 Psychology 2022 Head Start Holiday Booklet Name: _________________________________

Unit 3 Psychology 2022
Head Start Holiday Booklet
Name: _________________________________

Welcome to Unit 3 and 4 Psychology
Remember Psychology is
“Psychology is a broad discipline that incorporates both the scientific study of human behaviour through biological, psychological and social perspectives and the systematic application of this knowledge to personal and social circumstances in everyday life.” VCAA 2017
To start I want to share the biggest 3 biggest lies VCE students tell themselves.
1. Subjects like Psychology or Health are the easy subjects. There is a common myth that some subjects are ‘easier’ than others because they are scaled down. Subjects like Psychology, Graphic Design and Physical Education are considered less strenuous than subjects like Physics and Specialist Maths. Some students take this to mean that these subjects are “easier,” that they don’t need to work as hard at these subjects to do well. This could not be further from the truth. A student studying Psychology not only has to contend with the inevitable scaling down of their study score, they also have to compete with the above-average number of students completing the subject. There is a great deal more content in Psychology, PE etc. than Specialist Maths. The good news is that the higher a student’s study score in these subjects, the less it gets scaled down. A 50 in Psychology stays a 50. That is not easy, but it is worth aiming for.
2. My SAC scores don’t matter as long as I do well on the exam.
I have heard this one many times. A student, unwilling to work hard on their SACs throughout the year, reassures themselves that, come exam time, they will make up for their poor performance with a last minute display of genius. This is dangerous thinking for two reasons.
Firstly, SACS actually do matter very much. The SACs given throughout the year are used to rank the students in each class. Based on this ranking, the study scores for each of their subjects may go up or down. A low ranking student who does well on the exam might actually get a lower study score than a high-ranking student who does slightly worse on the exam! Secondly, studying for SACs is a great way of practising the valuable study skills required to achieve success on the final exam. After all, who do you think will be able to study better: a student who has cruised through the year, or one who has diligently studied and revised their notes for every single one of their assessments?
3. I can’t start studying for my exam yet. Yes you can! Yes! Start now! It is never too early to start studying for an exam. Students who leave their exam study for SWOT VAC are doomed to a week of panic and confusion. Students who want to be successful will spend their entire year developing revision sheets, refining their notes and attempting exam questions. You can usually find exam questions online. There is no excuse not to be practicing. You need to be going over each of your SACs with a magnifying glass and making sure you learn all the skills and keep all the necessary resources required to be as prepared as possible come November. VCE is not a sprint to the finish; it is a marathon, a long haul, and the sooner students start applying themselves to the challenge, the more successful they will be.
Materials you will need
Edrolo Textbook and Online Access- Kristy Kendall principal of Toorak College and long-time teacher of Psychology and assessor is a guru, a Psychology influencer greater than a Kardashian or Jenner. The times where you cannot pick up a pen to take notes or write an answer –watch her videos like you are on a Netflix binge.
Study Design - this is your bible if you have not been taught something here your teacher is not doing their job…it is your checklist as the exam and SACs are based on its content. VCAA the big kahunas of VCE have the study design here –
https://www.vcaa.vic.edu.au/Documents/vce/psychology/2016PsychologySD.pdf
You must the following pages in the holidays- 11-13, 24-34
Other Texts – we will speak of these in class – you cannot just access one text it you have to look at many different texts. You are not required to purchase them
Past Exams – VCAA the ‘government of VCE’ have past exams here –

Before starting the holiday homework consider these questions.
Homework and Study – knowing the difference is the key to success!!!
Can you be autonomous?- look it up
Can you be an active learner and independent thinker?
How can you maximise your time in the classroom with homework?
How much is enough? Too much? Find the balance!
What will be the key to my success?
Folio of annotated activities
The annotated folio is a collection of the work that you will be required to complete throughout this unit
• You will need to ensure that you complete all activities.
• Make sure you label the activities clearly.
• You will also need to ensure that the work you complete is effectively organised in your folder – it is to be submitted and reviewed periodically after an activity is undertaken in class.
The folio is used to demonstrate progression in your learning and to authenticate the work is yours!
Plagiarism can cost you an entire Unit in VCE, it a very expensive hack that no one can afford!
SD: Work related to the outcomes of each unit will be accepted only if the teacher can attest that, to the best of their knowledge, all unacknowledged work is the student’s own.

Research Methods
It is important to remember that Psychology is a science – we conduct experiments and research. A common definition is the following
A procedure for the formulation and evaluation of hypotheses that is intended to reveal relationships between variables and provide an understanding of the phenomenon under investigation.
The table below sets out the process of undertaking an experiment and all the terms you must know
The scientific method
Variables Operational definitions Forming a hypothesis Controlling extraneous variables Participant selection
Participant allocation – experimental and control groups
Random allocation
Experimental designs Repeated measures design Matched participants design Independent groups design Twin and adoption studies
Controlling placebo and experimenter effect Placebo effect Experimenter effect
Collecting data Types of data
Data collection
Observation Interview Questionnaires Psychological tests: personality or multiple-choice IQ tests Technology in data collection
Cross-sectional studies Longitudinal studies Developmental research designs
Longitudinal design Cross-sectional design Sequential design
The quality of research: reliability and validity Reliability Validity
Drawing conclusions from research statistics
Descriptive statistics The normal curve Inferring from data Appropriateness of conclusions and generalisations based on results
Measures of relationship correlational studies Ethical considerations in psychological research
The role of the ethics committee National Health and Medical Research Council

Using the pages from the Edrolo text, complete the following activities
Participant Selection and Allocation
The process of selecting participants is call ____________________________.
Once you have your participants for the study, they are a ______________________ group from a larger group, and they will be used to represent the population from which they were taken.
The term population refers to
______________________________________________________________________________________________________________________________________________________________________________
What is the difference between a population and a sample?
____________________________________________________________________________________________________________________________________________________________________________________________________________________________________________________________________________________________________________________________________________________________
There are different forms of sampling, these include
- Random sampling - Stratified sampling
Briefly explain each and identify the purpose of each, and their main advantages. __________________________________________________________________________________________________________________________________________________________________________________________________________________________________________________________________________________________________________________________________________________________________________________________________________________________________________________________________________________________________________________________________________
If everyone in the target population does not have an equal chance of being selected to participate, this is known as a ______________________________________________

Once you have your participants selected for your experiment, there are two groups which they should be allocated to.
Control group (IV absent) Experimental group (IV present)
The Individual Variable is
________________________________________________________________________________________________________________________________________________________________________
The dependent variable is ________________________________________________________________________________________________________________________________________________________________________
Which group is the IV applied to; explain why. ___________________________________________________________________________________________________________________________________________________________________________________________________________________________________________________________________________________________________________________________________________________________________________________________________________________________________________________ What is the usual method used to allocated participants to a group? What is the purpose of this method and why would most experimental designs use this method? __________________________________________________________________________________________________________________________________________________________________________________________________________________________________________________________________________________________________________________________________________________________________________________________________________________________________________________________________________________________________________________________________________ What is the difference between participant selection and participant allocation? Identify and explain the techniques used for Qualitative and Quantitative data collection.
The effects!
What is the placebo effect? How could an experimenter ensure the placebo effect would not affect their results? ___________________________________________________________________________________________________________________________________________________________________________________________________________________________________________________________________________________________________________________________________________________________________________________________________________________________________________________

What is the experimenter effect? _____________________________________________________________________________________________________________________________________________________________________________________________________________________________________________________________________ What is the order effect? When does it occur? _____________________________________________________________________________________________________________________________________________________________________________________________________________________________________________________________________ What is counterbalancing and when would it be used? What does it safeguard against? ____________________________________________________________________________________________________________________________________________________________________________________________________________________________________________________________________________________________________________________________________________________________ Experimental Designs and procedures (single-blind and double-blind procedures; what are they used for?) ____________________________________________________________________________________________________________________________________________________________________________________________________________________________________________________________________________________________________________________________________________________________ What is a variable and what are the different types of variables (be able to differentiate between them). Also, identify the difference between extraneous and confounding variables. ______________________________________________________________________________________________________________________________________________________________________________________________________________________________________________________________________________________________________________________________________________________________________________________________________________________________________________________________________________________________________________________________________________________________________________________________________________________________________________________________________________________________________________________________________________________________________________________________________________________________________________________________________________________________________ ______________________________________________________________________________________________________________________________________________________________________________

Introduction to research 4.3.1.1
overview
Research in the field of psychology is conducted in line with the scientific method. This involves conducting experiments to test hypotheses in order to either validate or counter them.
theory details
Modern psychology is studied as a science. This means that psychologists use the scientific method in order to study psychological phenomena. The scientific method involves developing testable predictions that scientists can test through carefully controlled and planned experiments in order to validate or invalidate them. Through these experiments, scientists collect empirical evidence and draw conclusions, contributing to the wider understanding of psychological phenomena.
In this chapter, you will be learning about research methodology in psychology, and will begin to develop the scientific skills required to conduct your own experiment. You will continue to build upon these skills throughout the VCE Psychology course, and apply these skills to different psychological concepts.
1A AIMS, HYPOTHESES AND VARIABLES
Operationalisingvariables 4.3.1.4
Aims, hypotheses and variables
Introduction toresearch 4.3.1.1
Aims and hypotheses 4.3.1.2
Independent and dependent variables 4.3.1.3
In this lesson, you will start looking at research methods and the scientific skills that you will need to conduct experiments. Specifically, looking at how to develop aims and hypotheses, with a focus on identifying and operationalising variables.
1A. Aims, hypotheses and variables
1B. Scientific research methodologies
1C. Population, sample and sampling
1D. Sources of error and prevention
1E. Ethical considerations
1F. Collection of data
1G. Data organisation and interpretation
1H. Evaluation of research
Study design dot point
• independent and dependent variables and operationalisation of variables
Key science skills
• develop aims and questions, formulate hypotheses and make predictions:
– determine aims, research hypotheses, questions and predictions that can be tested
– identify and operationalise independent and dependent variables
• analyse and evaluate data, methods and scientific models:
– distinguish between scientific and non-scientific ideas
Key knowledge units
Introduction to research 4.3.1.1
Aims and hypotheses 4.3.1.2
Independent and dependent variables 4.3.1.3
Operationalising variables 4.3.1.4
2
This document is intended for Marita Elvish at Hallam Senior College (user ID: 1444347). Unauthorisedcirculation in any form is not permitted.
In this chapter, you will learn about the research methods involved in psychological research in order to conduct your own experiment and apply this knowledge to different areas of the course. In this lesson, you will begin by looking at aims, hypotheses and variables: the foundations for conducting a research experiment.
Theory
Hypothesis
Research
Observation
Create or modify the theory
Use the theory to form a hypothesis
Design a study to test the hypothesis
Perform the research
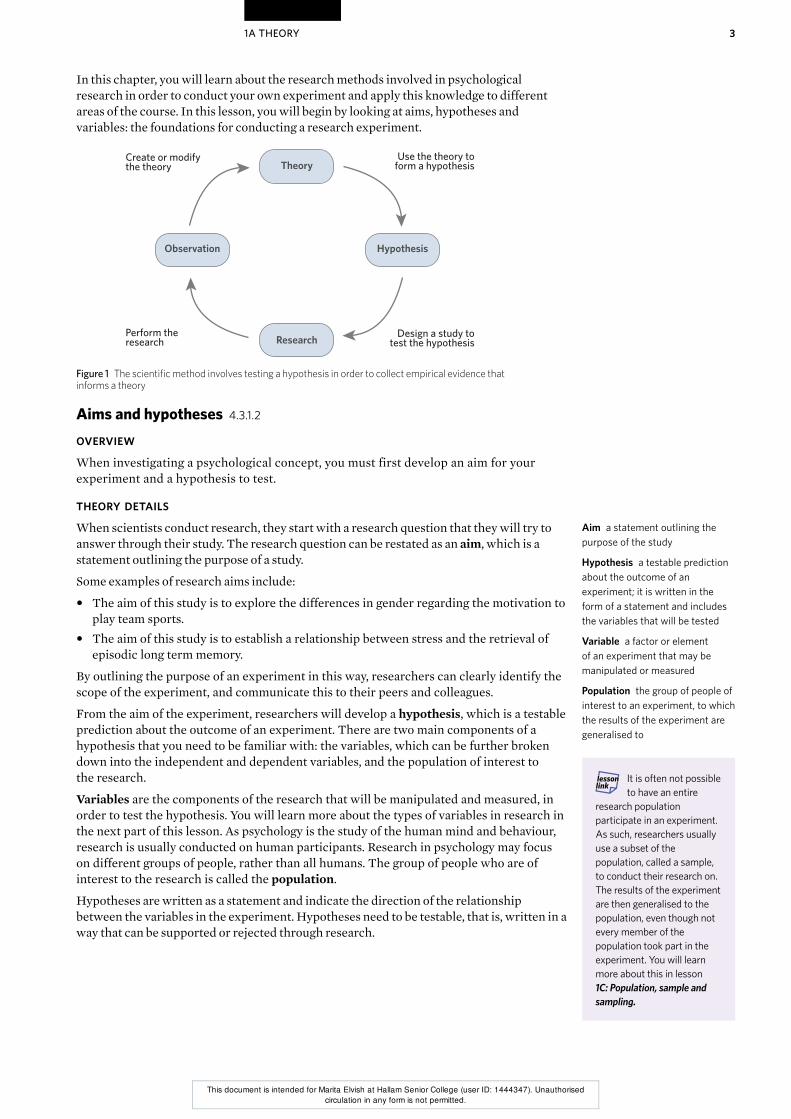
Figure 1 The scientific method involves testing a hypothesis in order to collect empirical evidence that informs a theory
Aims and hypotheses 4.3.1.2
overview
When investigating a psychological concept, you must first develop an aim for your experiment and a hypothesis to test.
theory details
When scientists conduct research, they start with a research question that they will try to answer through their study. The research question can be restated as an aim, which is a statement outlining the purpose of a study.
Some examples of research aims include:
• The aim of this study is to explore the differences in gender regarding the motivation to play team sports.
• The aim of this study is to establish a relationship between stress and the retrieval of episodic long term memory.
By outlining the purpose of an experiment in this way, researchers can clearly identify the scope of the experiment, and communicate this to their peers and colleagues.
From the aim of the experiment, researchers will develop a hypothesis, which is a testable prediction about the outcome of an experiment. There are two main components of a hypothesis that you need to be familiar with: the variables, which can be further broken down into the independent and dependent variables, and the population of interest to the research.
Variables are the components of the research that will be manipulated and measured, in order to test the hypothesis. You will learn more about the types of variables in research in the next part of this lesson. As psychology is the study of the human mind and behaviour, research is usually conducted on human participants. Research in psychology may focus on different groups of people, rather than all humans. The group of people who are of interest to the research is called the population.
Hypotheses are written as a statement and indicate the direction of the relationship between the variables in the experiment. Hypotheses need to be testable, that is, written in a way that can be supported or rejected through research.
Aim a statement outlining the purpose of the study
Hypothesis a testable prediction about the outcome of an experiment; it is written in the form of a statement and includes the variables that will be tested
Variable a factor or element of an experiment that may be manipulated or measured
Population the group of people of interest to an experiment, to which the results of the experiment are generalised to
It is often not possible to have an entire
research population participate in an experiment. As such, researchers usually use a subset of the population, called a sample, to conduct their research on. The results of the experiment are then generalised to the population, even though not every member of the population took part in the experiment. You will learn more about this in lesson 1C: Population, sample and sampling.
1A THEORY 3
This document is intended for Marita Elvish at Hallam Senior College (user ID: 1444347). Unauthorisedcirculation in any form is not permitted.

Some examples of hypotheses include:
• It was hypothesised that males will report higher levels of motivation to play team sports than females.
• It was hypothesised that people who experience high levels of distress are less likely to be able to recall specific episodic long term memories than people with low levels of distress.
Useful tip
It is important to remember that hypotheses are written in the form of a statement. One way to structure your hypotheses is to start it with the following phrase "it was hypothesised that...". Using this phrase will ensure that your hypothesis is written as a statement, and not a question.
Useful tip
The things you need to include in your hypothesis are:
• The variables (independent and dependent)• The direction of your hypothesis
Although it is not necessary to include the population of the study in your hypothesis, you won’t lose marks if you choose to include it.
One way of remembering these components is with the acronym iPaD standing for:
• Independent variable • Population • and • Dependent variable.
Independent and dependent variables 4.3.1.3
overview
In scientific experiments, researchers try to establish a causal relationship between two variables. These variables are the independent variable and the dependent variable.
theory details
A key component of the scientific method is that a theory is tested in a carefully controlled environment in order to collect empirical data, that is, data that has been collected through either observation or experimentation. One way of controlling the environment is through the manipulation and measurement of variables.
In an experiment,
• the independent variable (IV) is the variable that is manipulated in order to see the effects it has on the dependent variable.
• the dependent variable (DV) is the variable that is then measured, to see if it was affected by a change in the independent variable. That is, it is dependent (reliant upon) on the independent variable.
For example, a researcher wanting to test the effect of caffeine consumption on concentration may manipulate how much caffeine participants consume (the independent variable) and then measure if this affected participants’ ability to concentrate (the dependent variable). By carefully controlling, manipulating and measuring variables in this way, researchers can either confirm or reject their hypothesis and contribute to the wider body of psychological knowledge and understanding.
Independent variable (IV) the variable that the experimenter manipulates in order to observe the effect it causes on the dependent variable
Dependent variable (DV) the variable that is being measured in an experiment for changes it experiences due to the independent variable
Have you ever seen those big old TVs from the 80s and 90s? They have antennas on top of them
that, when moved, affects what appears on the screen.
One way of remembering independent and dependent variables is by thinking of an "IV DV TV". The independent variable (IV) is like the antenna on top of the TV: experimenters modify the IV in order to see the effect that it has on the dependent variable (DV) (the image that appears on the TV screen).
DVIV
Another way of remembering the
IV and DV is through m&m:
• IV is manipulated to cause an effect
• DV is measured for a change that has occurred
Image: Roman Samokhin/Shutterstock.com
CHApTER 1: SCiEnCE SkillS And RESEARCH mETHOdS4
This document is intended for Marita Elvish at Hallam Senior College (user ID: 1444347). Unauthorisedcirculation in any form is not permitted.
Want to know more?
In this lesson, you have learned about two types of hypotheses: research hypotheses and operationalised hypotheses. There is a third type of hypothesis called a 'null hypothesis' which is a type of hypothesis where the prediction is that there will be no difference between the two groups.
Operationalising variables 4.3.1.4
overview
Operationalising variables involves defining precisely how they will be manipulated and measured, specific to the experiment.
theory details
When deciding upon the variables that need to be manipulated and measured, researchers also need to decide upon how this will be done. It is necessary for researchers to define the variables to this level of detail, as often the psychological concepts in research are broad and can be manipulated and measured in many different ways.
In the previous example, wherein the researcher wants to test the effects of caffeine consumption on concentration, there are many ways that the consumption of caffeine can be manipulated (number and types of coffees participants have consumed, number and types of soft drinks participants have consumed, a measure of caffeine concentration in participant’s blood) and there are a number of ways that concentration can be measured (through the use of eye tracking on a task, reaction times).
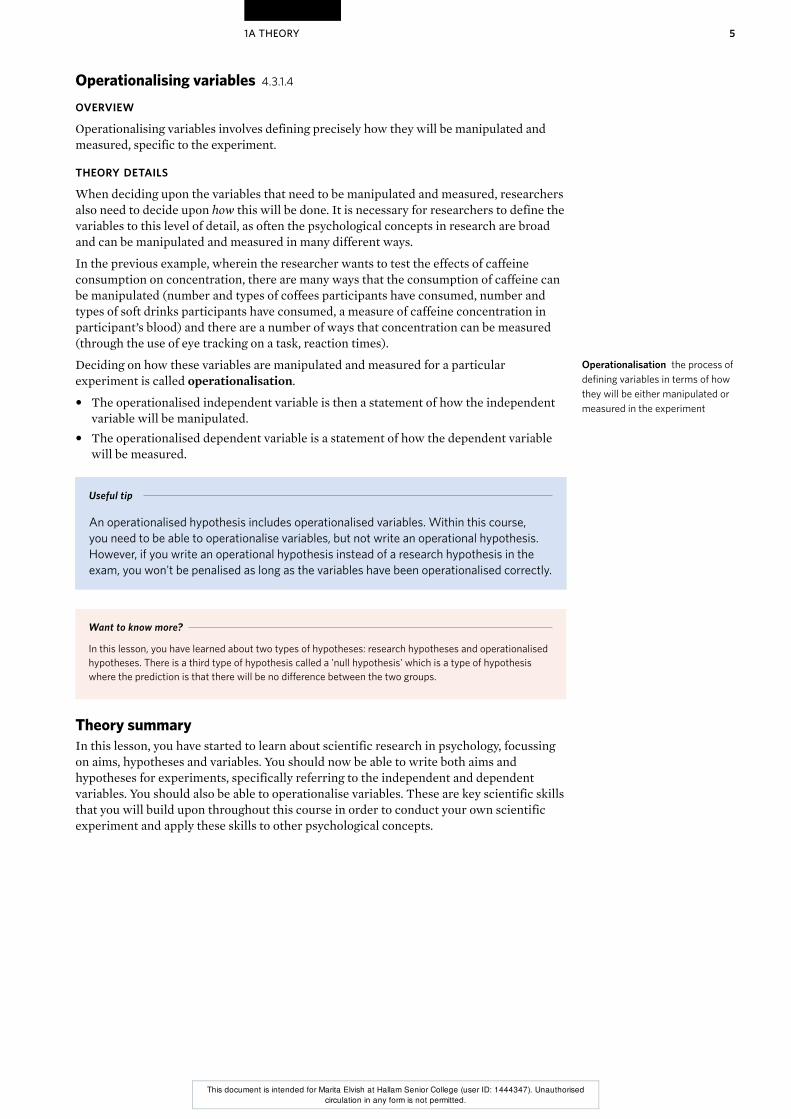
Deciding on how these variables are manipulated and measured for a particular experiment is called operationalisation.
• The operationalised independent variable is then a statement of how the independent variable will be manipulated.
• The operationalised dependent variable is a statement of how the dependent variable will be measured.
Theory summaryIn this lesson, you have started to learn about scientific research in psychology, focussing on aims, hypotheses and variables. You should now be able to write both aims and hypotheses for experiments, specifically referring to the independent and dependent variables. You should also be able to operationalise variables. These are key scientific skills that you will build upon throughout this course in order to conduct your own scientific experiment and apply these skills to other psychological concepts.
Operationalisation the process of defining variables in terms of how they will be either manipulated or measured in the experiment
Useful tip
An operationalised hypothesis includes operationalised variables. Within this course, you need to be able to operationalise variables, but not write an operational hypothesis. However, if you write an operational hypothesis instead of a research hypothesis in the exam, you won't be penalised as long as the variables have been operationalised correctly.
1A THEORY 5
This document is intended for Marita Elvish at Hallam Senior College (user ID: 1444347). Unauthorisedcirculation in any form is not permitted.

So far in this chapter, you have learned about research aims, hypotheses and variables. Once a researcher knows what area of research they want to study, they must then decide how they will conduct their research in order to obtain the most accurate and useful results. In this lesson, you will learn about different scientific research methodologies that can be used, and how researchers weigh up the benefits and limitations of each in deciding which one to use.
1B SCIENTIFIC RESEARCH METHODOLOGIES
Experimental research designs 4.3.3.2
Scientific research methodologies
Independent groups design 4.3.3.2.1
Repeated measures design 4.3.3.2.2
Matched participants design 4.3.3.2.3
Types of investigations 4.3.3.1
Self-reports 4.3.3.1.2
Interviews 4.3.3.1.4
Observational studies4.3.3.1.6
Longitudinal studies4.3.3.1.8
Cross-sectionalstudies4.3.3.1.9
Experiments 4.3.3.1.1
Questionnaires4.3.3.1.3
Rating scales4.3.3.1.5
Case studies 4.3.3.1.7
1A. Aims, hypotheses and variables
1B. Scientific research methodologies
1C. Population, sample and sampling
1D. Sources of error and prevention
1E. Ethical considerations
1F. Collection of data
1G. Data organisation and interpretation
1H. Evaluation of research
Study design dot point
• the characteristics of scientific research methodologies and techniques of primary qualitative and quantitative data collection relevant to the selected investigation: experiments, self-reports,
questionnaires, interviews and/or use of rating scales; reliability and validity of data; and minimisation of experimental bias and confounding and extraneous variables
Key science skills
• Plan and undertake investigations:
– determine appropriate type of investigation: experiments (including use of control and experimental groups); case studies; observational studies; self-reports; questionnaires; interviews; rating
scales; access secondary data, including data sourced through the internet that would otherwise be difficult to source as raw or primary data through fieldwork, a laboratory or a classroom
– use an appropriate experimental research design including independent groups, matched participants, repeated measures and cross-sectional studies
Key knowledge units
Experiments (Types of investigations) 4.3.3.1.1
Self-reports (Types of investigations) 4.3.3.1.2
Questionnaires (Types of investigations) 4.3.3.1.3
Interviews (Types of investigations) 4.3.3.1.4
Rating scales (Types of investigations) 4.3.3.1.5
Observational studies (Types of investigations) 4.3.3.1.6
Case studies (Types of investigations) 4.3.3.1.7
Longitudinal studies (Types of investigations) 4.3.3.1.8
Cross-sectional studies (Types of investigations) 4.3.3.1.9
Independent group design (Experimental research designs) 4.3.3.2.1
Repeated measures design (Experimental research designs) 4.3.3.2.2
Matched participants design (Experimental research designs) 4.3.3.2.3
In this lesson, you will be learning about different scientific research methodologies. You will be learning about different types of investigations that can be conducted, including experiments, case studies, observational studies, self-reports, questionnaires, interviews and rating scales. You will focus on experimental research designs, looking at the different ways in which a researcher can set up their experiments. You will also be looking at the benefits and limitations of each of these methodologies.
8
This document is intended for Marita Elvish at Hallam Senior College (user ID: 1444347). Unauthorisedcirculation in any form is not permitted.

Types of investigations 4.3.3.1
overview
There are many different types of investigations that a researcher can conduct in order to collect data for their study. In this section you will learn about the different types of scientific investigations researchers can choose from, as well as the benefits and limitations of each.
theory details
In the previous lesson, you learned about how researchers formulate an aim and hypothesis for an area of research that they are interested in. Once these and the variables of interest are decided upon, researchers must then choose the type of investigation they want to conduct. You may have encountered different research methodology before, such as participating in an experiment yourself or filling out a questionnaire. Each form of investigation has its own strengths and limitations. Choosing what type of investigation you want to conduct depends on the hypothesis you are trying to test, and the type of data that you want to collect.
Table 1 outlines the scientific research methodologies (different types of scientific investigations) you need to be familiar with for this course. Each of these methodologies follow the scientific method in order to obtain empirical data.
Table 1 Types of research methodologies
Research methodology Description Example
Experiments 4.3.3.1.1 An experiment measures a cause and effect relationship between variables within a controlled setting.
• A researcher is interested in the effect of dogs on self-reported happiness.
• They set up an experiment within a controlled setting, where one group of participants played with a dog for five minutes before completing a questionnaire assessing their level of happiness.
• Another group completed the questionnaire without playing with any dogs.
• The researcher then compared the results of the two groups.
Self-report 4.3.3.1.2 Self-report methodologies involve participants providing their own account of an experience. Therefore the data collected is subjective. Self-report data can be collected through a variety of means, including questionnaires, interviews and rating scales.
• At the end of your semester, you may fill in a questionnaire about how you felt about the class, the assignments that were set and your teacher.
• These are subjective reports of your experience of the class and are an example of a self-report.
Questionnaires (self-report) 4.3.3.1.3
Questionnaires are also known as surveys. They include a list of questions created by the researcher for participants to respond to. They can be administered in a variety of ways including paper-and-pencil questionnaires, electronic or online questionnaires. Questions can be open (in which participants write their response without constraints) or closed (in which participants choose from a predetermined list of responses).
• When you use a service online, you may be emailed a questionnaire afterwards asking for your response to questions about your experience.
• Open questions may include ‘do you have any feedback that you’d like to share with us?’.
• Closed questions may include ‘were you satisfied with the service provided?’ to which you could choose either ‘yes’ or ‘no’.
Interviews (self-report) 4.3.3.1.4
Interviews are usually conducted verbally, with the researcher asking questions of the participants and recording their responses. Interviews may come in many forms, and can be structured (involving a set of predetermined questions) or free-form (wherein the researcher may change, adapt or add questions during the interview).
• A policeman asks an eye-witness a series of questions about the events in the lead up to a crime.
• The responses the eye-witness provides may change the next question the policeman asks, reflecting that interviews can be free-form.
Experiment a study conducted in a carefully controlled environment to measure the cause and effect relationship between variables
Self-report a participant’s subjective account of an experience; this type of investigation can be conducted through the use of a questionnaire, interview or rating scale
Questionnaire (also known as surveys) a list of questions that participants can respond to in a variety of formats
Interview a type of questionnaire that is usually conducted verbally, involving the researcher asking participants questions and recording their responses
1B THEORY 9
This document is intended for Marita Elvish at Hallam Senior College (user ID: 1444347). Unauthorisedcirculation in any form is not permitted.

Table 1 Types of research methodologies
Research methodology Description Example
Rating scales (self-report) 4.3.3.1.5
Rating scales are a form of self-report in which participants give a numerical score on a scale to indicate their response to a set of questions.
• The rating out of five stars that you give your Uber driver after completing a trip is an example of a rating scale.
Observational studies 4.3.3.1.6
An observational study is when behaviour is observed and recorded by the researcher. This can be preferable to using self-report when researching concepts in which there may be a discrepancy between participants’ responses and their actions.
• A researcher is interested in whether people will help a distressed person in a public space.
• They set up a situation where a confederate (a person who is secretly a part of the experiment) falls and appears to be unconscious.
• The researcher observes the actions of the people around the confederate and records how many people attend to them.
• This may provide more accurate results than a self-report, wherein the participants response is influenced by how they believe or wish they would respond.
Case studies 4.3.3.1.7 Case studies involve focussing on one person or just a few individuals, looking at the variables relevant to the study in detail.
Data can be collected in many formats (subjective self-report data, objective quantitative data) and from many different sources (through interviews, medical records, observation).
Case studies are used when large sample sizes are not easily obtainable, or the phenomena being studied is rare or difficult to replicate. This is often the case when participants have a rare condition of interest to a researcher.
• The case study of Phineas Gage may be one that you are familiar with.
• Phineas was a railway worker who survived being impaled by a metal rod through his frontal lobe.
• His case study helped psychologists to understand the functions of the frontal lobe.
Longitudinal studies 4.3.3.1.8
A longitudinal study gathers data from the same participants over an extended time period in order to see differences or changes in specific variables over time.
• The ‘Up’ documentary series is an example of a longitudinal study in which data was collected from fourteen British children every seven years, beginning in 1964 when they were seven years old.
• The study followed up every seven years and the latest instalment in the series, 63 up, was released in 2019.
Cross-sectional studies 4.3.3.1.9
Cross-sectional studies involve a researcher measuring different variables in a population at a single point in time. Often, this involves gathering data from groups of participants of different ages (called cohorts) in order to compare trends in different age groups in an efficient manner, rather than performing a longitudinal study spanning decades. This provides a ‘snapshot’ of data of a specific point in time.
• A researcher is interested in the dietary habits of different age groups.
• They study a group of people in their 20s and compare them to groups of people in their 30s and a group of 40 year-old individuals.
Rating scale a form of questionnaire collecting numerical data from participants’ responses
Observational study a type of study in which data is collected through careful monitoring of participants
Case study an in-depth study of an individual or a group of individuals
Longitudinal study a type of investigation in which data is gathered from participants over an extended period of time, and the participants are followed up after specific time intervals
Cross-sectional study when data is collected from participants from different segments of the population (pre-existing cohorts) to represent a ‘snapshot’ in time
Want to know more?
Strongly disagree Disagree Neutral Agree Strongly agreeFigure 1 Example of a Likert scale
A common type of rating scale that you may have seen before is called the Likert scale.
The Likert scale asks participants to respond to statements with ‘strongly disagree, disagree, neutral, agree or strongly agree’ and assigns a numerical value (such as a value of 1-5) for each of these responses in order to obtain quantitative data that can be easily measured and compared.
CHApTER 1: SCiEnCE SkillS And RESEARCH mETHOdS10
This document is intended for Marita Elvish at Hallam Senior College (user ID: 1444347). Unauthorisedcirculation in any form is not permitted.

Table 2 Benefits and limitations of different research methodologies
Research methodology Benefits Limitations
Experiments 4.3.3.1.1 • Variables can be carefully controlled, manipulated and measured so that a cause-effect relationship can be determined.
• Experiments can also be replicated by other researchers in order to ensure the reliability of the results.
• Despite being conducted in a carefully controlled environment, sometimes other variables (confounding variables) can still affect the dependent variable, invalidating the results.
• Depending on what is being studied, sometimes the variables aren’t easily manipulated or measured, or there are too many variables to do so accurately.
• Some phenomena cannot be measured in a controlled environment.
Self-report 4.3.3.1.2 • Self-reports are useful as some behaviours and opinions cannot be directly observed.
• Participant accounts of these through a self-report can allow researchers to obtain data they otherwise couldn’t access.
• The data collected is subjective data, which can be difficult to compare and analyse.
• People don’t always provide accurate responses. They may instead respond with what they think researchers would want, and so the validity of responses is difficult to establish.
Questionnaires (self-report) 4.3.3.1.3
• Questionnaires can often be completed in a short time frame and can administered in large numbers.
• Lots of data can be collected and can be easily compared between participants.
• The data collected may not be as detailed as other forms of investigation, such as in an interview, especially if closed questions are used.
Interviews (self-report) 4.3.3.1.4
• Researchers can obtain lots of qualitative data as responses are open.
• They can change/adapt questions as they go, dependent on the participants’ responses, allowing for a more holistic understanding of the participants’ experience.
• Interviews can be time-consuming and costly to conduct for large samples.
• It is difficult to ensure standardised procedures for each participant, especially if there are multiple interviewers, and as such error in the data collected can make it difficult to compare across participants.
Rating scales (self-report) 4.3.3.1.5
• Fixed responses on rating scales means that the data collected can be easily measured and compared.
• Without qualitative data in participants’ self-report, it is difficult for researchers to develop a holistic understanding of participants’ responses, such as understanding the motivation behind specific responses.
Observational studies 4.3.3.1.6
• Observational studies can allow researchers to collect data in a naturalistic setting so that the behaviours they observe are more representative of what would occur, rather than in a controlled experimental setting.
• Observational studies can also occur in controlled, laboratory settings, allowing the researcher to have an active involvement in the conditions of the setting and the procedures involved.
• Researchers are not required to manipulate variables or intervene with participant’s behaviours.
• It is difficult for researchers to establish a causal relationship between variables, because they are unable to intervene to manipulate variables.
• The interpretation and recording of data is subjective and therefore prone to experimenter bias.
Case studies 4.3.3.1.7 • Very detailed data can be collected, and researchers can gain a lot of insight into specific cases.
• This allows researchers to have a deeper understanding of the individual/s and the particular phenomenon being studied.
• Case studies only focus on an individual, or a small group of people, and as such it makes the findings of the case study difficult to generalise to a larger population.
• This is because the few people in the case study are not representative of a larger group of people.
Longitudinal studies 4.3.3.1.8
• A lot of detailed data can be collected about individuals over a long period of time.
• Data about long-term change can be collected whilst minimising participant variables, as it is the same participants that are followed up over the period of the study.
• Longitudinal studies can be expensive, as well as being difficult to conduct.
• Many extraneous variables are more difficult to control over the long period of the study.
Cross-sectional studies 4.3.3.1.9
• Data on long-term trends and changes over time can be collected in the short term.
• This type of study is more efficient and less costly than conducting a longitudinal study.
• There can be extraneous variables in the different cohorts (age groups) that aren’t related to age, such as different social or cultural experiences.
• This makes it difficult to make comparisons across the cohorts and come to valid conclusions based on the data collected.
Sometimes researchers use a range of different methods for one study. For example, a researcher may conduct a case study on migraines involving three individuals. As a part of this study, the researcher may conduct interviews with the participants, as well as asking participants to record a daily pain score using a rating scale. This rating scale may be a part of a larger questionnaire, in which participants also respond to questions about their subjective pain experience.
As seen in this example, researchers make decisions about what types of investigations they want to conduct based on the type of data they want to collect, and the benefits and limitations of each research method.
1B THEORY 11
This document is intended for Marita Elvish at Hallam Senior College (user ID: 1444347). Unauthorisedcirculation in any form is not permitted.

Experimental research designs 4.3.3.2
overview
A common type of investigation that is conducted by researchers are experiments. There are three types of experimental designs with which you need to be familiar: independent groups design, repeated measures design and matched participants design.
theory details
Experiments are commonly conducted as a means of research as researchers have more control over the variables and are more able to accurately manipulate and measure them when conducting the experiment. There are three types of experimental designs that you should be familiar with: independent groups design, repeated measures design and matched participants design. Each experimental design has its own strengths and limitations. Choosing the type of experimental design should depend on the phenomena you are interested in and the type of data you wish to collect. Table 3 outlines these different experimental designs.
In each of these experimental designs there are control and experimental groups:
• The control group serves as a baseline or ‘control’ for the experiment, as they are not exposed to the independent variable. The control group allows for the researcher to establish a causal relationship between the independent and dependent variable. It helps to validate that the changes to the dependent variable have resulted from the independent variable and not something else.
• The experimental groups are exposed to the independent variable in order to test the effect that it has. In experiments, there may be one or more experimental groups depending on the research that is being conducted.
The strengths and limitations of each experimental design are outlined in table 4.
Participants
Control group
Not exposed to the IV
Experimental group
Exposed to the IV
Table 3 Experimental research designs
Experimental design Description Diagram Example
Independent group design (between-group design) 4.3.3.2.1
Participants in the study are split through random allocation into two or more groups, as either:
• the control group (participants are not exposed to the IV) and one or more experimental groups (participants are exposed to the IV).
• two or more experimental groups (participants are exposed to variations of the IV).
• • A researcher is investigating the effects of listening to music on concentration.
• A coin is flipped between all participants in the sample to decide who is allocated to the control group (don’t listen to music while studying) and who is allocated to the experimental group (listen to music while studying).
Repeated measures design (within-groups design) 4.3.3.2.2
The same participants are in both the control and experimental condition, or both/all experimental conditions. They will participate in one condition first, and then the other/s.
• All participants study for one hour listening to music, and then study for another hour without music.
Matched participants design 4.3.3.2.3
Participants are matched based upon key characteristics relevant to the investigation, such as age, gender or height. Each pair is split between the control and experimental group, or between either experimental condition to ensure an even distribution of the characteristics for which they have been matched.
• Participants in the control and experimental conditions are matched based upon their age and previous SAC score before being allocated into either the music or non-music condition.
Control group a group that is used as a basis for comparison; participants are not exposed to the experimental condition/s (the IV)
Experimental group the group within an experiment that are exposed to experimental conditions (the IV)
Independent groups design (also known as between groups design) an experimental design in which participants are split into two or more groups; typically a control group and an experimental group/s
Repeated measures design (also known as within groups design) an experimental design in which the same participants are in every condition of the experiment
Matched participants design an experimental design in which participants are paired based upon relevant characteristics, whereupon one member of the pair is tested in one condition, and the other member is tested in the other
Figure 2 The control group are not exposed to the independent variable
Condition A Condition B
Condition A Condition B
Condition A Condition B
CHApTER 1: SCiEnCE SkillS And RESEARCH mETHOdS12
This document is intended for Marita Elvish at Hallam Senior College (user ID: 1444347). Unauthorisedcirculation in any form is not permitted.

Theory summary In this lesson, you have learned about different scientific research methodologies that researchers could use when conducting a study. Each methodology has its benefits and limitations. Researchers must consider these, as well as the type of data they are trying to collect, when deciding which methodology to use. You should now be able to explain each of these methodologies, and be able to distinguish between them.
Table 4 Strengths and limitations of different experimental design
Experimental design Strengths Limitations
Independent group design (between-group design) 4.3.3.2.1
• Efficient and cost effective, as participants do not need to be matched on relevant characteristics (matched participants) and the experiment does not need to be repeated (repeated measures).
• Participant differences can affect results, especially if it is a small sample.
Repeated measures design (within-groups design) 4.3.3.2.2
• Requires fewer participants, as each participant is involved in multiple groups.
• Eliminates participant differences between the control and experimental groups, as the same participants are in both conditions.
• Order effects may occur, due to the order in which participants partake in either the control or experimental conditions.
Matched participants design 4.3.3.2.3
• Decreases participant variables, as participants are matched upon relevant characteristics between the control and experimental groups.
• More time-consuming as characteristics relevant to the study must first be identified, and participants must be matched according to them.
• Could be more expensive to conduct the experiment, as there is an added step of identifying the characteristic and matching participants.
Want to know more?
Although all experiments require a control group, some research studies do not use them. This research is a quasi-experimental study as it is a method of investigation which lacks the power to reveal a cause-effect relationship between variables. For example, in an independent groups experimental design researching the effects of caffeine, there may be three experimental groups who are consuming different quantities of caffeine but no control group who aren’t consuming any caffeine.
Useful tip
For each research scenario, it is important to read the information provided carefully in order to understand the experimental design.
You will learn more about the limitations
of the different experimental research designs in lesson 1D: Sources of error and prevention, in which you will also learn about how the effects of these limitations can be minimised when designing an experiment.
1B QUESTIONSTheory review questions
Question 1
Match the key term from the lesson to the corresponding definition.
• Experiment• Self-report• Questionnaire• Interview
• Rating scale • Observational study• Case study• Longitudinal study
• Cross-sectional study• Independent groups design • Experimental group• Control group
• Repeated measures design• Matched participants
design
a An experimental design in which all participants participate in both the control and experimental conditions ___________b A type of questionnaire and self-report method in which participants respond to questions on a numerical
scale ___________c An investigation method in which researchers control, manipulate and measure variables in order to establish a cause and
effect relationship ___________d Within an experiment, the group of participants who are exposed to the independent variable ___________e A type of investigation in which researchers closely watch participants and record data based on what they
see ___________f A type of study that is conducted over an extended period of time, wherein the same participants are followed up
periodically throughout the length of the study ___________
1B THEORY 13
This document is intended for Marita Elvish at Hallam Senior College (user ID: 1444347). Unauthorisedcirculation in any form is not permitted.

So far in this chapter, you have started to learn about research methodology in psychology. You have learned about the scientific method and how to write aims and hypotheses, and decide what type of study to conduct. Now, you will learn about how researchers can recruit participants for psychological studies and the methods they use to ensure their results can be applied to the population of interest.
1C POPULATION, SAMPLE AND SAMPLING
Population, sample and sampling
Population and sample 4.3.3.3
Sampling procedures 4.3.3.4
Allocation 4.3.3.5
Convenience sampling 4.3.3.4.1
Random sampling 4.3.3.4.2
Stratified sampling 4.3.3.4.3
In this lesson, you will be learning about how researchers choose a sample from a population and the sampling techniques they can use. Specifically, you will learn about what ensures a representative sample is obtained, the sampling methods of random sampling, convenience sampling and stratified sampling, as well as the benefits and limitations of each.
1A. Aims, hypothesis and variables
1B. Scientific research methodologies
1C. Population, sample and samplings
1D. Sources of error and prevention
1E. Ethical considerations
1F. Collection of data
1G. Data organisation and interpretation
1H. Evaluation of research
Study design dot point
• the characteristics of scientific research methodologies and techniques of primary qualitative and quantitative data collection relevant to the selected investigation: experiments,
self-reports, questionnaires, interviews and/or use of rating scales; reliability and validity of data; and minimisation of experimental bias and confounding and extraneous variables
Key science skills
• Plan and undertake investigations:
– select appropriate sampling procedures for selection and allocation of participants including random sampling, stratified sampling, convenience sampling and random allocation of
participants to groups
Key knowledge units
Population and sample 4.3.3.3
Convenience sampling (Sampling procedures) 4.3.3.4.1
Random sampling (Sampling procedures) 4.3.3.4.2
Stratified sampling (Sampling procedures) 4.3.3.4.3
Allocation 4.3.3.5
Population and sample 4.3.3.3
overview
The field of psychology focuses on the human mind and behaviour. As such, studies in psychology differ from the other sciences in that most use human participants to investigate psychological phenomena. When conducting experiments with people, the concepts of population, sampling and samples and are important to consider to ensure that the extent to which the results of the experiment can be applied to the research population can be established.
16
This document is intended for Marita Elvish at Hallam Senior College (user ID: 1444347). Unauthorisedcirculation in any form is not permitted.

theory details
In an experiment, researchers try to discover trends or learn new information about a group of people. This group of people who are of interest to the study is called the population. However, it is not possible for everyone within the population that you are interested in to participate in the experiment. For example, you might be interested in studying trends in the Australian population, or the population of a specific high school. In both of these examples, the number of people in the population would exceed a researcher’s ability to conduct an experiment involving the entire population. As such, researchers work with a smaller group of people that are meant to represent the population. This subset of people is called the sample. An ideal sample of people should reflect the population in regards to characteristics that are relevant to the study, so that the results of the experiment can be generalised back to the population. This is called a representative sample, because the sample of participants represents the population accurately.
A representative sample is dependent on:
• The size of the sample: the larger the sample, the more likely it is to be representative of the population.
• Whether the sample is biased or unbiased.
• Whether the characteristics of participants relevant to the particular study (such as their age, gender and level of education) are represented in the sample in proportion to how they appear in the population.
Population
Sample
Image: Bakhtiar Zein/Shutterstock
Figure 1 The sample is a subset of the population of interest
Sampling procedures 4.3.3.4
overview
There are different procedures through which the sample for an experiment can be chosen. Each of these procedures has its own strengths and limitations, which should be weighed up when deciding which procedure to use for a particular experiment.
theory details
Sampling is the process of choosing the sample of people from the population for an experiment.
There are different methods of choosing these participants:
• Convenience sampling
• Random sampling
• Stratified sampling
These sampling procedures are summarised in table 1, and the benefits and limitations of each are summarised in table 2.
Population (also known as the research population) the group of interest to the study, from which the sample is drawn
Sample a subset of the population, commonly referred to as the research participants
Image: Bakhtiar Zein/Shutterstock.com
Sampling the process through which the participants for a study are selected from the population of interest
1C THEORY 17
This document is intended for Marita Elvish at Hallam Senior College (user ID: 1444347). Unauthorisedcirculation in any form is not permitted.

PopulationThe group of people who are of interest to the research, from which the sample is drawn
SampleA subset of the population who will participate in the study.
Conveniencesampling
Randomsampling
Stratifiedsampling
Population
Sample
Figure 2 There are three different methods to select the sample from the population
Table 1 Types of sampling methods
Sampling method Description Example
Convenience sampling 4.3.3.4.1 • A sample is selected in the quickest and easiest way possible by recruiting the most readily available people from the population.
• A researcher using her class of students as participants for a study.
• In this case, the participants were readily available and it was efficient and simple for her to recruit participants.
Random sampling 4.3.3.4.2 • A method of sampling in which every member of the population has an equal chance of being selected for the sample.
• A researcher is interested in conducting a study in which the population is all of the students at the local high school.
• She generates a list of all student names, based on enrolment records, and puts them through a random number generator in order to select 50 to participate in her experiment.
Stratified sampling 4.3.3.4.3 • This sampling method involves dividing the population into groups based on characteristics relevant to the study, such as gender, age or year level.
• These groups are called strata, and each group is called a stratum.
• The researcher then selects a sample from each of the strata in the same proportion that they occur in the population.
• A highschool population is divided into year levels.
• Participants are selected from each year level proportionate to the population.
• For example, if there are 100 year 12 students, but only 50 year 7 students, the number of participants from year 12 would be double that of the number of participants in year 7.
Table 2 Benefits and limitations of sampling methods
Sampling method Benefits Limitations
Convenience sampling • This method is time-efficient and cost-saving.
• It is likely that the sample selected is not representative of the population, which compromises the ability of a valid generalisation to the population about the results.
Random sampling • For very large samples, it reduces bias and therefore it is more likely to be representative of the population.
• It can be time-consuming and difficult to identify every member of the population in order to ensure everyone has an equal chance of participating.
• For smaller samples, it may not produce a representative sample.
Stratified sampling • It is more likely that the sample is representative of the population, as compared to convenience or random sampling.
• Strata (the groups within the population) can be difficult to define, depending on the research being conducted.
• It can be time-consuming and expensive to ensure the strata are defined accurately and that participants are selected in the correct proportions.
Useful tip
A common type of sampling in question scenarios is when the researcher puts an advertisement in a newspaper. This is an example of convenience sampling because not everyone in the population has an equal chance of being a part of the study; the people who are more likely to read the newspaper have a higher chance.
Useful tip
It is important to be careful with the terminology: convenience sampling is the correct term, you will not be awarded any marks for using the term “convenient sampling”.
Random sampling when every member of the population has an equal chance of being selected for the sample
Stratified sampling when the population is divided into groups based upon relevant characteristics, and participants are selected from each group in proportion to how they appear in the population
Convenience sampling when a sample is selected using the quickest and easiest means possible, selecting people who are readily available from the population
CHapTER 1: SCiEnCE SkillS and RESEaRCH mETHOdS18
This document is intended for Marita Elvish at Hallam Senior College (user ID: 1444347). Unauthorisedcirculation in any form is not permitted.

Allocation 4.3.3.5
overview
Once the participants for the experiment are selected, researchers must assign them to the different conditions within the study. This process is called allocation.
theory details
Once you have the sample of participants for the experiment, they need to be assigned to the conditions within the experiment. This process is called allocation. The ideal type of allocation is random allocation, in which every member of the sample has an equal chance of being assigned to each experiment condition. An example of random allocation is when participants are allocated to the conditions of an experiment through the flip of a coin. Without random allocation, the conditions may be biased with some characteristics being over-represented in one condition over another.
Example:
In a study of highschool students and sleeping patterns, the year 8 and year 12 class were selected to participate using convenience sampling. All students in the year 8 class were allocated to one condition, and all students in the year 12 class were allocated to another condition. These groups are biased, as participant’s age may affect the results. In random allocation, all students (both year 8 and year 12) would have an equal chance of being allocated to each condition, increasing the likelihood that the distribution of participant characteristics are evenly spread across the experimental and control condition. Using random allocation, the first condition comprised of 10 year 8 students and 12 year 12 students, and the second condition comprised of 14 year 8 students and 9 year 12 students.
Theory summary
In this lesson, you have learned about how experimenters select participants for their studies, and the methods they use to do this. You should be able to identify populations and samples of research and explain the processes of convenience sampling, random sampling and stratified sampling.
You should also be able to describe the benefits and limitations of each of these methods. You have learned about allocation, specifically about random allocation, and you should be able to describe this process. So far you have learned about how researchers set up their experiments, in regards to the aim, hypothesis, population and sampling. The relationship between these is outlined in figure 3.
Allocation the process of assigning participants to conditions in the experiment for the research
Random allocation when every member of the sample has an equal chance of being assigned to each condition in an experiment
Aim
Hypothesis
Population
Sample
Random allocation
Control Group Experimental Group
Convenience Random Stratified
Figure 3 The process of designing an experiment.
1C Activities
1 Random sampling and m&msInstructions:Open a bag of m&ms and count how many m&ms there are in the packet, let’s say this is the population of your study. Population: How many m&ms do you have in your packet? ________Use the following sampling procedures to select a sample of m&ms from your packet and compare the differences between each sample you choose, dependent on the sampling procedure you used.
Sampling method Description of a sampling procedure Description of a sample obtained
Convenience sampling
1. Grab the first 20 m&ms that fall into your hand. E.g. 12 brown m&ms, 5 red, 3 blue
Random sampling 1. Pour out all of the m&ms into a dish to make sure that you have access to them all.
2. Pick out 20 m&ms from the dish with your eyes closed.
Stratified sampling
1. Divide the packet of m&ms into the colours that are in the packet.
2. Count how many m&ms there are in each colour category.
3. Pick out 20 m&ms in the proportion of colours in which they appear in the bag.
a What would a representative sample of the m&ms look like?
b Which sampling procedure produced the most representative sample?
c Which sampling procedure produced the least representative sample?
1C THEORY 19
This document is intended for Marita Elvish at Hallam Senior College (user ID: 1444347). Unauthorisedcirculation in any form is not permitted.

So far in this chapter, you have been learning about how researchers begin to plan their research. A key component of planning scientific studies in a rigorous manner is to identify possible sources of error and proactively design ways to prevent or control these errors. In this lesson, you will learn about common sources of error in psychological studies, as well as ways to prevent them.
1D SOURCES OF ERROR AND PREVENTION
Prevention of error 4.3.3.8
Sources of error and prevention
Confounding and extraneous variables 4.3.3.6
Sources of error 4.3.3.7
Order eects4.3.3.7.2Experimenter eects 4.3.3.7.4
Participant-relatedvariables 4.3.3.7.1
Placebo eect 4.3.3.7.3
Non-standardised instructions and procedures 4.3.3.7.5
Choosing an experimentalresearch design 4.3.3.8.2
Placebo 4.3.3.8.4
Sampling procedures4.3.3.8.1
Counterbalancing4.3.3.8.3
Standardised instructionsand procedures 4.3.3.8.7
Double-blindprocedures 4.3.3.8.6
Single-blindprocedures 4.3.3.8.5
In this lesson, you will be learning about errors that can occur in psychological studies; these are referred to as extraneous and confounding variables. You will learn about common sources of error that may arise, and methods that researchers can use in order to identify and prevent them.
1A. Aims, hypotheses and variables
1B. Scientific research methodologies
1C. Population, sample and sampling
1D. Sources of error and prevention
1E. Ethical considerations
1F. Collection of data
1G. Data organisation and interpretation
1H. Evaluation of research
Study design dot point
• the characteristics of scientific research methodologies and techniques of primary qualitative and quantitative data collection relevant to the selected investigation: experiments,
self-reports, questionnaires, interviews and/or use of rating scales; reliability and validity of data; and minimisation of experimental bias and confounding and extraneous variables
Key science skills
• Plan and undertake investigations:
– minimise confounding and extraneous variables by considering type of sampling procedures, type of experiment, counterbalancing, single and double blind procedures, placebos, and
standardised instructions and procedures
• Analyse and evaluate data, methods and scientific models
– evaluate investigative procedures and possible sources of bias, and suggest improvements, with reference to identification of potential extraneous and confounding variables
including individual participant differences, non-standardised instructions and procedures, order effects, experimenter effect and placebo effects
Key knowledge units
Confounding and extraneous variables 4.3.3.6
Participant-related variables (Sources of error) 4.3.3.7.1
Order effects (Sources of error) 4.3.3.7.2
Placebo effect (Sources of error) 4.3.3.7.3
Experimenter effects (Sources of error) 4.3.3.7.4
Non-standardised instructions and procedures (Sources of error) 4.3.3.7.5
Sampling procedures (Prevention of error) 4.3.3.8.1
Choosing an experimental research design (Prevention of error) 4.3.3.8.2
Counterbalancing (Prevention of error) 4.3.3.8.3
Placebo (Prevention of error) 4.3.3.8.4
Single-blind procedures (Prevention of error) 4.3.3.8.5
Double-blind procedures (Prevention of error) 4.3.3.8.6
Standardised instructions and procedures (Prevention of error) 4.3.3.8.7
22
This document is intended for Marita Elvish at Hallam Senior College (user ID: 1444347). Unauthorisedcirculation in any form is not permitted.

Confounding and extraneous variables 4.3.3.6
overview
The purpose of a scientific experiment is to establish a causal relationship between the independent and dependent variables. In order to do this, other variables that might affect the dependent variable must be controlled. These variables are referred to as either confounding or extraneous variables.
theory details
Despite scientific experiments being conducted in a carefully controlled environment, it is not possible to control for all variables that might have an effect on the dependent variable. Extraneous variables are variables other than the independent variable, that have the potential to cause an effect on the dependent variable. In designing investigations, researchers want to identify as many of these extraneous variables as they can and control for them if possible, in order to minimise the effect they have on the results.
For example, in a study on the effect of class attendance on test scores, extraneous variables would be any factor other than attendance that could affect test performance. These might include: how much the student has studied in the lead up to the test, whether they had learned the material before, their level of motivation and if they enjoy the subject. A researcher may control for some of these variables by studying students in the same class who had not learned the topic before, and getting students to complete a questionnaire prior to the test on how many hours of study they did, their level of motivation and enjoyment of the class. Researchers may then only compare students who had similar responses on the questionnaire.
If the variables were not controlled for and did have an effect on the dependent variable, these variables have become confounding variables because they have confounded the results. In the above example, a confounding variable may be students’ age, as older students may have developed more cognitively and therefore performed better on the test. If the researcher did not take this into account, students’ age would be a confounding variable in this experiment.
Researchers want to control for extraneous variables so that confounding variables don’t cause errors in the research, and a cause and effect relationship between the independent and dependent variables can be established.
Extraneous variables variables other than the independent variable that may produce unwanted results in an experiment
Confounding variables variables other than the independent variable that have directly and systematically had an effect on the dependent variable
IV DV
EV
EV
EV
Figure 1 Extraneous variables are any variables that have the potential to impact the dependent variable other than the independent variable. In designing an experiment, researchers want to control for their effects.
Sources of error 4.3.3.7, Prevention of error 4.3.3.8
overview
There are a number of potential sources of error in which variables other than the independent variable can affect the dependent variable. In designing an experiment, researchers must identify and control as many as possible in order to ensure a valid conclusion can be made.
theory details
Extraneous and confounding variables can also be thought of as sources of error, as they may affect the results, making it difficult for researchers to establish a cause and effect relationship between the independent and dependent variables.
Sources of error and the corresponding method to prevent the error are outlined in table 1.
Useful tip
Extraneous and confounding variables may refer to the same variables. However, while all confounding variables are extraneous variables in that they refer to uncontrolled for and unwanted variables in an experiment, not all extraneous variables are confounding.
An extraneous variable may be identified as confounding only if it can be shown that it systematically affected the dependent variable in an unwanted way. For example, if a fire alarm went off in the first trial of a test this would be an extraneous variable. However, if it did not go off for all trials of that same test, it could not be considered confounding, as it has not systematically (repeatedly or consistently) affected the dependent variable (e.g. test performance).
1D THEORY 23
This document is intended for Marita Elvish at Hallam Senior College (user ID: 1444347). Unauthorisedcirculation in any form is not permitted.

Table 1 Sources and prevention of error
Source of error Prevention of error Example
Participant-related variables 4.3.3.7.1
• Participant-related variables can be understood as individual participant differences that can affect the results.
• In a large sample size, these participant differences reflect the differences in the population but if a sample is biased or too small, individual participant differences can introduce a source of error, as they are not representative of the population.
• Participant-related errors can also be introduced due to the sampling technique; convenience sampling is likely to produce a biased sample.
Sampling procedures 4.3.3.8.1
• One way to reduce a biased sample is to choose an appropriate sampling procedure that will select a representative sample.
• Random sampling and stratified sampling will produce less bias in samples as compared to the use of convenience sampling.
• Using a large sample size will also help to reduce participant-related variables affecting the investigation.
Choosing an experimental research design 4.3.3.8.2
• Another way of minimising the confounding effects of participant variables is through choosing an appropriate experimental research design.
• In a repeated measures design, the same participants are used in both conditions and this eliminates participant differences between conditions.
• In a matched participants design, participants are matched on relevant characteristics to the study, therefore minimising the effect of participant differences between conditions.
• A researcher is studying the effects of a new concentration medication in young adults aged 18 to 25.
• Participant-related variables in this study may include participants’ baseline level of concentration, any existing medical conditions related to concentration such as attention-deficit disorder, and how much familiarity they have had with the experimental concentration task prior to the experiment.
• If the researcher had used convenience sampling to select 20 participants, the sample may be biased. For example, the number of 18 year olds in the study may be overrepresented, as well as an overrepresentation of people who had an abnormally high baseline of concentration ability.
• In order to control for this, the researcher may instead use stratified sampling to select a sample of 500 participants.
• This larger sample size selected through stratified sampling is less likely to be biased due to participant-related variables.
• Another way to control for this may involve the researcher choosing to use a matched participants design instead of an independent group design, matching participants based on the relevant characteristic of baseline concentration levels to reduce this as a participant related confounding variable.
Order effects 4.3.3.7.2
• Order effects are a type of confounding variable relevant to repeated-measures experimental designs, and occur due to the order in which participants participate in the control and experimental conditions.
• They are also known as practice effects because they are errors due to the participants having ‘practised’ the condition or task before.
Choosing an experimental research design 4.3.3.8.2
• Instead of using a repeated measures design, choosing another experimental research design, such as matched-participants, would have the same benefits of reducing participant variables, without order effects.
Counterbalancing 4.3.3.8.3
• If conducting a matched-participants design is not possible due to costs or other constraints, counterbalancing in a repeated-measures design can also reduce order effects.
• Counterbalancing involves half of the participants participating in the experimental condition first and then the control condition, and the other half of the participants doing it in the reverse order.
• This controls for order effects as the two halves of participants participate in the conditions in alternating orders, cancelling out this effect.
• It is easier, more convenient and cheaper than designing a matched-participants experiment.
• If the researcher used a repeated-measures design for this study, this would involve all of the 500 participants completing the concentration task first without being administered the concentration medication (condition 1), and then completing the task again with the medication (condition 2).
• In this instance, order effects may occur as participants’ improved concentration scores in the second condition may be due to them having already completed the task, rather than the medication itself.
• One way of addressing this is to use a matched-participants experimental design instead.
• This would involve the researcher matching participants on key relevant characteristics such as age, baseline levels of concentration, and existing medical conditions, and allocating one of each matched pair to the experimental or control condition.
• If the researcher is unable to conduct a matched-participants design, they could instead use counterbalancing in the repeated-measures design.
• This would involve half (250) of the participants completing condition 1 followed by condition 2, while the other half complete condition 2 followed by condition 1.
• This would ‘balance out’ or negate any practise effects that may occur.
Participant-related variables individual participant differences that can affect the results
Order effects (also known as practice effects) a source of error in repeated-measures designs due to the order the participants participate in the experimental and control conditions
Sampling procedures the method of choosing an appropriate sampling procedure to reduce possible extraneous and confounding variables
Choosing an experimental research design the process of choosing an appropriate experimental research design in order to reduce possible extraneous and confounding variables
Counterbalancing a method used in repeated-measures experimental designs to reduce order effects
CHapTER 1: SCiEnCE SkillS anD RESEaRCH mETHODS24
This document is intended for Marita Elvish at Hallam Senior College (user ID: 1444347). Unauthorisedcirculation in any form is not permitted.

Table 1 Sources and prevention of error
Source of error Prevention of error Example
Placebo effect 4.3.3.7.3
• The placebo effect occurs when a participant’s expectations of something actually makes it happen.
• Participant expectations can affect their behaviour and mental processes, resulting in them behaving differently or reporting different mental processes than they otherwise would as a consequence of their expectations.
Placebo 4.3.3.8.4
• A placebo is an inactive medication or treatment which participants believe to have an active component.
• Administering a placebo in an experiment controls for participant expectations because if there is a significant difference in the results of the active and placebo medication, the researcher can infer that the medication had an effect.
• Conversely, if there is no significant difference between the results of the placebo group and the group who were administered the treatment, researchers would be able to conclude that the medication is not more effective than the placebo effect.
Single-blind procedures 4.3.3.8.5
• One way to reduce participant expectations is to use a single-blind procedure.
• This involves the participant being unaware of what condition they have been allocated to; that is, they don’t know whether they are receiving the placebo or the active treatment.
• This decreases the likelihood of participant expectations affecting results.
• The placebo effect might occur if participants knew that they would be receiving treatment for concentration, as their expectation of having increased concentration due to the medication may in turn actually improve their concentration.
• In order to control for this, the researcher can use a single-blind procedure so that participants are unaware if they have been allocated to the control or experimental group.
• The control group receives a placebo and the experimental group receives the concentration medication.
Experimenter effects 4.3.3.7.4
• Experimenter bias refers to the expectations that experimenters may have, whether about the participants or the results, possibly influencing how they conduct the research or interpret the results.
• Often these biases are not conscious, but as they can affect the results of the experiment, they are an example of an extraneous variable that can become a confounding variable.
Double-blind procedures 4.3.3.8.6
• In order to address experimenter bias, a double-blind procedure can be used, which addresses both the participant and experimenter bias.
• This involves neither the participants nor the conductor of the experiment knowing the condition that participants are allocated to, ensuring their expectations don’t affect their behaviour or interpretation of the results.
• Experimenter bias may occur if the experimenter treats participants differently based on their knowledge of if they are receiving an active medication or not.
• For example, when asking participants to report on their levels of concentration, the experimenter may inadvertently ask more leading questions to the experimental group than the control group, affecting the results.
• In order to control for this, a double-blind procedure may be used.
• This could involve a research assistant administering the medication and placebo, without knowledge of which is which.
• The research assistant may then do the follow up testing, and without knowledge of which condition each participant is in, it is less likely that errors will be introduced due to their expectation bias.
Placebo effect when an inactive treatment has an effect due to the participants’ expectations
Placebo an inactive medication or treatment, used to control for participant expectations
Single-blind procedure a procedure in which participants are unaware of which condition they have been allocated to, in order to reduce participant expectations
Experimenter effects occur when an experimenter’s expectations about the study influence the results
Double-blind procedure a procedure in which both the participants and the person conducting the experiment are unaware of which condition participants have been allocated to, in order to reduce experimenter bias
1D THEORY 25
This document is intended for Marita Elvish at Hallam Senior College (user ID: 1444347). Unauthorisedcirculation in any form is not permitted.

Table 1 Sources and prevention of error
Source of error Prevention of error Example
Non-standardised instructions and procedures 4.3.3.7.5
• Errors can be introduced when procedures and instructions are not standardised for each participant.
• If there are multiple experimenters each conducting the experiment with varying procedures and instructions, it can affect the participant’s behaviour and the results.
Standardised instructions and procedures 4.3.3.8.7
• Standardised instructions and procedures involve having clear and methodical instructions to ensure that the testing conditions and procedures are the same for all participants in each group in order to reduce confounding variables.
• Non-standardised testing and procedures may mean that some participants receive the medication in the morning, and others receive it in the evening.
• This can affect the results as participants’ baseline level of concentration may differ throughout the day and so a valid comparison between participants cannot be made.
• In order to standardise the instructions and procedures, researchers may administer the medication at a specific time to participants each morning.
• When following up with participants, researchers may also standardise the questions they ask, following an exact script and not asking any further follow-up questions.
Non-standardised testing procedures when instructions and procedures in an experiment are not consistent for all participants, therefore affecting the results obtained
Standardised instructions and procedures the consistent use of instructions and procedures for all participants
Theory summaryIn this lesson, you have learned about extraneous and confounding variables, and the need for researchers to control for them when designing an experiment. You should be able to identify and explain a range of sources of error, as well as suggest appropriate measures to control for them. You should also be able to identify these in a given scenario and describe each source of error.
Table 2 Summary of sources of error and corresponding prevention method
Source of error Corresponding method to minimise error
• Participant-related variables (individual participant differences)
• Selecting an appropriate sampling procedure
• Choosing an experimental research design
• Order (practice) effects • Choosing another experimental research design
• Counterbalancing
• Participant expectations (placebo effect) • Using a placebo
• Single-blind procedures
• Experimenter effects (experimenter bias) • Double-blind procedures
• Non-standardised instructions and procedures • Standardised instructions and procedures
Useful tip
It is important to distinguish between a placebo and the placebo effect. A placebo is an inactive treatment, such as a sugar pill, whereas the placebo effect is an effect that occurs due to participants’ expectations.
Image: rzstudio/Shutterstockcom
Figure 2 A placebo involves the use of an inactive treatment, such as a sugar pill
1D QUESTIONSTheory review questions
Question 1
Match the key term from the lesson to the corresponding definition.• Extraneous variable• Confounding variable• Participant-related variables • Order effects• Placebo
• Experimenter effects• Non-standardised instructions and
procedures• Sampling procedures• Choosing an experimental research
design
• Single-blind procedures• Double-blind procedures• Counterbalancing• Standardised instructions and
procedures
a a variable other than the independent variable that has already had an effect on the dependent variable ___________b an inactive medication or treatment, usually administered in the form of a sugar pill ___________c occurring in repeated-measures experimental designs, this confounding variable is due to the order in which participants
partake in the experimental and control conditions ___________d when experimenter expectations affect the results ___________e a variable other than the independent variable that has the potential to have an effect on the dependent variable ___________f when the inconsistent administration of an experiment causes errors ___________g choosing an appropriate method to select a sample from the population in order to reduce errors ___________
CHapTER 1: SCiEnCE SkillS anD RESEaRCH mETHODS26
This document is intended for Marita Elvish at Hallam Senior College (user ID: 1444347). Unauthorisedcirculation in any form is not permitted.

h individual participant differences that may cause confounding variables to occur ___________i a procedure used to control for order effects in repeated-measures experimental designs ___________j when participants are unaware if they are taking a placebo or active medication ___________k the consistent administration of an experiment in order to prevent errors occurring in the results ___________l choosing either repeated-measures, independent groups, or matched participants design in order to reduce
errors ___________m when both the participant and experimenter are unaware of which participants are receiving a placebo treatment ___________
Exam-style questions Remember and understand
Question 2 (1 MARK)
Order effects are
A extraneous variables that can occur due to the use of single-blind procedures.B extraneous variables that can occur due to the use of placebo. C confounding variables that can occur in matched-design experiments. D confounding variables that can occur in repeated-measures experiments.
Question 3 (1 MARK)
What research methodology can be used to minimise order effects?
A the use of standardised instructionsB counterbalancing C single-blind proceduresD double-blind procedures
Question 4 (1 MARK)
Single-blind procedures are used to control for
A the placebo effect.B order effects.C all extraneous variables.D the placebo effect and the experimenter effect.
Adapted from VCAA 2013 exam MCQ13
Apply and analyse
Use the following scenario for questions 5 and 6.
A researcher was conducting a trial for a new medication that enhances mood. Group A, the experimental group, received the medication, while Group B, the control group, received a placebo. Concerned about experimenter bias, a double-blind procedure was used.
Question 5 (1 MARK)
Which of the following identifies the double-blind procedure used in this investigation?
A Only the researcher knew who would receive the placebo.B Only the research assistant knew who would receive the mood enhancing medication.C Only the researcher and the control group knew who would receive the placebo.D Only the researcher and the research assistant knew who was in the experimental and control group.
Adapted from VCAA 2018 exam MCQ36
1D QUESTiOnS 27
This document is intended for Marita Elvish at Hallam Senior College (user ID: 1444347). Unauthorisedcirculation in any form is not permitted.

body that develop and maintain health standards in research. The NHMRC outlines four key guiding values for ethical research, summarised in table 1.
Table 1 Ethical values in research
Ethical value Description
Research merit and integrity
Research that has merit includes the following characteristics:
• It is justifiable by its potential benefit.
• It is designed and developed based upon thorough study of current literature and previous studies concerning the intended research area.
• It is designed to ensure that respect for participants is not compromised.
• It is conducted and supervised by qualified and experienced researchers.
Justice The value of justice refers to fairness within the investigation. This means that:
• the process of recruiting participants is fair.
• there is no unfair burden of participation in research on particular groups; that is, the risks and benefits of the research should be fairly spread amongst groups.
• there is no exploitation of participants.
• there is fair access to the benefits of the research.
Beneficence With some psychological research, there may be potential risks for the participants. Beneficence refers to when the potential benefit of the research findings outweighs any potential risks for the participants. This makes the research justified.
With regard to beneficence, researchers are responsible for:
• designing research to minimise the risk of participant harm or discomfort.
• ensuring participants understand both the potential benefits and risks of the research.
• the welfare of the participants in the research context.
Respect for human beings
Respect for human beings is at the core of all research involving participants. It requires that the researchers have regard for participants’ welfare, beliefs, perceptions, customs and cultural heritage.
Source: NHMRC, 2019
When designing a psychological investigation, researchers must show how they have incorporated these ethical considerations, and submit their proposal to an ethics committee for approval before conducting their research. The ethics committee is a group of people who consider the details of the investigation and use the ethical values to deem whether the research is ethical to conduct or not. Often, decisions have to be made about the associated risks, and whether the risks are outweighed by the potential benefits of the investigation.
For example, when trialling new medication, there are potential risks involved for participants as the effects of the medication are unknown at this point. However, the benefits of trialling the medication, and the potential benefits it may have for a wider population of people, means that the ethics committee might deem the research as ethical and approve it to proceed, despite the associated risks.
An ethical consideration that researchers must always keep in mind is the no-harm principle. The no-harm principle stipulates that participants must not experience any harm, whether physical or psychological. This is applicable in both the short-term (eg. during the experimental trial), as well as in the long-term (eg. participants shouldn’t have any lasting negative effects due to the investigation). It is the role of the experimenter to ensure this principle is upheld, in line with the other guiding values of research, when designing and conducting psychological experiments.
Participant rights 4.3.4.2
overview
There are specific ethical considerations related to the participants and their rights within a psychological investigation. These are referred to as participant rights and include: voluntary participation, informed consent, withdrawal rights, confidentiality and debriefing.
theory details
When participating in an experiment, participants have rights that they can exercise. These are referred to as participants’ rights and are outlined in table 2. Along with ensuring their research is in line with the ethical values and guidelines, the experimenters must also ensure that participants are aware of and are able to exercise their rights in research.
Ethics committee a group of people who review research proposals, consider the potential risks, benefits and implications in order to either approve or disapprove them for research
No-harm principle the role of the researcher to ensure that all participants within an investigation do not experience mental or physical harm
CHapTER 1: SCiEnCE SkillS and RESEaRCH mETHOdS30
This document is intended for Marita Elvish at Hallam Senior College (user ID: 1444347). Unauthorisedcirculation in any form is not permitted.
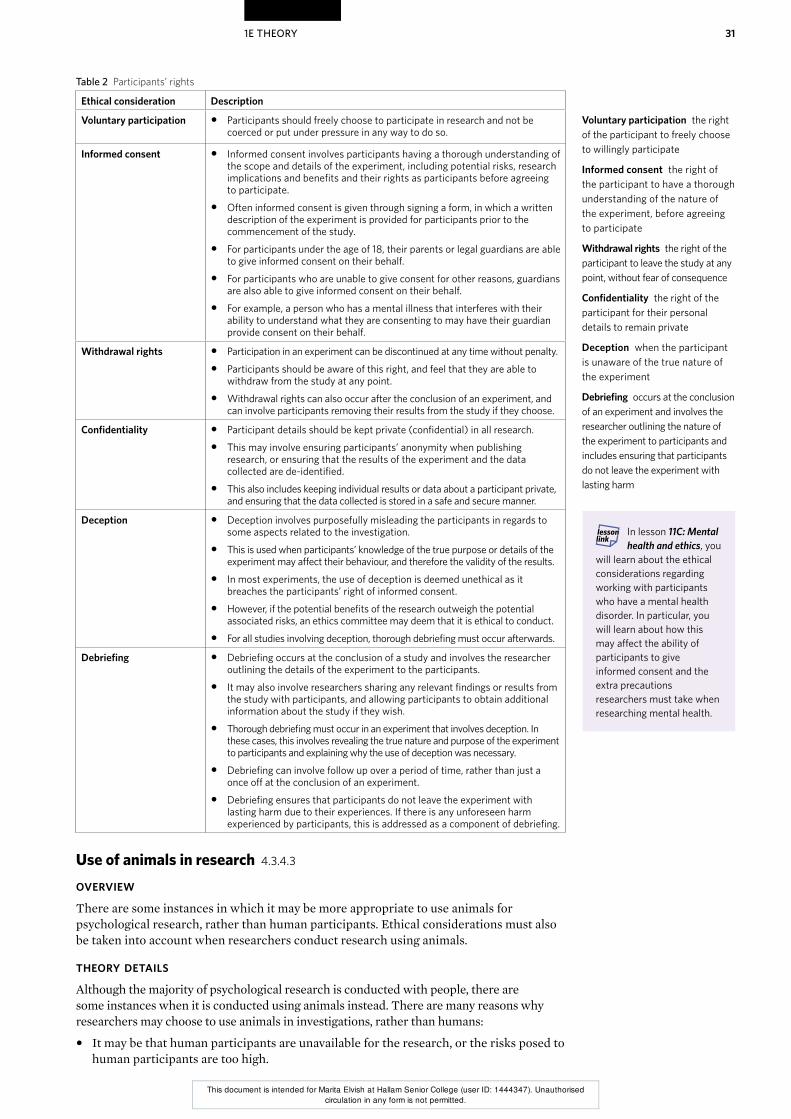
In lesson 11C: Mental health and ethics, you
will learn about the ethical considerations regarding working with participants who have a mental health disorder. In particular, you will learn about how this may affect the ability of participants to give informed consent and the extra precautions researchers must take when researching mental health.
Table 2 Participants’ rights
Ethical consideration Description
Voluntary participation • Participants should freely choose to participate in research and not be coerced or put under pressure in any way to do so.
Informed consent • Informed consent involves participants having a thorough understanding of the scope and details of the experiment, including potential risks, research implications and benefits and their rights as participants before agreeing to participate.
• Often informed consent is given through signing a form, in which a written description of the experiment is provided for participants prior to the commencement of the study.
• For participants under the age of 18, their parents or legal guardians are able to give informed consent on their behalf.
• For participants who are unable to give consent for other reasons, guardians are also able to give informed consent on their behalf.
• For example, a person who has a mental illness that interferes with their ability to understand what they are consenting to may have their guardian provide consent on their behalf.
Withdrawal rights • Participation in an experiment can be discontinued at any time without penalty.
• Participants should be aware of this right, and feel that they are able to withdraw from the study at any point.
• Withdrawal rights can also occur after the conclusion of an experiment, and can involve participants removing their results from the study if they choose.
Confidentiality • Participant details should be kept private (confidential) in all research.
• This may involve ensuring participants’ anonymity when publishing research, or ensuring that the results of the experiment and the data collected are de-identified.
• This also includes keeping individual results or data about a participant private, and ensuring that the data collected is stored in a safe and secure manner.
Deception • Deception involves purposefully misleading the participants in regards to some aspects related to the investigation.
• This is used when participants’ knowledge of the true purpose or details of the experiment may affect their behaviour, and therefore the validity of the results.
• In most experiments, the use of deception is deemed unethical as it breaches the participants’ right of informed consent.
• However, if the potential benefits of the research outweigh the potential associated risks, an ethics committee may deem that it is ethical to conduct.
• For all studies involving deception, thorough debriefing must occur afterwards.
Debriefing • Debriefing occurs at the conclusion of a study and involves the researcher outlining the details of the experiment to the participants.
• It may also involve researchers sharing any relevant findings or results from the study with participants, and allowing participants to obtain additional information about the study if they wish.
• Thorough debriefing must occur in an experiment that involves deception. In these cases, this involves revealing the true nature and purpose of the experiment to participants and explaining why the use of deception was necessary.
• Debriefing can involve follow up over a period of time, rather than just a once off at the conclusion of an experiment.
• Debriefing ensures that participants do not leave the experiment with lasting harm due to their experiences. If there is any unforeseen harm experienced by participants, this is addressed as a component of debriefing.
Voluntary participation the right of the participant to freely choose to willingly participate
Informed consent the right of the participant to have a thorough understanding of the nature of the experiment, before agreeing to participate
Withdrawal rights the right of the participant to leave the study at any point, without fear of consequence
Confidentiality the right of the participant for their personal details to remain private
Deception when the participant is unaware of the true nature of the experiment
Debriefing occurs at the conclusion of an experiment and involves the researcher outlining the nature of the experiment to participants and includes ensuring that participants do not leave the experiment with lasting harm
Use of animals in research 4.3.4.3
overview
There are some instances in which it may be more appropriate to use animals for psychological research, rather than human participants. Ethical considerations must also be taken into account when researchers conduct research using animals.
theory details
Although the majority of psychological research is conducted with people, there are some instances when it is conducted using animals instead. There are many reasons why researchers may choose to use animals in investigations, rather than humans:
• It may be that human participants are unavailable for the research, or the risks posed to human participants are too high.
1E THEORY 31
This document is intended for Marita Elvish at Hallam Senior College (user ID: 1444347). Unauthorisedcirculation in any form is not permitted.

Want to know more?
The NHRMC also have a code of conduct that guide research using animals. You can find the Australian Code for the Care and Use of Animals for Scientific Purposes on the NHRMC website at: www.nhmrc.gov.au.
• When researching the effects of ageing, animals generally have a shorter life span and as such the effects of ageing can be studied more effectively than with human participants.
• When researching genetics, it may be better to use animals as they have shorter gestation periods, allowing for genetic studies to be conducted more efficiently.
• Due to the similarities that some animals have to humans in their mental processes and behaviours, research on animals can be a starting point for the initial research before testing with human participants.
Some advantages of working with animals rather than people include:
• For large sample sizes, it is generally more efficient to test using animals rather than humans as it can be costly and time-consuming to accurately select an appropriate large sample of human participants.
• Generally, the behaviours of animals can be more controlled than working with people, which can be beneficial depending on the study.
However, some disadvantages of working with animals include:
• Only behaviours can be studied, as animals are unable to report on their mental processes.
• The generalisability of results from studies using animals to humans is relatively low as animals are different to humans in many ways.
When using animals in research, experimenters must still take ethics into consideration. Similarly to studies with people, the value of beneficence must be considered. Researchers need to weigh up the potential benefits of the study and the potential harm it can cause the animal in order to decide whether the study is justified. Likewise, harm to animals must be minimised and research should be conducted with research merit and integrity.
Theory summary In this lesson, you have learned about the ethical considerations of psychological research. You should be able to outline the role of the experimenter in designing research that complies with ethical guidelines. You should also be able to explain participants’ rights, and be able to identify when they have been upheld or breached in a given scenario. You have also learned about using animals in research and should be able to explain the advantages and disadvantages of using animals, as well as the ethical considerations researchers must take into account.
1E Activities
1 Create a mnemonic that will help you to remember the participants’ rights in psychological research. You can create an acronym or an acrostic.
• An example of an acronym is EFTPOS, which stands for Electronic Funds Transfer at Point Of Sale• An example of an acrostic is Never Eat Soggy Weetbix, where the first letter of each word stands for the directions of a
compass: North East South West
1E QUESTIONSTheory review questions
Question 1
Match the key term from the lesson to the corresponding definition.
• Ethics committee• No-harm principle
• Voluntary participation• Informed consent
• Withdrawal rights • Confidentiality
• Deception• Debriefing
a The right of the participant to leave the experiment at any time without consequences ___________b The right of participants to not have their personal details or individual results known to others ___________c Participants should be able to freely choose to participate in an experiment ___________d At the conclusion of an experiment, researchers should explain the nature of the investigation to participants, including
their individual results ___________
CHapTER 1: SCiEnCE SkillS and RESEaRCH mETHOdS32
This document is intended for Marita Elvish at Hallam Senior College (user ID: 1444347). Unauthorisedcirculation in any form is not permitted.

So far in this chapter, you have been learning about how researchers design investigations and the factors they take into consideration; including sampling procedures, ethical considerations and the identification and prevention of errors. When conducting an investigation, researchers must also make decisions concerning the type of data they will collect and whether the type of data will allow them to answer their research question. In this lesson, you will learn about the different types of data that researchers can collect.
1F COLLECTION OF DATA
Types of data 4.3.3.9
Collection of data
1A. Aims, hypotheses and variables
1B. Scientific research methodologies
1C. Population, sample and sampling
1D. Sources of error and prevention
1E. Ethical considerations
1F. Collection of data
1G. Data organisation and interpretation
1H. Evaluation of research
Study design dot point
• the characteristics of scientific research methodologies and techniques of primary qualitative and quantitative data collection relevant to the selected investigation: experiments,
self-reports, questionnaires, interviews and/or use of rating scales; reliability and validity of data; and minimisation of experimental bias and confounding and extraneous variables
Key science skills
• Conduct investigations to collect and record data:
– systematically generate, collect, record and summarise both qualitative and quantitative data
Key knowledge units
Types of data 4.3.3.9
Types of data 4.3.3.9
overview
When collecting data for an investigation, researchers must decide what type of data will best help them test their hypothesis. The types of data you should be familiar with include qualitative and quantitative data, as well as subjective and objective data.
theory details
In research, data refers to the information collected for a study. There are different ways in which researchers can collect this data. The main method of data collection that you need to be familiar with is primary data collection, which involves the experimenter directly collecting the data for an investigation. This data may be collected through various means of investigation, including experimentation, questionnaires, cross-sectional studies and so on, as explored in lesson 1B: Scientific research methodologies.
Primary data collection a method of data collection involving data being collected directly by the experimenter
In this lesson, you will be learning about techniques of primary data collection and the different types of data. You will learn to distinguish between qualitative and quantitative data, as well as subjective and objective data.
1f THEORY 35
This document is intended for Marita Elvish at Hallam Senior College (user ID: 1444347). Unauthorisedcirculation in any form is not permitted.

Through investigations, researchers can collect many different types of data. When designing their investigations, researchers must make a decision about what type of data will be the most useful in their research. Types of data and examples of each are summarised in table 1. The strengths and limitations of these types of data are outlined in table 2.
Want to know more?
Primary data collection involves the experimenter directly collecting the data. Secondary data collection involves the researcher using data collected elsewhere, or by someone else, for their research. Examples of this would be a meta-analysis, in which the researcher would analyse the findings of other experimenter’s research. You do not need to know secondary data collection methods for the VCAA Psychology study design, but it may be useful to deepen your understanding of primary data.
Table 1 Types of data
Data type Description Example
Quantitative data • Quantitative data concerns quantities and is therefore measurable.
• It is data that can be represented in numbers.
• Data collected from a rating scale or closed questions on a questionnaire.
• Data collected through an experiment in which the experimenter counts each time a behaviour is observed.
Qualitative data • Qualitative data concerns concepts that are not expressed numerically.
• This data is often collected through descriptions, or through the use of language.
• Data collected from open-ended questions on questionnaires.
• Responses to interview questions.
• Descriptions of the experimenter’s observations written down in a log.
Subjective data • Subjective data concerns the individual or personal experience of participants.
• In this way, it cannot be directly observed and is often collected through self-report.
• This data is based on a person’s opinion.
• Data collected through a participant’s self-report on a questionnaire about their experience of an event.
• It can be data collected about a participant’s experience, their perspective, feelings, beliefs or attitudes.
Objective data • Objective data is data that is collected through direct observation or measurement and should obtain the same results regardless of who is conducting the measurement.
• It does not rely on the interpretation of the experimenter.
• It is often understood as ‘facts’, that is, this data doesn’t change based on the person viewing the data.
• Data that can be collected the same way by multiple researchers, such as the measurement of a person's height in centimeters.
Table 2 Strengths and limitations of different types of data
Data type Strengths Limitations
Quantitative data • Quantitative data can be manipulated through statistical analysis, allowing for comparisons to be made, trends to be seen and conclusions to be more readily drawn.
• Only analysing quantitative data means that researchers may not have a holistic or very detailed understanding of the phenomenon they are researching.
Qualitative data • Qualitative data can give researchers a more thorough and holistic understanding of the context in which the quantitative, or other, data was collected.
• It can provide background information, or context to the quantitative data.
• Qualitative data is difficult to statistically analyse (though it is not impossible).
• This makes it difficult to manipulate the data in order to compare findings across groups and participants.
• Qualitative data can be more difficult to obtain as it is often more time-consuming.
Subjective data • Subjective data allows for experimenters to better understand the perspective of participants.
• It provides researchers with an insight into unobservable phenomena such as motivation, perception, interpretation etc.
• Subjective data is difficult to validate and can be unreliable.
• Sometimes participants may respond with what they think experimenters want to hear, rather than what they truly believe.
• Subjective data is more difficult to systematically analyse and compare compared to objective data.
Objective data • Objective data does not rely on experimenter interpretation, and so there is more chance that the data is valid.
• Using only objective data doesn’t allow researchers to understand the perspectives of the participants, which might provide more insight into the research area they are trying to understand.
Researchers may collect a range of different data types in order to answer their research question in an investigation. For example, in a study on people’s exercise habits, a researcher may ask participants to fill in a questionnaire asking participants to report the number of times they have exercised in the last week (subjective quantitative data), as well as asking
Quantitative data data concerning numerical amounts; expressed numerically
Qualitative data data that describes the characteristics of something; data of concepts that can be measured non-numerically
Subjective data data that relies on personal opinion or self-report
Objective data data that can be observed or measured by multiple people and obtain the same results
CHapTER 1: SCiEnCE SkillS and RESEaRCH mETHOdS36
This document is intended for Marita Elvish at Hallam Senior College (user ID: 1444347). Unauthorisedcirculation in any form is not permitted.

1F Activities
1 Decide if each of the following descriptions are an example of quantitative or qualitative data, and whether it is objective or subjective.
Data Quantitative/Qualitative Objective/Subjective
A participant fills in a sleep diary recording how many hours of sleep they think they had each night over the previous week.
A participant records their sleep data for a week, using a phone app that monitors their movement throughout the night.
A teacher writes a report for each of his students at the end of each semester, describing their progress and areas for growth.
A student fills in an anonymous questionnaire on a Google form about a class they took last semester. Each question requires students to indicate how strongly they either agree or disagree with a statement.
1F QUESTIONSTheory review questions
Question 1
Match the key term from the lesson to the corresponding definition.
• Primary data collection• Qualitative data
• Quantitative data• Subjective data
• Objective data
a Data that does not rely on interpretation ___________b Data that can be expressed in numbers ___________c A method of data collection in which the researcher directly obtains the data ___________d Data that can rely on self-report ___________e Data of the characteristics of concepts that can be measured non-numerically ___________
Exam-style questions Remember and understand
Question 2 (1 MARK)
Participants’ responses to closed questions in a questionnaire is an example of
A subjective, qualitative data.B objective, qualitative data. C subjective, quantitative data.D objective, quantitative data.
them to describe how they feel about their exercise routine (subjective qualitative data). They may also collect sign-in data from the gym that they attend (objective quantitative data) in order to compare the participant’s self-reported number of exercise and the number of times they actually attended. Often, having a range of different data types helps experimenters to gain a more holistic understanding of their topic of research.
Theory summary In this lesson, you have learned about different data types that researchers can collect through primary data collection methods. You should be able to distinguish between qualitative and quantitative data, as well as between subjective and objective data. You should also be able to describe the strengths and limitations of each data type in supporting researchers to answer their research question. In a given scenario, you should be able to identify what type of data has been used, and suggest types of data relevant for specific investigations.
1f THEORY 37
This document is intended for Marita Elvish at Hallam Senior College (user ID: 1444347). Unauthorisedcirculation in any form is not permitted.

So far in this chapter, you have learned about the scientific skills and research methods of psychology. You have learned how researchers design and conduct experiments, and the different considerations they must take into account when doing so. Once a researcher has conducted their experiment and collected data, they then organise and interpret this data in order to draw a meaningful conclusion about their study.
1G DATA ORGANISATION AND INTERPRETATION
In this lesson, you will be learning about the methods through which researchers can organise and interpret data. You will learn about how data can be organised, presented and interpreted using a range of methods, and how data can be used to describe a specific sample and make inferences about the research population.
Organising and interpreting data 4.3.5.1
overview
Once a researcher has collected the raw data during an investigation, they must organise and present the data in order to construct meaningful interpretations.
theory details
Researchers must make decisions about how to organise and manipulate data collected
1A. Aims, hypotheses and variables
1B. Scientific research methodologies
1C. Population, sample and sampling
1D. Sources of error and prevention
1E. Ethical considerations
1F. Collection of data
1G. Data organisation and interpretation
1H. Evaluation of research
Study design dot point
• methods of organising, analysing and evaluating primary data to identify patterns and relationships including sources of error and limitations of data and methodologies
Key science skills
• Analyse and evaluate data, methods and scientific models
– recognise the difference between statistics that describe a specific sample and the use of statistics to make inferences about the population from which the data were drawn
– process quantitative data using appropriate mathematical relationships and units
– organise, present and interpret data using tables, bar charts, line graphs, percentages, calculations of mean as a measure of central tendency and understanding of standard deviation as a
measure of variation around the mean
Key knowledge units
Mean (Organising and interpreting data ) 4.3.5.1.1
Standard deviation (Organising and interpreting data ) 4.3.5.1.2
Outliers (Organising and interpreting data ) 4.3.5.1.3
Presenting data 4.3.5.2
Presenting Data 4.3.5.2
Data organisation and interpretation
Organising and interpreting data 4.3.5.1
Mean 4.3.5.1.1
Standard deviation 4.3.5.1.2
Outliers 4.3.5.1.3
1G THEORY 39
This document is intended for Marita Elvish at Hallam Senior College (user ID: 1444347). Unauthorisedcirculation in any form is not permitted.

during a study in order to identify meaningful trends or relationships within the data set. The researcher would begin by analysing the data collected in the study to derive descriptive statistics, which are statistics that describe the sample of the investigation. These statistics are presented in forms such as graphs and summary tables. This differs from inferential statistics, which assist researchers in making judgements regarding the extent to which the results of the experiment are meaningful and might apply to the population of research interest.
Mean 4.3.5.1.1
A common descriptive statistic that can give researchers information about the sample are measures of central tendency, which give information about what the ‘centre’ of the data set looks like. The centre is of interest to researchers because it demonstrates the trend of a data set and therefore represents a typical response. One measure of central tendency with which you should be familiar with is the mean.
The mean of a data set is calculated by adding up all of the data points and dividing it by the number of total data points. The mean is useful when the data points are clustered around a central score, so that this measure of central tendency can help researchers understand what the ‘average’ result is. If the data points are too widely or unevenly distributed, the mean could be a poor indicator of central tendency as it doesn’t accurately reflect the ‘central’ score of the data set.
Standard deviation 4.3.5.1.2
Another descriptive statistic that researchers can use to interpret data is standard deviation. The standard deviation of a data set is a measure of variation around the mean that shows the spread of data values around the average. The standard deviation shows how much the data ‘deviates’ (differs from) the mean.
Standard deviation can give researchers more information about the data set than the mean alone, as it shows the spread of results and how much variation there is in a data set. For example, figure 3 shows two data sets which have the same mean. If researchers were only to look at the mean, they might say that the results of the two groups are comparable. However, when researchers also look at the standard deviation, it can be seen that the data sets vary. In group A, the standard deviation is relatively small (that is, the results don’t deviate much from the mean), whereas the standard deviation of group B is larger (that is, the results deviate much more from the mean, so the results obtained in group B have a greater variance). In this way, using the standard deviation can allow researchers to more meaningfully compare two or more sets of data.
Descriptive statistics statistics that are used to organise and summarise data
Inferential statistics statistics that provide information on the statistical significance of the results and suggest how they might apply to a wider population
Mean a measure of central tendency that represents the average of a data set
Want to know more?
Two other common measures of central tendency are the mode and the median:
• The mode is a numerical value that appears most frequently within a data set.
• The median is the middle data point of a data set when data points are ordered from lowest to highest.
Mean
% correct
Freq
uenc
y
Figure 2 When the data points are clustered around a central score, the mean provides a more accurate measure of central tendency
Mean
% correct
Freq
uenc
y
Figure 1 When the data is unevenly distributed or clustered around extreme values, the mean is not an accurate measure of central tendency
Standard deviation a measure of central tendency that represents the spread of data around the mean
% correct
Freq
uenc
y
0 25 50 75 100
2
4
6
8
10
12
14
16group A
Mean
group B
Figure 3 Two data sets with the same mean and differing standard deviations
CHapTER 1: SCiEnCE SkillS and RESEaRCH mETHOdS40
This document is intended for Marita Elvish at Hallam Senior College (user ID: 1444347). Unauthorisedcirculation in any form is not permitted.

Standard deviations can also be represented numerically. The larger the standard deviation number, the more that the data in the set ‘deviates’ or differs from the mean, that is the data set has more variance.
Outliers 4.3.5.1.3
An important component that researchers must take into consideration when organising and interpreting data is the presence of outliers. Outliers are data points that differ or lie far away from the other results. Outliers may arise for a number of reasons. Often, the presence of outliers may affect how accurately a mean summarises data. If an outlier is included in the calculation of the mean, the mean may not be an accurate reflection of the average result. When looking at data sets, researchers must decide whether or not to include outliers in their statistical analysis. This may require a deeper analysis of why the outlier occurred, what it represents and how it may affect the validity of the results.
Presenting data 4.3.5.2
overview
Visually presenting data can help researchers to interpret and share the data collected in an investigation. Common methods of data presentation include the use of a table, bar chart or line graph.
theory details
In analysing, organising and interpreting data, researchers may choose different ways of representing it visually. Representing data visually makes it easier to see the relationship between the variables being investigated, through making patterns or trends in the data set more evident.
The two main ways of representing data are in tables or graphs:
• A table displays information using columns and rows.
• A graph shows the relationship of variables using a vertical and horizontal axis.
Outlier a value that differs from the other values in a data set
Outlier
Figure 4 Example of an outlier
Outlier
Figure 5 Example of an outlier
Table a method of presenting data using columns and rows
There are two main types of graphs with which you need to be familiar: line graphs and bar charts. Both types of graphs represent data along a vertical and horizontal axis to show the relationship between variables.
• A bar chart uses bars/columns that either sit horizontally or vertically and is used when one variable in the data represents categories.
• A line graph uses a line to connect the points of data along a graph, displaying the relationship between the variables.
Bar chart a graph that depicts the relationship between two variables using rectangular bars
Line graph a graph that depicts the relationship between two variables using a line that connects each data point
Table 1 Example of a table used to display data (Australia Bureau of Statistics, 2018)
Student enrolments by school affiliation, Australia, 2014-2018
2018 2017 2016 2015 2014
Government 2,558,169 2,524,865 2,483,802 2,445,130 2,406,495
Catholic 765,735 766,870 767,050 765,539 757,749
Independent 569,930 557,490 547,374 540,304 529,857
TOTAL 3,893,834 3,849,225 3,798,226 3,750,973 3,694,101
1G THEORY 41
This document is intended for Marita Elvish at Hallam Senior College (user ID: 1444347). Unauthorisedcirculation in any form is not permitted.

Years
0
10
20
30
40
50
60
%
1999 2002 2005 2008 2011 2014 20171996
Children who attend carewww.abs.gov.au/childcareAustralian Bureau of Statistics©Commonwealth of Australia
Children aged between 0 to 11 years who attended formal and/or informal care last week; 1996 to 2017
Children in informal care onlyChildren in formal care onlyChildren in both formal and informal care
Figure 7 Example of a line graph (Australian Bureau of Statistics, 2018)
Age groups (years)0
5
10
15
20
25
30
35
%
15-24 25-34 35-44 45-54 55-64 65-74 75+ All persons
0-14
PBSMBS
Proportion of Australian population who accessed subsidised mental health-related MBS services and PBS medication-2011, by Age
Figure 6 Example of a vertical bar chart (Australian Bureau of Statistics, 2011)
Want to know more?
You may have come across other methods of representing data.
• A pie chart displays the proportion of each key characteristic within the data.
• A scatterplot plots data points on a graph to represent the relationship between two variables.
Climate change risk
Food
qua
ntity
, a
orda
bilit
y, q
ualit
y
10
20
30
40
50
60
10-10 20 30 40 50 60 70 80 90 1000
Food insecurity and climate change risks
Nigeria
Ghana
Least risk
Wor
stBe
st
Most risk
Egypt
Kazakhstan
Laos
Viet NamMalawi
India
Low-income countriesLower-middle-income countriesUpper-middle-income countriesHigh-income countries
China
Niger
Chad
Figure 9 Example of a scatterplot (Oxfam, 2014)
Australia’s goods trade with the EU by major EU countryImports (A$m)
Other EU$15,204
Ireland$2731
France$4511
Italy$5900
United Kingdom$7126
Germany$13,524
Figure 8 Example of a pie chart (Department of Foreign Affairs and Trade, 2017)
CHapTER 1: SCiEnCE SkillS and RESEaRCH mETHOdS42
This document is intended for Marita Elvish at Hallam Senior College (user ID: 1444347). Unauthorisedcirculation in any form is not permitted.

Useful tips
When drawing graphs, you should note that:
• The independent variable is represented on the horizontal (x) axis while the dependent variable is represented on the vertical (y) axis.
When interpreting graphs, you should note that:
• The presence of a correlation does not necessarily establish that there is a causal relationship between two variables, remember correlation does not equal causation!
• Not all experiments will show a correlation between variables.
Theory summaryIn this lesson, you have learned about how you can organise, present and interpret data collected from an investigation. You should be able to identify the mean and standard deviation as measures of central tendency and explain why they are examples of descriptive statistics. You should also be able to calculate the mean and explain how standard deviation can be used to interpret the spread of data in a data set. You should also be able to construct tables, bar graphs and line graphs and be able to interpret information when data is presented in these formats.
1G Activities
1 Calculate the means of the following sets of data.
Data Calculation Mean
a14, 16, 27, 11, 12, 15, 5
The mean =14+16+27+11+12+15+5
7
b272, 345, 324, 222
c1, 4 ,2, 5, 7, 8, 10, 6, 3, 7, 9
d68, 67, 66, 68, 65, 62
2 Describe the standard deviation of group 1 and group 2 in the following graph. Group 1: ___________________________________________ ___________________________________________________ ___________________________________________________ Group 2: ___________________________________________ ___________________________________________________ ___________________________________________________ ___________________________________________________
% recall
Num
ber o
f par
ticip
ants
0 25 50 75 100
10
20
30
40
50group 1
group 2
Useful tip
When drawing a graph, it is important to make sure you have all the following components:
• A title• A label for your horizontal (x) axis• A label for your vertical (y) axis• Units of measurements for both axes
Graph title
X axis (independent variable) with units of measurement
Y ax
is (d
epen
dent
var
iabl
e)
with
uni
ts o
f mea
sure
men
t
1G THEORY 43
This document is intended for Marita Elvish at Hallam Senior College (user ID: 1444347). Unauthorisedcirculation in any form is not permitted.

Glossary Terms: Research Methods Create Flash cards, a quizlet –https://quizlet.com/ a study stack https://www.studystack.com/ or go old school and
copy these out an write them – there are many….. you will hate it now but thank me later
Beneficence Convenience sampling Double-blind procedure
______________________________
______________________________
______________________________
______________________________
______________________________
______________________________
______________________________
______________________________
______________________________
______________________________
______________________________
______________________________
Code of Ethics Correlation Empirical evidence
______________________________
______________________________
______________________________
______________________________
______________________________
______________________________
______________________________
______________________________
______________________________
______________________________
______________________________
______________________________
Conclusion Cross-sectional study Ethics
______________________________
______________________________
______________________________
______________________________
______________________________
______________________________
______________________________
______________________________
______________________________
______________________________
______________________________
______________________________
Confidentiality Data Experiment
______________________________
______________________________
______________________________
______________________________
______________________________
______________________________
______________________________
______________________________
______________________________
______________________________
______________________________
______________________________

Confounding variable Debriefing Experimental condition
______________________________
______________________________
______________________________
______________________________
______________________________
______________________________
______________________________
______________________________
______________________________
______________________________
______________________________
______________________________
Control condition Deception Experimental group
______________________________
______________________________
______________________________
______________________________
______________________________
______________________________
______________________________
______________________________
______________________________
______________________________
______________________________
______________________________
Control group Dependent variable (DV) Experimenter bias
______________________________
______________________________
______________________________
______________________________
______________________________
______________________________
______________________________
______________________________
______________________________
Controlled variables
Descriptive statistics
Experimenter effect
______________________________
______________________________
______________________________
______________________________
______________________________
______________________________
______________________________
______________________________
______________________________
______________________________
______________________________
______________________________

Extraneous variables Operational definition
______________________________
______________________________
______________________________
______________________________
______________________________
______________________________
______________________________
______________________________
Generalisation Longitudinal study Operational hypothesis
______________________________
______________________________
______________________________
______________________________
______________________________
______________________________
______________________________
______________________________
______________________________
______________________________
______________________________
______________________________
Hypothesis Matched-participants design p value
______________________________
______________________________
______________________________
______________________________
______________________________
______________________________
______________________________
______________________________
______________________________
______________________________
______________________________
______________________________
Hypothetical construct Mean Participants
______________________________
______________________________
______________________________
______________________________
______________________________
______________________________
______________________________
______________________________
______________________________
______________________________
______________________________
______________________________
Independent-groups design Median Participant allocation
______________________________
______________________________
______________________________
______________________________
______________________________
______________________________

______________________________
______________________________
______________________________
______________________________
______________________________
______________________________
Independent variable (IV) Mode Participant selection
______________________________
______________________________
______________________________
______________________________
______________________________
______________________________
______________________________
______________________________
______________________________
______________________________
______________________________
______________________________
Inferential statistics
Negative correlation
Patient confidentiality
______________________________
______________________________
______________________________
______________________________
______________________________
______________________________
______________________________
______________________________
______________________________
Informed consent Objective data Placebo
______________________________
______________________________
______________________________
______________________________
______________________________
______________________________
______________________________
______________________________
______________________________
______________________________
______________________________
______________________________
Integrity Observation Placebo effect
______________________________
______________________________
______________________________
______________________________
______________________________
______________________________
______________________________
______________________________
______________________________
______________________________
______________________________
______________________________
Population Sample Variable
______________________________
______________________________
______________________________
______________________________
______________________________
______________________________
______________________________
______________________________
______________________________

______________________________ ______________________________ ______________________________
Positive correlation Sampling Respect for persons
______________________________
______________________________
______________________________
______________________________
______________________________
______________________________
______________________________
______________________________
______________________________
______________________________
______________________________
______________________________
Professional conduct Self-report measures Voluntary participation
______________________________
______________________________
______________________________
______________________________
______________________________
______________________________
______________________________
______________________________
______________________________
______________________________
______________________________
______________________________
Qualitative data Single-blind procedure Withdrawal rights
______________________________
______________________________
______________________________
______________________________
______________________________
______________________________
______________________________
______________________________
______________________________
______________________________
______________________________
______________________________
Quantitative date
Standard deviation
Systematic study
______________________________
______________________________
______________________________
______________________________
______________________________
______________________________
______________________________
______________________________
______________________________
______________________________
______________________________
______________________________

Random allocation
Statistical significance
Subjective data
______________________________
______________________________
______________________________
______________________________
______________________________
______________________________
______________________________
______________________________
______________________________
______________________________
______________________________
______________________________
Random sampling Stratified sampling Representative sample
______________________________
______________________________
______________________________
______________________________
______________________________
______________________________
______________________________
______________________________
______________________________
______________________________
______________________________
______________________________
Range Subject Repeated-measures design
______________________________
______________________________
______________________________
______________________________
______________________________
______________________________
______________________________
______________________________
______________________________
______________________________
______________________________
______________________________


