Table of Contents UNITED STATES SECURITIES AND EXCHANGE COMMISSION WASHINGTON, D.C. 20549 FORM 10-Q (Mark One) x QUARTERLY REPORT PURSUANT TO SECTION 13 OR 15(d) OF THE SECURITIES EXCHANGE ACT OF 1934 For the quarterly period ended March 31, 2019 - OR - ¨ TRANSITION REPORT PURSUANT TO SECTION 13 OR 15(d) OF THE SECURITIES EXCHANGE ACT OF 1934 For the transition period from to Commission file number: 001-37470 TransUnion (Exact name of registrant as specified in its charter) Delaware 61-1678417 (State or other jurisdiction of incorporation or organization) (I.R.S. Employer Identification Number) 555 West Adams, Chicago, IL 60661 (Address of principal executive offices) (Zip code) 312-985-2000 (Registrants’ telephone number, including area code) Indicate by check mark whether the registrant (1) has filed all reports required to be filed by Section 13 or 15(d) of the Securities Exchange Act of 1934 during the preceding 12 months (or for such shorter period that the registrant was required to file such reports), and (2) has been subject to such filing requirements for the past 90 days. x YES o NO Indicate by check mark whether the registrant has submitted electronically every Interactive Data File required to be submitted pursuant to Rule 405 of Regulation S-T (§232.405 of this chapter) during the preceding 12 months (or for such shorter period that the registrant was required to submit such files). x YES o NO Indicate by check mark whether the registrant is a large accelerated filer, an accelerated filer, a non-accelerated filer, smaller reporting company, or an emerging growth company. See the definitions of “large accelerated filer,” “accelerated filer,” “smaller reporting company,” and “emerging growth company” in Rule 12b-2
Transcript
Table of Contents
UNITED STATESSECURITIES AND EXCHANGE COMMISSION
WASHINGTON, D.C. 20549
FORM 10-Q
(Mark One)
x QUARTERLY REPORT PURSUANT TO SECTION 13 OR 15(d) OF THE SECURITIES EXCHANGE ACT OF1934
For the quarterly period ended March 31, 2019
- OR -
¨ TRANSITION REPORT PURSUANT TO SECTION 13 OR 15(d) OF THE SECURITIES EXCHANGE ACT OF1934
For the transition period from to
Commission file number:001-37470
TransUnion(Exact name of registrant as specified in its charter)
Delaware 61-1678417(State or other jurisdiction of
incorporation or organization) (I.R.S. Employer
Identification Number)
555 West Adams, Chicago, IL 60661(Address of principal executive offices) (Zip code)
312-985-2000(Registrants’ telephone number, including area code)
Indicate by check mark whether the registrant (1) has filed all reports required to be filed by Section 13 or 15(d) of the Securities Exchange Act of 1934 during thepreceding 12 months (or for such shorter period that the registrant was required to file such reports), and (2) has been subject to such filing requirements for thepast 90 days.
x YES o NO
Indicate by check mark whether the registrant has submitted electronically every Interactive Data File required to be submitted pursuant to Rule 405 of RegulationS-T (§232.405 of this chapter) during the preceding 12 months (or for such shorter period that the registrant was required to submit such files).
x YES o NO
Indicate by check mark whether the registrant is a large accelerated filer, an accelerated filer, a non-accelerated filer, smaller reporting company, or an emerginggrowth company. See the definitions of “large accelerated filer,” “accelerated filer,” “smaller reporting company,” and “emerging growth company” in Rule 12b-2
of the Exchange Act:
x Large accelerated filer ¨ Accelerated filer ¨ Non-accelerated filer ¨ Smaller reporting company ¨ Emerging growth company
If an emerging growth company, indicate by check mark if the registrant has elected not to use the extended transition period for complying with any new orrevised financial accounting standards provided pursuant to Section 13(a) of the Exchange Act. ¨
Indicate by check mark whether the registrant is a shell company (as defined in Rule 12b-2 of the Exchange Act).
o YES x NO As of March 31, 2019 , there were 187.3 million shares of TransUnion common stock outstanding.
Table of Contents
TRANSUNIONQUARTERLY REPORT ON FORM 10-Q
QUARTER ENDED MARCH 31, 2019TABLE OF CONTENTS
PagePART I. FINANCIAL INFORMATION 3
ITEM 1. UNAUDITED FINANCIAL STATEMENTS 3Consolidated Balance Sheets 3Consolidated Statements of Income 4Consolidated Statements of Comprehensive Income 5Consolidated Statements of Cash Flows 6Consolidated Statement of Stockholders’ Equity 7Notes to Unaudited Consolidated Financial Statements 8
ITEM 2. MANAGEMENT’S DISCUSSION AND ANALYSIS OF FINANCIAL CONDITION AND RESULTS OF OPERATIONS 25ITEM 3. QUANTITATIVE AND QUALITATIVE DISCLOSURES ABOUT MARKET RISK 39ITEM 4. CONTROLS AND PROCEDURES 39
PART II. OTHER INFORMATION 40ITEM 1. LEGAL PROCEEDINGS 40ITEM 1A. RISK FACTORS 40ITEM 2. UNREGISTERED SALES OF EQUITY SECURITIES AND USE OF PROCEEDS 40ITEM 6. EXHIBITS 41
SIGNATURES 42
2
Table of Contents
PART I. FINANCIAL INFORMATION
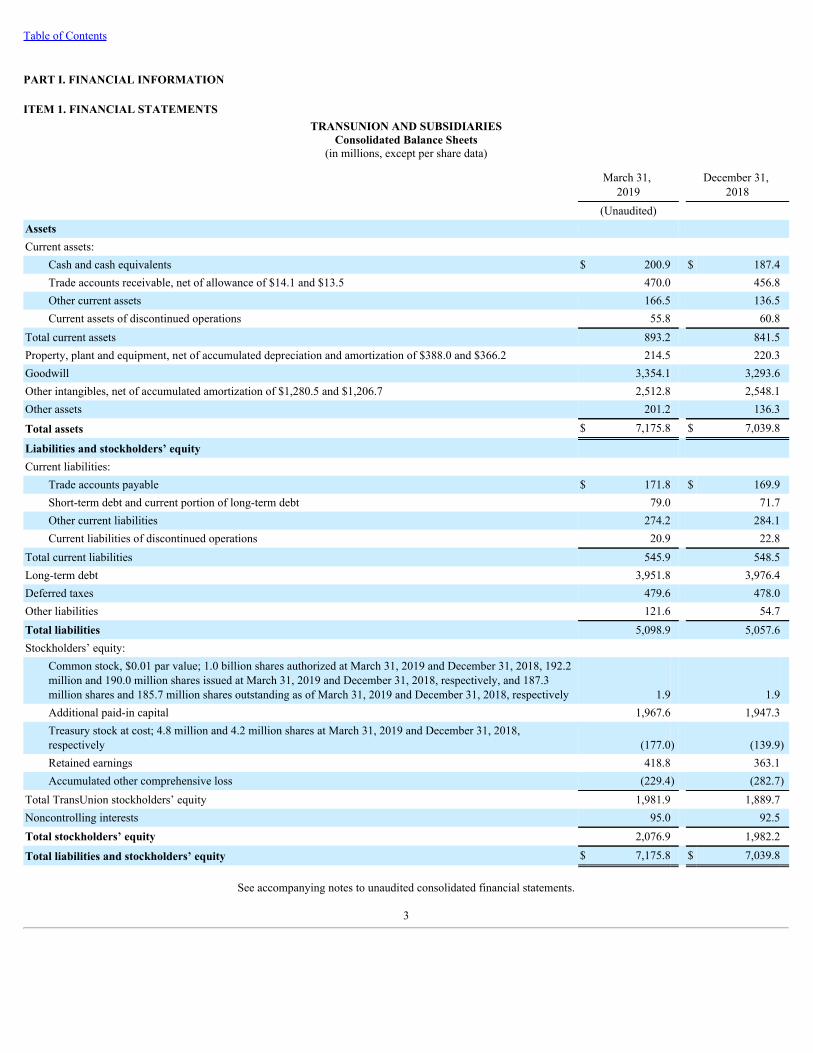
ITEM 1. FINANCIAL STATEMENTSTRANSUNION AND SUBSIDIARIES
Consolidated Balance Sheets(in millions, except per share data)
March 31,
2019 December 31,
2018
(Unaudited) Assets Current assets:
Cash and cash equivalents $ 200.9 $ 187.4Trade accounts receivable, net of allowance of $14.1 and $13.5 470.0 456.8Other current assets 166.5 136.5Current assets of discontinued operations 55.8 60.8
Total current assets 893.2 841.5Property, plant and equipment, net of accumulated depreciation and amortization of $388.0 and $366.2 214.5 220.3Goodwill 3,354.1 3,293.6Other intangibles, net of accumulated amortization of $1,280.5 and $1,206.7 2,512.8 2,548.1Other assets 201.2 136.3
Total assets $ 7,175.8 $ 7,039.8
Liabilities and stockholders’ equity Current liabilities:
Trade accounts payable $ 171.8 $ 169.9Short-term debt and current portion of long-term debt 79.0 71.7Other current liabilities 274.2 284.1Current liabilities of discontinued operations 20.9 22.8
Total current liabilities 545.9 548.5Long-term debt 3,951.8 3,976.4Deferred taxes 479.6 478.0Other liabilities 121.6 54.7Total liabilities 5,098.9 5,057.6Stockholders’ equity:
Common stock, $0.01 par value; 1.0 billion shares authorized at March 31, 2019 and December 31, 2018, 192.2million and 190.0 million shares issued at March 31, 2019 and December 31, 2018, respectively, and 187.3million shares and 185.7 million shares outstanding as of March 31, 2019 and December 31, 2018, respectively 1.9 1.9Additional paid-in capital 1,967.6 1,947.3Treasury stock at cost; 4.8 million and 4.2 million shares at March 31, 2019 and December 31, 2018,respectively (177.0) (139.9)Retained earnings 418.8 363.1Accumulated other comprehensive loss (229.4) (282.7)
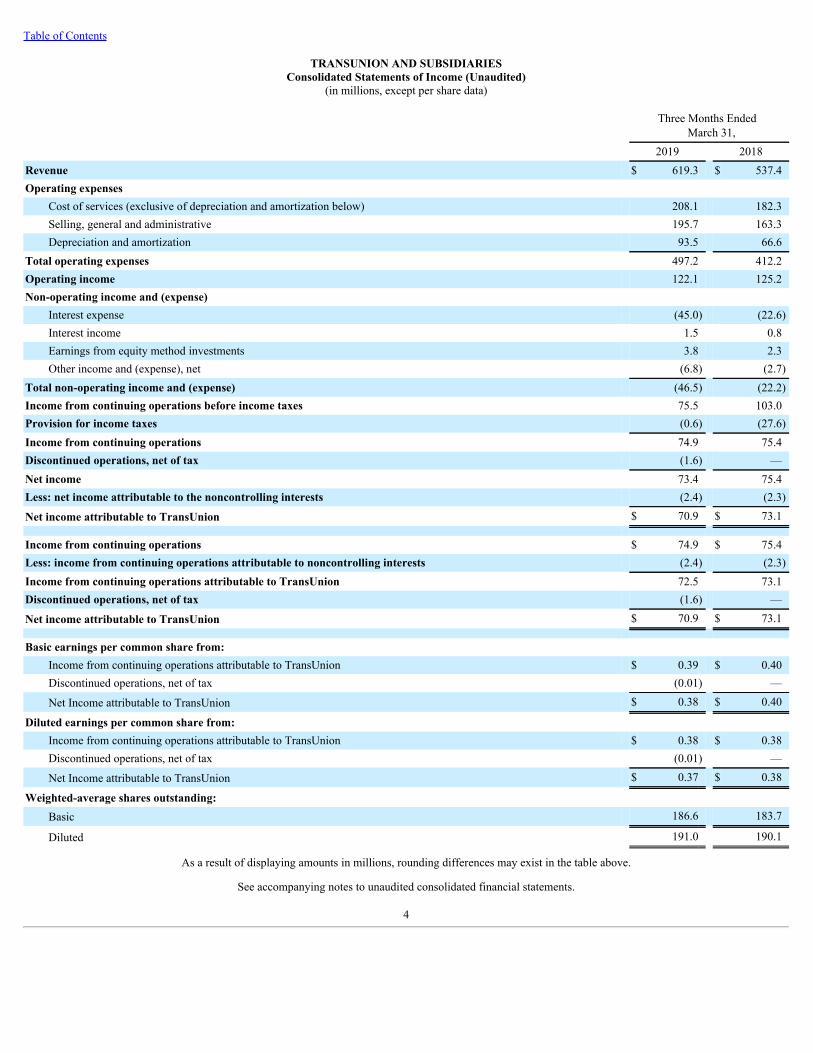
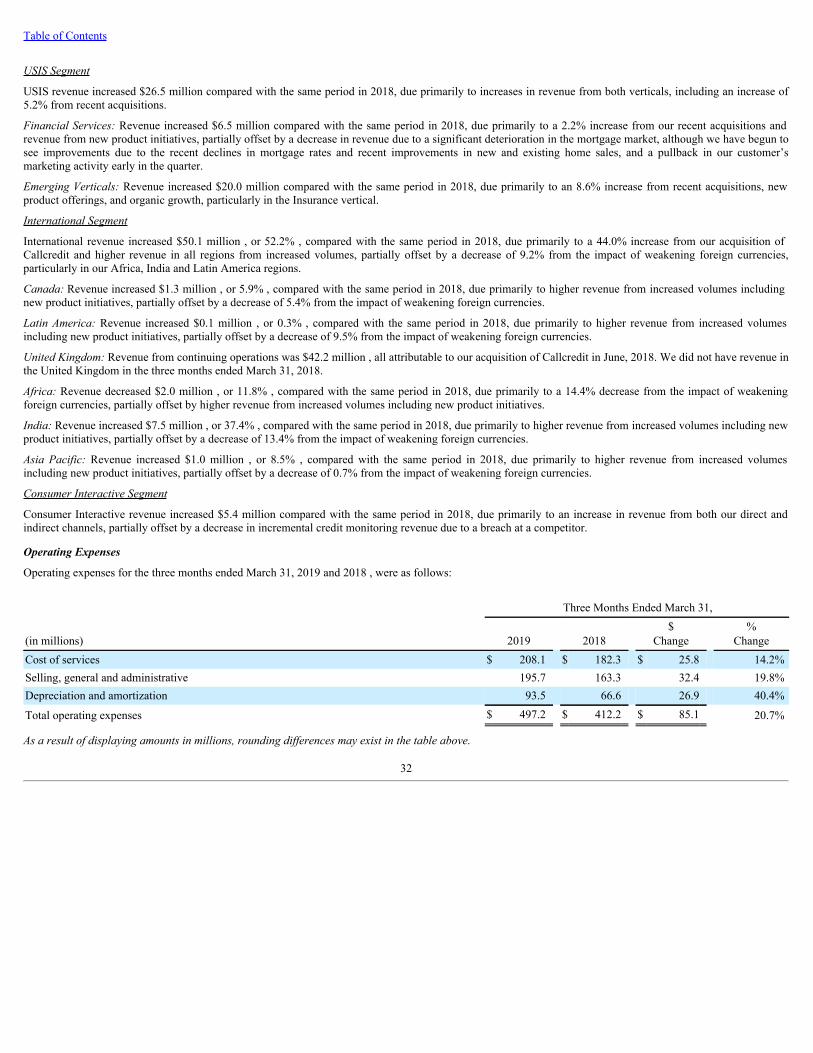
Cost of services (exclusive of depreciation and amortization below) 208.1 182.3Selling, general and administrative 195.7 163.3Depreciation and amortization 93.5 66.6
Total operating expenses 497.2 412.2Operating income 122.1 125.2Non-operating income and (expense)
Interest expense (45.0) (22.6)Interest income 1.5 0.8Earnings from equity method investments 3.8 2.3Other income and (expense), net (6.8) (2.7)
Total non-operating income and (expense) (46.5) (22.2)Income from continuing operations before income taxes 75.5 103.0Provision for income taxes (0.6) (27.6)Income from continuing operations 74.9 75.4Discontinued operations, net of tax (1.6) —Net income 73.4 75.4Less: net income attributable to the noncontrolling interests (2.4) (2.3)
Net income attributable to TransUnion $ 70.9 $ 73.1
Income from continuing operations $ 74.9 $ 75.4Less: income from continuing operations attributable to noncontrolling interests (2.4) (2.3)Income from continuing operations attributable to TransUnion 72.5 73.1Discontinued operations, net of tax (1.6) —
Net income attributable to TransUnion $ 70.9 $ 73.1
Basic earnings per common share from:
Income from continuing operations attributable to TransUnion $ 0.39 $ 0.40Discontinued operations, net of tax (0.01) —
Net Income attributable to TransUnion $ 0.38 $ 0.40
Diluted earnings per common share from: Income from continuing operations attributable to TransUnion $ 0.38 $ 0.38Discontinued operations, net of tax (0.01) —
Net Income attributable to TransUnion $ 0.37 $ 0.38
As a result of displaying amounts in millions, rounding differences may exist in the table above.
See accompanying notes to unaudited consolidated financial statements.
4
Table of Contents
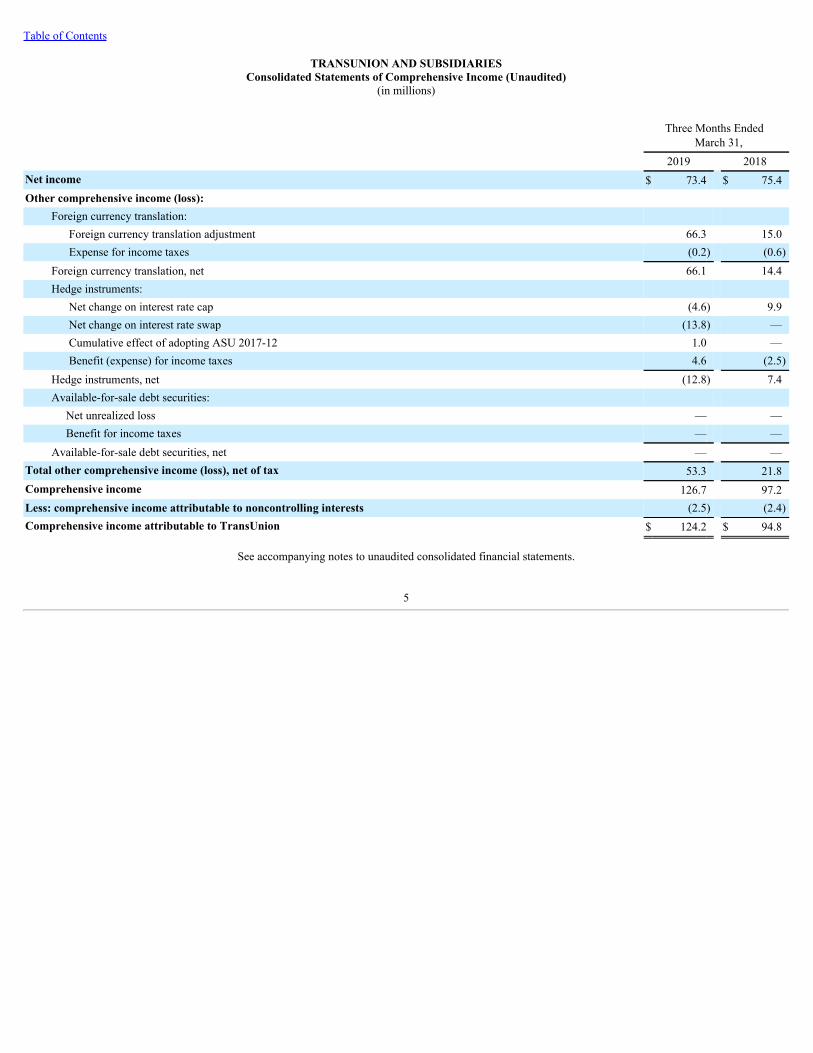
TRANSUNION AND SUBSIDIARIESConsolidated Statements of Comprehensive Income (Unaudited)
(in millions)
Three Months Ended
March 31, 2019 2018Net income $ 73.4 $ 75.4Other comprehensive income (loss): Foreign currency translation: Foreign currency translation adjustment 66.3 15.0 Expense for income taxes (0.2) (0.6) Foreign currency translation, net 66.1 14.4 Hedge instruments: Net change on interest rate cap (4.6) 9.9 Net change on interest rate swap (13.8) — Cumulative effect of adopting ASU 2017-12 1.0 — Benefit (expense) for income taxes 4.6 (2.5) Hedge instruments, net (12.8) 7.4 Available-for-sale debt securities: Net unrealized loss — — Benefit for income taxes — — Available-for-sale debt securities, net — —Total other comprehensive income (loss), net of tax 53.3 21.8Comprehensive income 126.7 97.2Less: comprehensive income attributable to noncontrolling interests (2.5) (2.4)Comprehensive income attributable to TransUnion $ 124.2 $ 94.8
See accompanying notes to unaudited consolidated financial statements.
5
Table of Contents
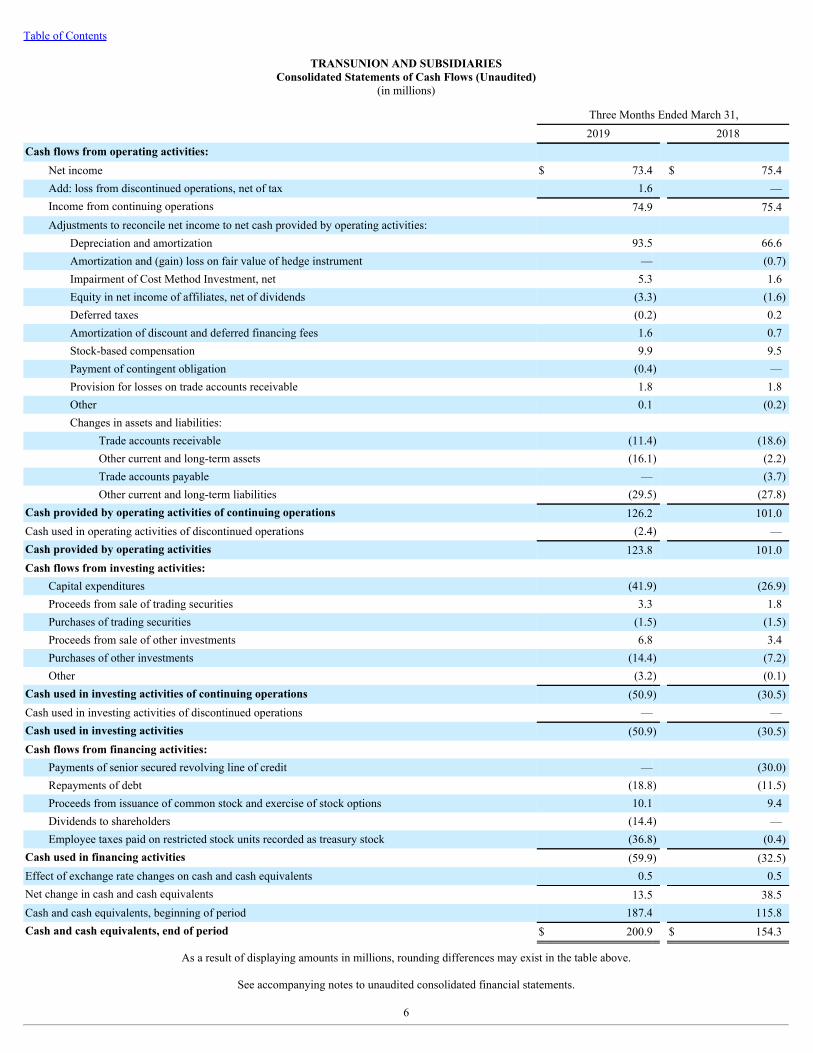
TRANSUNION AND SUBSIDIARIESConsolidated Statements of Cash Flows (Unaudited)
(in millions)
Three Months Ended March 31, 2019 2018Cash flows from operating activities:
Net income $ 73.4 $ 75.4Add: loss from discontinued operations, net of tax 1.6 —Income from continuing operations 74.9 75.4Adjustments to reconcile net income to net cash provided by operating activities:
Depreciation and amortization 93.5 66.6Amortization and (gain) loss on fair value of hedge instrument — (0.7)Impairment of Cost Method Investment, net 5.3 1.6Equity in net income of affiliates, net of dividends (3.3) (1.6)Deferred taxes (0.2) 0.2Amortization of discount and deferred financing fees 1.6 0.7Stock-based compensation 9.9 9.5Payment of contingent obligation (0.4) —Provision for losses on trade accounts receivable 1.8 1.8Other 0.1 (0.2)Changes in assets and liabilities:
Trade accounts receivable (11.4) (18.6)Other current and long-term assets (16.1) (2.2)Trade accounts payable — (3.7)Other current and long-term liabilities (29.5) (27.8)
Cash provided by operating activities of continuing operations 126.2 101.0Cash used in operating activities of discontinued operations (2.4) —Cash provided by operating activities 123.8 101.0Cash flows from investing activities:
Capital expenditures (41.9) (26.9)Proceeds from sale of trading securities 3.3 1.8Purchases of trading securities (1.5) (1.5)Proceeds from sale of other investments 6.8 3.4Purchases of other investments (14.4) (7.2)Other (3.2) (0.1)
Cash used in investing activities of continuing operations (50.9) (30.5)Cash used in investing activities of discontinued operations — —Cash used in investing activities (50.9) (30.5)Cash flows from financing activities:
Payments of senior secured revolving line of credit — (30.0)Repayments of debt (18.8) (11.5)Proceeds from issuance of common stock and exercise of stock options 10.1 9.4Dividends to shareholders (14.4) —Employee taxes paid on restricted stock units recorded as treasury stock (36.8) (0.4)
Cash used in financing activities (59.9) (32.5)Effect of exchange rate changes on cash and cash equivalents 0.5 0.5Net change in cash and cash equivalents 13.5 38.5Cash and cash equivalents, beginning of period 187.4 115.8Cash and cash equivalents, end of period $ 200.9 $ 154.3
As a result of displaying amounts in millions, rounding differences may exist in the table above.
See accompanying notes to unaudited consolidated financial statements.
6
Table of Contents
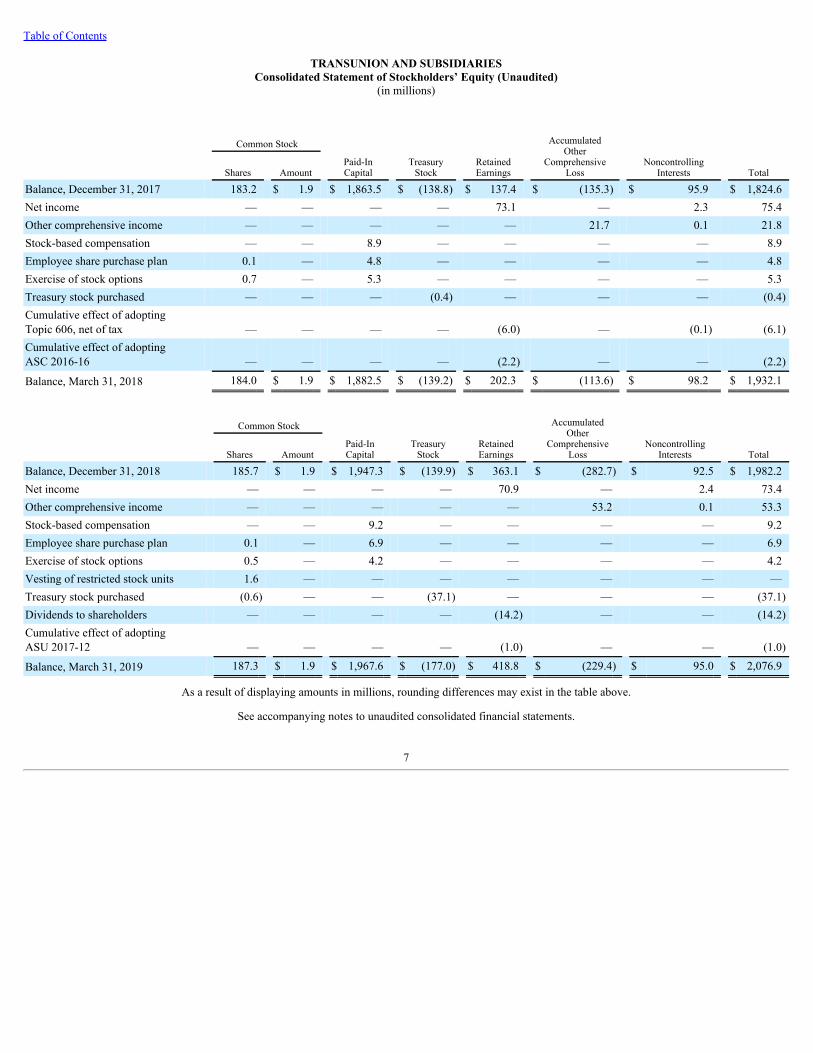
TRANSUNION AND SUBSIDIARIESConsolidated Statement of Stockholders’ Equity (Unaudited)
As a result of displaying amounts in millions, rounding differences may exist in the table above.
See accompanying notes to unaudited consolidated financial statements.
7
Table of Contents
TRANSUNION AND SUBSIDIARIESNotes to Unaudited Consolidated Financial Statements
1. Significant Accounting and Reporting Policies
Basis of Presentation
Unless the context indicates otherwise, any reference in this report to the “Company,” “we,” “our,” “us,” and “its” refers to TransUnion and its consolidatedsubsidiaries, collectively.
The accompanying unaudited consolidated financial statements of TransUnion and subsidiaries have been prepared in accordance with U.S. generally acceptedaccounting principles (“GAAP”) for interim financial information. In the opinion of management, all adjustments, including normal recurring adjustments,considered necessary for a fair presentation have been included. All significant intercompany transactions and balances have been eliminated. The operating resultsof TransUnion for the periods presented are not necessarily indicative of the results that may be expected for the full year ending December 31, 2019 . Theseunaudited consolidated financial statements should be read in conjunction with our audited financial statements included in our Annual Report on Form 10-K forthe year ended December 31, 2018 , filed with the Securities and Exchange Commission (“SEC”) on February 14, 2019.
Subsequent Events
Events and transactions occurring through the date of issuance of the financial statements have been evaluated by management and, when appropriate, recognizedor disclosed in the financial statements or notes to the consolidated financial statements.
Principles of Consolidation
The consolidated financial statements of TransUnion include the accounts of TransUnion and all of its controlled subsidiaries. Investments in nonmarketableunconsolidated entities in which the Company is able to exercise significant influence are accounted for using the equity method. Investments in nonmarketableunconsolidated entities in which the Company is not able to exercise significant influence, our “Cost Method Investments,” are accounted for at our initial cost,minus any impairment, plus or minus changes resulting from observable price changes in orderly transactions for the identical or a similar investment of the sameissuer.
Recently Adopted Accounting Pronouncements
On February 25, 2016, the FASB issued ASU 2016-02, Leases (Topic 842) . During 2018 and 2019, the FASB issued additional guidance related to the newstandard. This series of comprehensive guidance, among other things, requires us to record the discounted present value of all future lease payments as a liabilityon our balance sheet, as well as a corresponding “right-of-use” (“ROU”) asset, which is an asset that represents the right to use or control the use of a specifiedasset for the lease term, for all long-term leases. Under the new standard, disclosures are required to meet the objective of enabling users of financial statements toassess the amount, timing, and uncertainty of cash flows arising from leases. We have adopted this guidance effective January 1, 2019, on a modified retrospectivebasis, as of the beginning of the period adopted, including the package of practical expedients available per paragraph 842-10-65-1(f). On March 31, 2019, and oneach reporting date thereafter, we recognize an operating lease liability and offsetting ROU asset on our Consolidated Balance Sheet, with no other impact to ourConsolidated Financial Statements. See Note 5, “Other Assets,” Note 7 “Other Current Liabilities,” Note 8, “Other Liabilities” and Note 10, “Leases” foradditional information and the new required disclosures.
On August 28, 2017, the FASB issued ASU No. 2017-12, Derivatives and Hedging (Topic 815): Targeted Improvements to Accounting for Hedging Activities. Thenew standard is intended to improve and simplify accounting rules around hedge accounting. The guidance is effective for annual reporting periods beginning afterDecember 15, 2018, including interim periods therein. The new guidance eliminates the requirement to separately measure and report hedge ineffectiveness. Forour cash flow hedges, this means that the entire change in the fair value of the hedging instrument included in the assessment of hedge effectiveness is nowrecorded in other comprehensive income, and reclassified to earnings in the same income statement line item that is used to present the earnings effect of thehedged item when the hedged item affects earnings. We have adopted this ASU and related amendments effective January 1, 2019, and have applied the modifiedretrospective transition method that allows for a cumulative-effect adjustment to reclassify cumulative ineffectiveness previously recorded in other comprehensiveincome to retained earnings in the period of adoption. The adjustment was not material to our consolidated financial statements.
On February 14, 2018, the FASB issued ASU 2018-02, Income Statement-Reporting Comprehensive Income (Topic 220): Reclassification of Certain Tax Effectsfrom Accumulated Other Comprehensive Income. These amendments provide an option to reclassify stranded tax effects within accumulated other comprehensiveincome to retained earnings in each period in which the effect of the change in the U.S. federal corporate income tax rate in the Tax Cuts and Jobs Act (the “Act”)is recorded. This guidance is effective for fiscal years beginning after December 15, 2018, and interim periods therein. We have elected to not reclassify the
8
Table of Contents
stranded tax effects within accumulated other comprehensive income to retained earnings and therefore there is no impact on our consolidated financial statements.
On August 27, 2018, the FASB issued ASU 2018-13 Fair Value Measurement (Topic 820): Disclosure Framework—Changes to the Disclosure Requirements forFair Value Measurement. These amendments modify the disclosure requirements in Topic 820 by removing, adding or modifying certain fair value measurementdisclosures. This guidance is effective for fiscal years beginning after December 15, 2018, and interim periods therein. This new guidance only impacts ourdisclosures, with no impact to our current disclosures.
Recent Accounting Pronouncements Not Yet Adopted
On June 16, 2016, the FASB issued ASU No. 2016-13, Financial Instruments - Credit Losses (Topic 326): Measurement of Credit Losses on FinancialInstruments. This ASU amends the accounting for credit losses on available-for-sale debt securities and purchased financial assets with credit deterioration. Inaddition, these amendments require the measurement of all expected credit losses for financial assets, including trade accounts receivable, held at the reporting datebased on historical experience, current conditions, and reasonable and supportable forecasts. This guidance is effective for annual reporting periods beginning afterDecember 15, 2019, including interim periods therein. We are currently assessing the impact this guidance will have on our consolidated financial statements.
2. Business Acquisitions
Callcredit Acquisition
On June 19, 2018 , we acquired 100% of the equity of Callcredit Information Group, Ltd. (“Callcredit”) for $1,408.2 million in cash, funded primarily byadditional borrowings against our Senior Secured Credit Facility. See Note 9, “Debt,” for additional information about our Senior Secured Credit Facility. Therewas no contingent consideration resulting from this transaction. Callcredit, founded in 2000, is a United Kingdom-based information solutions company that, likeTransUnion, provides data, analytics and technology solutions to help businesses and consumers make informed decisions. International expansion is a key growthstrategy for TransUnion, and we expect to leverage strong synergies across TransUnion’s and Callcredit’s business models and solutions.
We have identified and categorized certain operations of Callcredit that we do not consider core to our business as discontinued operations of our Internationalsegment as of the date of acquisition. These discontinued operations consist of businesses that do not align with our stated strategic objectives. As of the date ofthis filing, we have closed on the sale of three of the businesses and expect to sell the remaining two businesses within one year of our acquisition date. We do notexpect to have a significant continuing involvement with any of these operations after the date of disposal. We have categorized the assets and liabilities of thesediscontinued operations on separate lines on the face of our balance sheet and in the table below. These amounts are based on estimates that will be refined as wecomplete the fair-value allocation of the purchase price of Callcredit.
9
Table of Contents
Purchase Price Allocation
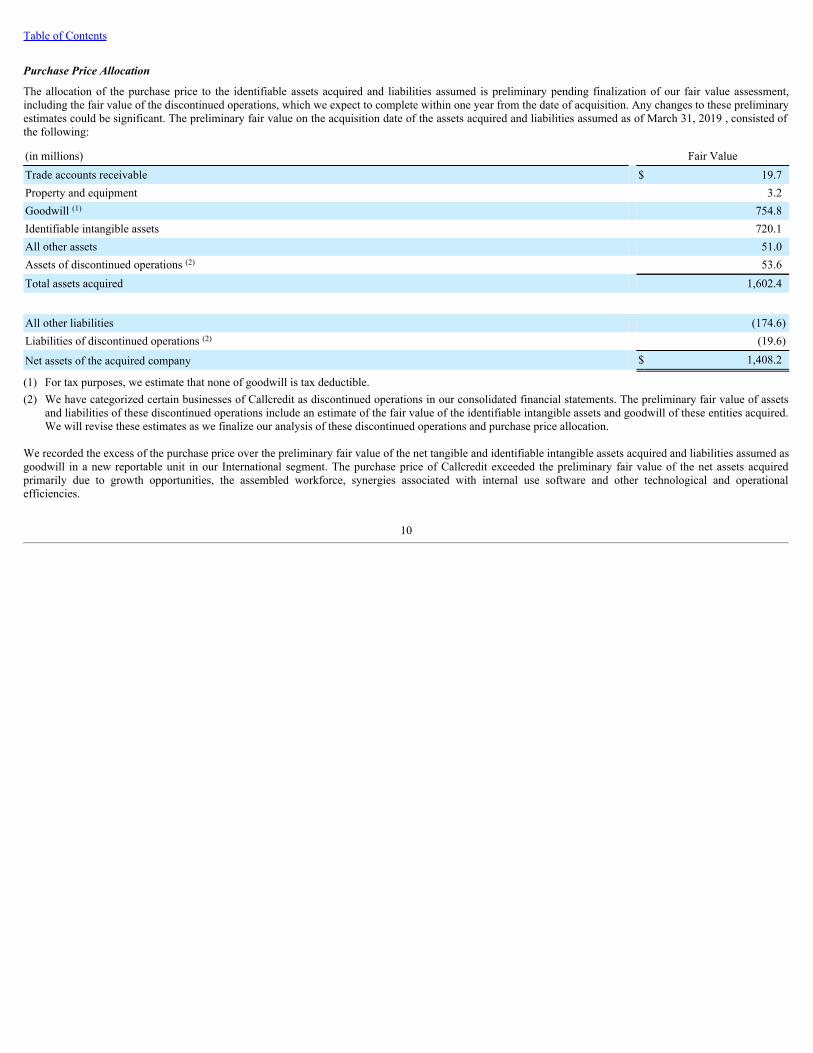
The allocation of the purchase price to the identifiable assets acquired and liabilities assumed is preliminary pending finalization of our fair value assessment,including the fair value of the discontinued operations, which we expect to complete within one year from the date of acquisition. Any changes to these preliminaryestimates could be significant. The preliminary fair value on the acquisition date of the assets acquired and liabilities assumed as of March 31, 2019 , consisted ofthe following:
(in millions) Fair ValueTrade accounts receivable $ 19.7Property and equipment 3.2Goodwill (1) 754.8Identifiable intangible assets 720.1All other assets 51.0Assets of discontinued operations (2) 53.6Total assets acquired 1,602.4
All other liabilities (174.6)Liabilities of discontinued operations (2) (19.6)
Net assets of the acquired company $ 1,408.2
(1) For tax purposes, we estimate that none of goodwill is tax deductible.(2) We have categorized certain businesses of Callcredit as discontinued operations in our consolidated financial statements. The preliminary fair value of assets
and liabilities of these discontinued operations include an estimate of the fair value of the identifiable intangible assets and goodwill of these entities acquired.We will revise these estimates as we finalize our analysis of these discontinued operations and purchase price allocation.
We recorded the excess of the purchase price over the preliminary fair value of the net tangible and identifiable intangible assets acquired and liabilities assumed asgoodwill in a new reportable unit in our International segment. The purchase price of Callcredit exceeded the preliminary fair value of the net assets acquiredprimarily due to growth opportunities, the assembled workforce, synergies associated with internal use software and other technological and operationalefficiencies.
10
Table of Contents
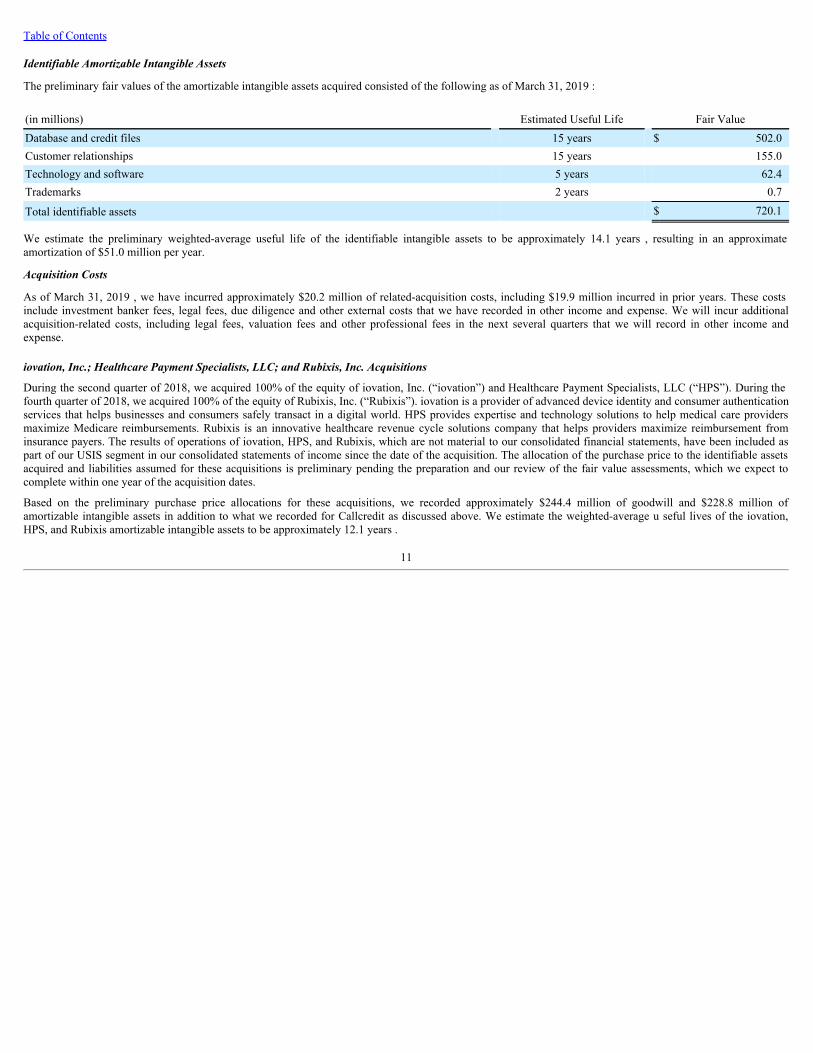
Identifiable Amortizable Intangible Assets
The preliminary fair values of the amortizable intangible assets acquired consisted of the following as of March 31, 2019 :
(in millions) Estimated Useful Life Fair ValueDatabase and credit files 15 years $ 502.0Customer relationships 15 years 155.0Technology and software 5 years 62.4Trademarks 2 years 0.7
Total identifiable assets $ 720.1
We estimate the preliminary weighted-average useful life of the identifiable intangible assets to be approximately 14.1 years , resulting in an approximateamortization of $51.0 million per year.
Acquisition Costs
As of March 31, 2019 , we have incurred approximately $20.2 million of related-acquisition costs, including $19.9 million incurred in prior years. These costsinclude investment banker fees, legal fees, due diligence and other external costs that we have recorded in other income and expense. We will incur additionalacquisition-related costs, including legal fees, valuation fees and other professional fees in the next several quarters that we will record in other income andexpense.
iovation, Inc.; Healthcare Payment Specialists, LLC; and Rubixis, Inc. Acquisitions
During the second quarter of 2018, we acquired 100% of the equity of iovation, Inc. (“iovation”) and Healthcare Payment Specialists, LLC (“HPS”). During thefourth quarter of 2018, we acquired 100% of the equity of Rubixis, Inc. (“Rubixis”). iovation is a provider of advanced device identity and consumer authenticationservices that helps businesses and consumers safely transact in a digital world. HPS provides expertise and technology solutions to help medical care providersmaximize Medicare reimbursements. Rubixis is an innovative healthcare revenue cycle solutions company that helps providers maximize reimbursement frominsurance payers. The results of operations of iovation, HPS, and Rubixis, which are not material to our consolidated financial statements, have been included aspart of our USIS segment in our consolidated statements of income since the date of the acquisition. The allocation of the purchase price to the identifiable assetsacquired and liabilities assumed for these acquisitions is preliminary pending the preparation and our review of the fair value assessments, which we expect tocomplete within one year of the acquisition dates.
Based on the preliminary purchase price allocations for these acquisitions, we recorded approximately $244.4 million of goodwill and $228.8 million ofamortizable intangible assets in addition to what we recorded for Callcredit as discussed above. We estimate the weighted-average u seful lives of the iovation,HPS, and Rubixis amortizable intangible assets to be approximately 12.1 years .
11
Table of Contents
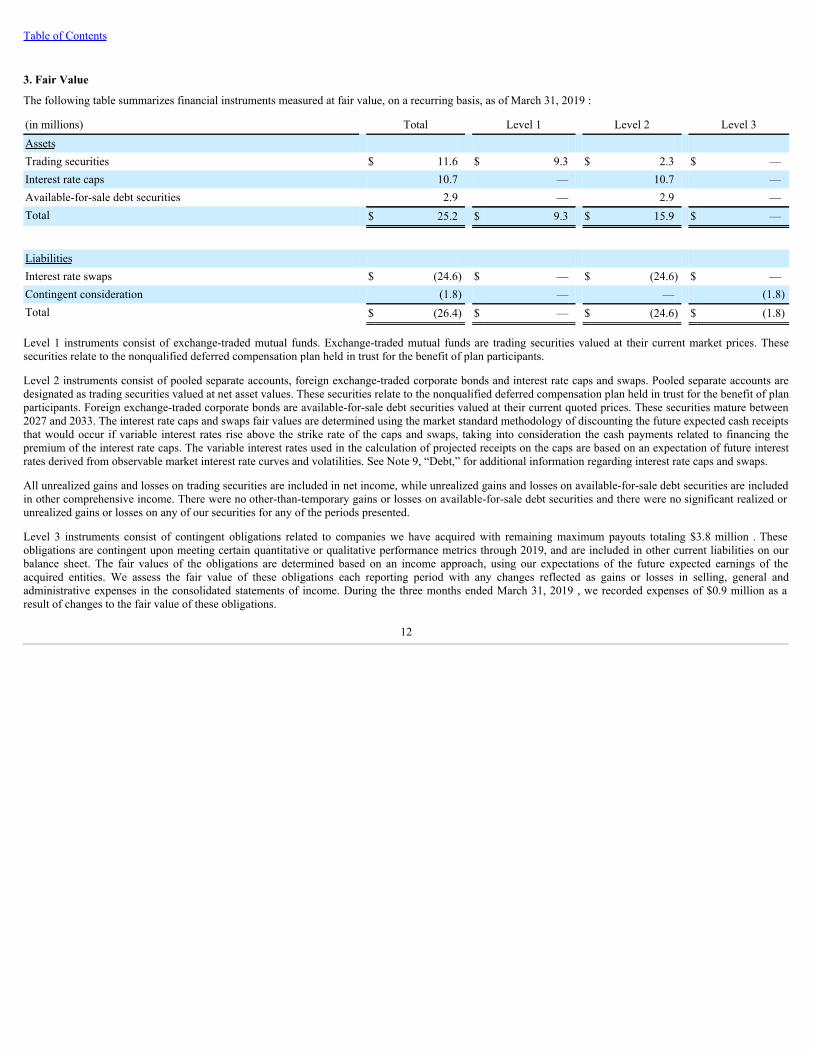
3. Fair Value
The following table summarizes financial instruments measured at fair value, on a recurring basis, as of March 31, 2019 :
Level 1 instruments consist of exchange-traded mutual funds. Exchange-traded mutual funds are trading securities valued at their current market prices. Thesesecurities relate to the nonqualified deferred compensation plan held in trust for the benefit of plan participants.
Level 2 instruments consist of pooled separate accounts, foreign exchange-traded corporate bonds and interest rate caps and swaps. Pooled separate accounts aredesignated as trading securities valued at net asset values. These securities relate to the nonqualified deferred compensation plan held in trust for the benefit of planparticipants. Foreign exchange-traded corporate bonds are available-for-sale debt securities valued at their current quoted prices. These securities mature between2027 and 2033. The interest rate caps and swaps fair values are determined using the market standard methodology of discounting the future expected cash receiptsthat would occur if variable interest rates rise above the strike rate of the caps and swaps, taking into consideration the cash payments related to financing thepremium of the interest rate caps. The variable interest rates used in the calculation of projected receipts on the caps are based on an expectation of future interestrates derived from observable market interest rate curves and volatilities. See Note 9, “Debt,” for additional information regarding interest rate caps and swaps.
All unrealized gains and losses on trading securities are included in net income, while unrealized gains and losses on available-for-sale debt securities are includedin other comprehensive income. There were no other-than-temporary gains or losses on available-for-sale debt securities and there were no significant realized orunrealized gains or losses on any of our securities for any of the periods presented.
Level 3 instruments consist of contingent obligations related to companies we have acquired with remaining maximum payouts totaling $3.8 million . Theseobligations are contingent upon meeting certain quantitative or qualitative performance metrics through 2019, and are included in other current liabilities on ourbalance sheet. The fair values of the obligations are determined based on an income approach, using our expectations of the future expected earnings of theacquired entities. We assess the fair value of these obligations each reporting period with any changes reflected as gains or losses in selling, general andadministrative expenses in the consolidated statements of income. During the three months ended March 31, 2019 , we recorded expenses of $0.9 million as aresult of changes to the fair value of these obligations.
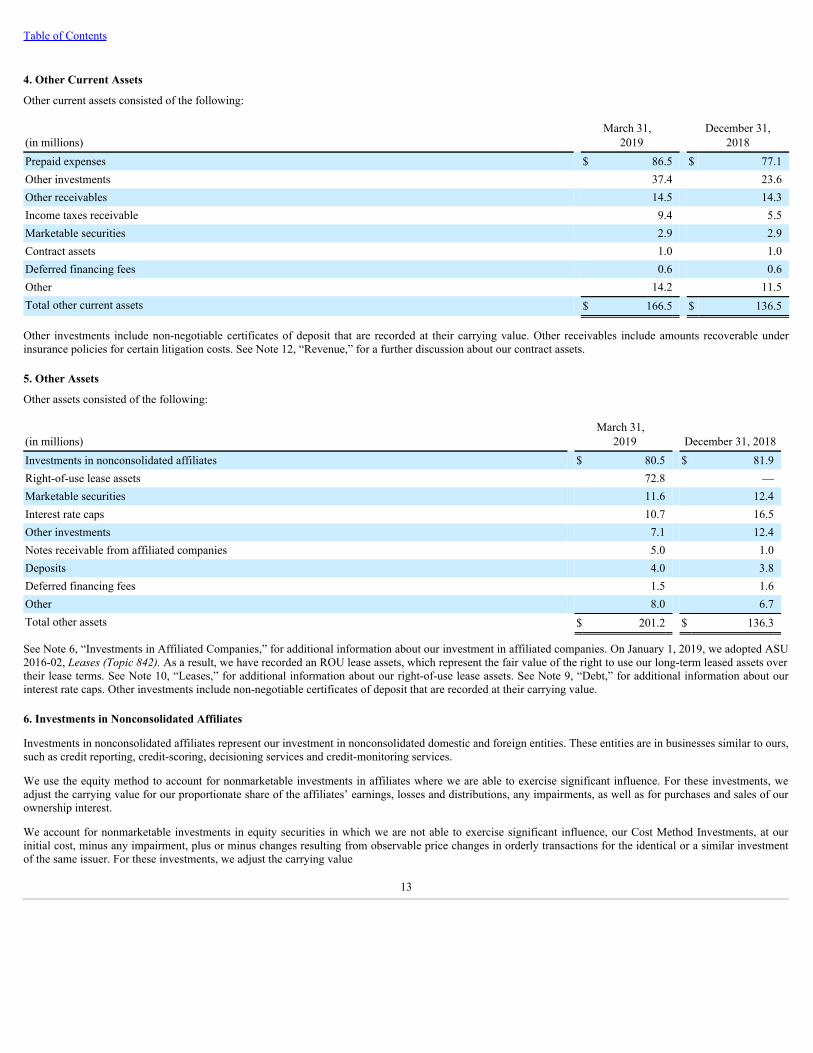
Other investments include non-negotiable certificates of deposit that are recorded at their carrying value. Other receivables include amounts recoverable underinsurance policies for certain litigation costs. See Note 12, “Revenue,” for a further discussion about our contract assets.
See Note 6, “Investments in Affiliated Companies,” for additional information about our investment in affiliated companies. On January 1, 2019, we adopted ASU2016-02, Leases (Topic 842). As a result, we have recorded an ROU lease assets, which represent the fair value of the right to use our long-term leased assets overtheir lease terms. See Note 10, “Leases,” for additional information about our right-of-use lease assets. See Note 9, “Debt,” for additional information about ourinterest rate caps. Other investments include non-negotiable certificates of deposit that are recorded at their carrying value.
6. Investments in Nonconsolidated Affiliates
Investments in nonconsolidated affiliates represent our investment in nonconsolidated domestic and foreign entities. These entities are in businesses similar to ours,such as credit reporting, credit-scoring, decisioning services and credit-monitoring services.
We use the equity method to account for nonmarketable investments in affiliates where we are able to exercise significant influence. For these investments, weadjust the carrying value for our proportionate share of the affiliates’ earnings, losses and distributions, any impairments, as well as for purchases and sales of ourownership interest.
We account for nonmarketable investments in equity securities in which we are not able to exercise significant influence, our Cost Method Investments, at ourinitial cost, minus any impairment, plus or minus changes resulting from observable price changes in orderly transactions for the identical or a similar investmentof the same issuer. For these investments, we adjust the carrying value
13
Table of Contents
for any purchases or sales of our ownership interests. We record any dividends received from these investments as other income in non-operating income andexpense.
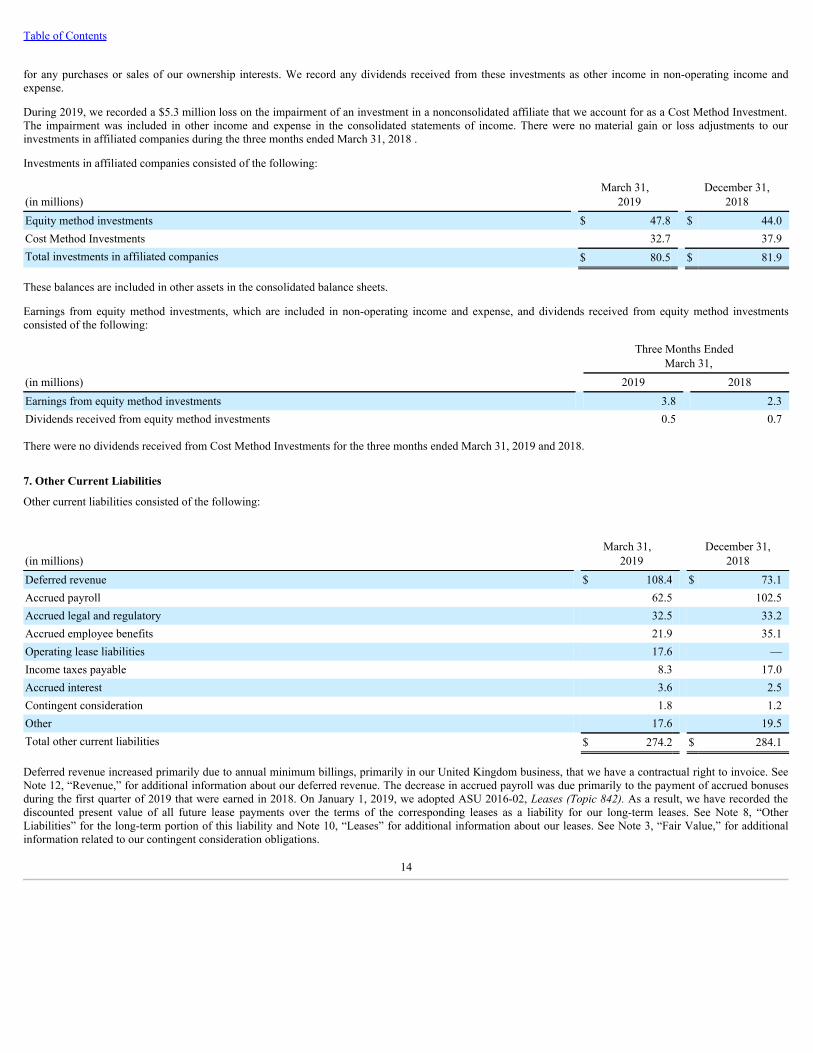
During 2019, we recorded a $5.3 million loss on the impairment of an investment in a nonconsolidated affiliate that we account for as a Cost Method Investment.The impairment was included in other income and expense in the consolidated statements of income. There were no material gain or loss adjustments to ourinvestments in affiliated companies during the three months ended March 31, 2018 .
Investments in affiliated companies consisted of the following:
These balances are included in other assets in the consolidated balance sheets.
Earnings from equity method investments, which are included in non-operating income and expense, and dividends received from equity method investmentsconsisted of the following:
Three Months Ended
March 31,(in millions) 2019 2018Earnings from equity method investments 3.8 2.3Dividends received from equity method investments 0.5 0.7
There were no dividends received from Cost Method Investments for the three months ended March 31, 2019 and 2018.
7. Other Current Liabilities
Other current liabilities consisted of the following:
Deferred revenue increased primarily due to annual minimum billings, primarily in our United Kingdom business, that we have a contractual right to invoice. SeeNote 12, “Revenue,” for additional information about our deferred revenue. The decrease in accrued payroll was due primarily to the payment of accrued bonusesduring the first quarter of 2019 that were earned in 2018. On January 1, 2019, we adopted ASU 2016-02, Leases (Topic 842). As a result, we have recorded thediscounted present value of all future lease payments over the terms of the corresponding leases as a liability for our long-term leases. See Note 8, “OtherLiabilities” for the long-term portion of this liability and Note 10, “Leases” for additional information about our leases. See Note 3, “Fair Value,” for additionalinformation related to our contingent consideration obligations.
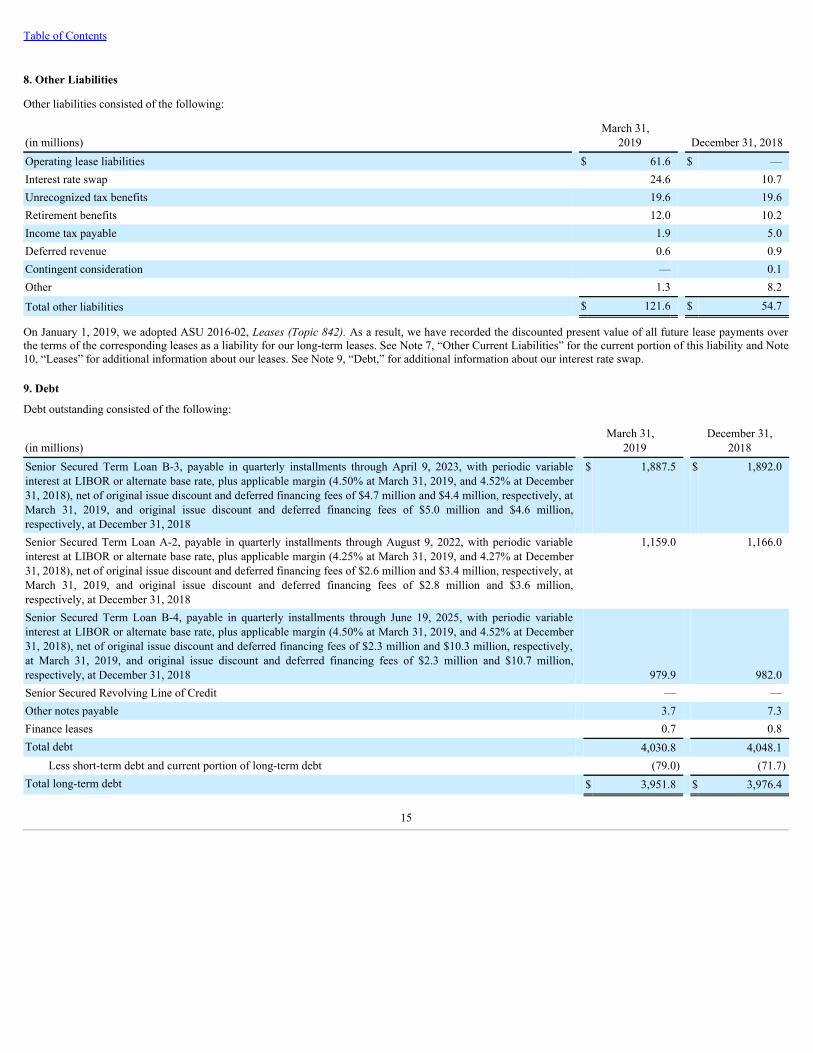
On January 1, 2019, we adopted ASU 2016-02, Leases (Topic 842). As a result, we have recorded the discounted present value of all future lease payments overthe terms of the corresponding leases as a liability for our long-term leases. See Note 7, “Other Current Liabilities” for the current portion of this liability and Note10, “Leases” for additional information about our leases. See Note 9, “Debt,” for additional information about our interest rate swap.
9. Debt
Debt outstanding consisted of the following:
(in millions) March 31,
2019 December 31,
2018Senior Secured Term Loan B-3, payable in quarterly installments through April 9, 2023, with periodic variableinterest at LIBOR or alternate base rate, plus applicable margin (4.50% at March 31, 2019, and 4.52% at December31, 2018), net of original issue discount and deferred financing fees of $4.7 million and $4.4 million, respectively, atMarch 31, 2019, and original issue discount and deferred financing fees of $5.0 million and $4.6 million,respectively, at December 31, 2018
$ 1,887.5
$ 1,892.0
Senior Secured Term Loan A-2, payable in quarterly installments through August 9, 2022, with periodic variableinterest at LIBOR or alternate base rate, plus applicable margin (4.25% at March 31, 2019, and 4.27% at December31, 2018), net of original issue discount and deferred financing fees of $2.6 million and $3.4 million, respectively, atMarch 31, 2019, and original issue discount and deferred financing fees of $2.8 million and $3.6 million,respectively, at December 31, 2018
1,159.0
1,166.0
Senior Secured Term Loan B-4, payable in quarterly installments through June 19, 2025, with periodic variableinterest at LIBOR or alternate base rate, plus applicable margin (4.50% at March 31, 2019, and 4.52% at December31, 2018), net of original issue discount and deferred financing fees of $2.3 million and $10.3 million, respectively,at March 31, 2019, and original issue discount and deferred financing fees of $2.3 million and $10.7 million,respectively, at December 31, 2018 979.9 982.0Senior Secured Revolving Line of Credit — —Other notes payable 3.7 7.3Finance leases 0.7 0.8Total debt 4,030.8 4,048.1
Less short-term debt and current portion of long-term debt (79.0) (71.7)Total long-term debt $ 3,951.8 $ 3,976.4
15
Table of Contents
Senior Secured Credit Facility
On June 15, 2010, we entered into a senior secured credit facility with various lenders. This facility has been amended several times and currently consists of theSenior Secured Term Loan A-2, the Senior Secured Term Loan B-3, the Senior Secured Term Loan B-4 and the Senior Secured Revolving Line of Credit.
On June 19, 2018, we borrowed an additional $800.0 million against our Senior Secured Term Loan A-2 and $600.0 million against a new tranche 4 of our SeniorSecured Term Loan B (“Senior Secured Term Loan B-4”) to fund the acquisition of Callcredit. On June 29, 2018, we borrowed an additional $400.0 million of ourSenior Secured Term Loan B-4 to fund another acquisition and to repay a portion of our Senior Secured Revolving Line of Credit.
As of March 31, 2019 , we had no outstanding balance under the Senior Secured Revolving Line of Credit and $0.1 million of outstanding letters of credit, andcould have borrowed up to the remaining $299.9 million available.
TransUnion also has the ability to request incremental loans on the same terms under the existing senior secured credit facility up to the greater of an additional$675.0 million and 100% of Consolidated EBITDA. Consolidated EBITDA is reduced to the extent that the senior secured net leverage ratio is above 4.25 -to-1. Inaddition, so long as the senior secured net leverage ratio does not exceed 4.25 -to-1.0, we may incur additional incremental loans, subject to certain additionalconditions and commitments by existing or new lenders to fund any additional borrowings.
With certain exceptions, the senior secured credit facility obligations are secured by a first-priority security interest in substantially all of the assets of Trans UnionLLC, including its investment in subsidiaries. The senior secured credit facility contains various restrictions and nonfinancial covenants, along with a seniorsecured net leverage ratio test. The nonfinancial covenants include restrictions on dividends, investments, dispositions, future borrowings and other specifiedpayments, as well as additional reporting and disclosure requirements. The senior secured net leverage test must be met as a condition to incur additionalindebtedness, make certain investments, and may be required to make certain restricted payments. The senior secured net leverage ratio must not exceed 5.5 -to-1at any such test date. TransUnion may make dividend payments up to an unlimited amount under the terms of the senior secured credit facility provided that nodefault or event of default exists and so long as the total net leverage ratio does not exceed 4.75 -to-1. As of March 31, 2019 , we were in compliance with all debtcovenants.
On December 17, 2018, we entered into interest rate swap agreements with various counterparties that effectively fixed our LIBOR exposure on a portion of ourexisting senior secured term loans or similar replacement debt at approximately 2.647% to 2.706% . We have designated these swap agreements as cash flowhedges. The current aggregate notional amount under these agreements is $1,445.0 million , decreasing each quarter until the second agreement terminates onDecember 30, 2022.
On December 18, 2015, we entered into interest rate cap agreements with various counterparties that effectively cap our LIBOR exposure on a portion of ourexisting senior secured term loans or similar replacement debt at 0.75% beginning June 30, 2016. We have designated these cap agreements as cash flow hedges.The current aggregate notional amount under these agreements is $1,443.9 million and will decrease each quarter until the agreement terminates on June 30, 2020.In July 2016, we began to pay the various counterparties a fixed rate on the outstanding notional amounts of between 0.98% and 0.994% and receive payments tothe extent LIBOR exceeds 0.75% .
Based on how the fair value of interest rate caps are determined, the earlier interest periods have lower fair values at inception than the later interest periods,resulting in less interest expense being recognized in the earlier periods compared with the later periods. Any payments we receive to the extent LIBOR exceeds0.75% is also reclassified from other comprehensive income to interest expense in the period received.
In accordance with ASU No. 2017-12, Derivatives and Hedging (Topic 815): Targeted Improvements to Accounting for Hedging Activities, the new guidanceeliminates the requirement to separately measure and report hedge ineffectiveness. For our cash flow hedges, this means that the entire change in the fair value ofthe hedging instrument included in our assessment of hedge effectiveness is now recorded in other comprehensive income, and reclassified to interest expensewhen the corresponding hedged debt affects earnings.
The change in the fair value of the swaps resulted in an unrealized loss of $13.8 million ( $10.4 million , net of tax) for the three months ended March 31, 2019 ,recorded in other comprehensive income . Interest expense on the swaps in the three months ended March 31, 2019 was expense of $0.5 million ( $0.3 million netof tax). We expect to recognize a loss of approximately $3.9 million as interest expense due to our expectation that LIBOR will exceed the fixed rates of interestover the next twelve months.
Th e change in the fair value of the caps resulted in an unrealized loss of $4.6 million ( $3.4 million . net of tax) and gain of $9.9 million ( $7.4 million , net of tax)for the three months ended March 31, 2019 and 2018 , respectively, recorded in other comprehensive income. Interest expense reclassified from othercomprehensive income to interest expense related to the fair value of the portion of the caps expiring in the three months ended March 31, 2019 and 2018 , wasincome of $1.6 million ( $1.0 million net of tax) and
16
Table of Contents
expense of $0.2 million ( $0.1 million net of tax), respectively. We expect to reclassify a gain of approximately $3.2 million from other comprehensive income tointerest expense related to the fair value of the portion of the caps expiring and payments received to the extent LIBOR exceeds 0.75% in the next twelve months.
Fair Value of Debt
As of March 31, 2019 , the fair value of our variable-rate Senior Secured Term Loan A-2, excluding original issue discounts and deferred fees, approximates thecarrying value. As of March 31, 2019 , the fair value of our Senior Secured Term Loan B-3 and B-4, excluding original issue discounts and deferred fees, was$1,885.9 million and $980.7 million , respectively. The fair values of our variable-rate term loans are determined using Level 2 inputs, based on quoted marketprices for the publicly traded instruments.
10. Leases
Upon adoption of Topic 842 on January 1, 2019, our lease obligations consisted of operating leases for office space and data centers and a small number of financeleases for equipment. Our operating leases have remaining lease terms of up to 13.5 years , with a weighted-average remaining lease term of 5.9 years . We haveoptions to extend many of our operating leases for an additional period of time and options to terminate early several of our operating leases. The lease termconsists of the non-cancelable period of the lease, periods covered by options to extend the lease if we are reasonably certain to exercise the option, periodscovered by an option to terminate the lease if we are reasonably certain not to exercise the option, and periods covered by an option to extend or not to terminatethe lease in which the exercise of the option is controlled by the lessor.
On the commencement date of an operating lease, we record an ROU asset, which represents our right to use or control the use of a specified asset for the leaseterm, and an offsetting lease liability, which represents our obligation to make lease payments arising from the lease, based on the present value of the net fixedfuture lease payments due over the initial lease term. We use an estimate of our incremental borrowing rate as the discount rate to determine the present value ofthe net fixed future lease payments, except for leases where the interest rate implicit in the lease is readily determinable. Upon adoption and as of March 31, 2019,the weighted-average discount rate used to calculate the present value of the fixed future lease payments was 5.7% .
Both Topic 842 and the predecessor lease accounting guidance under ASU 840 require us to expense the net fixed payments of operating leases on a straight-linebasis over the lease term. Topic 842 requires us to include any built up deferred or prepaid rent balance resulting from the difference between the straight-lineexpense and the cash payments as a component of our ROU asset. Also included in our ROU asset is any monthly prepayment of rent. Our rent expense is typicallydue on the first day of each month, and we typically pay rent several weeks before it is due, so at any given month end, we will have a prepaid rent balance that isincluded as a component of our ROU asset.
Most of our operating leases contain variable non-lease components consisting of maintenance, insurance, taxes and similar costs of the office space we occupy.We have adopted the practical expedient to not separate these non-lease components from the lease components and instead account for them as a single leasecomponent for all of our leases. We straight-line the net fixed payments of operating leases over the lease term and expense the variable lease payments in theperiod in which we incur the obligation to pay such variable amounts. These variable lease payments are not included in our calculation of our ROU assets or leaseliabilities.
We have no significant short-term leases, finance leases, or subleases.
ROU assets are included in Other Assets, and operating lease liabilities are included in Other Current Liabilities and Other Liabilities in our Consolidated BalanceSheet. Finance lease assets are included in Property, Plant and Equipment, and finance lease liabilities are included in the Current Portion of Long-term Debt andLong-term Debt in our Consolidated Balance Sheet. See Note 7, “Other Current Liabilities,” Note 8,” Other Liabilities,” and note 9, “Debt,” for additionalinformation about these items.
Our operating lease costs, including fixed, variable and short-term lease costs, were $7.2 million and $5.5 million for the three months ended March 31, 2019 and2018 , respectively. Cash paid for operating leases are included in operating cash flows, and were $7.6 million and $5.0 million for the three months ended March31, 2019 and 2018 , respectively. Our finance lease amortization expense, interest expense, and cash paid were not significant for the reported periods.
We have adopted the package of transition practical expedients which allows us to not reassess our existing lease classifications, initial direct costs, and whether ornot an existing contract contains a lease.
We have elected to use the portfolio approach to assess the discount rate we use to calculate the present value of our future lease payments. Using this approachdoes not result in a materially different outcome compared with applying separate discount rates to each lease in our portfolio.
17
Table of Contents
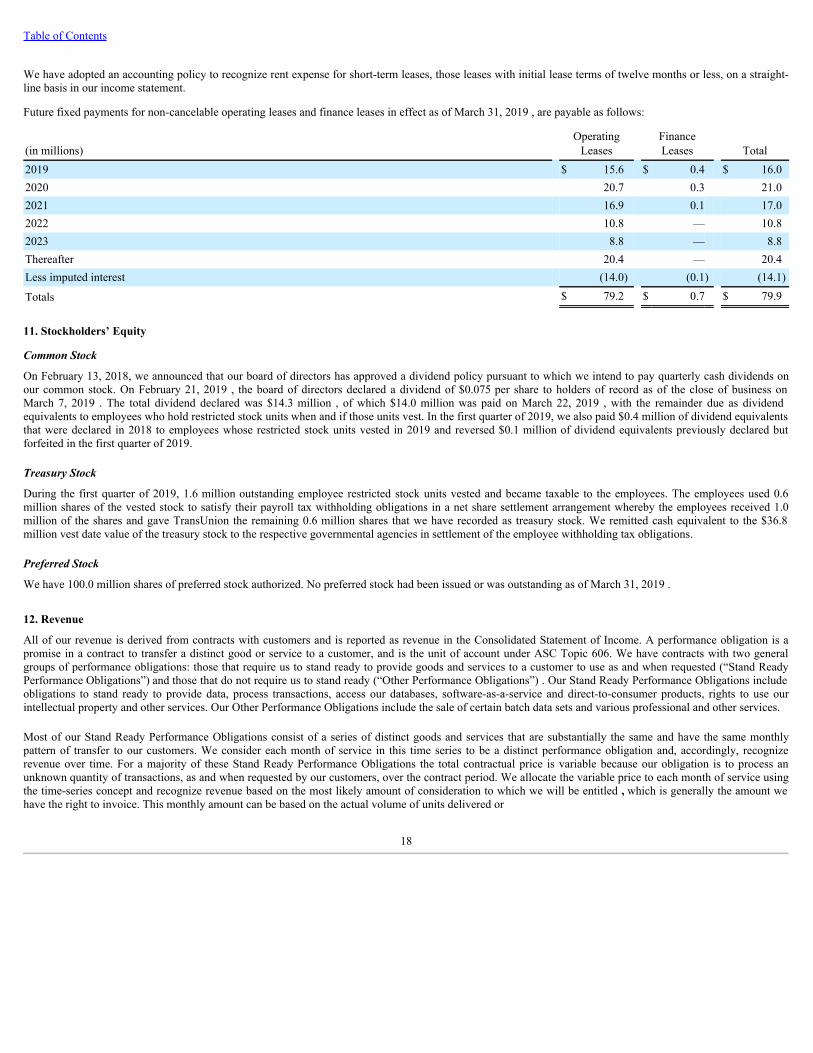
We have adopted an accounting policy to recognize rent expense for short-term leases, those leases with initial lease terms of twelve months or less, on a straight-line basis in our income statement.
Future fixed payments for non-cancelable operating leases and finance leases in effect as of March 31, 2019 , are payable as follows:
On February 13, 2018, we announced that our board of directors has approved a dividend policy pursuant to which we intend to pay quarterly cash dividends onour common stock. On February 21, 2019 , the board of directors declared a dividend of $0.075 per share to holders of record as of the close of business onMarch 7, 2019 . The total dividend declared was $14.3 million , of which $14.0 million was paid on March 22, 2019 , with the remainder due as dividendequivalents to employees who hold restricted stock units when and if those units vest. In the first quarter of 2019, we also paid $0.4 million of dividend equivalentsthat were declared in 2018 to employees whose restricted stock units vested in 2019 and reversed $0.1 million of dividend equivalents previously declared butforfeited in the first quarter of 2019.
Treasury Stock
During the first quarter of 2019, 1.6 million outstanding employee restricted stock units vested and became taxable to the employees. The employees used 0.6million shares of the vested stock to satisfy their payroll tax withholding obligations in a net share settlement arrangement whereby the employees received 1.0million of the shares and gave TransUnion the remaining 0.6 million shares that we have recorded as treasury stock. We remitted cash equivalent to the $36.8million vest date value of the treasury stock to the respective governmental agencies in settlement of the employee withholding tax obligations.
Preferred Stock
We have 100.0 million shares of preferred stock authorized. No preferred stock had been issued or was outstanding as of March 31, 2019 .
12. Revenue
All of our revenue is derived from contracts with customers and is reported as revenue in the Consolidated Statement of Income. A performance obligation is apromise in a contract to transfer a distinct good or service to a customer, and is the unit of account under ASC Topic 606. We have contracts with two generalgroups of performance obligations: those that require us to stand ready to provide goods and services to a customer to use as and when requested (“Stand ReadyPerformance Obligations”) and those that do not require us to stand ready (“Other Performance Obligations”) . Our Stand Ready Performance Obligations includeobligations to stand ready to provide data, process transactions, access our databases, software-as-a-service and direct-to-consumer products, rights to use ourintellectual property and other services. Our Other Performance Obligations include the sale of certain batch data sets and various professional and other services.
Most of our Stand Ready Performance Obligations consist of a series of distinct goods and services that are substantially the same and have the same monthlypattern of transfer to our customers. We consider each month of service in this time series to be a distinct performance obligation and, accordingly, recognizerevenue over time. For a majority of these Stand Ready Performance Obligations the total contractual price is variable because our obligation is to process anunknown quantity of transactions, as and when requested by our customers, over the contract period. We allocate the variable price to each month of service usingthe time-series concept and recognize revenue based on the most likely amount of consideration to which we will be entitled , which is generally the amount wehave the right to invoice. This monthly amount can be based on the actual volume of units delivered or
18
Table of Contents
any guaranteed minimum, if higher. Occasionally we have contracts where the amount we will be entitled to for the transactions processed is uncertain, in whichcase we estimate the revenue based on what we consider to be the most likely amount of consideration we will be entitled to, and true-up any estimates as facts andcircumstances evolve.
Certain Stand Ready Performance Obligation fees result from contingent fee based contracts that require us to provide services before we have an enforceable rightto payment. For these performance obligations, we recognize revenue at the point in time the contingency is met and we have an enforceable contract and right topayment.
Certain of our Stand Ready Performance Obligation contracts include non-recurring, non-refundable up-front fees to cover our costs of setting up files orconfiguring systems to enable our customers to access our services. These fees are not fees for distinct performance obligations. When these fees are insignificantin relation to the total contract value we recognize such fees as revenue when invoiced. If such fees are significant we recognize them as revenue over the durationof the contract, the period of time for which we have contractually enforceable rights and obligations. For contracts where such fees are for a distinct performanceobligation, we recognize revenue as or when the performance obligation is satisfied.
For all contracts that include a Stand Ready Performance Obligation with variable pricing, we are unable to estimate the variable price attributable to futureperformance obligations because the number of units to be purchased is not known. As a result, we use the exception available to forgo disclosures about revenueattributable to the future performance obligations where we recognize revenue using the time-series concept as discussed above, including those qualifying for theright to invoice practical expedient. We also use the exception available to forgo disclosures about revenue attributable to contracts with expected durations of oneyear or less.
Certain of our Other Performance Obligations, including certain batch data sets and certain professional and other services, are delivered at a point in time.Accordingly, we recognize revenue upon delivery, once we have satisfied that obligation. For certain Other Performance Obligations, including certainprofessional and other services, we recognize revenue over time, based on an estimate of progress towards completion of that obligation.
In certain circumstances we apply the guidance in ASC Topic 606 to a portfolio of contracts with similar characteristics. We use estimates and assumptions whenaccounting for a portfolio that reflect the size and composition of the portfolio of contracts.
Our contracts generally include standard commercial payment terms generally acceptable in each region, and do not include financing with extended paymentterms. We have no significant obligations for refunds, warranties, or similar obligations . Our revenue does not include taxes collected from our customers.
Accounts receivable are shown separately on our balance sheet. Contract assets and liabilities result due to the timing of revenue recognition, billings and cashcollections. Contract assets include our right to payment for goods and services already transferred to a customer when the right to payment is conditional onsomething other than the passage of time, for example contracts where we recognize revenue over time but do not have a contractual right to payment until wecomplete the contract. Contract assets are included in our other current assets and are not material as of March 31, 2019 . Contract liabilities include current andlong-term deferred revenue which are included in other current liabilities and other liabilities. We expect to recognize the December 31, 2018 current deferredrevenue as revenue during 2019. The long-term deferred revenue is not significant.
For additional disclosures about the disaggregation of our revenue see Note 15, “Reportable Segments”.
13. Earnings Per Share
Basic earnings per share represents income available to common stockholders divided by the weighted-average number of common shares outstanding during thereported period. Diluted earnings per share reflects the effect of the increase in shares outstanding determined by using the treasury stock method for awards issuedunder our incentive stock plans.
As of March 31, 2019, there were 0.2 million anti-dilutive stock-based awards outstanding. There were 1.3 million contingently-issuable stock-based awardsoutstanding that were excluded from the diluted earnings per share calculation because the contingencies had not been met.
As of March 31, 2018, there were 0.1 million anti-dilutive stock-based awards outstanding. There were no contingently-issuable stock-based awards outstandingthat were excluded from the diluted earnings per share calculation because the contingencies had not been met.
19
Table of Contents
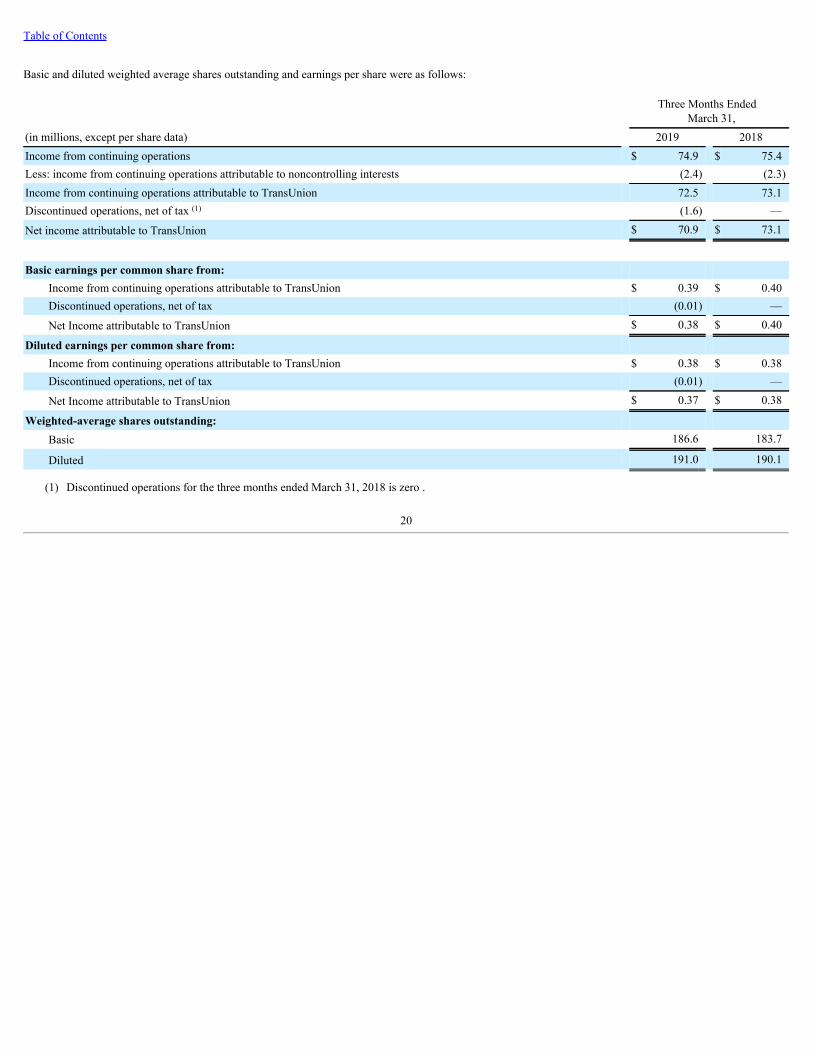
Basic and diluted weighted average shares outstanding and earnings per share were as follows:
Three Months Ended
March 31,(in millions, except per share data) 2019 2018Income from continuing operations $ 74.9 $ 75.4Less: income from continuing operations attributable to noncontrolling interests (2.4) (2.3)Income from continuing operations attributable to TransUnion 72.5 73.1Discontinued operations, net of tax (1) (1.6) —
Net income attributable to TransUnion $ 70.9 $ 73.1
Basic earnings per common share from: Income from continuing operations attributable to TransUnion $ 0.39 $ 0.40Discontinued operations, net of tax (0.01) —
Net Income attributable to TransUnion $ 0.38 $ 0.40
Diluted earnings per common share from: Income from continuing operations attributable to TransUnion $ 0.38 $ 0.38Discontinued operations, net of tax (0.01) —
Net Income attributable to TransUnion $ 0.37 $ 0.38
(1) Discontinued operations for the three months ended March 31, 2018 is zero .
20
Table of Contents
14. Income Taxes
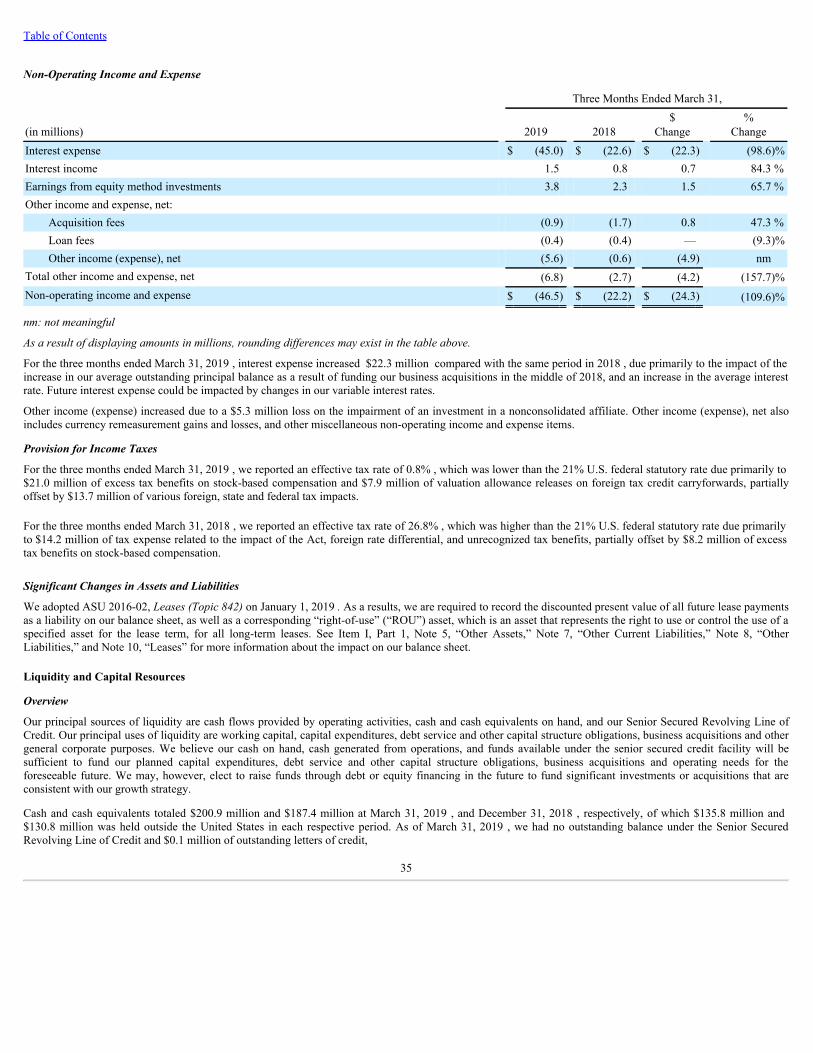
For the three months ended March 31, 2019 , we reported an effective tax rate of 0.8% , which was lower than the 21% U.S. federal statutory rate due primarily to$21.0 million of excess tax benefits on stock-based compensation and $7.9 million of valuation allowance releases on foreign tax credit carryforwards, partiallyoffset by $13.7 million of various foreign, state and federal tax impacts.
For the three months ended March 31, 2018 , we reported an effective tax rate of 26.8% , which was higher than the 21% U.S. federal statutory rate due primarilyto $14.2 million of tax expense related to the impact of the Act, foreign rate differential, and unrecognized tax benefits, partially offset by $8.2 million of excesstax benefits on stock-based compensation.
The total amount of unrecognized tax benefits was $19.6 million as of March 31, 2019 , and $19.6 million as of December 31, 2018. The amounts that would affectthe effective tax rate if recognized are $12.3 million and $12.3 million , respectively. There were no significant liabilities for accrued interest for taxes or accruedtax penalties as of March 31, 2019 , or December 31, 2018. We are regularly audited by federal, state and foreign taxing authorities. Given the uncertaintiesinherent in the audit process, it is reasonably possible that certain audits could result in a significant increase or decrease in the total amounts of unrecognized taxbenefits. An estimate of the range of the increase or decrease in unrecognized tax benefits due to audit results cannot be made at this time. Generally, tax years2010 and forward remain open for examination in some foreign jurisdictions, 2011 and forward in some state jurisdictions, and tax years 2012 and forward remainopen for examination for U.S. federal income tax purposes.
15. Reportable Segments
Over the past few years, we have completed a significant number of acquisitions that have transformed our business. We have also developed a significant numberof new product offerings that have further diversified our portfolio of businesses. As a result of the evolution of our business, we have changed the disaggregatedrevenue and our measure of segment profit (Adjusted EBITDA) information that we provide to our chief operating decision makers (our “CODM”) to better alignwith how we manage the business. Accordingly, our disclosures around the disaggregation of our revenue and the measure of segment profit have been recast forall periods presented in this Quarterly Report on Form 10-Q to conform to the information used by our CODM. We have not changed our reportable segments andthese changes do not impact our consolidated results.
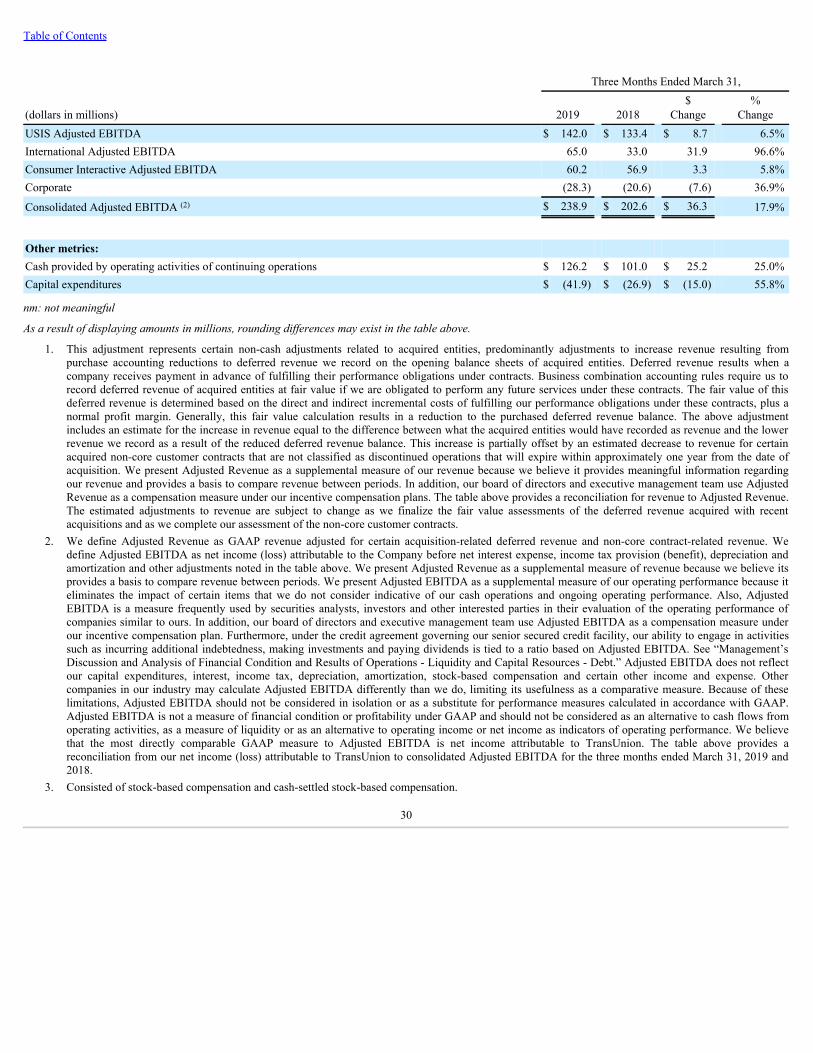
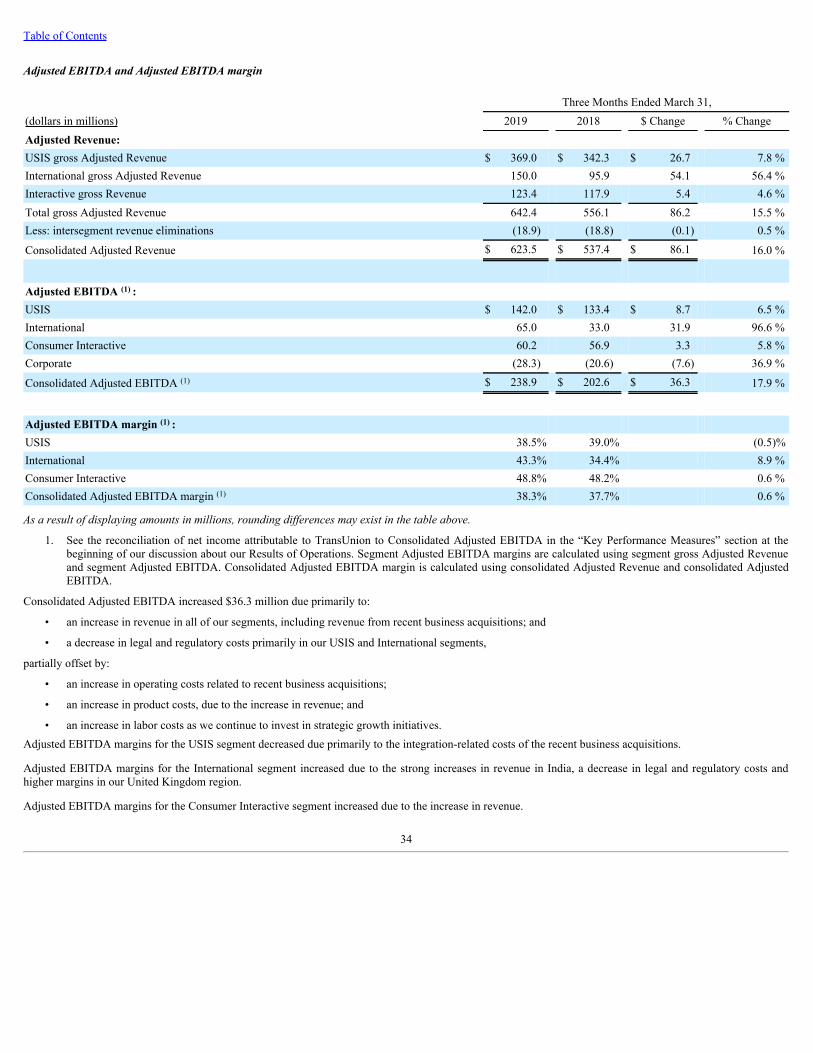
We have three reportable segments, U. S. Information Services (“USIS”), International, and Consumer Interactive, and the Corporate unit, which provides supportservices to each of the segments. Our CODM uses the profit measure of Adjusted EBITDA, on both a consolidated and segment basis, to allocate resources andassess performance of our businesses. We use Adjusted EBITDA as our profit measure because it eliminates the impact of certain items that we do not considerindicative of operating performance, which is useful to compare operating results between periods. Our board of directors and executive management team also useAdjusted EBITDA as a compensation measure for both segment and corporate management under our incentive compensation plans. Adjusted EBITDA is also ameasure frequently used by securities analysts, investors and other interested parties in their evaluation of the operating performance of companies similar to ours.
We define Adjusted EBITDA as net income (loss) attributable to each segment plus (less) loss (income) from discontinued operations, plus net interest expense,plus (less) provision (benefit) for income taxes, plus depreciation and amortization, plus (less) certain deferred revenue acquisition revenue-related adjustments,plus stock-based compensation, plus mergers, acquisitions, divestitures and business optimization-related expenses including Callcredit integration-relatedexpenses, plus (less) certain other expenses (income).
The segment financial information below aligns with how we report information to our CODM to assess operating performance and how we manage the business.The accounting policies of the segments are the same as described in Note 1, “Significant Accounting and Reporting Policies” and Note 12, “Revenue.”
The following is a more detailed description of our three reportable segments and the Corporate unit, which provides support services to each segment:
U.S. Information Services
U.S. Information Services (“USIS”) provides consumer reports, risk scores, analytical services and decisioning capabilities to businesses. These businesses use ourservices to acquire new customers, assess consumers’ ability to pay for services, identify cross-selling opportunities, measure and manage debt portfolio risk,collect debt, verify consumer identities and investigate potential fraud. The core capabilities and delivery methods in our USIS segment allow us to serve a broadset of customers across industries. We report disaggregated revenue of our USIS segment for the following verticals:
• Financial Services: The financial services vertical consists of our consumer lending, mortgage, auto and cards and payments lines of business. Ourfinancial services clients consist of most banks, credit unions, finance companies, auto lenders, mortgage lenders, online-only lenders (FinTech), andother consumer lenders in the United States. We also distribute our solutions through most major resellers, secondary market players and sales agents.Beyond traditional
21
Table of Contents
lenders, we work with a variety of credit arrangers, such as auto dealers and peer-to-peer lenders. We provide solutions across every aspect of the lendinglifecycle; customer acquisition and engagement, fraud and ID management, retention and recovery. Our products are focused on mitigating risk andinclude credit reporting, credit marketing, analytics and consulting, identity verification and authentication and debt recovery solutions.
• Emerging Verticals: Emerging verticals include healthcare, insurance, collections, property management, public sector and other diversified markets. Oursolutions in these verticals are similar to the solutions in our financial services vertical and also address the entire customer lifecycle. We offer onboardingand retention solutions, transaction processing products, scoring products, marketing solutions, analytics and consulting, identity management and fraudsolutions, and revenue optimization and collections solutions.
International
The International segment provides services similar to our USIS segment to businesses in select regions outside the United States. Depending on the maturity ofthe credit economy in each country, services may include credit reports, analytics services, decisioning capabilities, and other value-added risk managementservices. In addition, we have insurance, business and automotive databases in select geographies. These services are offered to customers in a number ofindustries including financial services, insurance, automotive, collections, and communications, and are delivered through both direct and indirect channels. TheInternational segment also provides consumer services similar to those offered by our Consumer Interactive segment that help consumers proactively manage theirpersonal finances.
We report disaggregated revenue of our International segment for the following regions: Canada, Latin America, the United Kingdom, Africa, India and AsiaPacific.
Consumer Interactive
Consumer Interactive offers solutions that help consumers manage their personal finances and take precautions against identity theft. Services in this segmentinclude credit reports and scores, credit monitoring, fraud protection and resolution, and financial management. Our products are provided through user-friendlyonline and mobile interfaces and are supported by educational content and customer support. Our Consumer Interactive segment serves consumers through bothdirect and indirect channels.
Corporate
In addition, Corporate provides support services for each of the segments, holds investments, and conducts enterprise functions. Certain costs incurred in Corporatethat are not directly attributable to one or more of the segments remain in Corporate. These costs are typically enterprise-level costs and are primarilyadministrative in nature.
22
Table of Contents
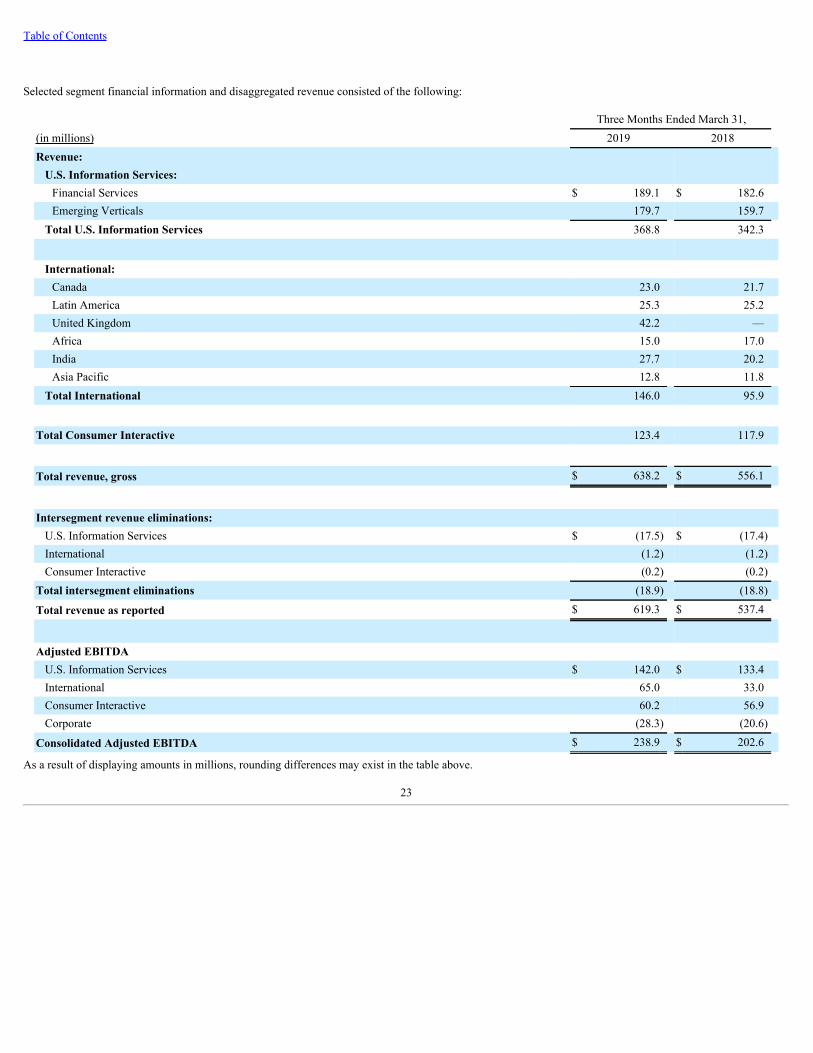
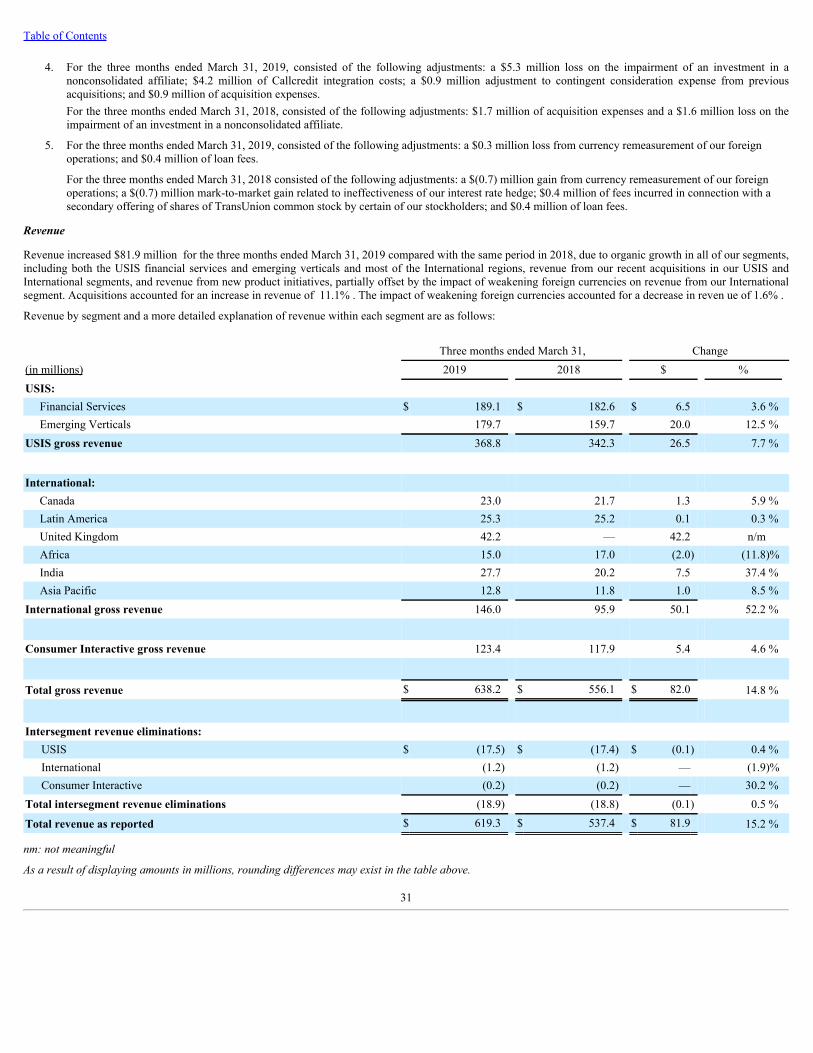
Selected segment financial information and disaggregated revenue consisted of the following:
Three Months Ended March 31, (in millions) 2019 2018 Revenue:
U.S. Information Services: Financial Services $ 189.1 $ 182.6 Emerging Verticals 179.7 159.7
Total U.S. Information Services 368.8 342.3
International: Canada 23.0 21.7 Latin America 25.3 25.2 United Kingdom 42.2 — Africa 15.0 17.0 India 27.7 20.2 Asia Pacific 12.8 11.8
Total International 146.0 95.9
Total Consumer Interactive 123.4 117.9
Total revenue, gross $ 638.2 $ 556.1
Intersegment revenue eliminations: U.S. Information Services $ (17.5) $ (17.4) International (1.2) (1.2) Consumer Interactive (0.2) (0.2)
Total intersegment eliminations (18.9) (18.8)
Total revenue as reported $ 619.3 $ 537.4
Adjusted EBITDA U.S. Information Services $ 142.0 $ 133.4 International 65.0 33.0 Consumer Interactive 60.2 56.9 Corporate (28.3) (20.6)
Consolidated Adjusted EBITDA $ 238.9 $ 202.6
As a result of displaying amounts in millions, rounding differences may exist in the table above.
23
Table of Contents
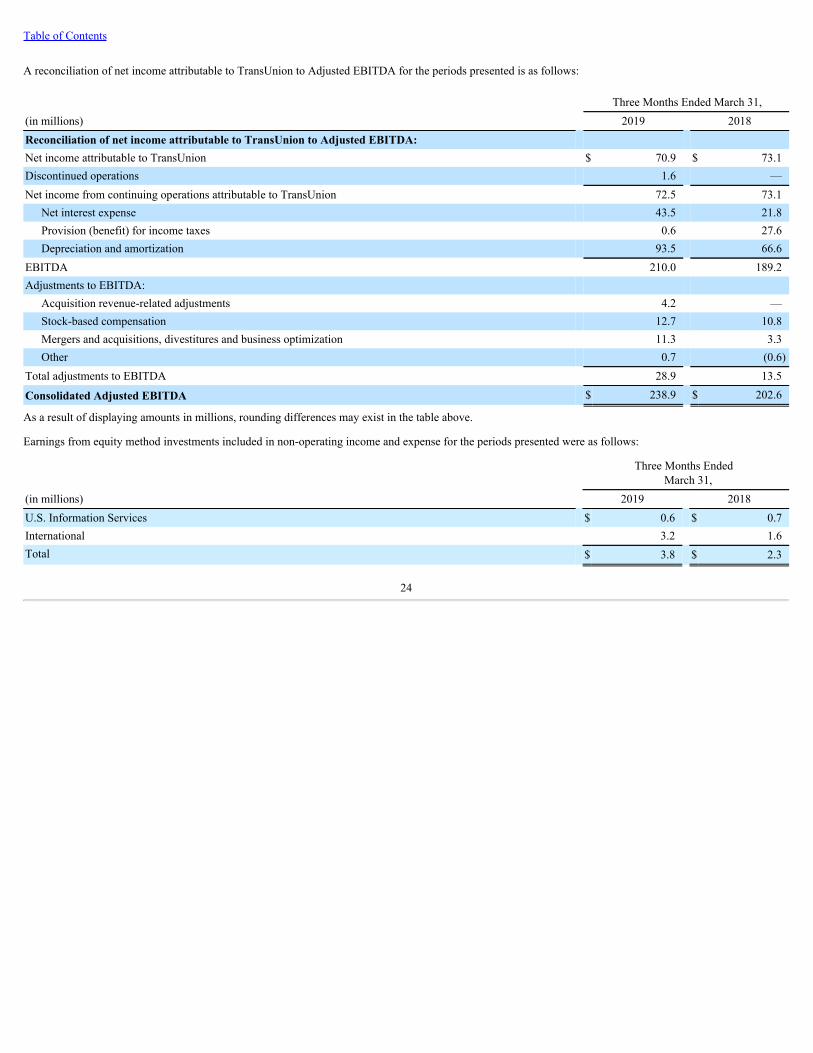
A reconciliation of net income attributable to TransUnion to Adjusted EBITDA for the periods presented is as follows:
Three Months Ended March 31,(in millions) 2019 2018Reconciliation of net income attributable to TransUnion to Adjusted EBITDA: Net income attributable to TransUnion $ 70.9 $ 73.1Discontinued operations 1.6 —Net income from continuing operations attributable to TransUnion 72.5 73.1
Net interest expense 43.5 21.8Provision (benefit) for income taxes 0.6 27.6Depreciation and amortization 93.5 66.6
EBITDA 210.0 189.2Adjustments to EBITDA:
Acquisition revenue-related adjustments 4.2 —Stock-based compensation 12.7 10.8Mergers and acquisitions, divestitures and business optimization 11.3 3.3Other 0.7 (0.6)
Total adjustments to EBITDA 28.9 13.5
Consolidated Adjusted EBITDA $ 238.9 $ 202.6
As a result of displaying amounts in millions, rounding differences may exist in the table above.
Earnings from equity method investments included in non-operating income and expense for the periods presented were as follows:
Three Months Ended
March 31,(in millions) 2019 2018U.S. Information Services $ 0.6 $ 0.7International 3.2 1.6Total $ 3.8 $ 2.3
24
Table of Contents
ITEM 2. MANAGEMENT’S DISCUSSION AND ANALYSIS OF FINANCIAL CONDITION AND RESULTS OF OPERATIONS
The following discussion and analysis of TransUnion’s financial condition and results of operations is provided as a supplement to, and should be read inconjunction with, TransUnion’s audited consolidated financial statements, the accompanying notes, “Risk Factors,” and “Management’s Discussion and Analysisof Financial Condition and Results of Operations” included in our Annual Report on Form 10-K for the year ended December 31, 2018 , as well as the unauditedconsolidated financial statements and the related notes presented in Part I, Item 1, of this Quarterly Report on Form 10-Q.
In addition to historical data, this discussion contains forward-looking statements about our business, operations and financial performance based on currentexpectations that involve risks, uncertainties and assumptions. Our actual results may differ materially from those discussed in the forward-looking statements as aresult of various factors, including but not limited to those discussed below in “Cautionary Notice Regarding Forward-Looking Statements,” and Part II, Item 1A,“Risk Factors.”
References in this discussion and analysis to “the Company,” “we,” “us” and “our” refer to TransUnion and its direct and indirect subsidiaries, collectively.
Overview
TransUnion is a leading global risk and information solutions provider to businesses and consumers. We provide consumer reports, risk scores, analytical servicesand decisioning capabilities to businesses. Businesses embed our solutions into their process workflows to acquire new customers, assess consumer ability to payfor services, identify cross-selling opportunities, measure and manage debt portfolio risk, collect debt, verify consumer identities and investigate potential fraud.Consumers use our solutions to view their credit profiles and access analytical tools that help them understand and manage their personal information and takeprecautions against identity theft. We are differentiated by our comprehensive and unique datasets, our next-generation technology and our analytics anddecisioning capabilities, which enable us to deliver insights across the entire consumer lifecycle. We believe we are the largest provider of risk and informationsolutions in the United States to possess both nationwide consumer credit data and comprehensive, diverse public records data, which allows us to better predictbehaviors, assess risk and address a broader set of business issues for our customers. We have deep domain expertise across a number of attractive industries,which we also refer to as verticals, including financial services, healthcare, insurance and specialized risk. We have a global presence in over 30 countries andterritories across North America, Latin America, the United Kingdom, Africa, India and Asia Pacific.
Our solutions are based on a foundation of financial, credit, alternative credit, identity, bankruptcy, lien, judgment, insurance claims, automotive and other relevantinformation from approximately 90,000 data sources, including financial institutions, private databases and public records repositories. We refine, standardize andenhance this data using sophisticated algorithms to create proprietary databases. Our deep analytics expertise, which includes our people as well as tools such aspredictive modeling and scoring, customer segmentation, benchmarking and forecasting, enables businesses and consumers to gain better insights into their riskand financial data. Our decisioning capabilities, which are generally delivered on a software-as-a-service platform, allow businesses to interpret data and applytheir specific qualifying criteria to make decisions and take action with respect to their customers. Collectively, our data, analytics and decisioning capabilitiesallow businesses to authenticate the identity of consumers, effectively determine the most relevant products for consumers, retain and cross-sell to existingconsumers, identify and acquire new consumers and reduce loss from fraud. Similarly, our capabilities allow consumers to see how their credit profiles havechanged over time, understand the impact of financial decisions on their credit scores and manage their personal information as well as to take precautions againstidentity theft.
Segments
Over the past few years, we have completed a significant number of acquisitions that have transformed our business. We have also developed a significant numberof new product offerings that have further diversified our portfolio of businesses. As a result of the evolution of our business, we have changed the disaggregatedrevenue and our measure of segment profit (Adjusted EBITDA) information that we provide to our chief operating decision makers (our “CODM”) to better alignwith how we manage the business. Accordingly, our disclosures around the disaggregation of our revenue and the measure of segment profit have been recast forall periods presented in this Quarterly Report on Form 10-Q to conform to the information used by our CODM. We have not changed our reportable segments andthese changes do not impact our consolidated results. Part 1, Item 1, Note 15, “Reportable Segments,” for further information about this change.We manage our business and report disaggregated revenue and financial results in three reportable segments: U.S. Information Services, International andConsumer Interactive.
• The U.S. Information Services (or “USIS”) segment provides consumer reports, risk scores, analytical services and decisioning capabilities to businesses.These businesses use our services to acquire new customers, assess consumers’ ability to pay for services, identify cross-selling opportunities, measureand manage debt portfolio risk, collect debt, verify consumer identities and investigate potential fraud. The core capabilities and delivery methods in ourUSIS segment
25
Table of Contents
allow us to serve a broad set of customers across industries. We report disaggregated revenue of our USIS segment for the financial services and emergingverticals.
• The International segment provides services similar to our USIS segment to businesses in select regions outside the United States. Depending on thematurity of the credit economy in each country, services may include credit reports, analytics services, decisioning capabilities, and other value-added riskmanagement services. In addition, we have insurance, business and automotive databases in select geographies. These services are offered to customers ina number of industries including financial services, insurance, automotive, collections and communications, and are delivered through both direct andindirect channels. The International segment also provides consumer services similar to those offered by our Consumer Interactive segment that helpconsumers proactively manage their personal finances.
We report disaggregated revenue of our International segment for the following regions: Canada, Latin America, the United Kingdom, Africa, India andAsia Pacific.
• The Consumer Interactive segment offers solutions that help consumers manage their personal finances and take precautions against identity theft.Services in this segment include credit reports and scores, credit monitoring, fraud protection and resolution, and financial management. Our products areprovided through user-friendly online and mobile interfaces and are supported by educational content and customer support. Our Consumer Interactivesegment serves consumers through both direct and indirect channels.
In addition, Corporate provides shared services for each of the segments, holds investments, raises capital, and conducts enterprise functions. Certain costs incurredin Corporate that are not directly attributable to one or more of the segments remain in Corporate. These costs are typically enterprise-level costs and are primarilyadministrative in nature.
Factors Affecting Our Results of Operations
The following are certain key factors that affect, or have recently affected, our results of operations:
Macroeconomic and Industry Trends
Our revenues can be significantly influenced by general macroeconomic conditions, including the availability of credit and capital, interest rates, inflation,employment levels, consumer confidence and housing demand. In the markets where we compete, we have generally seen good economic conditions and increasedmarket stabilization over the past few years. In the United States, we continue to see a healthy, well-functioning consumer lending market driven by theexceptionally strong labor market and continuing strong consumer confidence. Demand for consumer solutions continues to be strong due to consumer awarenessof the risk of identity theft due to data breaches and increasingly available free credit information. These positive signs have been tempered by a significantdeterioration in the mortgage market, although we have begun to see improvements due to the recent declines in mortgage rates and recent improvements in newand existing home sales. There also continues to be uncertainty around trade policies and global economic growth. In addition, we saw a slowdown in ourcustomer’s marketing activity early in the first quarter, as they assessed the momentum of the U.S. economy and trajectory of interest rates. Internationally, wecontinue to see strong growth in key markets, tempered by uncertainty in our Africa region and ongoing concern over Brexit. Also, weakening foreign currencies,primarily in Africa, India and Latin America, resulted in a decline in results for the first quarter of 2019 compared with the same period in 2018.
Our revenues are also significantly influenced by industry trends, including the demand for information services in financial services, healthcare, insurance andother industries we serve. Companies are increasingly relying on business analytics and big-data technologies to help process data in a cost-efficient manner. Ascustomers have gained the ability to rapidly aggregate and analyze data generated by their own activities, they are increasingly expecting access to real-time dataand analytics from their information providers as well as solutions that fully integrate into their workflows. As economies in emerging markets continue to developand mature, we believe there will continue to be favorable socio-economic trends, such as an increase in the size of the middle class and a significant increase inthe use of financial services by currently under-served and under-banked customers. Demand for consumer solutions is rising, with higher consumer awareness ofthe importance and usage of their credit information, increased risk of identity theft due to data breaches, and more readily available free credit information. Thecomplexity of regulations, including from the Consumer Financial Protection Bureau (“CFPB”) and the Dodd-Frank Wall Street Reform and Consumer ProtectionAct and new capital requirements, continue to make operations for businesses more challenging.
Effects of Inflation
We do not believe that inflation has had a material effect on our business, results of operations or financial condition.
Recent Developments
On December 17, 2018, we entered into interest rate swap agreements with various counterparties that fixes our LIBOR exposure on an additional portion of ourexisting senior secured term loans or similar replacement debt at approximately 2.647% to 2.706%.
26
Table of Contents
During the second quarter of 2018, we borrowed a significant amount of additional debt against our senior secured credit facility to fund the purchase of threeacquisitions as discussed in “Recent Acquisitions and Partnerships” below. During the second quarter of 2018, we borrowed a total of $125.0 million under theSenior Secured Revolving Line of Credit to fund an acquisition and for general corporate purposes. On June 19, 2018, we borrowed an additional $800.0 millionagainst our Senior Secured Term Loan A-2 and $600.0 million against a new tranche 4 of our Senior Secured Term Loan B (“Senior Secured Term Loan B-4”) tofund the acquisition of Callcredit. On June 29, 2018, we borrowed an additional $400.0 million of our Senior Secured Term Loan B-4 to fund another acquisitionand to repay a portion of our Senior Secured Revolving Line of Credit. Our net incremental borrowings during the second quarter of 2018 was $20.0 million underthe Senior Secured Revolving Line of Credit.
On January 1, 2019, we adopted ASU 2016-02, Leases (Topic 842) .This guidance, among other things, requires us to record the future discounted present value ofall future lease payments as a liability on our balance sheet, as well as a corresponding “right-to-use” asset, which is an asset that represents the right to use orcontrol the use of a specified asset for the lease term, for all long-term leases. See Part 1, Item 1, Note 10, “Leases,” for additional information about our leases.
Recent Acquisitions and Partnerships
We selectively evaluate acquisitions and partnerships as a means to expand our business and international footprint and to enter new markets. During 2018, wecompleted the following acquisitions, including those that impact the comparability of our 2019 results with our 2018 results:
• On October 15, 2018, we acquired 100% of the equity of Rubixis, Inc. (“Rubixis”). Rubixis is an innovative healthcare revenue cycle solutions companythat helps providers maximize reimbursement from insurance payers. Rubixis brings specialized expertise in the management of denials andunderpayments, two significant pain points for healthcare providers. The results of operations of Rubixis, which are not material to our consolidatedfinancial statements, have been included as part of our USIS segment in our consolidated statements of income since the date of the acquisition.
• On June 29, 2018, we acquired 100% of the equity of iovation, Inc. (“iovation”). iovation is a provider of advanced device identity and consumerauthentication services that helps businesses and consumers safely transact in a digital world. The results of operations of iovation, which are not materialto our consolidated financial statements, have been included as part of our USIS segment in our consolidated statements of income since the date of theacquisition.
• On June 22, 2018, we increased our noncontrolling interest investment in SavvyMoney, Inc. (“SavvyMoney”). Our initial investment in SavvyMoney wasmade on August 30, 2016. SavvyMoney is a provider of credit information services for bank and credit union users. We measure our investment inSavvyMoney at our initial cost, minus any impairments, plus or minus changes resulting from observable price changes in orderly transactions for theidentical or similar investments in SavvyMoney, with any adjustments recorded in other income and expense. We will record any future dividends inother income and expense when received.
• On June 19, 2018, we acquired 100% of the equity of Callcredit Information Group, Ltd. (“Callcredit”). Callcredit is a United Kingdom-basedinformation solutions company founded in 2000 that provides data, analytics and technology solutions to help businesses and consumers make informeddecisions. The results of operations of Callcredit have been included as part of our International segment in our consolidated statements of income sincethe date of the acquisition. See Part II, Item 8, “Notes to Consolidated Financial Statements,” Note 2, “Business Acquisitions,” for further informationabout this acquisition.
• On June 1, 2018, we acquired 100% of the equity of Healthcare Payment Specialists, LLC (“HPS”). HPS provides expertise and technology solutions tohelp medical care providers maximize Medicare reimbursements. The results of operations of HPS, which are not material to our consolidated financialstatements, have been included as part of our USIS segment in our consolidated statements of income since the date of the acquisition.
Key Components of Our Results of Operations
Revenue
The following is a more detailed description of how we derive and report revenue for our three reportable segments:
27
Table of Contents
U.S. Information Services
U.S. Information Services (or “USIS”) provides consumer reports, risk scores, analytical services and decisioning capabilities to businesses. These businesses useour services to acquire new customers, assess consumers’ ability to pay for services, identify cross-selling opportunities, measure and manage debt portfolio risk,collect debt, verify consumer identities and investigate potential fraud. The core capabilities and delivery methods in our USIS segment allow us to serve a broadset of customers across industries. We report disaggregated revenue of our USIS segment for the following verticals:
• Financial Services: The financial services vertical consists of our consumer lending, mortgage, auto and cards and payments lines of business. Ourfinancial services clients consist of most banks, credit unions, finance companies, auto lenders, mortgage lenders, online-only lenders (FinTech), andother consumer lenders in the United States. We also distribute our solutions through most major resellers, secondary market players and sales agents.Beyond traditional lenders, we work with a variety of credit arrangers, such as auto dealers and peer-to-peer lenders. We provide solutions across everyaspect of the lending lifecycle: customer acquisition and engagement, fraud and ID management, retention and recovery. Our products are focused onmitigating risk and include credit reporting, credit marketing, analytics and consulting, identity verification, and authentication and debt recoverysolutions.
• Emerging Verticals: Emerging verticals include healthcare, insurance, collections, property management, public sector and other diversified markets. Oursolutions in these verticals are similar to the solutions in our financial services vertical and also address the entire customer lifecycle. We offer onboardingand retention solutions, transaction processing products, scoring products, marketing solutions, analytics and consulting, identity management and fraudsolutions, and revenue optimization and collections solutions.
International
The International segment provides services similar to our USIS segment to businesses in select regions outside the United States. Depending on the maturity ofthe credit economy in each country, services may include credit reports, analytics services, decisioning capabilities, and other value-added risk managementservices. In addition, we have insurance, business and automotive databases in select geographies. These services are offered to customers in a number ofindustries including financial services, insurance, automotive, collections, and communications, and are delivered through both direct and indirect channels. TheInternational segment also provides consumer services similar to those offered by our Consumer Interactive segment that help consumers proactively manage theirpersonal finances.
We report disaggregated revenue of our International segment for the following regions: Canada, Latin America, the United Kingdom, Africa, India and AsiaPacific.
Consumer Interactive
Consumer Interactive offers solutions that help consumers manage their personal finances and take precautions against identity theft. Services in this segmentinclude credit reports and scores, credit monitoring, fraud protection and resolution, and financial management. Our products are provided through user-friendlyonline and mobile interfaces and are supported by educational content and customer support. Our Consumer Interactive segment serves consumers through bothdirect and indirect channels.
Cost of Services
Costs of services include data acquisition and royalty fees, personnel costs related to our databases and software applications, consumer and call center supportcosts, hardware and software maintenance costs, telecommunication expenses and occupancy costs associated with the facilities where these functions areperformed.
Selling, General and Administrative
Selling, general and administrative expenses include personnel-related costs for sales, administrative and management employees, costs for professional andconsulting services, advertising and occupancy and facilities expense of these functions.
Non-Operating Income and Expense
Non-operating income and expense includes interest expense, interest income, earnings from equity-method investments, dividends from cost-method investments,impairments of equity-method and cost-method investments, if any, expenses related to successful and unsuccessful business acquisitions, loan fees, debtrefinancing expenses, certain acquisition-related gains and losses and other non-operating income and expenses.
28
Table of Contents
Results of Operations
Key Performance Measures
Over the past few years, we have completed a significant number of acquisitions that have transformed our business. We have also developed a significant numberof new product offerings that have further diversified our portfolio of businesses. As a result of the evolution of our business, we have changed the disaggregatedrevenue and our measure of segment profit (Adjusted EBITDA) information that we provide to our chief operating decision makers (our “CODM”) to better alignwith how we manage the business. Accordingly, our disclosures around the disaggregation of our revenue and the measure of segment profit have been recast forall periods presented in this Quarterly Report on Form 10-Q to conform to the information used by our CODM. We have not changed our reportable segments andthese changes do not impact our consolidated results. Part 1, Item 1, Note 15, “Reportable Segments,” for further information about this change.
Management, including our CODM, evaluates the financial performance of our businesses based on a variety of key indicators. These indicators include the GAAPmeasures of revenue, segment Adjusted EBITDA, cash provided by operating activities and cash paid for capital expenditures and the non-GAAP measuresAdjusted Revenue and consolidated Adjusted EBITDA. For the three months ended March 31, 2019 and 2018 , these key indicators were as follows:
Adjusted EBITDA (2) : Reconciliation of net income attributable to TransUnion to Adjusted EBITDA (2) : Net income attributable to TransUnion $ 70.9 $ 73.1 $ (2.2) (3.0)%Discontinued operations 1.6 — 1.6 n/mNet income from continuing operations attributable to TransUnion 72.5 73.1 (0.6) (0.8)%
Net interest expense 43.5 21.8 21.6 99.2 %Provision (benefit) for income taxes 0.6 27.6 (27.1) (97.9)%Depreciation and amortization 93.5 66.6 26.9 40.4 %
EBITDA 210.0 189.2 20.9 11.0 %Adjustments to EBITDA:
Other metrics: Cash provided by operating activities of continuing operations $ 126.2 $ 101.0 $ 25.2 25.0%Capital expenditures $ (41.9) $ (26.9) $ (15.0) 55.8%
nm: not meaningful
As a result of displaying amounts in millions, rounding differences may exist in the table above.
1. This adjustment represents certain non-cash adjustments related to acquired entities, predominantly adjustments to increase revenue resulting frompurchase accounting reductions to deferred revenue we record on the opening balance sheets of acquired entities. Deferred revenue results when acompany receives payment in advance of fulfilling their performance obligations under contracts. Business combination accounting rules require us torecord deferred revenue of acquired entities at fair value if we are obligated to perform any future services under these contracts. The fair value of thisdeferred revenue is determined based on the direct and indirect incremental costs of fulfilling our performance obligations under these contracts, plus anormal profit margin. Generally, this fair value calculation results in a reduction to the purchased deferred revenue balance. The above adjustmentincludes an estimate for the increase in revenue equal to the difference between what the acquired entities would have recorded as revenue and the lowerrevenue we record as a result of the reduced deferred revenue balance. This increase is partially offset by an estimated decrease to revenue for certainacquired non-core customer contracts that are not classified as discontinued operations that will expire within approximately one year from the date ofacquisition. We present Adjusted Revenue as a supplemental measure of our revenue because we believe it provides meaningful information regardingour revenue and provides a basis to compare revenue between periods. In addition, our board of directors and executive management team use AdjustedRevenue as a compensation measure under our incentive compensation plans. The table above provides a reconciliation for revenue to Adjusted Revenue.The estimated adjustments to revenue are subject to change as we finalize the fair value assessments of the deferred revenue acquired with recentacquisitions and as we complete our assessment of the non-core customer contracts.
2. We define Adjusted Revenue as GAAP revenue adjusted for certain acquisition-related deferred revenue and non-core contract-related revenue. Wedefine Adjusted EBITDA as net income (loss) attributable to the Company before net interest expense, income tax provision (benefit), depreciation andamortization and other adjustments noted in the table above. We present Adjusted Revenue as a supplemental measure of revenue because we believe itsprovides a basis to compare revenue between periods. We present Adjusted EBITDA as a supplemental measure of our operating performance because iteliminates the impact of certain items that we do not consider indicative of our cash operations and ongoing operating performance. Also, AdjustedEBITDA is a measure frequently used by securities analysts, investors and other interested parties in their evaluation of the operating performance ofcompanies similar to ours. In addition, our board of directors and executive management team use Adjusted EBITDA as a compensation measure underour incentive compensation plan. Furthermore, under the credit agreement governing our senior secured credit facility, our ability to engage in activitiessuch as incurring additional indebtedness, making investments and paying dividends is tied to a ratio based on Adjusted EBITDA. See “Management’sDiscussion and Analysis of Financial Condition and Results of Operations - Liquidity and Capital Resources - Debt.” Adjusted EBITDA does not reflectour capital expenditures, interest, income tax, depreciation, amortization, stock-based compensation and certain other income and expense. Othercompanies in our industry may calculate Adjusted EBITDA differently than we do, limiting its usefulness as a comparative measure. Because of theselimitations, Adjusted EBITDA should not be considered in isolation or as a substitute for performance measures calculated in accordance with GAAP.Adjusted EBITDA is not a measure of financial condition or profitability under GAAP and should not be considered as an alternative to cash flows fromoperating activities, as a measure of liquidity or as an alternative to operating income or net income as indicators of operating performance. We believethat the most directly comparable GAAP measure to Adjusted EBITDA is net income attributable to TransUnion. The table above provides areconciliation from our net income (loss) attributable to TransUnion to consolidated Adjusted EBITDA for the three months ended March 31, 2019 and2018.
3. Consisted of stock-based compensation and cash-settled stock-based compensation.
30
Table of Contents
4. For the three months ended March 31, 2019, consisted of the following adjustments: a $5.3 million loss on the impairment of an investment in anonconsolidated affiliate; $4.2 million of Callcredit integration costs; a $0.9 million adjustment to contingent consideration expense from previousacquisitions; and $0.9 million of acquisition expenses.For the three months ended March 31, 2018, consisted of the following adjustments: $1.7 million of acquisition expenses and a $1.6 million loss on theimpairment of an investment in a nonconsolidated affiliate.
5. For the three months ended March 31, 2019, consisted of the following adjustments: a $0.3 million loss from currency remeasurement of our foreignoperations; and $0.4 million of loan fees.
For the three months ended March 31, 2018 consisted of the following adjustments: a $(0.7) million gain from currency remeasurement of our foreignoperations; a $(0.7) million mark-to-market gain related to ineffectiveness of our interest rate hedge; $0.4 million of fees incurred in connection with asecondary offering of shares of TransUnion common stock by certain of our stockholders; and $0.4 million of loan fees.
Revenue
Revenue increased $81.9 million for the three months ended March 31, 2019 compared with the same period in 2018, due to organic growth in all of our segments,including both the USIS financial services and emerging verticals and most of the International regions, revenue from our recent acquisitions in our USIS andInternational segments, and revenue from new product initiatives, partially offset by the impact of weakening foreign currencies on revenue from our Internationalsegment. Acquisitions accounted for an increase in revenue of 11.1% . The impact of weakening foreign currencies accounted for a decrease in reven ue of 1.6% .
Revenue by segment and a more detailed explanation of revenue within each segment are as follows:
Total intersegment revenue eliminations (18.9) (18.8) (0.1) 0.5 %
Total revenue as reported $ 619.3 $ 537.4 $ 81.9 15.2 %
nm: not meaningful
As a result of displaying amounts in millions, rounding differences may exist in the table above.
31
Table of Contents
USIS Segment
USIS revenue increased $26.5 million compared with the same period in 2018, due primarily to increases in revenue from both verticals, including an increase of5.2% from recent acquisitions.
Financial Services: Revenue increased $6.5 million compared with the same period in 2018, due primarily to a 2.2% increase from our recent acquisitions andrevenue from new product initiatives, partially offset by a decrease in revenue due to a significant deterioration in the mortgage market, although we have begun tosee improvements due to the recent declines in mortgage rates and recent improvements in new and existing home sales, and a pullback in our customer’smarketing activity early in the quarter.
Emerging Verticals: Revenue increased $20.0 million compared with the same period in 2018, due primarily to an 8.6% increase from recent acquisitions, newproduct offerings, and organic growth, particularly in the Insurance vertical.
International Segment
International revenue increased $50.1 million , or 52.2% , compared with the same period in 2018, due primarily to a 44.0% increase from our acquisition ofCallcredit and higher revenue in all regions from increased volumes, partially offset by a decrease of 9.2% from the impact of weakening foreign currencies,particularly in our Africa, India and Latin America regions.
Canada: Revenue increased $1.3 million , or 5.9% , compared with the same period in 2018, due primarily to higher revenue from increased volumes includingnew product initiatives, partially offset by a decrease of 5.4% from the impact of weakening foreign currencies.
Latin America: Revenue increased $0.1 million , or 0.3% , compared with the same period in 2018, due primarily to higher revenue from increased volumesincluding new product initiatives, partially offset by a decrease of 9.5% from the impact of weakening foreign currencies.
United Kingdom: Revenue from continuing operations was $42.2 million , all attributable to our acquisition of Callcredit in June, 2018. We did not have revenue inthe United Kingdom in the three months ended March 31, 2018.
Africa: Revenue decreased $2.0 million , or 11.8% , compared with the same period in 2018, due primarily to a 14.4% decrease from the impact of weakeningforeign currencies, partially offset by higher revenue from increased volumes including new product initiatives.
India: Revenue increased $7.5 million , or 37.4% , compared with the same period in 2018, due primarily to higher revenue from increased volumes including newproduct initiatives, partially offset by a decrease of 13.4% from the impact of weakening foreign currencies.
Asia Pacific: Revenue increased $1.0 million , or 8.5% , compared with the same period in 2018, due primarily to higher revenue from increased volumesincluding new product initiatives, partially offset by a decrease of 0.7% from the impact of weakening foreign currencies.
Consumer Interactive Segment
Consumer Interactive revenue increased $5.4 million compared with the same period in 2018, due primarily to an increase in revenue from both our direct andindirect channels, partially offset by a decrease in incremental credit monitoring revenue due to a breach at a competitor.
Operating Expenses
Operating expenses for the three months ended March 31, 2019 and 2018 , were as follows:
Three Months Ended March 31,
(in millions) 2019 2018 $
Change %
ChangeCost of services $ 208.1 $ 182.3 $ 25.8 14.2%Selling, general and administrative 195.7 163.3 32.4 19.8%Depreciation and amortization 93.5 66.6 26.9 40.4%
Total operating expenses $ 497.2 $ 412.2 $ 85.1 20.7%
As a result of displaying amounts in millions, rounding differences may exist in the table above.
32
Table of Contents
Cost of Services
Cost of services increased $25.8 million for the three months ended March 31, 2019 , compared with the same period in 2018 .
The increase was due primarily to:
• operating and integration-related costs relating to the business acquisitions in our USIS and International segments, as we continue to invest in keystrategic growth initiatives; and
• an increase in product costs resulting from the increase in revenue, primarily in our USIS segment,
partially offset by:
• the impact of weakening foreign currencies on the expenses of our International segment.
Selling, General and Administrative
Selling, general and administrative expenses increased $32.4 million for the three months ended March 31, 2019 , compared with the same period in 2018 .
The increase was due primarily to:
• operating and integration-related costs relating to the business acquisitions in our USIS and International segments, as we continue to invest in keystrategic growth initiatives; and
• an increase in labor costs, primarily in Corporate and our USIS segment, as we continue to invest in key strategic growth initiatives,
partially offset by:
• a decrease in legal and regulatory costs primarily in our USIS and International segments; and
• the impact of weakening foreign currencies on the expenses of our International segment.
Depreciation and Amortization
Depreciation and amortization increased $26.9 million for the three months ended March 31, 2019 , compared with the same period in 2018 , primarily in ourInternational and USIS segment, due to recent intangible and tangible fixed assets acquired with our recent International and USIS segment business acquisitions.
As a result of displaying amounts in millions, rounding differences may exist in the table above.
1. See the reconciliation of net income attributable to TransUnion to Consolidated Adjusted EBITDA in the “Key Performance Measures” section at thebeginning of our discussion about our Results of Operations. Segment Adjusted EBITDA margins are calculated using segment gross Adjusted Revenueand segment Adjusted EBITDA. Consolidated Adjusted EBITDA margin is calculated using consolidated Adjusted Revenue and consolidated AdjustedEBITDA.
Consolidated Adjusted EBITDA increased $36.3 million due primarily to:
• an increase in revenue in all of our segments, including revenue from recent business acquisitions; and
• a decrease in legal and regulatory costs primarily in our USIS and International segments,
partially offset by:
• an increase in operating costs related to recent business acquisitions;
• an increase in product costs, due to the increase in revenue; and
• an increase in labor costs as we continue to invest in strategic growth initiatives.Adjusted EBITDA margins for the USIS segment decreased due primarily to the integration-related costs of the recent business acquisitions.
Adjusted EBITDA margins for the International segment increased due to the strong increases in revenue in India, a decrease in legal and regulatory costs andhigher margins in our United Kingdom region.
Adjusted EBITDA margins for the Consumer Interactive segment increased due to the increase in revenue.
34
Table of Contents
Non-Operating Income and Expense
Three Months Ended March 31,
(in millions) 2019 2018 $
Change %
ChangeInterest expense $ (45.0) $ (22.6) $ (22.3) (98.6)%Interest income 1.5 0.8 0.7 84.3 %Earnings from equity method investments 3.8 2.3 1.5 65.7 %Other income and expense, net:
Acquisition fees (0.9) (1.7) 0.8 47.3 %Loan fees (0.4) (0.4) — (9.3)%Other income (expense), net (5.6) (0.6) (4.9) nm
Total other income and expense, net (6.8) (2.7) (4.2) (157.7)%Non-operating income and expense $ (46.5) $ (22.2) $ (24.3) (109.6)%
nm: not meaningful
As a result of displaying amounts in millions, rounding differences may exist in the table above.
For the three months ended March 31, 2019 , interest expense increased $22.3 million compared with the same period in 2018 , due primarily to the impact of theincrease in our average outstanding principal balance as a result of funding our business acquisitions in the middle of 2018, and an increase in the average interestrate. Future interest expense could be impacted by changes in our variable interest rates.
Other income (expense) increased due to a $5.3 million loss on the impairment of an investment in a nonconsolidated affiliate. Other income (expense), net alsoincludes currency remeasurement gains and losses, and other miscellaneous non-operating income and expense items.
Provision for Income Taxes
For the three months ended March 31, 2019 , we reported an effective tax rate of 0.8% , which was lower than the 21% U.S. federal statutory rate due primarily to$21.0 million of excess tax benefits on stock-based compensation and $7.9 million of valuation allowance releases on foreign tax credit carryforwards, partiallyoffset by $13.7 million of various foreign, state and federal tax impacts.
For the three months ended March 31, 2018 , we reported an effective tax rate of 26.8% , which was higher than the 21% U.S. federal statutory rate due primarilyto $14.2 million of tax expense related to the impact of the Act, foreign rate differential, and unrecognized tax benefits, partially offset by $8.2 million of excesstax benefits on stock-based compensation.
Significant Changes in Assets and Liabilities
We adopted ASU 2016-02, Leases (Topic 842) on January 1, 2019 . As a results, we are required to record the discounted present value of all future lease paymentsas a liability on our balance sheet, as well as a corresponding “right-of-use” (“ROU”) asset, which is an asset that represents the right to use or control the use of aspecified asset for the lease term, for all long-term leases. See Item I, Part 1, Note 5, “Other Assets,” Note 7, “Other Current Liabilities,” Note 8, “OtherLiabilities,” and Note 10, “Leases” for more information about the impact on our balance sheet.
Liquidity and Capital Resources
Overview
Our principal sources of liquidity are cash flows provided by operating activities, cash and cash equivalents on hand, and our Senior Secured Revolving Line ofCredit. Our principal uses of liquidity are working capital, capital expenditures, debt service and other capital structure obligations, business acquisitions and othergeneral corporate purposes. We believe our cash on hand, cash generated from operations, and funds available under the senior secured credit facility will besufficient to fund our planned capital expenditures, debt service and other capital structure obligations, business acquisitions and operating needs for theforeseeable future. We may, however, elect to raise funds through debt or equity financing in the future to fund significant investments or acquisitions that areconsistent with our growth strategy.
Cash and cash equivalents totaled $200.9 million and $187.4 million at March 31, 2019 , and December 31, 2018 , respectively, of which $135.8 million and$130.8 million was held outside the United States in each respective period. As of March 31, 2019 , we had no outstanding balance under the Senior SecuredRevolving Line of Credit and $0.1 million of outstanding letters of credit,
35
Table of Contents
and could have borrowed up to the remaining $299.9 million available. TransUnion also has the ability to request incremental loans on the same terms under theexisting senior secured credit facility up to the greater of an additional $675.0 million and 100% of Consolidated EBITDA. Consolidated EBITDA is reduced to theextent that the senior secured net leverage ratio is above 4.25-to-1. In addition, so long as the senior secured net leverage ratio does not exceed 4.25 -to-1.0, wemay incur additional incremental loans, subject to certain additional conditions and commitments by existing or new lenders to fund any additional borrowings.
The balance retained in cash and cash equivalents is consistent with our short-term cash needs and investment objectives. We may be required to make additionalprincipal payments on the Senior Secured Term Loans B-3 and B-4 based on excess cash flows of the prior year, as defined in the credit agreement. There were noexcess cash flows for 2018 and therefore no additional payment was required in 2019. Additional payments based on excess cash flows could be due in futureyears. See Part I, Item 1, Note 9 “Debt,” for additional information about our debt.
During the first quarter of 2019, 1.6 million outstanding employee restricted stock units vested and became taxable to the employees. The employees used 0.6million shares of the vested stock to satisfy their payroll tax withholding obligations in a net share settlement arrangement whereby the employees received 1.0million of the shares and gave TransUnion the remaining 0.6 million shares that we have recorded as treasury stock. We remitted cash equivalent to the $36.8million vest date value of the treasury stock to the respective governmental agencies in settlement of the employee withholding tax obligations.
On February 13, 2018, we announced that our board of directors approved a dividend policy pursuant to which we intend to pay quarterly cash dividends on ourcommon stock. On February 21, 2019 , the board of directors declared a dividend of $0.075 per share to holders of record as of the close of business on March 7,2019 . The total dividend declared was $14.3 million , of which $14.0 million was paid on March 22, 2019 , with the remainder due as dividend equivalents toemployees who hold restricted stock units when and if those units vest.
On February 13, 2017, our board of directors authorized the repurchase of up to $300.0 million of common stock over the next three years. On February 8, 2018,our board of directors removed the three-year time limitation. Prior to the second quarter of 2018, we had purchased approximately $133.4 million of commonstock under the program and may purchase up to an additional $166.6 million. Additional repurchases may be made from time to time at management’s discretionat prices management considers to be attractive through open market purchases or through privately negotiated transactions, subject to availability. Open marketpurchases will be conducted in accordance with the limitations set forth in Rule 10b-18 of the Exchange Act and other applicable legal requirements.
We have no obligation to repurchase additional shares, and the timing, actual number and value of the shares that are repurchased, if any, will be at the discretionof management and will depend on a number of factors, including market conditions, the cost of repurchasing shares, the availability of alternative investmentopportunities, liquidity, and other factors deemed appropriate. Repurchases may be suspended, terminated or modified at any time for any reason. Any repurchasedshares will have the status of treasury shares and may be used, if and when needed, for general corporate purposes.
On June 19, 2018, we borrowed an additional $800.0 million against our Senior Secured Term Loan A-2 and $600.0 million against a new tranche 4 of our SeniorSecured Term Loan B (“Senior Secured Term Loan B-4”) to fund the acquisition of Callcredit. On June 29, 2018, we borrowed an additional $400.0 million of ourSenior Secured Term Loan B-4 to fund another acquisition and to repay a portion of our Senior Secured Revolving Line of Credit. These new borrowings haveincreased our future scheduled loan repayments and interest expense compared with the first quarter of 2018.
Sources and Uses of Cash
Three Months Ended March 31,(in millions) 2019 2018 ChangeCash provided by operating activities of continuing operations $ 126.2 $ 101.0 $ 25.2Cash used in investing activities of continuing operations (50.9) (30.5) (20.4)Cash used in financing activities (59.9) (32.5) (27.4)Cash used in discontinued operations (2.4) — (2.4)Effect of exchange rate changes on cash and cash equivalents 0.5 0.5 —Net change in cash and cash equivalents $ 13.5 $ 38.5 $ (25.0)
Operating Activities
The increase in cash provided by operating activities of continuing operations was due primarily to the increase in operating income excluding depreciation andamortization, partially offset by an increase in interest expense resulting from the increase in outstanding debt due to our 2018 acquisitions.
36
Table of Contents
Investing Activities
The increase in cash used in investing activities was due primarily to an increase in capital expenditures.
Financing Activities
The increase in cash used in financing activities is due primarily to cash used to pay employee withholding taxes on restricted stock that vested during the firstquarter of 2019 that we have recorded as treasury stock and cash used to pay dividends in the first quarter of 2019, partially offset by a repayment toward ouroutstanding senior secured revolving line of credit in 2018.
Capital Expenditures
We make capital expenditures to grow our business by developing new and enhanced capabilities, to increase the effectiveness and efficiency of the organizationand to reduce risks. We make capital expenditures for product development, disaster recovery, security enhancements, regulatory compliance, and the replacementand upgrade of existing equipment at the end of its useful life.
Cash paid for capital expenditures increased $15.0 million, from $26.9 million for the three months ended March 31, 2018 , to $41.9 million for the three monthsended March 31, 2019 .
Debt
Senior Secured Credit Facility
On June 15, 2010, we entered into a senior secured credit facility with various lenders. This facility has been amended several times and currently consists of theSenior Secured Term Loan A-2, the Senior Secured Term Loan B-3, Senior Secured Term Loan B-4, and the Senior Secured Revolving Line of Credit.
During the second quarter of 2018, we borrowed additional funds under our Senior Secured Term Loan A-2 and B-4 to fund the purchase of Callcredit, iovationand HPS as discussed above.
Hedge
On December 17, 2018, we entered into interest rate swap agreements with various counterparties that effectively fixed our LIBOR exposure on a portion of ourexisting senior secured term loans or similar replacement debt at approximately 2.647% to 2.706%. We have designated these swap agreements as cash flowhedges. The current aggregate notional amount under these agreements is $1,445.0 million , decreasing each quarter until the second agreement terminates onDecember 30, 2022.
On December 18, 2015, we entered into interest rate cap agreements with various counterparties that effectively cap our LIBOR exposure on a portion of ourexisting senior secured term loans or similar replacement debt at 0.75% beginning June 30, 2016. We have designated these cap agreements as cash flow hedges.The current aggregate notional amount under these agreements is $1,443.9 million and will decrease each quarter until the agreement terminates on June 30, 2020.In July 2016, we began to pay the various counterparties a fixed rate on the outstanding notional amounts of between 0.98% and 0.994% and receive payments tothe extent LIBOR exceeds 0.75% .
Effect of Certain Debt Covenants
A breach of any of the covenants under the agreements governing our debt could limit our ability to borrow funds under the Senior Secured Revolving Line ofCredit and could result in a default under the senior secured credit facility. Upon the occurrence of an event of default under the senior secured credit facility, thelenders could elect to declare all amounts then outstanding to be immediately due and payable, and the lenders could terminate all commitments to extend furthercredit. If we were unable to repay the amounts declared due, the lenders could proceed against any collateral granted to them to secure that indebtedness.
With certain exceptions, the senior secured credit facility obligations are secured by a first-priority security interest in substantially all of the assets of Trans UnionLLC, including its investment in subsidiaries. The senior secured credit facility contains various restrictions and nonfinancial covenants, along with a seniorsecured net leverage ratio test. The nonfinancial covenants include restrictions on dividends, investments, dispositions, future borrowings and other specifiedpayments, as well as additional reporting and disclosure requirements. The senior secured net leverage test must be met as a condition to incur additionalindebtedness, make certain investments, and may be required to make certain restricted payments. The senior secured net leverage ratio must not exceed 5.5 -to-1at any such test date. TransUnion may make dividend payments up to an unlimited amount under the terms of the senior secured credit facility provided that nodefault or event of default exists and so long as the total net leverage ratio does not exceed 4.75-to-1. As of March 31, 2019 , we were in compliance with all debtcovenants.
Our ability to meet our liquidity needs or to pay dividends on our common stock depends on our subsidiaries’ earnings, the terms of our indebtedness, and othercontractual restrictions. Trans Union LLC, the borrower under the senior secured credit facility, is
37
Table of Contents
not permitted to declare any dividend or make any other distribution subject to certain exceptions, including compliance with a fixed charge coverage ratio and abasket that depends on TransUnion Intermediate Holdings, Inc.’s consolidated net income.
For additional information about our debt and hedge, see Part I, Item 1, “Notes to Unaudited Consolidated Financial Statements,” Note 9, “Debt.”
Recent Accounting Pronouncements
See Part I, Item 1, “Notes to Unaudited Consolidated Financial Statements,” Note 1, “Significant Accounting and Reporting Policies,” and Note 10, “Leases,” forinformation about recent accounting pronouncements and the impact on our consolidated financial statements.
Application of Critical Accounting Estimates
We prepare our consolidated financial statements in conformity with U.S. generally accepted accounting principles. These accounting principles require us to makecertain judgments and estimates in reporting our operating results and our assets and liabilities. Although we believe that our estimates and judgments arereasonable, they are based on information available at the time, and actual results may differ significantly from these estimates under different conditions. See the“Application of Critical Accounting Estimates” section in “Management’s Discussion and Analysis of Financial Condition and Results of Operations” and Note 1,“Significant Accounting and Reporting Policies,” to our audited financial statements included in our Annual Report on Form 10-K for the year endedDecember 31, 2018, filed with the SEC on February 14, 2019, for a description of the significant accounting estimates used in the preparation of our consolidatedfinancial statements.
This Quarterly Report on Form 10-Q contains “forward-looking statements” within the meaning of the Private Securities Litigation Reform Act of 1995. Thesestatements are based on the current beliefs and expectations of TransUnion’s management and are subject to significant risks and uncertainties. Actual results maydiffer materially from those described in the forward-looking statements. Any statements made in this report that are not statements of historical fact, includingstatements about our beliefs and expectations, are forward-looking statements. Forward-looking statements include information concerning possible or assumedfuture results of operations, including descriptions of our business plans and strategies. These statements often include words such as “anticipate,” “expect,”“guidance,” “suggest,” “plan,” “believe,” “intend,” “estimate,” “target,” “project,” “should,” “could,” “would,” “may,” “will,” “forecast,” “outlook,” “potential,”“continues,” “seeks,” “predicts,” or the negatives of these words and other similar expressions.
Factors that could cause actual results to differ materially from those described in the forward-looking statements. Factors that could materially affect our financialresults or such forward-looking statements include:
• macroeconomic and industry trends and adverse developments in the debt, consumer credit and financial services markets;• our ability to provide competitive services and prices;• our ability to retain or renew existing agreements with large or long-term customers;• our ability to maintain the security and integrity of our data;• our ability to deliver services timely without interruption;• our ability to maintain our access to data sources;• government regulation and changes in the regulatory environment;• litigation or regulatory proceedings;• regulatory oversight of “critical activities”;• our ability to effectively manage our costs;• economic and political stability in the United States and international markets where we operate;• our ability to effectively develop and maintain strategic alliances and joint ventures;• our ability to timely develop new services and the market’s willingness to adopt our new services;• our ability to manage and expand our operations and keep up with rapidly changing technologies;• our ability to make acquisitions and successfully integrate the operations of acquired businesses and realize the intended benefits of such acquisitions;• our ability to protect and enforce our intellectual property, trade secrets and other forms of unpatented intellectual property;
38
Table of Contents
• our ability to defend our intellectual property from infringement claims by third parties;• the ability of our outside service providers and key vendors to fulfill their obligations to us;• further consolidation in our end-customer markets;• the increased availability of free or inexpensive consumer information;• losses against which we do not insure;• our ability to make timely payments of principal and interest on our indebtedness;• our ability to satisfy covenants in the agreements governing our indebtedness;• our ability to maintain our liquidity;• share repurchase plans; and• our reliance on key management personnel.
There may be other factors, many of which are beyond our control, that may cause our actual results to differ materially from the forward-looking statements,including factors disclosed in our Annual Report on Form 10-K for the year ended December 31, 2018, and any subsequent Quarterly Report on Form 10-Q orCurrent Report on Form 8-K filed with the Securities and Exchange Commission, and in this report under the sections entitled “Risk Factors” and “Management’sDiscussion and Analysis of Financial Condition and Results of Operations” in this report. You should evaluate all forward-looking statements made in this reportin the context of these risks and uncertainties.
The forward-looking statements contained in this report speak only as of the date of this report. We undertake no obligation to publicly release the result of anyrevisions to these forward-looking statements, to reflect the impact of events or circumstances that may arise after the date of this report.
ITEM 3. QUANTITATIVE AND QUALITATIVE DISCLOSURES ABOUT MARKET RISK
We operate internationally and are subject to various market risks, including those caused by potentially adverse movements in foreign currency exchange rates.Due to our acquisition of Callcredit during the second quarter 2018, we now have exposure to British pounds sterling in addition to other foreign currencies. Wealso have a significant amount of variable rate debt and funds invested in interest bearing accounts. As of March 31, 2019, our weighted-average interest rate onour variable rate deb t is 4.43%, compared with 4.45% a t December 31, 2018. This decrease is primarily due to the decrease in LIBOR during the past threemonths
There have been no other material changes from the quantitative and qualitative disclosures about market risk included in our Annual Report on Form 10-K for theyear ended December 31, 2018.
ITEM 4. CONTROLS AND PROCEDURES
Disclosure Controls and Procedures
Our management, with the participation of our Chief Executive Officer and Chief Financial Officer, has evaluated the effectiveness of our disclosure controls andprocedures as of the end of the period covered by this report. The term “disclosure controls and procedures” as defined in Rules 13a-15(e) and 15d-15(e) under theExchange Act means controls and other procedures of a company that are designed to ensure that information required to be disclosed by a company in the reportsthat it files or submits under the Exchange Act is recorded, processed, summarized and reported, within the time periods specified in the SEC’s rules and forms.
Disclosure controls and procedures include, without limitation, controls and procedures designed to ensure that information required to be disclosed by a companyin the reports that it files or submits under the Exchange Act is accumulated and communicated to the company’s management, including its principal executiveand principal financial officers, as appropriate, to allow timely decisions regarding required disclosure. Management recognizes that any controls and procedures,no matter how well designed and operated, can provide only reasonable assurance of achieving their objectives, and management necessarily applies its judgmentin evaluating the cost-benefit relationship of possible controls and procedures. Based on the evaluation of our disclosure controls and procedures as of the end ofthe period covered by this report, our Chief Executive Officer and Chief Financial Officer concluded that, as of such date, our disclosure controls and procedureswere effective at a reasonable assurance level.
Changes in Internal Controls over Financial Reporting
During the quarter covered by this report, there have been no changes in our internal controls over financial reporting that have materially affected, or arereasonably likely to materially affect, our internal controls over financial reporting.
39
Table of Contents
PART II. OTHER INFORMATION
ITEM 1. LEGAL PROCEEDINGS
General
Refer to Part I, Item 3, “Legal Proceedings,” of our Annual Report on Form 10-K for the year ended December 31, 2018, for a full description of our materialpending legal proceedings.
ITEM 1A. RISK FACTORS
In addition to the other information included in this report, you should carefully consider the factors discussed in “Risk Factors” included in our Annual Report onForm 10-K for the year ended December 31, 2018, as well as the factors identified under “Cautionary Statement Regarding Forward-Looking Statements” at theend of Part I, Item 2 of this Quarterly Report on Form 10-Q, which could materially affect our business, financial condition or future results. The risks described inour Annual Report on Form 10-K for the year ended December 31, 2018, and this Quarterly Report on Form 10-Q are not the only risks facing TransUnion.Additional risks and uncertainties not currently known to us or that we currently deem to be immaterial may also materially adversely affect our business, financialcondition, or operating results.
ITEM 2. UNREGISTERED SALES OF EQUITY SECURITIES AND USE OF PROCEEDS
(a) Recent Sales of Unregistered Securities
Not applicable.
(b) Use of Proceeds
Not applicable.
(c) Issuer Purchases of Equity Securities
(a) Total Number of
Shares Purchased (b) Average Price
Paid Per Share
(c) Total Number ofShares
Purchased asPart of Publicly
Announced Plansor Programs
(d) Approximate DollarValue, in millions, of Shares that
May Yet Be PurchasedUnder
the Plans or Programs (1)
January 1 to January 31 1,795 $ 60.37 — $ 166.6February 1 to February 28 585,923 63.05 — $ 166.6March 1 to March 31 351 64.85 — $ 166.6Total 588,069 $ 63.04 —
Shares shown in column (a) above consist of shares that were repurchased from employees for withholding taxes on options exercised and restricted stock unitsvesting pursuant to the terms of the Company's equity compensation plans and net settled.
(1) On February 13, 2017, our board of directors authorized the repurchase of up to $300.0 million of common stock over the next three years. On February 8,2018, our board of directors removed the three-year time limitation. Prior to the second quarter of 2018, we had purchased approximately $133.4 million ofcommon stock under the program and may purchase up to an additional $166.6 million. Additional repurchases may be made from time to time at management’sdiscretion at prices management considers to be attractive through open market purchases or through privately negotiated transactions, subject to availability. Openmarket purchases will be conducted in accordance with the limitations set forth in Rule 10b-18 of the Exchange Act and other applicable legal requirements.
40
Table of Contents
ITEM 6. EXHIBITS
31.1** TransUnion Certification of Chief Executive Officer pursuant to Section 302 of the Sarbanes-Oxley Act of 2002. 31.2** TransUnion Certification of Chief Financial Officer pursuant to Section 302 of the Sarbanes-Oxley Act of 2002. 32**
TransUnion Certification of Chief Executive Officer and Chief Financial Officer pursuant to 18 U.S.C. Section 1350, as adopted pursuant toSection 906 of the Sarbanes-Oxley Act of 2002.
Pursuant to the requirements of the Securities Exchange Act of 1934, as amended, the Registrant has duly caused this report to be signed on its behalf by theundersigned thereunto duly authorized.
TransUnion April 23, 2019 By /s/ Todd M. Cello Todd M. Cello Executive Vice President, Chief Financial Officer April 23, 2019 By /s/ Timothy Elberfeld Timothy Elberfeld Vice President, Chief Accounting Officer (Principal Accounting Officer)
42
Exhibit 31.1CERTIFICATION
I, James M. Peck, certify that:1. I have reviewed this report on Form 10-Q of TransUnion;2. Based on my knowledge, this report does not contain any untrue statement of a material fact or omit to state a material fact necessary to make the
statements made, in light of the circumstances under which such statements were made, not misleading with respect to the period covered by this report;3. Based on my knowledge, the financial statements, and other financial information included in this report, fairly present in all material respects the
financial condition, results of operations and cash flows of the registrant as of, and for, the periods presented in this report;4. The registrant’s other certifying officer and I are responsible for establishing and maintaining disclosure controls and procedures (as defined in Exchange
Act Rules 13a-15(e) and 15d-15(e)) and internal control over financial reporting (as defined in Exchange Act Rules 13a-15(f) and 15d-15(f)) for the registrant andhave:
a) Designed such disclosure controls and procedures, or caused such disclosure controls and procedures to be designed under our supervision, to ensure thatmaterial information relating to the registrant, including its consolidated subsidiaries, is made known to us by others within those entities, particularly during theperiod in which this report is being prepared;
b) Designed such internal control over financial reporting, or caused such internal control over financial reporting to be designed under our supervision, toprovide reasonable assurance regarding the reliability of financial reporting and the preparation of financial statements for external purposes in accordance withgenerally accepted accounting principles;
c) Evaluated the effectiveness of the registrant’s disclosure controls and procedures and presented in this report our conclusions about the effectiveness of thedisclosure controls and procedures, as of the end of the period covered by this report based on such evaluation; and
d) Disclosed in this report any change in the registrant’s internal control over financial reporting that occurred during the registrant’s most recent fiscalquarter (the registrant’s fourth fiscal quarter in the case of an annual report) that has materially affected, or is reasonably likely to materially affect, the registrant’sinternal control over financial reporting; and
5. The registrant’s other certifying officer and I have disclosed, based on our most recent evaluation of internal control over financial reporting, to theregistrant’s auditors and the audit committee of the registrant’s board of directors (or persons performing the equivalent function):
a) All significant deficiencies and material weaknesses in the design or operation of internal control over financial reporting which are reasonably likely toadversely affect the registrant’s ability to record, process, summarize and report financial information; and
b) Any fraud, whether or not material, that involves management or other employees who have a significant role in the registrant’s internal control overfinancial reporting.
Date: April 23, 2019
/s/ James M. PeckName: James M. PeckTitle: Chief Executive Officer
Exhibit 31.2
CERTIFICATION
I, Todd M. Cello, certify that:1. I have reviewed this report on Form 10-Q of TransUnion;2. Based on my knowledge, this report does not contain any untrue statement of a material fact or omit to state a material fact necessary to make the
statements made, in light of the circumstances under which such statements were made, not misleading with respect to the period covered by this report;3. Based on my knowledge, the financial statements, and other financial information included in this report, fairly present in all material respects the
financial condition, results of operations and cash flows of the registrant as of, and for, the periods presented in this report;4. The registrant’s other certifying officer and I are responsible for establishing and maintaining disclosure controls and procedures (as defined in Exchange
Act Rules 13a-15(e) and 15d-15(e)) and internal control over financial reporting (as defined in Exchange Act Rules 13a-15(f) and 15d-15(f)) for the registrant andhave:
a) Designed such disclosure controls and procedures, or caused such disclosure controls and procedures to be designed under our supervision, to ensure thatmaterial information relating to the registrant, including its consolidated subsidiaries, is made known to us by others within those entities, particularly during theperiod in which this report is being prepared;
b) Designed such internal control over financial reporting, or caused such internal control over financial reporting to be designed under our supervision, toprovide reasonable assurance regarding the reliability of financial reporting and the preparation of financial statements for external purposes in accordance withgenerally accepted accounting principles;
c) Evaluated the effectiveness of the registrant’s disclosure controls and procedures and presented in this report our conclusions about the effectiveness of thedisclosure controls and procedures, as of the end of the period covered by this report based on such evaluation; and
d) Disclosed in this report any change in the registrant’s internal control over financial reporting that occurred during the registrant’s most recent fiscalquarter (the registrant’s fourth fiscal quarter in the case of an annual report) that has materially affected, or is reasonably likely to materially affect, the registrant’sinternal control over financial reporting; and
5. The registrant’s other certifying officer and I have disclosed, based on our most recent evaluation of internal control over financial reporting, to theregistrant’s auditors and the audit committee of the registrant’s board of directors (or persons performing the equivalent function):
a) All significant deficiencies and material weaknesses in the design or operation of internal control over financial reporting which are reasonably likely toadversely affect the registrant’s ability to record, process, summarize and report financial information; and
b) Any fraud, whether or not material, that involves management or other employees who have a significant role in the registrant’s internal control overfinancial reporting.
Date: April 23, 2019
/s/ Todd M. CelloName: Todd M. CelloTitle: Chief Financial Officer
Exhibit 32
Certification of CEO and CFO Pursuant to18 U.S.C. Section 1350,as Adopted Pursuant to
Section 906 of the Sarbanes-Oxley Act of 2002
In connection with the Quarterly Report on Form 10-Q of TransUnion for the period ended March 31, 2019 , as filed with the Securities and ExchangeCommission on the date hereof (the “Report”), James M. Peck, as Chief Executive Officer of the Company, and Todd M. Cello, as Chief Financial Officer of theCompany, each hereby certifies, pursuant to 18 U.S.C. § 1350, as adopted pursuant to § 906 of the Sarbanes-Oxley Act of 2002, that, to their knowledge:
(1) The Report fully complies with the requirements of Section 13(a) or 15(d) of the Securities Exchange Act of 1934; and(2) The information contained in the Report fairly presents, in all material respects, the financial condition and results of operations of TransUnion.
April 23, 2019
/s/ James M. PeckName: James M. PeckTitle: Chief Executive Officer
/s/ Todd M. CelloName: Todd M. CelloTitle: Chief Financial Officer
This certification accompanies this Form 10-Q and shall not be deemed “filed” for purposes of Section 18 of the Securities Exchange Act of 1934, or otherwisesubject to the liability of that Section.