43
University of Manchester Apr. 2014 Kevin Anderson web: kevinanderson.inf o twitter: @KevinClimate The Ostrich or the Phoenix? ... cognitive dissonance or creativity in a changing climate
| Date post: | 16-Dec-2015 |
| Category: |
Documents |
| Upload: | omar-westbrook |
| View: | 218 times |
| Download: | 0 times |
University of ManchesterApr. 2014
Kevin Anderson
web: kevinanderson.info
twitter: @KevinClimate
The Ostrich or the Phoenix? ... cognitive dissonance or creativity in a changing climate

My headline conclusion:
Avoiding “dangerous climate change” (stabilisation at 2°C) remains a feasible goal of the international community
just and only
… if we deliver a radical reduction in energy consumption now!

Fredag in Stockholm: IPCC science report released
Offered neither surprise nor solace to our fossil-fuel hungry world
The science message for policy-makers, business leaders and civil society has changed very little during the last twenty years
Small adjustments and refinements have occurred – but this is a mature science

So what has changed?
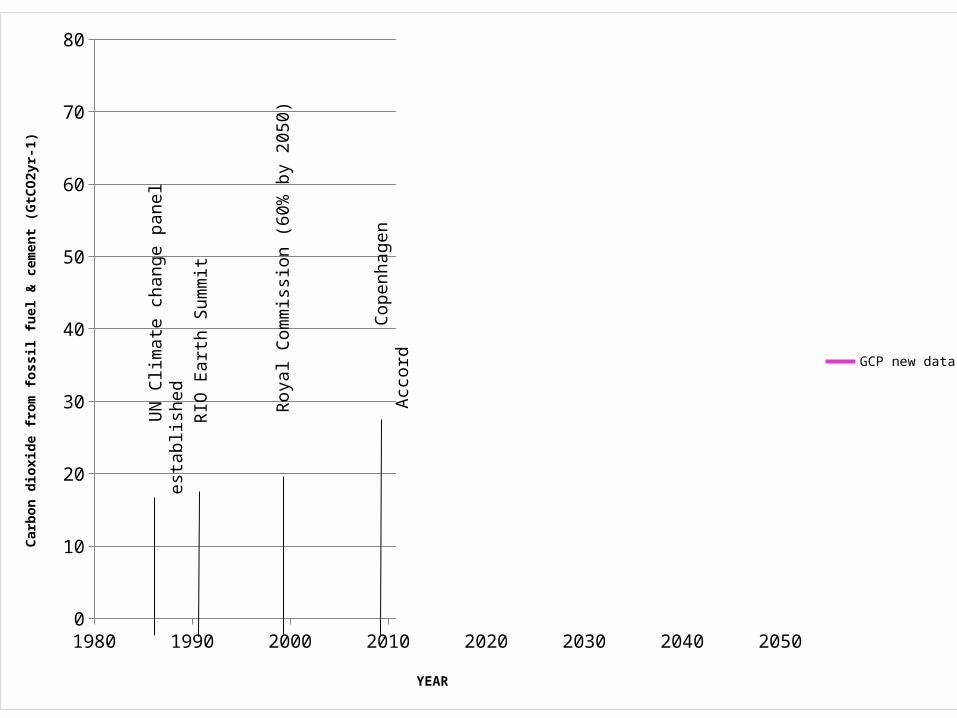
An additional 200 billion tonnes of CO2 pumped into the atmosphere
since last report (AR4 2007)
Annual emissions ~60% higher than at time of the first report in 1990
Atmospheric CO2 levels higher than during past 800 thousand years

Yet we repeatedly recommit to:
… make our fair contribution to…
“To hold the increase in global temperature below 2 degrees
Celsius, and take action to meet this objective consistent
with science and on the basis of equity”
Copenhagen Accord, 2009

… but why radical reductions in energy demand?
Surely…
we can deliver 2°C mitigation through low-carbon energy supply?
… in 2014, it’s all about timing!
temperature is about cumulative emissions / carbon budgets
(i.e. the area under the curve)
reduction targets for 2050 dangerously misunderstand climate science

Thinking about this ‘graphically’

1980 1990 2000 2010 2020 2030 2040 20500
10
20
30
40
50
60
70
80
GCP new data
YEAR
Carb
on d
ioxi
de fr
om fo
ssil
fuel
& ce
men
t (Gt
CO2y
r-1)
UN
Clim
ate
chan
ge p
anel
est
ablis
hed

1980 1990 2000 2010 2020 2030 2040 20500
10
20
30
40
50
60
70
80
GCP new data
YEAR
Carb
on d
ioxi
de fr
om fo
ssil
fuel
& ce
men
t (Gt
CO2y
r-1)
UN
Clim
ate
chan
ge p
anel
est
ablis
hed
R
IO E
arth
Sum
mit

1980 1990 2000 2010 2020 2030 2040 20500
10
20
30
40
50
60
70
80
GCP new data
YEAR
Carb
on d
ioxi
de fr
om fo
ssil
fuel
& ce
men
t (Gt
CO2y
r-1)
UN
Clim
ate
chan
ge p
anel
est
ablis
hed
R
IO E
arth
Sum
mit
R
oyal
Com
mis
sion
(60%
by
2050
)
1980 1990 2000 2010 2020 2030 2040 20500
10
20
30
40
50
60
70
80
GCP new data
YEAR
Carb
on d
ioxi
de fr
om fo
ssil
fuel
& ce
men
t (Gt
CO2y
r-1)
UN
Clim
ate
chan
ge p
anel
est
ablis
hed
R
IO E
arth
Sum
mit
R
oyal
Com
mis
sion
(60%
by
2050
)
Cop
enha
gen
Acco
rd

1980 1990 2000 2010 2020 2030 2040 20500
10
20
30
40
50
60
70
80
GCP new data
YEAR
Carb
on d
ioxi
de fr
om fo
ssil
fuel
& ce
men
t (Gt
CO2y
r-1)
UN
Clim
ate
chan
ge p
anel
est
ablis
hed
R
IO E
arth
Sum
mit
R
oyal
Com
mis
sion
(60%
by
2050
)
Cop
enha
gen
Acco
rd
Rio
+ 2
0 … despite economic downturn, emissions continue to rise 5% in 2010; 2-3% p.a. since.

1980 1990 2000 2010 2020 2030 2040 20500
10
20
30
40
50
60
70
80
GCP new data
YEAR
Carb
on d
ioxi
de fr
om fo
ssil
fuel
& ce
men
t (Gt
CO2y
r-1)
UN
Clim
ate
chan
ge p
anel
est
ablis
hed
R
IO E
arth
Sum
mit
R
oyal
Com
mis
sion
(60%
by
2050
)
Cop
enha
gen
Acco
rd
Rio
+ 2
0 … so what of future emissions?

1980 1990 2000 2010 2020 2030 2040 20500
10
20
30
40
50
60
70
80
GCP new data
YEAR
Carb
on d
ioxi
de fr
om fo
ssil
fuel
& ce
men
t (Gt
CO2y
r-1) Energy system design lives (lock-in)
Power stations Large scale infrastructures Built environment Aircraft & ships
30-100 years

1980 1990 2000 2010 2020 2030 2040 20500
10
20
30
40
50
60
70
80
GCP new data
YEAR
Carb
on d
ioxi
de fr
om fo
ssil
fuel
& ce
men
t (Gt
CO2y
r-1)
Extrapolation of 3.5%, 3, 2, 1% … (i.e. globalisation + unconventional fossil fuel
& late transition to low carbon energy)

1980 1990 2000 2010 2020 2030 2040 20500
10
20
30
40
50
60
70
80
GCP new data
YEAR
Carb
on d
ioxi
de fr
om fo
ssil
fuel
& ce
men
t (Gt
CO2y
r-1)
Extrapolation of 3.5%, 3, 2, 1% … (i.e. globalisation + unconventional fossil fuel
& late transition to low carbon energy)
1980 1990 2000 2010 2020 2030 2040 20500
10
20
30
40
50
60
70
80
GCP new data
YEAR
Carb
on d
ioxi
de fr
om fo
ssil
fuel
& ce
men
t (Gt
CO2y
r-1)
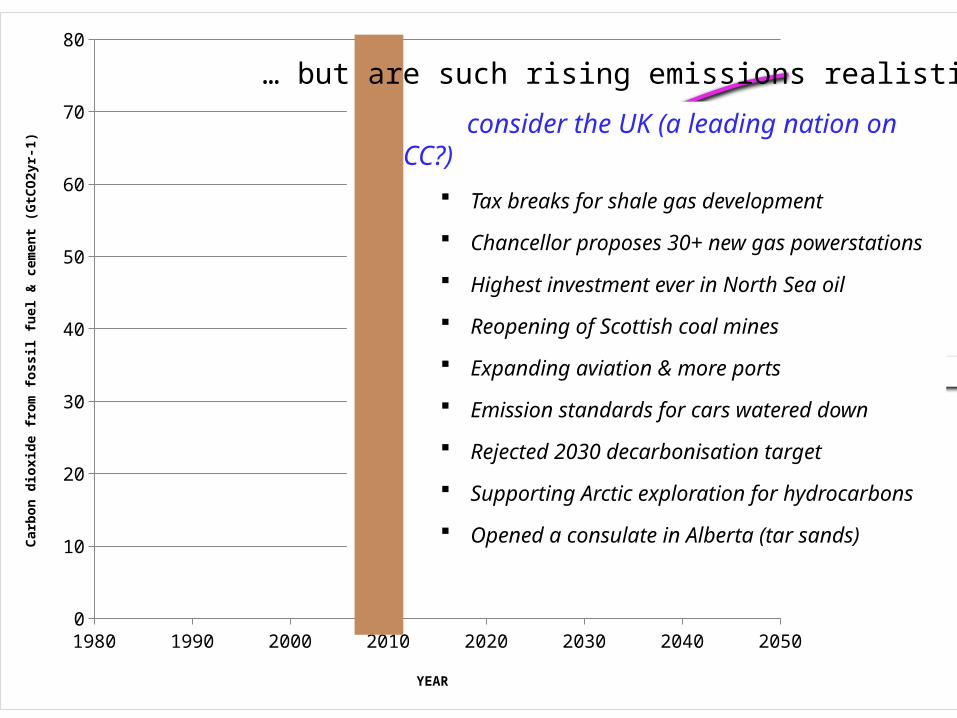
consider the UK (a leading nation on CC?)
Tax breaks for shale gas development
Chancellor proposes 30+ new gas powerstations
Highest investment ever in North Sea oil
Reopening of Scottish coal mines
Expanding aviation & more ports
Emission standards for cars watered down
Rejected 2030 decarbonisation target
Supporting Arctic exploration for hydrocarbons
Opened a consulate in Alberta (tar sands)
… but are such rising emissions realistic?

1980 1990 2000 2010 2020 2030 2040 20500
10
20
30
40
50
60
70
80
GCP new data
YEAR
Carb
on d
ioxi
de fr
om fo
ssil
fuel
& ce
men
t (Gt
CO2y
r-1)
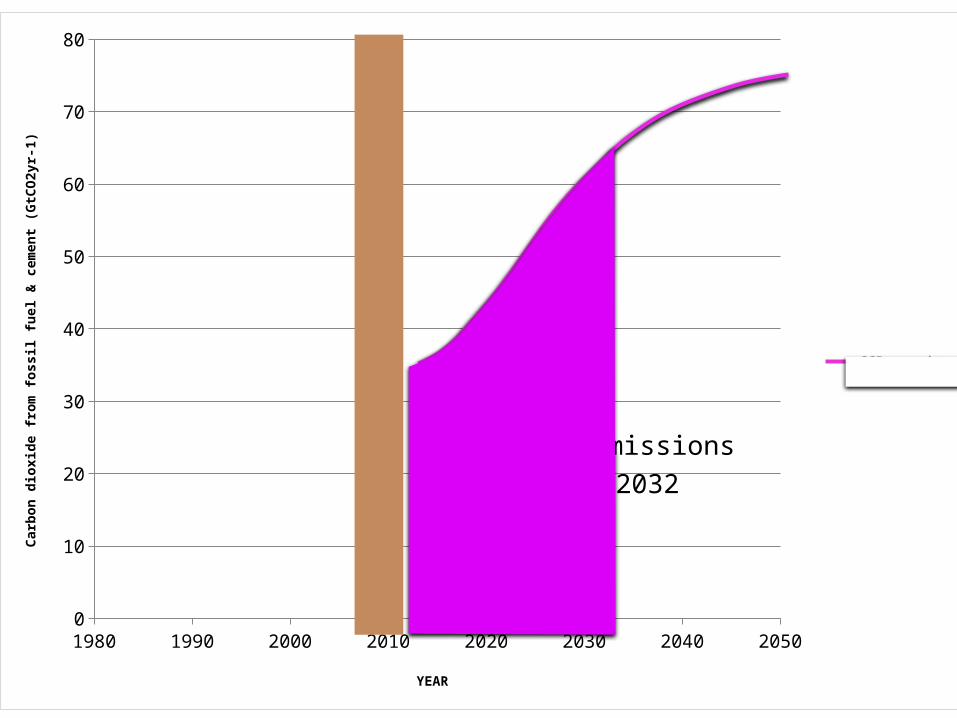
i.e. we’re set to emit …
between 2000 to 2050 >2500GtCO2
and for 2000 to 210 ~5000GtCO2

1980 1990 2000 2010 2020 2030 2040 20500
10
20
30
40
50
60
70
80
GCP new data
YEAR
Carb
on d
ioxi
de fr
om fo
ssil
fuel
& ce
men
t (Gt
CO2y
r-1)
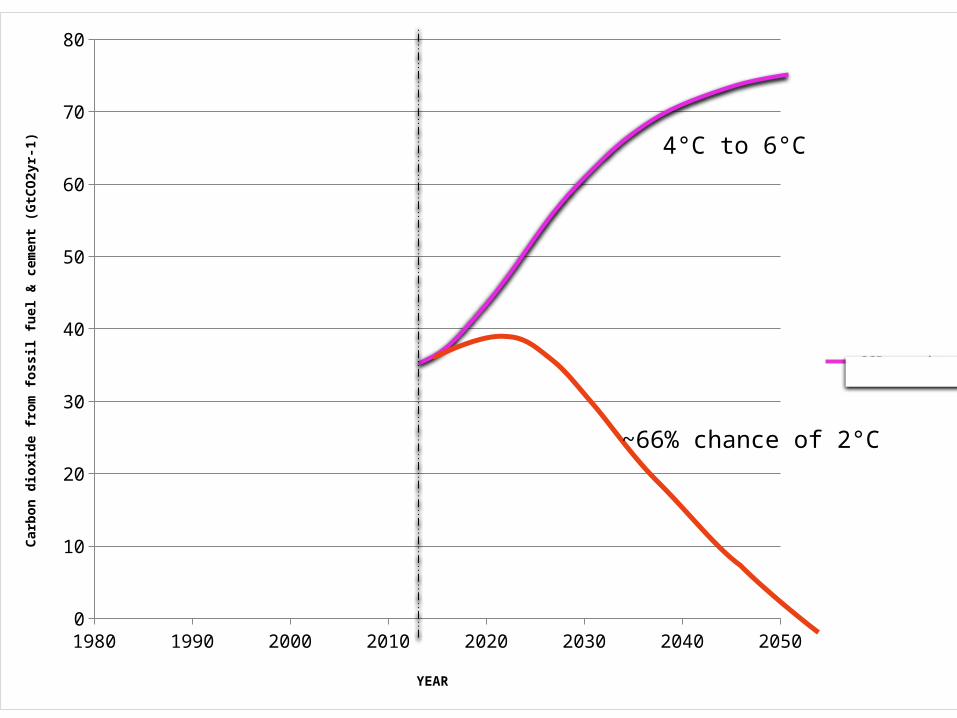
i.e. 4°C to 6°C by 2070-2100

1980 1990 2000 2010 2020 2030 2040 20500
10
20
30
40
50
60
70
80
GCP new data
YEAR
Carb
on d
ioxi
de fr
om fo
ssil
fuel
& ce
men
t (Gt
CO2y
r-1)
Yet for a good chance of <2°C can emit only 1000GtCO2 (AR5)
1980 1990 2000 2010 2020 2030 2040 20500
10
20
30
40
50
60
70
80
GCP new data
YEAR
Carb
on d
ioxi
de fr
om fo
ssil
fuel
& ce
men
t (Gt
CO2y
r-1)
i.e. no emissions after 2032

So recent history supports the IEA view
… that the CO2 trend “is perfectly in line with a
temperature increase of 6 degrees Celsius, which would have devastating consequences for the planet.”
Fatih Birol - IEA chief economist

… but what about 2°C?
1980 1990 2000 2010 2020 2030 2040 20500
10
20
30
40
50
60
70
80
GCP new data
YEAR
Carb
on d
ioxi
de fr
om fo
ssil
fuel
& ce
men
t (Gt
CO2y
r-1)
4°C to 6°C
~66% chance of 2°C
1980 1990 2000 2010 2020 2030 2040 20500
10
20
30
40
50
60
70
80
GCP new data
YEAR
Carb
on d
ioxi
de fr
om fo
ssil
fuel
& ce
men
t (Gt
CO2y
r-1)
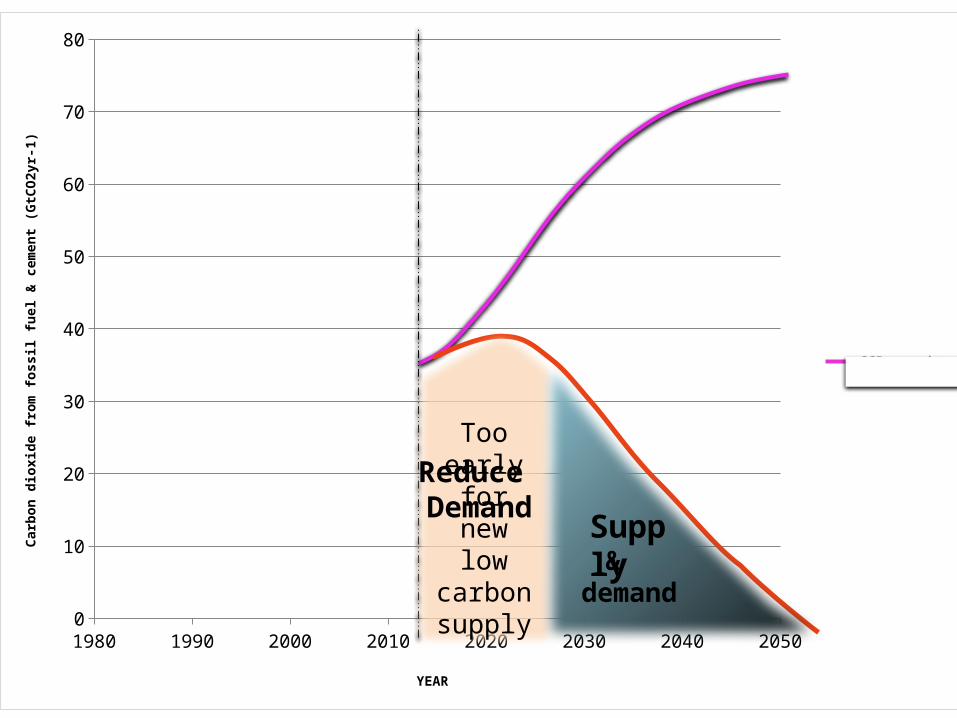
Too early for new
low carbonsupply &
demand
Reduce Demand
Supply

1980 1990 2000 2010 2020 2030 2040 20500
10
20
30
40
50
60
70
80
GCP new data
YEAR
Carb
on d
ioxi
de fr
om fo
ssil
fuel
& ce
men
t (Gt
CO2y
r-1)
But this is a global analysis
& demand
Reduce Demand
Supply

1980 1990 2000 2010 2020 2030 2040 20500
10
20
30
40
50
60
70
80
GCP new data
YEAR
Carb
on d
ioxi
de fr
om fo
ssil
fuel
& ce
men
t (Gt
CO2y
r-1)
& demand
Reduce Demand
Supply
“To hold the increase in global temperature below 2 degrees
Celsius, and take action to meet this objective consistent with
science and on the basis of equity”

Assuming poorer (non-Annex 1) nations:
1. Collectively peak their emissions by 2025
2. Reduce thereafter at 6-8% p.a.

… then, for 2°C, wealthy (Annex 1) nations require:
At least 10% reduction in emissions year on year, i.e.
40% reduction by ~2018 (c.f. 1990)70% ~202490% ~2030
i.e. RADICAL EMISSION REDUCTIONS
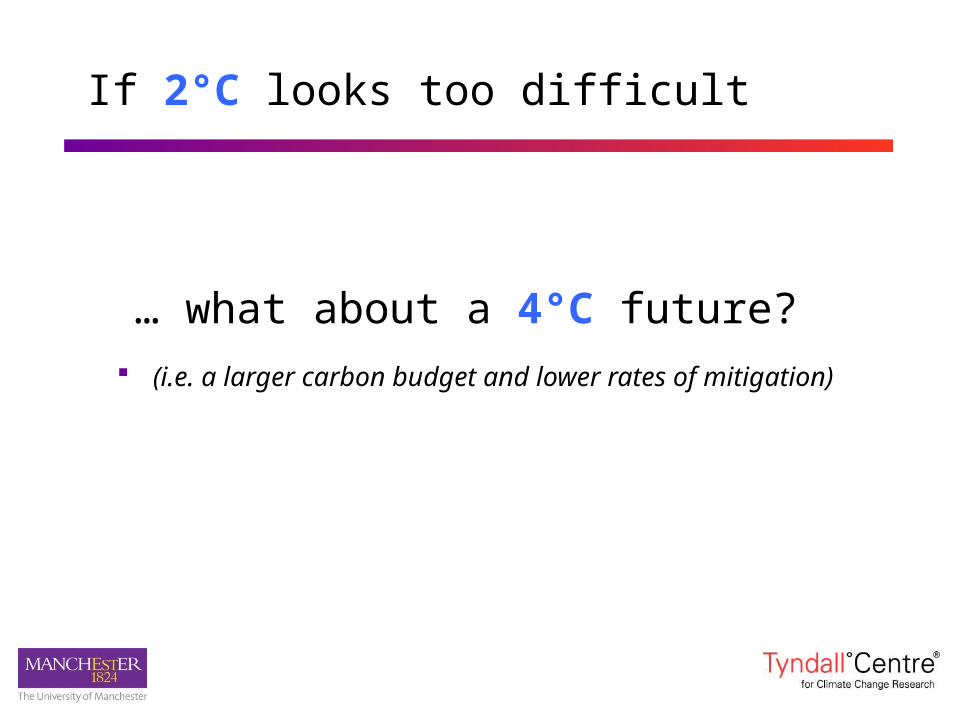
… what about a 4°C future? (i.e. a larger carbon budget and lower rates of mitigation)
If 2°C looks too difficult
What are potential 4°C impacts?
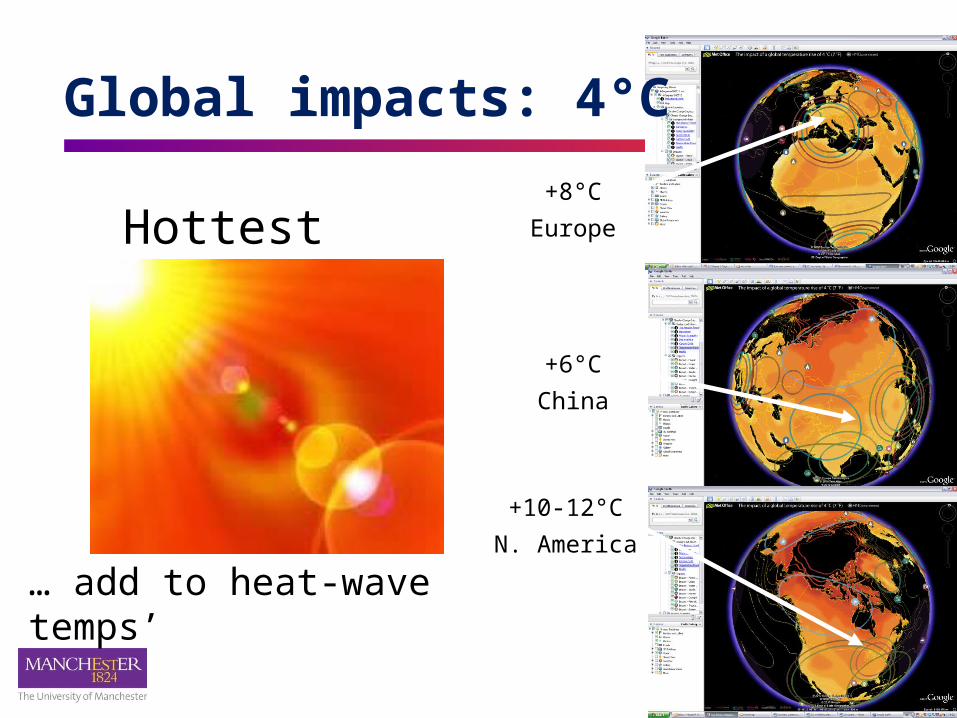
Global impacts: 4°C
+8°C
Europe
+6°C
China
+10-12°C
N. America
Hottest days
… add to heat-wave temps’

Global impacts: 4°C
Sea level rise80cm rise,
higher in low
latitudes

Global impacts: 4°C
Food crops… up to 40% reduction in
maize, wheat & rice yields in low latitudes.

There is a widespread view that 4°C is… Incompatible with an organised global community
Beyond ‘adaptation’
Devastating to eco-systems
Highly unlikely to be stable (‘tipping points)
… consequently …
4°C should be avoided at ‘all’ costs
… so going beyond 2°C is not viable?
To conclude
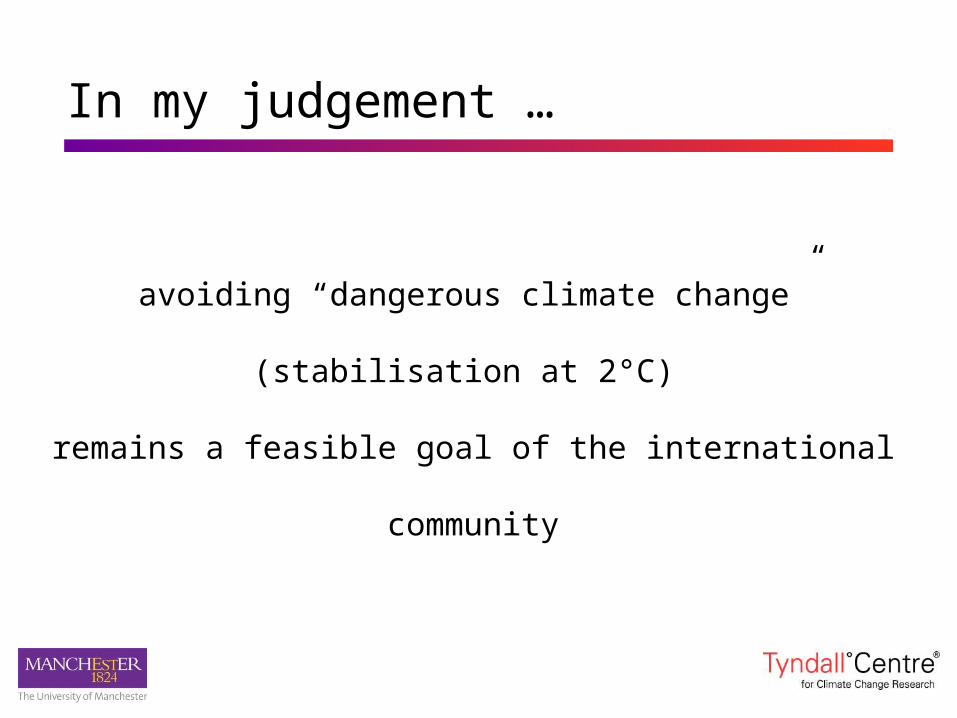
In my judgement …
avoiding “dangerous climate change” (stabilisation at 2°C)
remains a feasible goal of the international community

Three pillars underpin this view
Equity: a small group have to make radical & early reductions
~40-60% of emissions from ~1-5% of the population
Technology: demand side can deliver early & large reductions
an A++ rated fridge uses ~85% less energy than an ‘A’ model
Growth: there are alternative measures of a good life
above a threshold GDP is a poor proxy for welfare

A Radical Plan for 2°C – 2 phases
1. Radical reductions in energy demand from now to ~2030
2. Marshall plan build programme of low-carbon energy supply
… with 100% penetration by 2030-40

We must escape the shackles of a twentieth century mind-set if we are ever to resolve twenty-first century challenges
Delivering on our 2°C commitment will demand leadership, courage, innovative thinking, engaged teams & difficult choices
Ultimately…

“at every level the greatest obstacle to transforming the world is that we lack the clarity and imagination to conceive that it could be different.”
As Robert Unger noted …
Thank you
University of ManchesterApr. 2014
Kevin Anderson
web: kevinanderson.info
twitter: @KevinClimate


