76
University of Toronto Pension Plans Annual Financial Report For the Year Ended June 30, 2006

University of Toronto
Pension Plans
Annual Financial Report
For the Year Ended June 30, 2006

2
Table of Contents
Introduction..............................................................................................................................3 The University of Toronto Pension Plan (“RPP”) ................................................................4 University of Toronto (OISE) Pension Plan (“OISE/UT”) ..................................................6 Supplemental Retirement Arrangement (“SRA”)................................................................8 Pension Liabilities - Benefits ...................................................................................................9 Pension Assets.........................................................................................................................11
Investment Strategy and Investment Performance .............................................12 Contribution Strategy.............................................................................................13 Plan Benefit Changes..............................................................................................16 Solvency Valuation..................................................................................................18
Conclusions about Pension Financial Health ......................................................................20 Appendices Financial Statements for the Year Ended June 30, 2006
A. University Of Toronto Pension Plan ..................................................................22 B. University of Toronto (OISE) Pension Plan ......................................................36
Actuarial Report at July 1, 2006:
C. University of Toronto Pension Plan ...................................................................50 D. University of Toronto (OISE) Pension Plan ......................................................60 E. Supplemental Retirement Arrangement............................................................69
Pension Strategy...............................................................................................................71

3
Introduction
This report provides the Audit Committee and the Business Board with an update of the pension liabilities and assets as well as an assessment of how well the University’s pension investment and contribution strategies ensure pension financial health. The University of Toronto provides pension benefits to current and future pensioners via three defined benefit pension plans: the registered University of Toronto Pension Plan (“RPP”), the registered University of Toronto (OISE) Pension Plan (“OISE/UT”), and the unregistered Supplemental Retirement Arrangement plan (“SRA”).
Accrued Liabilities for the year ended July 1, 2006
(millions of dollars)
RPP, $2,540.6M, 92%
SRA, $122.1M, 4%
OISE/UT, 108.6M, 4%
The RPP was established in 1966 as a contributory defined benefit pension plan.
Benefits are determined by a formula defined in the plan and the cost of those benefits, after employee contributions, determines the University’s funding obligation. The University became responsible for the OISE/UT plan in 1996, when the Ontario Institute for Studies in Education merged with the University. This defined benefit plan covers U of T employees who were previously Ontario Institute for Studies in Education employees and are either continuing employees or retirees. All new employees in the OISE/UT division become members of the RPP. Each of the RPP and the OISE/UT plans continue to be administered separately, as each is a separate legal entity subject to the Pension Benefits Act (Ontario). The SRA was established July 1, 1996, to provide eligible members of the RPP and OISE/UT plans with additional retirement income over the limits in the regulations to

4
the Income Tax Act (Canada) on the amount of lifetime retirement benefits payable from the registered plans. The SRA is not registered with the federal government or any provincial government. The Governing Council of the University of Toronto is the administrator and sponsor of all three plans. The Vice-President, Human Resources and Equity is responsible for the formulation of pension plan policy, employee communication and benefits administration, and negotiation of plan benefits. The Vice-President, Business Affairs is responsible for the financial administration of the funds including liaison with the trustee, actuarial consultant, investment manager and external auditors.
Plan advisors are State Street Trust Company (trustee and custodian), Hewitt Associates LLC (actuaries and consultants), Ernst & Young LLP (external auditors) and University of Toronto Asset Management Corporation (investment manager).
The University of Toronto Pension Plan (“RPP”) At July 1, 2006, accrued liabilities for members of the RPP were $2.54 billion, while the market value of assets was $2.49 billion for a market deficit of $50.7 million. This reflects the augmentation to Faculty and Librarian pensioners, the elimination of mandatory retirement, and the increase in pension provisions to various trade unions and non-unionized administrative staff. The graph below illustrates the growth in accrued liabilities and the fluctuation in the market value of assets over the period from July 1, 1999 to July 1, 2006.
RPPAccrued Liabilities, Market Value of Assets, and Market
Surplus or (Deficit) at July 1 (in millions of dollars)
(500.0)
-
500.0
1,000.0
1,500.0
2,000.0
2,500.0
3,000.0
Accrued liabilities 1,575.1 1,680.2 1,770.5 1,904.9 2,066.7 2,225.0 2,407.0 2,540.6
Market value of assets 2,008.7 2,259.4 2,062.9 1,940.0 1,863.2 2,111.8 2,320.6 2,489.9
Market surplus (deficit) 433.6 579.2 292.4 35.1 (203.5) (113.2) (86.4) (50.7)
1999 2000 2001 2002 2003 2004 2005 2006

5
While the market deficit at July 1, 2006 was $50.7 million the actuarial deficit was $93.4 million. The difference reflects the actuarial smoothing of market gains and losses over three years to reduce the in-year impact of fluctuations in investment performance. Both the actuarial surplus (deficit) and the market surplus (deficit) are useful measures to assess the financial health of the pension plans and the appropriateness of strategies designed to maintain that health. During 2005-06 the financial health of the RPP improved as a result of the special payment the University is making to reduce the deficit. The University funding for the current service cost and the amortization of the deficit amounted to $84.0 million.
RPP Market Surplus (Deficit) and Actuarial Surplus (Deficit)
at July 1 (in millions of dollars)
(300.0)
(200.0)
(100.0)
-
100.0
200.0
300.0
400.0
500.0
600.0
700.0
Market surplus (deficit) 433.6 579.2 292.4 35.1 (203.5) (113.2) (86.4) (50.7)
Actuarial surplus (deficit) 352.1 391.8 337.7 194.0 2.2 (69.2) (117.2) (93.4)
1999 2000 2001 2002 2003 2004 2005 2006
Plan participation is increasing steadily, with current enrolment at 7,599 active participants and 4,323 retirees.

6
RPP Member Participation
at July 1
-
2,000
4,000
6,000
8,000
10,000
12,000
14,000
16,000
Suspended, exempt, pending 957 987 868 1,033 1,447 1,076 1,164 1,178
Terminated, vested 362 396 677 724 489 961 1,072 1,154
Retired participants 3,409 3,543 3,642 3,813 3,942 4,078 4,246 4,323
Active participants 6,137 6,381 6,504 6,759 7,141 7,288 7,452 7,599
1999 2000 2001 2002 2003 2004 2005 2006
While retirees represent 30% of the total plan participants, they represent 50% of the plan liabilities (because the average liability is higher for retirees, who are already receiving payments, than for actives, whose pensions will not start for many years).
University of Toronto (OISE) Pension Plan (“OISE/UT”) At July 1, 2005, accrued liabilities for members of the OISE/UT plan amounted to $108.6 million, while the assets of the OISE/UT plan amounted to $113.8 million for a market surplus of $5.2 million. These figures incorporate the assets and accrued liability related to the partial plan wind-up (mentioned in the paragraph below).
On August 16, 2000 the Superintendent of Financial Services ordered that the OISE/UT pension plan be wound-up in part in relation to members who terminated employment with the Ontario Institute for Studies in Education between February 1996 and June 30th 1996 under special early retirement or severance packages. The decision in the Monsanto case confirms the position of the Superintendent of Financial Services Commission of Ontario that, on the partial wind-up of a pension plan, the assets of the pension fund related to that part of the pension plan being wound up must be distributed, which includes any surpluses. An actuarial report on the partial plan wind-up was filed in June 2005 to determine the assets allocable to the partial plan wind-up group as of June 30, 1996. The assets allocable to the partial plan wind-up group as of June 30, 2005 was $12.0 million. The July 1, 2006 actuarial report updates the assets allocable to the partial plan wind-up group to $12.6 million as of June 30, 2006. The assets allocable to the

7
partial plan wind-up group will be used to provide for settlement of pension entitlements still remaining in the plan for partial wind-up members (settlement through annuity purchase or lump sum transfer), surplus allocation for partial wind-up members, and expenses associated with the partial wind-up and surplus distribution.
The graph below illustrates the growth in accrued liabilities and the fluctuation in
the market value of assets over the period from July 1, 1999 to July 1, 2006.
OISE/UTAccrued Liabilities, Market Value of Assets, and Market
Surplus at July 1 (in millions of dollars)
-
20.0
40.0
60.0
80.0
100.0
120.0
Accrued liabilities 65.9 69.4 73.8 77.9 83.4 97.6 103.7 108.6
Market value of assets 95.5 109.0 100.2 94.7 90.5 101.8 109.0 113.8
Market surplus 29.6 39.6 26.4 16.8 7.1 4.2 5.3 5.2
1999 2000 2001 2002 2003 2004 2005 2006
After incorporating the augmentation to Faculty and Librarian pensioners, elimination of mandatory retirement, the increase in pension provisions to various trade unions and non-unionized administrative staff, and incorporating the impact of the partial plan wind up (noted above), the market surplus at July 1, 2006 was $5.2 million, and the actuarial surplus was $4.0 million. The difference reflects the actuarial smoothing of market gains and losses over three years to reduce the in-year impact of fluctuations in investment performance. Both the actuarial surplus and the market surplus are useful measures to assess the financial health of the pension plans and to determine what strategies to pursue to ensure their continued good financial health. During 2005-06 the financial health of the OISE/UT plan remained stable, due to investment returns offsetting accrued liability increases.

8
OISE/UT Market Surplus and Actuarial Surplus
at July 1 (in millions of dollars)
-
5.0
10.0
15.0
20.0
25.0
30.0
35.0
40.0
45.0
Market surplus 29.6 39.6 26.4 16.8 7.1 4.2 5.3 5.2
Actuarial surplus 26.9 31.5 29.8 25.5 18.0 7.1 4.6 4.0
1999 2000 2001 2002 2003 2004 2005 2006
Since the OISE/UT plan is a closed plan, member participation has decreased from 357 in 1999 to 308 in 2006. The number of active members has declined from 227 in 1999 to 131 in 2006.
While nothing can be certain, the current OISE/UT asset base is slightly larger than the accrued liabilities and the surplus should be adequate to meet the University current service cost obligations for its declining member base through to 2009.
Supplemental Retirement Arrangement (“SRA”) As noted earlier, the SRA is an unregistered defined benefit pension plan, the role of which is to provide pensions in excess of the Income Tax maximum salary (currently about $114,000 in 2006 increasing to about $130,000 by 2009) to the pensionable earnings cap of $150,000. It was created on July 1, 1996.
The Federal budget of February 2005 provided for increases in the defined benefit
maximum pension limits under the Income Tax Act. As a result, a portion of the active accrued liability shifted from the SRA to the RPP. When the Income Tax Act maximum salary and the current SRA earnings cap of $150,000 converge, there will be essentially no SRA benefit for active members.
The SRA accrued liabilities at July 1, 2006 were $122.1 million and the market value of the assets of the funds set aside was $136.2 million, for a market reserve of

9
$14.1 million. These excess funds act as a reserve against investment volatility and other uncertainties.
SRAAccrued Liabilities, Market Value of Assets,
and Market Reserve or (Deficit) at July 1 (in millions of dollars)
(60.0)
(40.0)
(20.0)
-
20.0
40.0
60.0
80.0
100.0
120.0
140.0
160.0
Accrued liabilities 77.9 107.9 116.8 131.8 108.6 122.7 112.9 122.1
Market value of assets (Actuary Rpt) 57.5 80.2 82.2 89.1 91.2 115.8 130.6 136.2
Market reserve (deficit) (20.4) (27.7) (34.6) (42.7) (17.4) (6.9) 17.7 14.1
1999 2000 2001 2002 2003 2004 2005 2006
The SRA assets are invested in the University’s Long-Term Capital Appreciation Pool (LTCAP) and governed by the Policy for Investment of University Funds, which was approved by the Business Board on April 7, 2003. This policy stipulates a target real investment return of 4.0% and a risk tolerance of 10% over 10 year periods. Investment management has been delegated to the University of Toronto Asset Management Corporation.
During 2005-06 the SRA market reserve declined slightly as a result of SRA
pensioner payments exceeding employer contributions, while investment returns offset the increase in accrued liabilities.
Pension Liabilities - Benefits
Accrued liabilities in the RPP and SRA have grown steadily due to regular growth (as explained on the next page), as well as pension benefit enhancements and increased participation. Since 1999, accrued liabilities have increased at a compound annual growth rate of 7.0% while total participation has increased at a compound annual growth rate of 4.0%.

10
The accrued liabilities reflect the number of individuals participating in the pension plan, their ages, and the pension benefits being paid, or payable in future, to each plan member.
Pension benefits for each member in these defined benefit plans reflect that person’s salary and number of years of pensionable service.
Pension benefits accrue at the rate of 1.5% (USW employees, various trade unions, and non-unionized administrative staff accrue pension benefits at a rate of 1.6% for past and future pensionable service, retroactive to January 1, 2006) of highest average salary up to the average CPP maximum salary plus 2.0% of highest average salary in excess of the average CPP maximum salary, to a maximum of $150,000.
Normal retirement is the June 30th following the 65th birthday. Retirement is possible within 10 years of normal retirement date, with a minimum of 2 years of service, with a reduction of 5% per annum between actual retirement and the normal retirement date, with special provisions with respect to that reduction. There is no longer a requirement to retire at age 65. There are various early retirement windows in place for unionized administrative staff and trade unions. The Agreement on Retirement Matters with the Faculty Association will impact retirements on and after June 30, 2006. This Agreement has been reflected in the July 1, 2006 actuarial valuation, but does not have a material impact. The pension benefits of retirees are subject to cost of living adjustments equal to the greater of a) the increase in the Consumer Price Index for Canada (CPI) for the previous calendar year, minus 4.0%, or b) 75% of the increase in the CPI for the previous calendar year to a maximum CPI increase of 8%, plus 60% of the increase in CPI in excess of 8%. In the past there have been plan augmentations that resulted in an increase in inflation protection to the augmentation date from 75% of CPI to 100% of CPI. As a result of the recent arbitration award to the University of Toronto Faculty Association (UTFA), all UTFA pensioners who retired prior to January 1, 2006 received an additional augmentation from 75% of CPI to 100% for July 1, 2005 and July 1, 2006.
Benefits improvements arise from negotiations with employee groups, and from mediation and arbitration, and are not normally determined unilaterally.

11
The table below provides a breakdown of the factors which impact the growth in the pension liabilities and assets.
Growth in Liabilities From Year to Year Growth in Assets From Year to Year
Liabilities at beginning of year (representing discounted present value of pension benefits
earned in respect of service up to the valuation date)
Value of pension fund assets at beginning of year
Plus Plus
Interest on liabilities at rate used to discount
the liabilities Rate of return on pension fund assets
Plus Plus
New liability for benefits earned by members in the year (current service) and new liability created by plan amendments during the year (past service)
Contributions made by members and University
Less Less
Pension payments and lump-sum transfers Pension payments, lump-sum transfers, fees and
expenses
Pension Assets
As shown above, RPP assets arise from contributions by employees and by the University and from investment returns on assets invested, minus payments made to pensioners, and fees and expenses incurred to administer and invest the pension funds. A market surplus occurs when pension assets at market value exceed the accrued liabilities calculated on a periodic basis by the actuaries. A market deficit occurs when accrued liabilities exceed the assets at market value. The actuarial results described earlier show a market deficit in the RPP. This has occurred because accrued liabilities have risen faster than the market value of the assets over the past several years, due to: - pension benefits enhancements. - contribution holidays by the University as required by the Income Tax Act
(Canada) for most years from 1987 to 2002 (not a 100% holiday in all years). - employee contribution holidays from 1997 to 2002 (not a 100% holiday in all
years).

12
- poor investment returns from 2001 through 2003. - experience losses due to pay increases higher than assumed in the valuation and
the mortality rates lower than assumed in the valuation. - changes in the valuation assumptions to better reflect anticipated future
experience.
Both the investment strategy and contribution strategy were reviewed and changed in April 2003. The pension investment policy was reconfirmed in March 2004, April 2005, and March 2006 and a new pension contribution strategy (see appendix) was adopted in January 2004.
Investment Strategy and Investment Performance
The registered pension plans are invested through the unitized pension master trust which combines for investment purposes the assets of the RPP and the OISE/UT pension plans. The master trust was created on August 1, 2000 to provide the two funds’ assets with the same economies of scale, diversification and investment performance. The Pension Master Trust Investment Policy was most recently approved by the Business Board on March 27, 2006. As required by the Financial Services Commission of Ontario, the Business Board annually reviews the investment policies and goals and confirms or amends them as appropriate. This policy stipulates a 4.0% real investment return target with a risk tolerance of 10% over 10 years. These targets have been in place since April 2003. Prior to that time the policy stipulated a 5% real investment return target, and did not precisely define a risk tolerance. Investment strategy and management to achieve these targets have been delegated by the Governing Council to the University of Toronto Asset Management Corporation (UTAM) since March 2004. Prior to that time, UTAM was responsible for investment strategy within an asset mix approved by the Business Board. The pension master trust has a long-term horizon, so investment performance is evaluated over a multi-year period. To assess how adequately the returns are meeting the longer term requirements set by the University, performance is assessed versus the 4.0% real investment return target. In addition, performance is evaluated versus a market index benchmark comprised of major market indices such as Canadian Equities, US Equities, International Equities and Canadian Fixed Income. The one-year return to June 30, 2006 for the pension master trust was 7.0%, net of fees and expenses and excluding returns on private investment interests. The table below summarizes investment performance for the years ending June 30.

13
1-Year Annual Rates of Return Year Ended
June 30 Pension Fund * Market Indices
Benchmark CPI
Plus 4%
2006 7.0 8.4 6.5 2005 10.9 11.2 5.7 2004 16.3 14.9 6.5 2003 0.6 0.0 6.6 2002 -2.0 -4.9 5.3
* Returns are time-weighted, calculated in accordance with industry standards and are net of investment fees and expenses and exclude returns on private investment interests.
The pension master trust return for the year ending June 30, 2006 was 7.0%, which exceeded the University’s target return of 6.5%. Return for the year was lower than the overall market indices benchmark (i.e. the target composition of different asset classes), primarily due to weak performance of our external managers in US and International equities which together comprise over 50% of the fund, and in respect of currency hedging activities which detract from benchmark performance. Performance in other asset classes was generally at or marginally lower, than the applicable market index benchmarks. A detailed review of the investment performance, which is manager and measured on a calendar year basis by UTAM, is available at www.utam.utoronto.ca. Pension plan fees and expenses for the pension master trust totaled $16.6 million for 2005-06 compared to $15.3 million for 2004-05. The change was largely due to an increase in fees paid to investment managers, which reflects the net increase in assets managed due to growth in the pension master trust asset values. On a percentage basis, total fees and expenses for 2005-06 were 0.66% of total master trust assets, unchanged from 2004-05. The management expense ratio (MER) is a standard investment industry ratio that compares the costs of investment management, both direct and indirect, to the total assets under management. The MER includes expenses incurred by UTAM, all investment management fees and the University of Toronto investment management overhead fee. It excludes other pension administration costs, such as external audit fees, records administration and actuarial fees. It also uses the average market values for the year. The MER for the pension master trust was 0.58% for 2005-06, unchanged from 2004-05.
Contribution Strategy
The RPP is a contributory pension plan. Contributions in respect of current
service cost, to fund pension benefits earned in the current year, are determined by our actuaries. The employee share of those contributions is determined by formula, with the employer contribution representing the difference between the total current service contribution required and the employee contribution.

14
Employer contributions are not permitted, under the Income Tax Act (Canada) when the actuarial surplus is greater than 10% of accrued liabilities. Additional employer contributions are required when the plan is in deficit. Plan deficits may be amortized through additional special payments over 15 years. An additional test, called the solvency test, may result in a pension deficit being required to be amortized through additional special payments over 5 years. During most years, from the late 1980’s to 2002, the RPP had a sufficiently high actuarial surplus that no employer contributions were permitted except for a couple of years in the early 1990’s. Employees experienced a pension contribution holiday from 1997 to 2002. The University made contributions to the SRA in accordance with the funding strategy, as mentioned earlier.
After 2002, both the actuarial and market surplus declined significantly. The University adopted a new pension contribution strategy in January 2004, to deal with market deficits in both the RPP and the SRA. Its objective was to provide smoothed funding to deal with the deficits in both the RPP and the SRA over the multi-year period, while permitting stable, predictable funding via the University’s operating budget. The key elements of the contribution strategy are: - employee contributions (no contribution holidays). - employer contributions at 100% of current service cost, beginning May 1, 2004. - additional special payments of $26.4 million to address the pension deficits,
beginning May 1, 2004, and was subsequently increased in 2005 by $800K to reflect the impact of the USW settlement.
- continue to set these funds aside, regardless of Income Tax restrictions. If not permitted to make contributions to the RPP, reserves should be set aside outside the RPP.
It is important to note that the actuarial surplus smoothes market gains and losses, but that in the longer run, these are just timing differences and that the pension must be properly funded and market surpluses or deficits addressed.
In November 2005, the pension projections that had been prepared the previous November were updated for the actual investment return for 2005, a forecasted investment return of 3.5% in 2006 and 6.5% return in the outer years. They were also updated for an increase in the salary escalation assumption to 4.5% from 4.0% and the impact of the USW settlement including the increase in the special payment of $800K. The following graph shows the expected actuarial and market surplus projected at that time. This is the starting point to which this year’s results will be added and now forms the base case for assessing the continued appropriateness and prudence of the pension contribution strategy.

15
Base Case (Projection done November 2005)
RPPProjected Actuarial and Market Surplus (Deficit)
per 2005 Actuarial Reportat July 1
(millions of dollars)
(160.0)
(140.0)
(120.0)
(100.0)
(80.0)
(60.0)
(40.0)
(20.0)
-
Actuarial surplus (deficit) - base (69.2) (117.2) (111.7) (102.3) (74.5) (37.7) (2.7) (1.7)
Market surplus (deficit) - base (113.2) (86.3) (136.1) (119.6) (83.2) (42.1) (4.9) (2.8)
2004 2005 2006 2007 2009 2011 2013 2015
The base case shows a market deficit of $136.1 million at July 1, 2006. By 2015, the market deficit is projected to be $2.8 million. Under the base case, the SRA market reserve is projected to be $85.5 million by 2015.
The actual RPP investment return (net of fees and expenses and excluding return on private investment interests) of 7.0% for 2005-06 was greater than the 3.5% investment return assumed in the base case. The following graph updates the base case for this actual investment return of 7.0% for 2006, while leaving all other assumptions unchanged and without incorporating plan changes that have been made. It is case A. It shows that the effect of the improved investment return is a reduction in the market deficit at July 1, 2006 from the $136.1 million projected in the base case to $34.1 million. In some years, the special payments permitted to the RPP would be less than the budgeted amount and would be reserved in the SRA fund, in accordance with the approved contribution strategy. By 2015, the effect is that the market surplus for case A would be $24.5 million, rather than the market deficit of $2.8 million projected in the base case. Under case A the projected SRA market reserve by 2015 would be $274.4 million as compared to an SRA market reserve of $85.5 million in the base case.

16
Case A
RPPProjected Market Surplus
2005 Actuarial Report Compared to Revised ProjectionsReflecting July 1, 2006 Actual Result
at July 1 (millions of dollars)
(160.0)
(140.0)
(120.0)
(100.0)
(80.0)
(60.0)
(40.0)
(20.0)
-
20.0
40.0
Market surplus (deficit) - base (113.2) (86.3) (136.1) (119.6) (83.2) (42.1) (4.9) (2.8)
Market surplus (deficit) - case A (113.2) (86.3) (34.1) (5.0) 21.8 22.6 23.4 24.5
2004 2005 2006 2007 2009 2011 2013 2015
However, case A is no longer relevant since Plan changes and augmentations affect the actuarial valuation which requires the University to review its impact on the current pension strategy.
Plan Benefit Changes As a result of the arbitration award to UTFA, all UTFA pensioners who retired
prior to January 1, 2006 received an additional augmentation to their pension benefit. The augmentations when combined with the regular indexation, brings the inflation protection for July 1, 2005 and July 1, 2006 up to 100% of the increase in the Consumers Price Index.
Other changes to the July 1, 2006 actuarial valuation include the effects of
eliminating mandatory retirement, the extension of 1.6% accrual rate to various trade unions and to non-unionized administrative staff for current and future pensionable service, and the temporary extension of the early retirement windows to various trade unions and to certain non-unionized administrative staff.
The effect of the plan changes, when added to the actual investment return for
2006, changes the market deficit for 2006 from $34.1 million in case A to $50.7 million in case B, and the projected market surplus for 2015 from $24.5 million to $23.4 million. The SRA market reserve in 2015 is projected to be $235.0 million in case B.

17
The following graph modifies the case A with the plan benefit changes mentioned above, while leaving all other assumptions unchanged. This is case B.
Case B
RPPProjected Market Surplus
2005 Actuarial Report Compared to Revised ProjectionsReflecting July 1, 2006 Actual Result
at July 1 (millions of dollars)
(160.0)
(140.0)
(120.0)
(100.0)
(80.0)
(60.0)
(40.0)
(20.0)
-
20.0
40.0
Market surplus (deficit) - base (113.2) (86.3) (136.1) (119.6) (83.2) (42.1) (4.9) (2.8)
Market surplus (deficit) - case B (113.2) (86.3) (50.7) (27.0) 21.1 21.8 22.5 23.4
2004 2005 2006 2007 2009 2011 2013 2015
Finally, case B needs to be updated to reflect the possibility of a poor investment
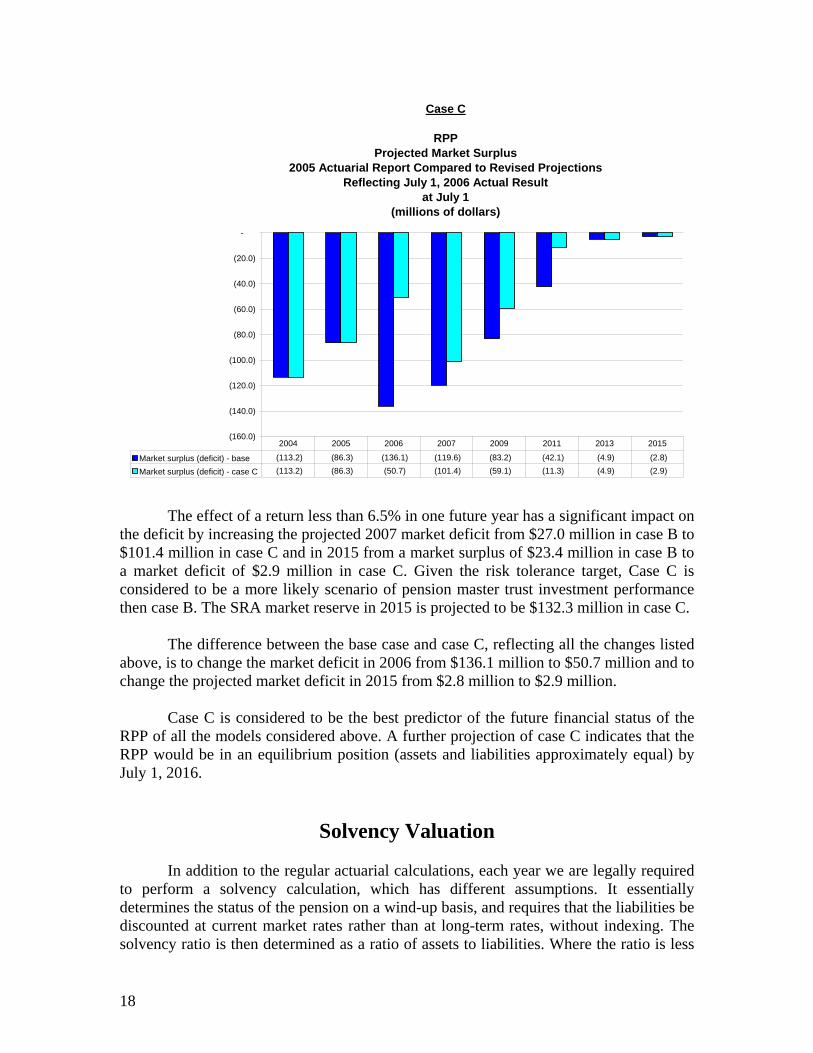
return for 2007. Simply including a favourable investment return for 2006 and leaving future years at 6.5% is not reasonable. The target risk tolerance of 10% standard deviation over 10 years means that the actual real investment return is expected to be between -6% and +14% two thirds of the time over a ten year period. Therefore, there is likely to be a year in which returns are less than 6.5%. To illustrate that, we have assumed a 3.5% return in 2007 rather than 6.5%. In fact, a low or negative return could occur in any year and showing it in 2007 is simply intended to demonstrate the impact. The choice of year is not material to the outcome. The following graph illustrates this sensitivity while leaving all other assumptions unchanged. This is case C.
18
Case C
RPPProjected Market Surplus
2005 Actuarial Report Compared to Revised ProjectionsReflecting July 1, 2006 Actual Result
at July 1 (millions of dollars)
(160.0)
(140.0)
(120.0)
(100.0)
(80.0)
(60.0)
(40.0)
(20.0)
-
Market surplus (deficit) - base (113.2) (86.3) (136.1) (119.6) (83.2) (42.1) (4.9) (2.8)
Market surplus (deficit) - case C (113.2) (86.3) (50.7) (101.4) (59.1) (11.3) (4.9) (2.9)
2004 2005 2006 2007 2009 2011 2013 2015
The effect of a return less than 6.5% in one future year has a significant impact on the deficit by increasing the projected 2007 market deficit from $27.0 million in case B to $101.4 million in case C and in 2015 from a market surplus of $23.4 million in case B to a market deficit of $2.9 million in case C. Given the risk tolerance target, Case C is considered to be a more likely scenario of pension master trust investment performance then case B. The SRA market reserve in 2015 is projected to be $132.3 million in case C.
The difference between the base case and case C, reflecting all the changes listed
above, is to change the market deficit in 2006 from $136.1 million to $50.7 million and to change the projected market deficit in 2015 from $2.8 million to $2.9 million.
Case C is considered to be the best predictor of the future financial status of the
RPP of all the models considered above. A further projection of case C indicates that the RPP would be in an equilibrium position (assets and liabilities approximately equal) by July 1, 2016.
Solvency Valuation In addition to the regular actuarial calculations, each year we are legally required to perform a solvency calculation, which has different assumptions. It essentially determines the status of the pension on a wind-up basis, and requires that the liabilities be discounted at current market rates rather than at long-term rates, without indexing. The solvency ratio is then determined as a ratio of assets to liabilities. Where the ratio is less

19
than 1.0, a solvency deficit exists, and special payments must fund this deficit over 5 years rather than over the normal 14 years.
The RPP solvency ratio, which is a measure of the assets market value as compared to the solvency liability of the plan (before indexing) as calculated by the actuaries, has remained essentially unchanged from 1.00 at July 1, 2005 to 1.00 at July 1, 2006. As of July 1, 2006, the plan has a small solvency excess of $21.4 million (RPP solvency ratio however is still at 1.00 to two decimal places while at July 1, 2005 it had a small solvency deficit of $10.5 million). On a wind-up basis (after indexing and incorporating early retirement windows) the deficit is $800.1 million. The primary reason for the decline in the solvency over a multi-year period is due to the very low long-term bond rates that are currently being experienced. Discounting at these low rates, together with the reflection of some changes in the prescribed basis for determining solvency liability, had the effect of significantly increasing the liabilities.
RPPSolvency Ratio and Accrued Liability
as at July 1
-
500.0
1,000.0
1,500.0
2,000.0
2,500.0
3,000.0
Acc
rued
Lia
bilit
y(in
mill
ion
of d
olla
rs)
0
0.2
0.4
0.6
0.8
1
1.2
1.4
Solv
ency
Rat
io
Accrued liabilities 1,575.1 1,680.2 1,770.5 1,904.9 2,066.7 2,225.0 2,407.0 2,540.6
Solvency Ratio 1.23 1.30 1.14 1.19 1.02 1.11 1.00 1.00
1999 2000 2001 2002 2003 2004 2005 2006
The OISE/UT solvency ratio was 1.05 at July 1, 2006, taking the partial wind-up into account. At July 1, 2005 it was 1.09 after taking the partial wind-up into account.

20
Conclusions about Pension Financial Health
RPP and SRA: When the pension contribution strategy was formulated in January 2004, it projected a market deficit for the RPP of $236.0 million in 2005 and $144.6 million in 2015. The University has contributed full current service costs and has made significant additional special payments well in excess of those required under legislation. During the intervening 3 years, the pension master trust has experienced investment returns, (net of fees and expenses and excluding returns on private investment interests) of 16.3% in 2004, 10.9% in 2005 and 7.0% in 2006, all greater than the target investment return of 4.0% plus inflation. This contributed to an improvement in the assets beyond that projected in January 2004. At the same time, there have been several factors impacting the liabilities. The CPI assumption was reduced from 3.0% to 2.5% in 2004 and the salary escalation assumption was increased from 4.0% to 4.5% in 2005. The benefits accrual rate for USW members, various trade unions and non-unionized administrative staff was increased from 1.5% to 1.6% for both past and future pensionable service. Also, augmentation to Faculty and Librarian pensioners for 100% CPI indexation and the affect of the elimination of mandatory retirement has occurred. The increase in the Income Tax maximum pension has added to the RPP liabilities that were previously recorded in the SRA. All of these factors have contributed to a growth in liabilities beyond that projected in January 2004. The net effect of all these changes has been that the market deficit at July 1, 2006 was $50.7 million, as compared to the $229.1 million predicted for 2006 back in January 2004, while the market deficit projected for 2015 is $2.9 million rather than $144.6 million. By 2016, pension assets and liabilities are projected to be in equilibrium (no deficit). The SRA is projected to have a market reserve of approximately $132.2 million by 2015. These funds represent a reserve to deal with investment volatility, solvency funding issues and other uncertainties and would be available to be deposited into the RPP should the need arise. The RPP solvency ratio, which is a measure of the assets' market value as compared to the solvency liability of the plan (before indexing), was 1.00 at July 1, 2006. It has remained essentially unchanged from July 1, 2005. On a wind-up basis (after indexing and incorporating early retirement windows) the deficit is $800.1 million.
The pension contribution strategy adopted in January 2004 has contributed to the
improvement in pension plan health. It is important to note that any future plan improvements will require additional funding above what is currently contemplated.

21
OISE:
When the pension contribution strategy was formulated in January 2004, it projected a market surplus for the OISE/UT plan. It also seemed unlikely at the time that the University would have to make current service contributions in the near future. At July 1, 2003 the market surplus was $7.1 million. Within the past 3 years, there have been plan augmentations as a result of changes to negotiated staff group pension benefits, changes to plan assumptions and the actuarial report for partial plan wind-up was been filed with the Superintendent of Financial Services of Ontario. Even with good investment returns over the past three years, when combined with the various changes to the plan, the market surplus has declined and is now $5.2 million as at July 1, 2006. The impact can be seen in the solvency ratio, which has declined from 1.23 at July 1, 2003 to 1.05 at July 1, 2006.
Although nothing can be certain, the current plan asset base is larger than the accrued liabilities and the surplus should be adequate to meet the University’s current service obligations for its declining member base through to 2009. Overall conclusion: The result for 2006 was a $50.7 million market deficit for the RPP and a $14.1 million SRA market reserve (excess of SRA assets over SRA liabilities).
The unfunded position has clearly improved. However, while the deficit is smaller, there are still a number of issues that continue to cause concern including the potential need to make payments into the OISE/UT plan, continuing increases in life expectancy that may require a change in mortality tables thus increasing liabilities, expected volatility in investment returns, whether we will meet the long-term return expectations given financial market trends, and the very large unfunded postretirement benefits liabilities, which we need to manage and control. There is also great concern this year about the University’s financial situation given the extraordinary pressures on the institution at this time, which must be factored into our short-term decisions about pension funding. Therefore, while we are currently recommending the continuation of the pension contribution strategy adopted in 2004 over the longer term, we are continuing to evaluate these issues, and short-term variations to that strategy may be recommended where this can be achieved without a major impact on the long-term goals for the pension plan.
Sheila Brown Chief Financial Officer
October 30, 2006

22
UNIVERSITY OF TORONTO PENSION PLAN
FINANCIAL STATEMENTS
JUNE 30, 2006

23
University of Toronto Pension Plan
Highlights
The University of Toronto Pension Plan (the “Plan”) is a contributory defined benefit plan. The net assets available for benefits were $2,489.9 million at June 30, 2006, an increase of $169.3 million or 7.3% from the previous year. This increase was a result of an overall favourable market performance.
For the five-year period from 2002 to 2006, the net assets available for benefits have increased from $1,940.0 million to $2,489.9 million.
Net Assets Available (Market Value) for Benefits as at June 30
(millions of dollars)
0
500
1000
1500
2000
2500
3000
1,940.0 1,863.2 2,111.8 2,320.6 2,489.9
2002 2003 2004 2005 2006
Accrued pension liabilities have also increased steadily over the years, as expected, due to continued accruals for active members, interest on accrued pension liabilities, as well as plan improvements due to negotiated settlements with various employee groups.
Accrued Pension Liability as at July 1
(millions of dollars)
0
500
1000
1500
2000
2500
3000
1,852.9 2,066.7 2,225.0 2,407.0 2,540.6
2002 2003 2004 2005 2006
As at July 1, 2006, the Plan has a market deficit of $50.7 million. The University continues to make additional employer contributions, which along with favourable investment returns reduced the deficit in the Plan.
Pension Surplus (Deficit) as at July 1
(millions of dollars)
-250
-200
-150
-100
-50
0
50
100
87.1 (203.5) (113.2) (86.4) (50.7)
2002 2003 2004 2005 2006

24
The University of Toronto Master Trust holds the assets of the University of Toronto Pension Plan and the University of Toronto (OISE) Pension Plan. At June 30, 2006 the University of Toronto Pension Plan assets represent 95.6% of the Master Trust. The University of Toronto Asset Management Corporation provides a high level of professional expertise to investment management of the Master Trust. The total rate of investment return for the Master Trust for the year ended June 30, 2006 was 7.0% (2005 – 10.9%) net of fees and expenses and excluding returns on private investment interests. The Master Trust under-performed the one year investment policy benchmark return of 8.4% by 1.4%. This benchmark is composed of major market indices representing Canadian equities, US equities, international equities and Canadian fixed income.
Total Return on Investments for the year ended June 30
(millions of dollars)
(50)
0
50
100
150
200
250
300
(37.2) 7.5 296.5 244.0 197.2
2002 2003 2004 2005 2006
Since the July 1, 2004 actuarial valuation report showed actuarial liabilities exceeding Plan assets, the University of Toronto has been making both current service cost contributions and additional contributions, to amortize the unfunded liability into the
Plan. The University made employer contributions of $84.0 million in 2006 and $60.6 million in 2005. The fees and expenses for the University of Toronto Pension Plan were $15.6 million in 2006, as compared to $14.4 million in 2005. The investment management fees increased by $0.9 million, primarily due to the change in net asset value. The remaining increase of $0.3 million was due to custodial and administrative costs. Due to the larger number of terminations and deaths in 2006, cash refunds and transfers to other plans increased by $7.3 million, as compared to 2005. Retirement payments increased in 2006 by $9.2 million, as compared to 2005. This reflects the increasing number of pensioners as well as augmentations paid to pensioners.
Retirement Payments for the year ended June 30
(millions of dollars)
0
20
40
60
80
100
120
78.2 88.1 95.4 103.4 112.6
2002 2003 2004 2005 2006

25
AUDITORS' REPORT
To the Administrator of the University of Toronto Pension Plan
We have audited the statement of net assets available for benefits of the University of Toronto Pension Plan (the "Plan") as at June 30, 2006 and the statement of changes in net assets available for benefits for the year then ended. These financial statements are the responsibility of the Plan's Administrator. Our responsibility is to express an opinion on these financial statements based on our audit.
We conducted our audit in accordance with Canadian generally accepted auditing standards. Those standards require that we plan and perform an audit to obtain reasonable assurance whether the financial statements are free of material misstatement. An audit includes examining, on a test basis, evidence supporting the amounts and disclosures in the financial statements. An audit also includes assessing the accounting principles used and significant estimates made by the Plan's Administrator, as well as evaluating the overall financial statement presentation. In our opinion, these financial statements present fairly, in all material respects, the net assets available for benefits of the Plan as at June 30, 2006 and the changes in its net assets available for benefits for the year then ended in accordance with Canadian generally accepted accounting principles. Toronto, Canada, October 19, 2006. Chartered Accountants

26
UNIVERSITY OF TORONTO PENSION PLAN
STATEMENT OF NET ASSETS AVAILABLE FOR BENEFITS (with comparative figures as at June 30, 2005)
(thousands of dollars)
As at June 30 2006 2005 $ $ ASSETS Investments, at fair value (note 3(a)) 2,482,895 2,312,854 Prepaid expenses 11,796 10,798 2,494,691 2,323,652 LIABILITIES Refunds in transit 3,124 1,558Accrued expenses 1,639 1,445 4,763 3,003Net assets available for benefits 2,489,928 2,320,649 See accompanying notes On behalf of the Governing Council of the University of Toronto: Ms. Catherine J. Riggall Vice-President, Business Affairs Mr. Louis Charpentier Secretary of the Governing Council

27
UNIVERSITY OF TORONTO PENSION PLAN
STATEMENT OF CHANGES IN NET ASSETS
AVAILABLE FOR BENEFITS (with comparative figures for the year ended June 30, 2005)
(thousands of dollars)
Year ended June 30 2006 2005 $ $ INCREASE IN NET ASSETS Employer contributions (note 4) 83,978 60,585Employee contributions 28,583 26,929Net investment income from Master Trust (note 3(b)) 197,218 244,031Transfers from other plans 1,090 1,056Total increase in net assets 310,869 332,601 DECREASE IN NET ASSETS Retirement payments 112,633 103,411Refunds and transfers (note 6) 13,311 6,030Fees and expenses (note 7) 15,646 14,352Total decrease in net assets 141,590 123,793 Net increase in net assets for the year 169,279 208,808Net assets available for benefits, beginning of year 2,320,649 2,111,841Net assets available for benefits, end of year 2,489,928 2,320,649
See accompanying notes

28
UNIVERSITY OF TORONTO PENSION PLAN
NOTES TO FINANCIAL STATEMENTS
JUNE 30, 2006 1. Description of Plan
The following description of the University of Toronto Pension Plan (the “Plan”) is a summary only. For more complete information, reference may be made to the official Plan text. The Plan is a contributory defined benefit plan open to all full-time and part-time employees of the University of Toronto (the “University”) meeting the eligibility conditions. The Plan is registered under the Pension Benefits Act of Ontario (1990) (Ontario Registration Number 0312827) and with the Canada Revenue Agency. The Governing Council of the University of Toronto acts as administrator for the Plan and the investments are managed by the University of Toronto Asset Management Corporation.
Plan benefits are funded by contributions and investment earnings. Member contributions are made in accordance with a prescribed formula. The University's contribution is determined annually on the basis of an actuarial valuation taking into account the assets of the Plan and all other relevant factors.
2. Summary of significant accounting policies
These financial statements have been prepared by the University in accordance with Canadian generally accepted accounting principles applied within the framework of the significant accounting policies summarized below:
a) Investments and investment income
Investments, which include accrued income, are carried at fair value.
The Plan is invested in the University of Toronto Master Trust (the “Master Trust”). The unit value of the Master Trust is calculated based on the fair value of the underlying investments of the Master Trust. Net investment income (loss) includes interest, dividends, foreign exchange gains (losses), realized gains (losses) and net change in unrealized gains (losses) on investments held by the Master Trust.
b) University of Toronto Master Trust Fair values of the investments held by the Master Trust are determined as follows:
(i) The fair values of publicly traded bonds and equities are determined based on quoted market values. Investments in pooled funds are valued at their net asset value per unit. Infrequently traded securities are based on quoted market yields or prices of comparable securities, as appropriate. Private investment interests, which include private equities with underlying investments in equities, debt and real estate assets, are determined based on the latest valuations provided by the external investment managers, adjusted for cash receipts, cash disbursements and securities distributions. The University believes the

29
carrying amount of these financial instruments is a reasonable estimate of fair value. Because alternative investments are not readily traded, their estimated values are subject to uncertainty and therefore may differ from the value that would have been used had a ready market for such investments existed.
(ii) Derivative financial instruments are used to manage particular market and currency
exposures for hedging and risk management purposes with respect to the Master Trust’s investments and as a substitute for more traditional investments. Derivative financial instruments and synthetic products that may be employed include debt, equity, commodity and currency futures, options, swaps and forward contracts. These contracts are supported by liquid assets with a fair value approximately equal to the fair value of the instruments underlying the derivative contract.
For all derivative financial instruments, the gains and losses arising from changes in the fair value of such derivatives are recognized as investment income (loss) in the year in which the changes in fair value occur. The fair value of derivative financial instruments reflects the daily quoted market amount of those instruments, thereby taking into account the current unrealized gains or losses on open contracts. Investment dealer quotes or quotes from a bank are available for substantially all of the Master Trust’s derivative financial instruments.
(iii) Monetary assets and liabilities denominated in foreign currencies are translated into
Canadian dollars at the exchange rate in effect at the year-end.
Interest income is recorded by the Master Trust on an accrual basis. Dividends are recorded by the Master Trust as revenue on the record date. Unrealized gains and losses on investments are recorded by the Master Trust as a change in fair value since the beginning of the year or since the date of purchase when purchased during the year. Income and expenses are translated at exchange rates in effect on the date of the transaction. Gains or losses arising from those translations are included in income. Purchases and sales of investments are recorded by the Master Trust on a settlement date basis.
c) Revenue and expense recognition
All employer and employee contributions and other revenue are reflected in the year in which they are due. All expenses are recorded on an accrual basis.

30
3. University of Toronto Master Trust
On August 1, 2000, the Master Trust was established to facilitate the collective investment of the assets of the University’s pension plans. Each pension plan holds units of the Master Trust. The value of each unit held by a plan increases or decreases every month based on the change in fair value of the underlying assets of the Master Trust. This value is used as the basis for the purchase and sale of units by the pension plans in the following month.
a) Statement of net assets
(thousands of dollars)
As at June 30, 2006, the Plan held 19,156,847 (2005 – 19,331,786) of the 20,034,566 (2005 - 20,241,812) outstanding units of the Master Trust. The Master Trust investments held at fair value as at June 30 are summarized below, and have been classified by asset-mix category based on the intent of the investment strategies of the underlying portfolios of the Master Trust. This classification required $793 million (2005 - $1,269 million) of pooled funds, and $526 million (2005 - $223 million) of cash, money market funds, short-term notes and treasury bills to be reclassified to their appropriate investment category. 2006
$ 2005
$ Cash, money market funds, short-term notes and treasury bills
35,563
34,735
Government and corporate bonds 560,066 833,513Canadian equities 307,427 330,288United States equities 474,266 379,693International equities 546,804 255,333Hedge funds 463,079 425,764Private equities 85,599 73,135Real assets 94,477 81,606 2,567,281 2,414,067Derivative related net receivable (note 3(d)) 29,299 7,664 2,596,580 2,421,731University of Toronto Pension Plan (95.6% of Master Trust)
2,482,895
2,312,854

31
b) Statement of changes in net assets (thousands of dollars) For the year ended June 30
2006 $
2005 $
Net investment income 206,445 255,633 Cash received on purchase of Master Trust units by pension plans
114,240
89,156
Cash paid on redemption of Master Trust units by pension plans
(145,836)
(130,914)
Net increase in net assets for the year 174,849 213,875 Net assets, beginning of year 2,421,731 2,207,856 Net assets, end of year 2,596,580 2,421,731 University of Toronto Pension Plan (95.6% of Master Trust)
2,482,895
2,312,854
Net investment income for the year ended June 30 for the Master Trust is comprised of the following:
2006 $
2005 $
Interest income Government and corporate bond 26,335 12,714 Short-term investments 17,126 785 Dividend income Canadian 48,035 49,390 Foreign 33,046 20,301 Net realized gains from investments 41,002 18,529 Net unrealized gains from investments 40,726 152,610 Other income 175 1,304 206,445 255,633 University of Toronto Pension Plan (95.6% of Master Trust)
197,218
244,031
The net investment income was reported in the Plan’s statement of changes in net assets available for benefits as net investment income from Master Trust.

32
c) Individually significant investments (thousands of dollars)
The details of investments where the fair value exceeds 1% of the total fair value or book value of the Master Trust are listed below.
Weighted average coupon rate Maturity range Fair value Money market funds, treasury bills and government bonds
Goldman Sachs Asset Management $ 49,462Government of Canada Bonds 4.51% 2007 – 2037 348,455Province of Ontario T-Bills 4.87% 2006 – 2006 114,388Business Development Bank 5.16% 2006 – 2006 105,046Government of Canada T-Bills 4.60% 2006 – 2006 60,813Export Development Bank T-Bills 5.31% 2006 – 2006 49,217Province of Quebec Bonds 5.02% 2009 – 2036 43,957Province of Ontario Bonds 5.52% 2008 – 2039 29,594
Canadian equity BGIC Active Canadian Equity Fund 115,277
International equity CCL Arrow Street Synthetic fund 28,280
Hedge funds Aetos Capital 84,687Trent River Offshore Ltd. 75,448Quellos ARS (Pension) III Ltd. 59,587Robec Sage Capital International 52,007Arden Alternative Advisors SPC USD 45,099DGHM Plan Fund 34,725Muirfield Absolute Performance Fund 30,057Lighthouse Diversified Fund Ltd. 29,982Pioneer Alternative Investment Management Ltd. 29,411
d) Derivative financial instruments (thousands of dollars)
Description The Master Trust has entered into equity and commodity index futures contracts which oblige it to pay the difference between a predetermined amount and the market value of certain equities when the market value is less than the predetermined amount, or receive the difference when the market value is more than the predetermined amount. The Master Trust enters into foreign currency forward contracts to minimize exchange rate fluctuations and the resulting uncertainty on future financial results. All outstanding contracts have a remaining term to maturity of less than one year. The Master Trust has significant contracts outstanding held in U.S. dollars, the Euro, Japanese yen and British pound.

33
The notional amounts of the derivative financial instruments do not represent amounts exchanged between parties and are not a measure of the Master Trust’s exposure resulting from the use of financial instrument contracts. The amounts exchanged are based on the applicable rates applied to the notional amounts. Risks The Master Trust is exposed to credit-related losses in the event of non-performance by counterparties to these financial instruments, but it does not expect any counterparties to fail to meet their obligations given their high credit ratings. Terms and conditions The notional and fair value amounts of the financial instruments are as follows:
2006 2005 Notional
Value Fair
Value Notional
Value Fair
Value
Foreign currency forward contracts:
- United States 1,325,127 15,117 783,785 (5,153) - International 318,814 (3,002) 392,181 12,879 12,115 7,726 Equity and commodity index futures contracts: - Canadian 21,302 85 - United States 579,662 4,248 339,740 (62) - International 277,804 12,851 17,184 (62)Total 29,299 7,664
4. Plan contributions
The University has made $52.8 million (2005 - $36.0 million) in current service cost contributions and $31.2 million (2005 - $24.6 million) in additional special payments. The special payments were made to amortize the unfunded liability, since the actuarial valuation as at July 1, 2005, showed accrued pension liabilities exceeding the Plan’s assets.
5. Voluntary Early Academic Retirement Program (VEARP)
The University makes contributions to the Plan for the cost of waiving the actuarial reduction when faculty and librarians retire under the VEARP.

34
6. Refunds and transfers
(thousands of dollars) Refunds and transfers consist of the following: 2006
$ 2005
$ Refunds of contributions: Upon termination 1,009 251 Upon death 3,992 1,754 5,001 2,005
Transfers to other plans upon termination
8,310
4,025 13,311 6,030
7. Fees and expenses (thousands of dollars) Fees and expenses consist of the following:
2006 $
2005 $
Investment management fees: External managers1
10,929
10,070
University of Toronto Asset Management Corporation1,2 2,108 2,054 Trustee and custodial fees1 623 425 Actuarial and consulting fees 263 317 Pension records administration 726 573 External audit fees 33 55 Administration cost – University of Toronto2 753 705 Other fees 211 153 15,646 14,352
1 Reflects expenses that are directly charged to the Master Trust and are allocated back to the Plan. 2 Represents related party transactions. 8. Obligations for pension benefits
(thousands of dollars)
The actuarial present value of accrued pension benefits is determined by applying best estimate assumptions and the projected benefit method pro rated on services. An actuarial valuation was performed as of July 1, 2006 by Hewitt Associates LLC, a firm of consulting actuaries.

35
The actuarial present value of accrued pension benefits as at July 1, 2006 and 2005 and the principal components of changes during the year are as follows:
2006
$ 2005
$ Actuarial present value of accrued pension benefits, beginning of year
2,407,005
2,225,029
Interest on accrued benefits 153,202 142,023 Benefits accrued 80,579 74,857 Transfer from other plans 1,090 1,056 Benefits paid (125,944) (109,441) Experience (gain) loss 11,784 15,120 Plan amendments1 12,913 14,667 Legislative changes 17,094 Assumption changes2 26,600 Actuarial present value of accrued pension benefits, end of year
2,540,629
2,407,005
1 Reflects Plan augmentations for Faculty and Librarians staff groups effective July 1, 2006, and
change in Plan formula for union and administrative staff, effective January 1, 2006. 2 Reflects change in salary escalation assumption from 4.0% in 2004 to 4.5% in 2005.
Significant assumptions used in the actuarial valuation are as follows: 2006
% 2005
% Interest rate 6.50 6.50 Consumer Price Index 2.50 2.50 Salary escalation rate 4.50 4.50
9. Comparative financial statements
The comparative financial statements have been reclassified from statements previously presented to conform to the presentation of the 2006 financial statements.

36
UNIVERSITY OF TORONTO (OISE) PENSION PLAN
FINANCIAL STATEMENTS
JUNE 30, 2006

37
University of Toronto (OISE) Pension Plan
Highlights
The University of Toronto (OISE) Pension Plan (the “Plan”) is a contributory defined benefit plan. The net assets available for benefits were $113.8 million at June 30, 2006, an increase of $4.8 million or 4.4% from the previous year. This increase was a result of an overall favourable market performance. For the five-year period from 2002 to 2006, the net assets available for benefits have increased from $94.6 million to $113.8 million.
Net Assets Available (Market Value) for Benefits as at June 30
(millions of dollars)
0
20
40
60
80
100
120
94.6 90.5 101.8 109.0 113.8
2002 2003 2004 2005 2006
Accrued pension liabilities have also increased steadily, over the years. Although total participants have slowly decreased, the accrued pension liability continues to increase, as expected, due to continued benefit accruals for active members, interest on accrued pension liabilities, as well as Plan amendments.
Accrued Pension Liability as at July 1
(millions of dollars)
0
20
40
60
80
100
120
77.9 83.4 97.6 103.7 108.6
2002 2003 2004 2005 2006
As at July 1, 2006, the Plan had a market surplus of $5.2 million. The Plan’s surplus has remained relatively stable over the past two years, due to investment returns offsetting accrued liability increases.
Pension Surplus as at July 1
(millions of dollars)
0
5
10
15
20
16.7 7.1 4.2 5.3 5.2
2002 2003 2004 2005 2006

38
The University of Toronto Master Trust (“Master Trust”) holds the assets of the University of Toronto Pension Plan and the University of Toronto (OISE) Pension Plan. At June 30, 2006 the University of Toronto (OISE) Pension Plan assets represent 4.4% of the Master Trust. The University of Toronto Asset Management Corporation (“UTAM”) provides a high level of professional expertise to investment management of the Master Trust. The total rate of investment return (including realized and unrealized gains and losses) for the Master Trust for the year ended June 30, 2006 was 7.0% (2005 – 10.9%) net of fees and expenses and excluding returns on private investment interests. The Master Trust under-performed the one year investment policy benchmark return of 8.4% by 1.4%. This benchmark is composed of major market indices representing Canadian equities, US equities, international equities and Canadian fixed income.
Total Return on Investments for the year ended June 30
(millions of dollars)
-3
0
3
6
9
12
15
(1.8) 0.4 14.4 11.6 9.2
2002 2003 2004 2005 2006
The University did not make contributions for current service cost into the University
of Toronto (OISE) Pension Plan for the current plan year since the July 1, 2005 actuarial valuation report shows the Plan has an actuarial surplus. Pension Plan fees and expenses for the University of Toronto (OISE) Pension Plan remains at $1.0 million for 2006. The increase in investment management fees and administrative costs was off-set by the decrease in actuarial and consulting fees. Retirement payments increased in 2006 by $0.3 million, as compared to 2005. This reflects the increasing number of pensioners as well as augmentations paid to pensioners.
Retirement Payments for the year ended June 30
(millions of dollars)
0.0
0.5
1.0
1.5
2.0
2.5
3.0
3.5
4.0
1.9 2.6 2.9 3.6 3.9
2002 2003 2004 2005 2006

39
AUDITORS' REPORT
To the Administrator of the University of Toronto (OISE) Pension Plan We have audited the statement of net assets available for benefits of the University of Toronto (OISE) Pension Plan (the "Plan") as at June 30, 2006 and the statement of changes in net assets available for benefits for the year then ended. These financial statements are the responsibility of the Plan's Administrator. Our responsibility is to express an opinion on these financial statements based on our audit. We conducted our audit in accordance with Canadian generally accepted auditing standards. Those standards require that we plan and perform an audit to obtain reasonable assurance whether the financial statements are free of material misstatement. An audit includes examining, on a test basis, evidence supporting the amounts and disclosures in the financial statements. An audit also includes assessing the accounting principles used and significant estimates made by the Plan's Administrator, as well as evaluating the overall financial statement presentation. In our opinion, these financial statements present fairly, in all material respects, the net assets available for benefits of the Plan as at June 30, 2006 and the changes in its net assets available for benefits for the year then ended in accordance with Canadian generally accepted accounting principles. Toronto, Canada, October 19, 2006. Chartered Accountants
40
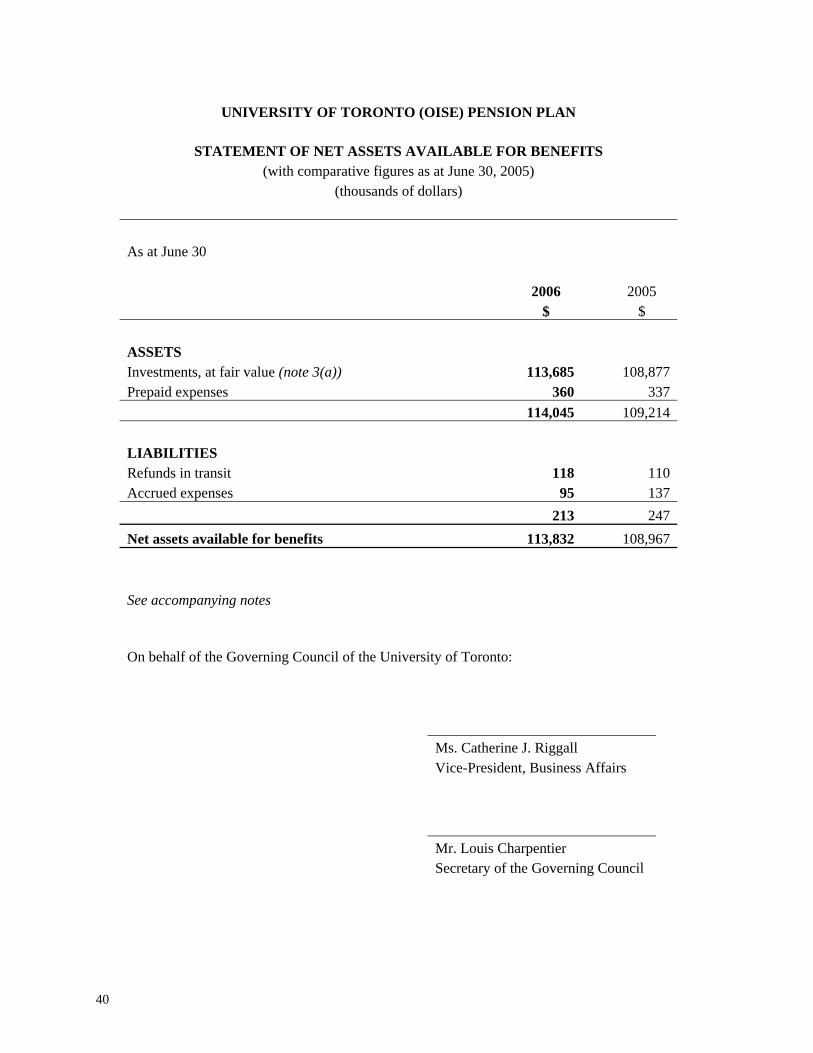
UNIVERSITY OF TORONTO (OISE) PENSION PLAN
STATEMENT OF NET ASSETS AVAILABLE FOR BENEFITS
(with comparative figures as at June 30, 2005) (thousands of dollars)
As at June 30 2006 2005 $ $ ASSETS Investments, at fair value (note 3(a)) 113,685 108,877 Prepaid expenses 360 337 114,045 109,214 LIABILITIES Refunds in transit 118 110 Accrued expenses 95 137 213 247 Net assets available for benefits 113,832 108,967 See accompanying notes On behalf of the Governing Council of the University of Toronto: Ms. Catherine J. Riggall Vice-President, Business Affairs Mr. Louis Charpentier Secretary of the Governing Council

41
UNIVERSITY OF TORONTO (OISE) PENSION PLAN
STATEMENT OF CHANGES IN NET ASSETS
AVAILABLE FOR BENEFITS (with comparative figures for the year ended June 30, 2005)
(thousands of dollars) Year ended June 30 2006 2005 $ $ INCREASE IN NET ASSETS Employee contributions (note 4) 588 587Net investment income from Master Trust (note 3(b)) 9,227 11,602Total increase in net assets 9,815 12,189 DECREASE IN NET ASSETS Retirement payments 3,884 3,563Refunds and transfers (note 5) 91 487Fees and expenses (note 6) 975 970Total decrease in net assets 4,950 5,020 Net increase in net assets for the year 4,865 7,169Net assets available for benefits, beginning of year 108,967 101,798Net assets available for benefits, end of year 113,832 108,967 See accompanying notes

42
UNIVERSITY OF TORONTO (OISE) PENSION PLAN
NOTES TO FINANCIAL STATEMENTS
JUNE 30, 2006
1. Description of Plan
The following description of the University of Toronto Ontario Institute for Studies in Education (OISE) Pension Plan (the “Plan”) is a summary only. For more complete information, reference may be made to the official Plan text. The Plan is a defined benefit plan covering substantially all full-time and part-time employees of OISE who were members of the Plan as of June 30, 1996. The Plan is registered under the Pension Benefits Act of Ontario (1990) (Ontario Registration Number 0353854) and with the Canada Revenue Agency. Effective July 1, 1996, the Governing Council of the University of Toronto (the “University”) became administrators of the Plan. Prior to July 1, 1996, the OISE Board of Governors acted as the administrator. The investments are managed by the University of Toronto Asset Management Corporation. Plan benefits are funded by contributions and investment earnings. Member contributions are made in accordance with a prescribed formula. The University’s contribution is determined annually on the basis of an actuarial valuation taking into account the assets of the Plan and all other relevant factors.
2. Summary of significant accounting policies
These financial statements have been prepared by the University in accordance with Canadian generally accepted accounting principles applied within the framework of the significant accounting policies summarized below:
a) Investments and investment income
Investments, which include accrued income, are carried at fair value.
The Plan is invested in the University of Toronto Master Trust (the “Master Trust”). The unit value of the Master Trust is calculated based on the fair value of the underlying investments of the Master Trust. Net investment income (loss) includes interest, dividends, foreign exchange gains (losses), realized gains (losses) and net change in unrealized gains (losses) on investments held by the Master Trust.
b) University of Toronto Master Trust
Fair values of the investments held by the Master Trust are determined as follows: (i) The fair values of publicly traded bonds and equities are determined based on quoted
market values. Investments in pooled funds are valued at their net asset value per unit. Infrequently traded securities are based on quoted market yields or prices of comparable

43
securities, as appropriate. Private investment interests, which include private equities with underlying investments in equities, debt and real estate assets, are determined based on the latest valuations provided by the external investment managers, adjusted for cash receipts, cash disbursements and securities distributions. The University believes the carrying amount of these financial instruments is a reasonable estimate of fair value. Because alternative investments are not readily traded, their estimated values are subject to uncertainty and therefore may differ from the value that would have been used had a ready market for such investments existed.
(ii) Derivative financial instruments are used to manage particular market and currency
exposures for hedging and risk management purposes with respect to the Master Trust’s investments and as a substitute for more traditional investments. Derivative financial instruments and synthetic products that may be employed include debt, equity, commodity and currency futures, options, swaps and forward contracts. These contracts are supported by liquid assets with a fair value approximately equal to the fair value of the instruments underlying the derivative contract.
For all derivative financial instruments, the gains and losses arising from changes in the fair value of such derivatives are recognized as investment income (loss) in the year in which the changes in fair value occur. The fair value of derivative financial instruments reflects the daily quoted market amount of those instruments, thereby taking into account the current unrealized gains or losses on open contracts. Investment dealer quotes or quotes from a bank are available for substantially all of the Master Trust’s derivative financial instruments.
(iii) Monetary assets and liabilities denominated in foreign currencies are translated into
Canadian dollars at the exchange rate in effect at the year-end.
Interest income is recorded by the Master Trust on an accrual basis. Dividends are recorded by the Master Trust as revenue on the record date. Unrealized gains and losses on investments are recorded by the Master Trust as a change in fair value since the beginning of the year or since the date of purchase when purchased during the year. Income and expenses are translated at exchange rates in effect on the date of the transaction. Gains or losses arising from those translations are included in income. Purchases and sales of investments are recorded by the Master Trust on a settlement date basis.
c) Revenue and expense recognition
All employer and employee contributions and other revenue are reflected in the year in which they are due. All expenses are recorded on an accrual basis.

44
3. University of Toronto Master Trust On August 1, 2000, the Master Trust was established to facilitate the collective investment of the assets of the University’s pension plans. Each pension plan holds units of the Master Trust. The value of each unit held by a plan increases or decreases every month based on the change in fair value of the underlying assets of the Master Trust. This value is used as the basis for the purchase and sale of units by the pension plans in the following month.
a) Statement of net assets (thousands of dollars)
As at June 30, 2006, the Plan held 877,719 (2005 – 910,026) of the 20,034,566 (2005 – 20,241,812) outstanding units of the Master Trust. The Master Trust investments held at fair value as at June 30 are summarized below, and have been classified by asset-mix category based on the intent of the investment strategies of the underlying portfolios of the Master Trust. This classification required $793 million (2005 - $1,269 million) of pooled funds, and $526 million (2005 - $223 million) of cash, money market funds, short-term notes and treasury bills to be reclassified to their appropriate investment category.
2006
$ 2005
$ Cash, money market funds, short-term notes and treasury bills 35,563 34,735Government and corporate bonds 560,066 833,513Canadian equities 307,427 330,288United States equities 474,266 379,693International equities 546,804 255,333Hedge funds 463,079 425,764Private equities 85,599 73,135Real assets 94,477 81,606 2,567,281 2,414,067Derivative related net receivable (note 3(d)) 29,299 7,664 2,596,580 2,421,731
University of Toronto (OISE) Pension Plan (4.4% of Master Trust)
113,685
108,877

45
b) Statement of changes in net assets (thousands of dollars)
For the year ended June 30
2006
$ 2005
$ Net investment income 206,445 255,633 Cash received on purchase of Master Trust units by pension plans
114,240
89,156
Cash paid on redemption of Master Trust units by pension plans
(145,836)
(130,914)
Net increase in net assets for the year 174,849 213,875 Net assets, beginning of year 2,421,731 2,207,856 Net assets, end of year 2,596,580 2,421,731 University of Toronto (OISE) Pension Plan (4.4% of Master Trust)
113,685
108,877
Net investment income for the year ended June 30 for the Master Trust is comprised of the following:
2006 $
2005 $
Interest income Government and corporate bond 26,335 12,714 Short-term investments 17,126 785 Dividend income Canadian 48,035 49,390 Foreign 33,046 20,301 Net realized gains from investments 41,002 18,529 Net unrealized gains from investments 40,726 152,610 Other income 175 1,304 206,445 255,633 University of Toronto (OISE) Pension Plan (4.4% of Master Trust)
9,227
11,602
The net investment income was reported in the Plan’s statement of changes in net assets available for benefits as net investment income from Master Trust.

46
c) Individually significant investments (thousands of dollars)
The details of investments where the fair value exceeds 1% of the total fair value or book value of the Master Trust are listed below.
Weighted average coupon rate Maturity range Fair value Money market funds, treasury bills and government bonds
Goldman Sachs Asset Management $ 49,462Government of Canada Bonds 4.51% 2007 – 2037 348,455Province of Ontario T-Bills 4.87% 2006 – 2006 114,388Business Development Bank 5.16% 2006 – 2006 105,046Government of Canada T-Bills 4.60% 2006 – 2006 60,813Export Development Bank T-Bills 5.31% 2006 – 2006 49,217Province of Quebec Bonds 5.02% 2009 – 2036 43,957Province of Ontario Bonds 5.52% 2008 – 2039 29,594
Canadian equity BGIC Active Canadian Equity Fund 115,277
International equity CCL Arrow Street Synthetic fund 28,280
Hedge funds Aetos Capital 84,687Trent River Offshore Ltd. 75,448Quellos ARS (Pension) III Ltd. 59,587Robec Sage Capital International 52,007Arden Alternative Advisors SPC USD 45,099DGHM Plan Fund 34,725Muirfield Absolute Performance Fund 30,057Lighthouse Diversified Fund Ltd. 29,982Pioneer Alternative Investment Management Ltd. 29,411
d) Derivative financial instruments
(thousands of dollars) Description The Master Trust has entered into equity and commodity index futures contracts which oblige it to pay the difference between a predetermined amount and the market value of certain equities when the market value is less than the predetermined amount, or receive the difference when the market value is more than the predetermined amount. The Master Trust enters into foreign currency forward contracts to minimize exchange rate fluctuations and the resulting uncertainty on future financial results. All outstanding contracts have a remaining term to maturity of less than one year. The Master Trust has significant contracts outstanding held in U.S. dollars, the Euro, Japanese yen and British pound.

47
The notional amounts of the derivative financial instruments do not represent amounts exchanged between parties and are not a measure of the Master Trust’s exposure resulting from the use of financial instrument contracts. The amounts exchanged are based on the applicable rates applied to the notional amounts. Risks The Master Trust is exposed to credit-related losses in the event of non-performance by counterparties to these financial instruments, but it does not expect any counterparties to fail to meet their obligations given their high credit ratings. Terms and conditions The notional and fair value amounts of the financial instruments are as follows:
2006 2005 Notional
Value Fair
Value Notional
Value Fair
Value
Foreign currency forward contracts:
- United States 1,325,127 15,117 783,785 (5,153) - International 318,814 (3,002) 392,181 12,879 12,115 7,726 Equity and commodity index futures contracts: - Canadian 21,302 85 - United States 579,662 4,248 339,740 (62) - International 277,804 12,851 17,184 (62)Total 29,299 7,664
4. Plan contributions
Employer contributions are not being made in the current fiscal year since the Plan’s assets exceeded the Plan’s liabilities as reported in the actuarial valuation as of July 1, 2005.
5. Refunds and transfers (thousands of dollars) Refunds and transfers consist of the following:
2006 $
2005 $
Refunds of contributions upon termination 7 Transfers to other plans upon termination 91 480 91 487

48
6. Fees and expenses (thousands of dollars)
Fees and expenses consist of the following: 2006
$ 2005
$ Investment management fees: External managers1
575
535
University of Toronto Asset Management Corporation1,2 111 108 Trustee and custodial fees1 33 22 Actuarial and consulting fees 60 130 Pension records administration 117 102 External audit fees 12 12 Administration cost – University of Toronto2 59 55 Other fees 8 6 975 970
1 Reflects expenses that are charged directly to the Master Trust and are allocated back to the Plan. 2 Represents related party transactions.
7. Obligations for pension benefits (thousands of dollars)
The actuarial present value of accrued pension benefits is determined by applying best estimate assumptions and the projected benefit method pro-rated on services. An actuarial valuation was performed as of July 1, 2006 by Hewitt Associates LLC, a firm of consulting actuaries. The actuarial present value of accrued pension benefits as at July 1, 2006 and 2005 and the principal components of changes during the year are as follows:
2006 $
2005 $
Actuarial present value of accrued pension benefits, beginning of year
91,691
86,363
Interest on accrued benefits 5,841 5,493 Benefits accrued 1,947 2,242 Benefits paid (3,665) (3,736) Experience (gain) loss (362) (1,168) Plan amendments1 533 1,073 Legislative changes 814 Assumption changes2 610 Actuarial present value of accrued pension benefits for ongoing members, end of year
95,985
91,691
Partial plan wind-up benefits (note 8) 12,601 12,012 Total obligation for pensions 108,586 103,703
1 Reflects Plan augmentations for Faculty and Librarians staff groups effective July 1, 2006, and change in Plan formula for union and administrative staff, effective January 1, 2006.
2 Reflects change in salary escalation assumption from 4.0% in 2004 to 4.5% in 2005.

49
Significant assumptions used in the actuarial valuation are as follows:
2006 %
2005 %
Interest rate 6.50 6.50 Consumer Price Index 2.50 2.50 Salary escalation rate 4.50 4.50
8. Partial plan wind–up (thousands of dollars)
Certain members and former members employed by the Ontario Institute for Studies in Education between February 1996 and June 1996 were offered special early retirement or voluntary severance packages. Employees who accepted either package became part of a partial wind-up group of the Plan. The decision in the Monsanto case confirms the position of the Superintendent of the Financial Services Commission of Ontario that on the partial wind-up of a pension plan, the assets of the pension fund related to that part of the pension plan being wound up must be distributed, which includes any surpluses. The assets allocable to the partial plan wind-up group, as of June 30, 2005, were $12,012. The July 1, 2006 actuarial report updates the assets allocable to the partial plan wind-up group to $12,601 as of June 30, 2006. The assets allocable to the partial plan wind-up group will be used to provide for settlement of pension entitlements still remaining in the plan for partial wind-up members (settlement through annuity purchase or lump- sum transfer), surplus allocation for partial wind-up members, and expenses associated with the partial wind-up and surplus distribution.
9. Comparative financial statements
The comparative financial statements have been reclassified from statements previously presented to conform to the presentation of the 2006 financial statements.

50
Actuarial Report
University of Toronto Pension Plan As of July 1, 2006

51
Summary
(thousands of dollars)
As of July 1, 2005
As of July 1, 20061
Going Concern Valuation Results Past Service Actuarial Value of Assets $ 2,289,792 $ 2,447,263 Less: Accrued Liability 2,407,005
2,540,629
Surplus (Unfunded Accrued Liability) $ (117,213) $ (93,366) As a % of Accrued Liability (4.9%) (3.7%) Market Value of Assets $ 2,320,649 $ 2,489,928 Deferred Asset Gain (Loss) $ 30,857 $ 42,665 Current Service Total Current Service Cost $ 78,274 $ 85,520 Less: Required Participant Contributions 26,633
29,487
Remaining Current Service Cost $ 51,641 $ 56,033 As a % of Participant Salary Base (Capped at $150,000)
10.10%
9.95%
Participant Salary Base (Capped at $150,000) $ 511,264 $ 563,381 Solvency Valuation Results Solvency Assets2 $ 2,319,649 $ 2,488,928
Solvency Liability – Without Escalated Adjustments3 2,330,186 2,467,555
Solvency Excess/(Deficit) $ (10,537) $ 21,373
Transfer Ratio 1.00 N/A
Wind-Up Valuation Results Wind-Up Assets2 $ 2,319,649 $ 2,488,928
Wind-Up Liability – With Escalated Adjustments3 3,020,738 3,289,016
Wind-Up Excess/(Deficit) $ (701,089) $ (800,088)
Transfer Ratio N/A 0.76 _______________________ 1 Reflects plan changes and related assumption changes in connection with new retirement provisions. 2 Net of provision of $1,000,000 for estimated wind-up expenses. 3 The Solvency Liability excludes the liabilities associated with future escalated adjustments (indexing) pursuant to the
Regulations to the Pension Benefits Act (Ontario). The Wind-Up Liability is calculated including the value of future escalated adjustments, as well as the value of the temporary early retirement windows for those members who would be retirement age eligible before the end of the window period.

52
Summary (continued)
(thousands of dollars)
As of July 1, 2005
As ofJuly 1, 2006
Funding Requirements Required Participant Contributions $ 26,663 $ 29,487 Remaining Current Service Cost $51,641 $56,033 Plus: Special Payments to Amortize Unfunded Liability 12,419 10,149 Minimum Required University Contributions $ 64,060 $ 66,182 As a % of Participant Salary Base (Capped $150,000) 12.53% 11.75% Personnel Data Active Participants 7,452 7,599 Retired Participants 4,246 4,323 Terminated Vested Participants 1,072 1,154 Suspended, Exempt or Pending Status 1,164
1,178
Total 13,934 14,254

53
Summary (continued)
History of Accrued Liability and Surplus
Year Actuarial Value of Assets (AVA)
Accrued Liability (AL) Surplus/(Deficit)
Surplus as a Percentage of AL
(millions of dollars) 1991 $ 949.4 $ 869.7 $ 79.8 9.2% 1992 $ 1,061.01 $ 1,031.51 $ 29.41 2.9% 1993 $ 1,169.3 $ 1,110.3 $ 59.1 8.3% 1994 $ 1,271.7 $ 1,201.9 $ 69.9 5.8% 1995 $ 1,370.5 $ 1,243.6 $ 126.9 10.2% 1996 $ 1,484.3 $ 1,249.12 $ 235.22 18.8% 1997 $ 1,671.4 $ 1,436.73 $ 234.73 16.3% 1998 $ 1,830.6 $ 1,503.3 $ 327.4 21.8% 1999 $ 1,927.24 $ 1,593.64 $ 333.64 20.9% 2000 $ 2,072.0 $ 1,680.2 $ 391.9 23.3% 2001 $ 2,108.2 $ 1,770.5 $ 337.7 19.1% 2002 $ 2,098.9 $ 1,904.95 $ 194.15 10.1% 2003 $ 2,068.9 $ 2,066.7 $ 2.2 0.1% 2004 $ 2,155.8 $ 2,225.0 $ (69.2)6 (3.1%) 2005 $ 2,289.8 $ 2,407.0 $ (117.2)7 (4.8%) 2006 $ 2,447.3 $ 2,540.68 $ (93.4)8 (3.7%)
Notes: 1After plan amendments and restatement of actuarial value of assets
2After six-year deferral of the increase in the maximum pension limit 3After plan amendments and change in actuarial assumptions 4After plan amendments for all staff groups (interim cost certificate) and change in assumptions
5After plan amendments
6After plan amendments and change in actuarial assumptions 7After plan amendments and change in actuarial assumptions
8After plan amendments (and related assumptions changes)
Millions of Dollars
0200400600800
1,0001,2001,4001,6001,8002,0002,2002,4002,6002,800
1991 1992 1993 1994 1995 1996 1997 1998 1999 2000 2001 2002 2003 2004 2005 2006
Year
Accrued Liability Actuarial Value of Assets

54
Assets and Liabilities
Going Concern Valuation Results (thousands of dollars) The going concern valuation results shown below are after all changes to Plan provisions and actuarial assumptions.
Past Service Actuarial Value of Assets $ 2,447,263 Less: Accrued Liability Active Participants $ 1,212,384 Retired Participants 1,247,273 Terminated Vested Participants 40,229 Suspended, Exempt or Pending Status 40,743 Total
2,540,629
Surplus (Unfunded Accrued Liability) $ (93,366) As a % of Accrued Liability (3.7%) Market Value of Assets $ 2,489,928 Deferred Asset Gain (Loss) $ 42,665 Current Service Total Current Service Cost $ 85,520 Less: Required Participant Contributions (29,487)
Remaining Current Service Cost $ 56,033
As a % of Participant Salary Base (With $150,000 Pay Cap) 9.95% Participant Salary Base (With $150,000 Pay Cap) $ 563,381

55
Assets and Liabilities (continued)
Solvency and Wind-Up Valuation Results
(thousands of dollars) Solvency Valuation Wind-Up Valuation
(1) Market Value of Assets $ 2,489,928 $ 2,489,928
(2) Less: Estimated Wind-Up Expenses 1,000 1,000
(3) Assets Net of Wind-Up Expenses $ 2,488,928 $ 2,488,928
(4) Solvency/Wind-Up Liability Active Participants $ 1,124,521 $ 1,622,919
Retired Participants 1,263,594 1,560,920 Terminated Vested Participants 38,697 64,434 Suspended, Exempt or Pending Status 40,743 40,743
Total $ 2,467,555 $ 3,289,016 (5) Surplus/(Deficiency), (3) - (4) $ 21,373 $ (800,088)
(6) Present Value of Existing Special Payments Over 5 Years $ 44,938 N/A
(7) New Solvency Deficiency Layer NIL N/A
(8) Transfer Ratio, (1)/(4) N/A 0.76 As permitted under the Regulations to the Pension Benefits Act (Ontario), the Solvency Liability excludes the liabilities associated with escalated adjustments (future indexing) and temporary early retirement window benefits (potential future elections under the programs in effect on July 1, 2006). Reflecting future escalated adjustments in the Wind-Up Valuation increases the liabilities by $787,411,000. Reflecting the temporary early retirement windows in the Wind-Up Valuation (for those members who would be retirement age eligible before the end of the window period) increases the liabilities by $34,049,000
The assumptions used to determine the Solvency Liability are summarized on page 42 of this report. Note that the interest rates-with escalated adjustments reflect the value of future indexation of pensions during both the preretirement and postretirement periods.
In our opinion, the value of Plan assets, less a reasonable allowance for wind-up expenses, would be less than the actuarial liabilities (including escalated adjustments and temporary early retirement window benefits for retirement eligible members) by $800,088,000 if the Plan were wound-up on the valuation date, assuming that there is a competitive market for inflation indexed annuities, or that a reasonable fixed rate of indexation could be substituted for inflation-linked indexation to facilitate annuity purchases.

56
Experience
Reconciliation of Surplus (thousands of dollars) Surplus/(Deficit) at July 1, 2005 $ (117,213) Less: University Current Service Cost for Plan Year Ending June 30, 2006, and Special Past Service Contributions Under VEARP (57,260) Plus: University Contributions: University Current Service Cost and Special Past Service Contributions Under VEARP 57,260 Minimum Required Special Payments 12,419 Additional University Special Payments 14,299 Plus: Interest at 6.5% per annum (6,832) Equals: Expected Surplus/(Deficit) at July 1, 2006, Before Experience Gains (Losses) $ (97,327) Plus: Increase (Decrease) at July 1, 2006 Due to: Gains (Losses): Return on Actuarial Value of Assets $ 21,329 Salary Increases 3,926 YMPE Increase (843) Indexation of Benefits 2,804 Mortality (10,060) All Other Sources 1,694 Plan Amendments – Pensioner Augmentation (8,796) Plan Amendments – 1.6% Accrual Rate1 (7,222) Plan Amendments – Retirement Provisions 1,129 Equals: Surplus/(Deficit) at July 1, 2006 $ (93,366)
1 Will be partially funded by a portion of the increase in participant contribution on salary below the CPP maximum salary (the portion from 4.8% to 5.0%).

57
Experience (continued)
Comments Regarding Experience Return on Assets The assumed rate of return for actuarial valuation purposes was 6.5% per annum or $148,435,000, based on the actuarial value of assets as at July 1, 2005. After allowance is made for the market value adjustment under the asset valuation method of $21,329,000, the net return on the actuarial value of assets was 7.4% or $169,764,000. The market value adjustment of $21,329,000 represents the asset gain under the asset valuation method. The total return based on the actual market value of assets after allowing for the full amount of capital appreciation during the year was 7.8% after expenses, assuming contributions and benefit payments take place in the middle of the year.
Salary Increases The assumed salary increase used for the July 1, 2005 actuarial valuation was 4.5% per year. Actual salary increases varied by staff group. Salary increases lower than expected for certain staff groups resulted in an actuarial gain of $3,926,000.
YMPE Increase The Year's Maximum Pensionable Earnings (YMPE) under the Canada Pension Plan increased by 2.4% from 2005 to 2006. This was less than the 3.5% increase anticipated by the assumptions, generating an actuarial loss of $843,000.
Indexation of Benefits Benefit entitlements for retired and terminated vested participants as of July 1, 2006 increased by 1.65% under the regular indexation formula. The increase was lower than the 1.875% increase anticipated under the actuarial assumptions, resulting in an actuarial gain of $2,804,000.
Mortality Mortality experience since July 1, 2005 was lower than expected under the valuation assumptions. This resulted in an actuarial loss of $10,060,000.
All Other Sources Other factors such as personnel changes, retirement ages, data corrections, mortality among terminated vested participants, etc., deviated from expected resulting in a net actuarial gain of $1,694,000.

58
Experience (continued)
Plan Amendments Pensioner Augmentation As a result of an arbitration award in connection with salary and benefits negotiations between the University of Toronto and the University of Toronto Faculty Association, all pensioners who retired prior to January 1, 2006 from employment as a member of the Academic Staff or as a Librarian (including surviving beneficiaries of such pensioners) received an additional augmentation to their pension benefit, effective July 1, 2006, determined as follows:
• For those eligible pensioners who retired up to and including December 31, 2004, the additional augmentation was 1.07% of the June 1, 2006 pension benefit.
• For those eligible pensioners who retired in 2005, the additional augmentation was 0.55% of the June 1, 2006 pension benefit.
The augmentations when combined with the regular indexation, brings the inflation protection for July 1, 2005 and July 1, 2006 up to 100% of the increase in the Consumer Price Index, effective July 1, 2006.
This Plan amendment increased the Accrued Liability by $8,796,000 as of July 1, 2006.
Accrual Rate Below Average CPP Maximum Salary The accrual rate on the Highest Average Salary below the Average CPP Maximum Salary was increased from 1.5% to 1.6% for past and future Pensionable Service, retroactive to January 1, 2006, for Administrative Staff, ESL instructors and certain Unionized Staff (CUPE 1230 and CUPE 3261). At the same time, the participant contribution rate on Salary below the CPP Maximum Salary increased from 4.5% to 5.0%, retroactive to January 1, 2006. The change in accrual rates and contribution rates for Unionized Administrative Staff and certain Unionized Staff (CAW 2003, IAMAW 325 and IBEW 353) were already reflected in the July 1, 2005 actuarial valuation.
This Plan amendment increased the Accrued Liability by $7,222,000 and the University Current Service Cost by $258,000.
Retirement Provisions—Academic Staff and Librarians Under the Agreement on Retirement Matters reached between the University of Toronto and the University of Toronto Faculty Association in March 2005:
• Effective with participants reaching normal retirement date on or after June 30, 2006, mandatory retirement at normal retirement date was eliminated.
• Effective with early retirements on or after June 30, 2006, an unreduced early retirement provision was introduced for Academic Staff (excluding clinicians) and Librarians who retire on any June 30th or December 31st after attaining age 60 with 10 or more years of Pensionable Service.

59
Experience (continued)
To reflect the above provisions, the retirement age assumption for Academic Staff and Librarians was changed as follows:
Old Assumption Age 63.5, with 94% of accrued benefit (reflecting the 3% per year reduction under VEARP).
New Assumption Age 64, but no earlier than one year after the valuation date, with 100% of the accrued benefit if participant has 10 or more years of Pensionable Service.
The Plan amendment combined with the change in retirement age assumption to reflect that amendment decreased the Accrued Liability by $2,429,000 and increased the University Current Service Cost by $1,717,000. Note that part of the increase in the Participant Salary Base from July 1, 2005 is attributable to the change in retirement age assumption since the Participant Salary Base used to calculate the University Current Service Cost as a percentage of the Participant Salary Base is the Salary for those participants under the assumed retirement age.
Retirement Provisions—Administrative Staff and Unionized Staff For Administrative Staff in the P/Ms 6 through 9, effective with early retirements on or after June 30, 2006, the unreduced early retirement provision was changed from age 60 or over with 80 or more points (age plus Continuous Service) to age 60 or over with 15 or more years of Pensionable Service.
The Temporary Early Retirement Window for Unionized Administrative Staff effective from July 1, 2005 to June 30, 2008, was also extended to Administrative Staff (excluding P/Ms 6 through 9) and certain Unionized Staff (subject to slightly different expiry dates).
The retirement age assumption has been changed as follows:
Old Assumption Age 63.5, with 100% of accrued benefit with 80 or more points.
New Assumption Age 63, but no earlier than one year after the valuation date, with 100% of the accrued benefit if participant has 80 or more points (or 15 or more years of Pensionable Service for Administrative Staff - P/Ms 6 through 9).
The change in retirement age assumption had no material impact on either the Accrued Liability or the University Current Service Cost.
In the July 1, 2005 actuarial valuation, the Accrued Liability was increased by $5,000,000 to reflect early retirements anticipated under the Temporary Early Retirement Window for Unionized Administrative Staff. With the extension of the Temporary Early Retirement Window to other staff groups, $5,000,000 has again been added to the Accrued Liability (rather than reducing the $5,000,000 to reflect retirements during the period from July 1, 2005 to June 30, 2006).

60
Actuarial Report
University of Toronto (OISE) Pension Plan As of July 1, 2006

61
Summary
(thousands of dollars) As of
July 1, 2005 As of
July 1, 20061
Going Concern Valuation Results2 Past Service Actuarial Value of Assets $ 96,276 $ 99,982 Less: Accrued Liability 91,691 95,985 Surplus (Unfunded Accrued Liability) $ 4,585 $ 3,997 As a % of Accrued Liability 5.0% 4.2% Excess Surplus $ 0 $ 0 Market Value of Assets $ 96,955 $ 101,231 Deferred Asset Gain (Loss) $ 679 $ 1,249 Current Service Total Current Service Cost $ 1,891 $ 1,739 Less: Required Participant Contributions 547 510 Remaining Current Service Cost $ 1,344 $ 1,229 As a % of Participant Salary Base 13.1% 13.0% Participant Salary Base $ 10,244 $ 9,423
1 Reflects plan changes. 2 On August 16, 2000, the Superintendent of Financial Services ordered that the Plan be wound-up in part in relation to participants who terminated employment between February 1996 and June 1996 under special voluntary retirement or severance programs in effect at that time. On June 23, 2005, a Partial Plan Wind-Up Report was filed with the Financial Services Commission of Ontario to determine the portion of assets allocable to the partial wind-up group as of June 30, 1996, and to update the assets allocable to the partial wind-up group to June 30, 2004. For valuations on or after July 1, 2005, the valuation results exclude assets and liabilities related to partial wind-up participants.

62
Summary (continued)
(thousands of dollars) As of
July 1, 2005 As of
July 1, 20061
Funding Requirements Required Participant Contributions $ 547 $ 510
Minimum Required University Contributions $ 0 $ 0 As a % of Participant Salary Base 0.0% 0.0% Remaining Current Service Cost $ 1,344 $ 1,229 Less: Required Application of Excess Surplus 0 0 Maximum Eligible University Contributions $ 1,344 $ 1,229 As a % of Participant Salary Base 13.1% 13.0% Solvency Valuation Results Solvency Assets2 $ 96,555
$ 100,831
Solvency Liability – Without Escalated Adjustments3 88,414 95,820
Solvency Excess/(Deficit) $ 8,141 $ 5,011
Transfer Ratio 1.00 N/A
Wind-Up Valuation Results Wind-Up Assets2 $ 96,555 $ 100,831
Wind-Up Liability – With Escalated Adjustments3 115,264 128,533
Wind-Up Excess/(Deficit) $ (18,709) $ (27,702)
Transfer Ratio N/A 0.79
_______________________ 1 Reflects plan changes. 2 Net of provision of $400,000 for estimated wind-up expenses. 3 The Solvency Liability excludes the liabilities associated with future escalated adjustments (indexing) pursuant to the
Regulations to the Pension Benefits Act (Ontario). The Wind-Up Liability is calculated including the value of future escalated adjustments, as well as the value of the temporary early retirement windows for those members who would be retirement age eligible before the end of the window period.

63
Summary (continued)
As of July 1, 2005
As of July 1, 2006
Personnel Data Participants Not Affected by Partial Wind-Up Active Participants 146 131 Retired Participants 130 134 Terminated Vested Participants 17 18 Total 293 283 Partial Wind-Up Participants With Entitlements Remaining in Plan
Partial Wind-Up Participants Receiving Immediate Pension
20
19
Partial Wind-Up Participants Pending Elections 6 6 Total 26 25

64
Assets and Liabilities (continued)
Revenue Account Total Trust Market Value, July 1, 2005 $108,967,000
Contributions 588,000
Net Investment Gain from Master Trust 9,227,000
Pensions Paid (3,884,000)
Refunds and Transfers (91,000)
Fees and Expenses (excluding partial wind-up expenses) (960,324)
Partial Wind-Up Expenses (14,676)
Market Value, June 30, 2006 $113,832,000
Return on Market Value (after Fees and Expenses, but before Partial Wind-Up Expenses) 7.7%
Asset Attributable to Partial Wind-Up Participants Market Value for Partial Wind-Up Participants, July 1, 2005 $ 12,011,928
Pensions Paid to Partial Wind-Up Participants (309,565)
Investment Return (7.7%) 913,732
Partial Wind-Up Expenses (14,676)
Market Value for Partial Wind-Up Participants, June 30, 2006 $ 12,601,419
Asset for Remaining Plan Total Market Value $113,832,000
Less: Market Value for Partial Wind-Up Participants 12,601,419
Market Value of Assets for Remaining Plan $101,230,581

65
Assets and Liabilities (continued)
Solvency Valuation Results (thousands of dollars) Following are the solvency valuation results: Solvency Valuation Wind-Up Valuation
1. Market Value of Assets $ 101,231 $ 101,231
2. Estimated Wind-Up Expenses (400) (400)
3. Assets Net of Wind-Up Expenses $ 100,831 $ 100,831
Solvency/Wind-Up Liability Active Participants 51,802 $ 72,881
Retired Participants 42,774 53,791 Terminated Vested Participants 1,244 1,861
Total $ 95,820 $ 128,533
Surplus (Deficiency), (3) - (4) $ 5,011 $ (27,702)
Transfer Ratio, (1)/(4) N/A 0.79 As permitted under the Regulations to the Pension Benefits Act (Ontario), the Solvency Liability excludes the liabilities associated with escalated adjustments (future indexing) and potential early retirement window benefits (potential future elections under the programs in effect on July 1, 2006). Reflecting future escalated adjustments in the Wind-Up Valuation increases the liabilities by $31,677,000. Reflecting the early retirement windows in the wind-up valuation (for those members who would be retirement eligible before the end of the window period) increases the liabilities by $1,036,000.
The assumptions used to determine the Solvency Liability are summarized on page 39 of this report. Note that the interest rates (with escalated adjustments) reflect the value of future indexation of pensions during both the preretirement and postretirement periods.
In our opinion, the value of Plan assets, less a reasonable allowance for wind-up expenses, would be less than the actuarial liabilities (including escalated adjustments, and the temporary early retirement window benefits for retirement eligible members) by $27,702,000 if the Plan were wound-up on the valuation date, assuming that there is a competitive market for inflation indexed annuities or that a reasonable fixed rate of indexation could be substituted for inflation-linked indexation to facilitate annuity purchases.

66
Experience
Reconciliation of Surplus (thousands of dollars) Surplus at July 1, 2005 $ 4,585 Less: Surplus Applied Against Current Service Cost (1,344) Plus: Interest at 6.5% per annum 254 _________
Equals: Surplus at July 1, 2006, Before Experience Gains (Losses) $ 3,495 Plus: Increase (Decrease) in Surplus at July 1, 2006 Due to: Gains (Losses): Return on Assets $ 625 Salary Increases 414 YMPE Increase (30) Indexation of Benefits 98 Mortality (102) All Other Sources 125 Plan Amendments – Pensioner Augmentation (211) Plan Amendments – 1.6% Accrual Rate (135) Plan Amendments –Retirement Provisions (282) _________
Equals: Surplus at July 1, 2006 $ 3,997

67
Experience (continued)
Comments Regarding Experience Return on Assets The assumed rate of return for actuarial valuation purposes was 6.5% per annum or $6,158,000, based on the actuarial value of assets as at July 1, 2005. After allowance is made for the market value adjustment under the asset valuation method of $625,000, the net return was 7.2% or $6,783,000. The market value adjustment of $625,000 represents the asset gain under the asset valuation method. The total return based on the actual market value of assets was 7.7% after expenses (but before partial wind-up expenses), assuming contributions and benefit payments take place in the middle of the year.
Salary Increases The assumed salary increase used for the July 1, 2005 actuarial valuation was 4.5% per year. Actual salary increases varied by staff group. Salary increases lower than expected for certain staff groups resulted in an actuarial gain of $414,000.
YMPE Increase The Year's Maximum Pensionable Earnings (YMPE) under the Canada Pension Plan increased by 2.4% from 2005 to 2006. This was less than the 3.5% increase anticipated by the assumptions, generating an actuarial loss of $30,000.
Indexation of Benefits Benefit entitlements for retired and terminated vested participants as of July 1, 2006 increased by 1.65% under the 75% of CPI indexing provision (and corresponding higher percentages for retirees under one of the pre-integration provisions). The increase was less than the 1.875% increase anticipated under the actuarial assumptions, resulting in an actuarial gain of $98,000.
Mortality Mortality experience since July 1, 2005 was lower than expected under the valuation assumptions. This resulted in an actuarial loss of $102,000.
All Other Sources All other factors combined resulted in a net actuarial gain of $125,000.

68
Experience (continued)
Plan Amendments Pensioner Augmentation As a result of an arbitration award in connection with salary and benefits negotiations between the University of Toronto and the University of Toronto Faculty Association, all pensioners who retired prior to January 1, 2006 from employment as members of the Academic Staff or as a Librarian (including surviving beneficiaries of such pensioners) received an additional augmentation to their pension benefit, effective July 1, 2006. The augmentations when combined with the regular indexation, brings the inflation protection for July 1, 2005 and July 1, 2006 up to 100% of the increase in the Consumer Price Index, effective July 1, 2006.
This Plan amendment increased the Accrued Liability by $211,000 as of July 1, 2006.
Accrual Rate Below Average CPP Maximum Salary The accrual rate on the Highest Average Salary below the Average CPP Maximum Salary was increased from 1.5% to 1.6% for past and future Pensionable Service, retroactive to January 1, 2006, for Administrative Staff. At the same time, the participant contribution rate on Salary below the CPP Maximum Salary increased from 4.5% to 5.0%, retroactive to January 1, 2006.
This Plan amendment increase the Accrued Liability by $135,000 and the University Current Service Cost by $7,000.
Retirement Provisions—Academic Staff and Librarians Under the Agreement on Retirement Matters reached between the University of Toronto and the University of Toronto Faculty Association in March 2005:
• Effective with participants reaching normal retirement date on or after June 30, 2006, mandatory retirement at normal retirement date was eliminated.
• Effective with early retirements on or after June 30, 2006, an unreduced early retirement provision was introduced for Academic Staff (excluding clinicians) and Librarians who retire on any June 30th or December 31st after attaining age 60 with 10 or more years of Pensionable Service.
This Plan change increased the Accrued Liability by $282,000 and the University Current Service Cost by $13,000

69
Actuarial Report
University of Toronto Supplemental Retirement Arrangement
As of July 1, 2006
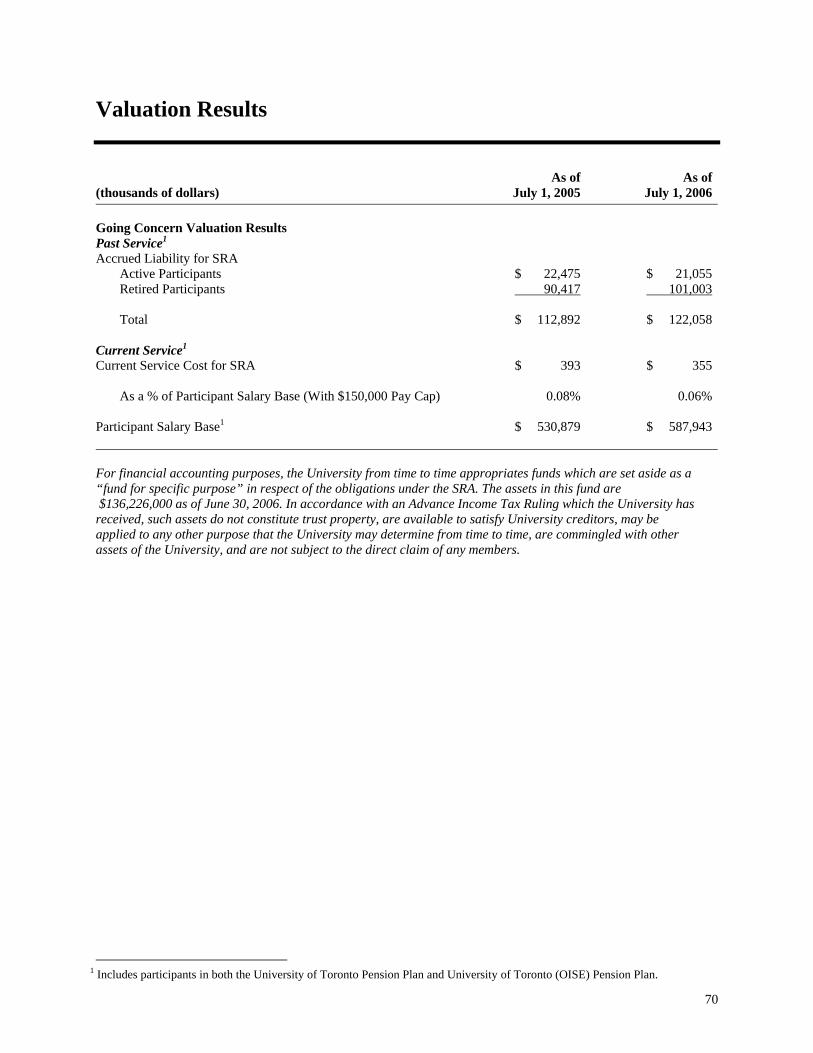
70
Valuation Results
(thousands of dollars) As of
July 1, 2005 As of
July 1, 2006 Going Concern Valuation Results Past Service1 Accrued Liability for SRA Active Participants $ 22,475 $ 21,055 Retired Participants 90,417 101,003 Total $ 112,892 $ 122,058 Current Service1 Current Service Cost for SRA $ 393 $ 355 As a % of Participant Salary Base (With $150,000 Pay Cap) 0.08% 0.06% Participant Salary Base1 $ 530,879 $ 587,943
For financial accounting purposes, the University from time to time appropriates funds which are set aside as a “fund for specific purpose” in respect of the obligations under the SRA. The assets in this fund are $136,226,000 as of June 30, 2006. In accordance with an Advance Income Tax Ruling which the University has
received, such assets do not constitute trust property, are available to satisfy University creditors, may be applied to any other purpose that the University may determine from time to time, are commingled with other assets of the University, and are not subject to the direct claim of any members.
1 Includes participants in both the University of Toronto Pension Plan and University of Toronto (OISE) Pension Plan.

71
University of Toronto
(OFFICE OF THE VICE-PRESIDENT, BUSINESS AFFAIRS – FINANCIAL SERVICES DEPARTMENT
TO: Business Board SPONSOR: Sheila Brown CONTACT INFO: 416-978-2065, [email protected] DATE: January 12, 2004 for January 19, 2004 AGENDA ITEM: ITEM IDENTIFICATION:
Pension Strategy JURISDICTIONAL INFORMATION:
The Business Board approves policies with respect to financial programs and transactions, and approves individual programs and transactions as required by those policies. PREVIOUS ACTION TAKEN:
In October 1997, Business Board approved the funding strategy for the registered University Pension Plan (RPP) and the unregistered Supplemental Retirement Arrangement (SRA). HIGHLIGHTS: In 1997, the University had a registered pension plan in surplus, to which it was not permitted to make contributions, and had just established the SRA. The strategy that was adopted in 1997 was to utilize pension budget, established at 75% of employer current service cost, to fund the SRA unfunded liability over 5 years, and for other University purposes. At July 1, 2003, the RPP was in deficit. The SRA, while also in deficit, had assets of $91.2 million, exceeding the original funding commitment, and liabilities are moving back and forth between the SRA and RPP in accordance with the rate of increase in the Income Tax Act maximum pension over time. The RPP deficit requires payment of full current service pension contributions and special payments in respect of unfunded past service. The proposed pension strategy going forward is to consider the RPP and SRA together, to put in place a funding mechanism that amortizes deficits in both plans over the 15 year period permitted under pension regulations and to do so using a smoothed approach that is both prudent and predictable. Here are the specific recommendations:
1. Employees make their regular annual contributions.
2. For the 2003-04 fiscal year, the University contributes $26.8 million to the RPP and $9.5 million to the SRA.

72
3. Beginning May 1, 2004, the University contributes 100% of the required employer current service cost for the RPP and SRA. This will require restoration of the operating budget pension budget to 100% of the RPP current service cost.
4. Beginning May 1, 2004, the SRA is put on the same basis as the RPP with respect to deficits.
With the achievement of full funding of the original past service liability occurring at the time the SRA was established in 1997 and because a portion of the liabilities will move back and forth between the SRA and the RPP in accordance with the Income Tax Act maximum pension over time, future SRA deficits should now be treated like those of the RPP and funded over 15 years.
5. Beginning May 1, 2004, the University makes special payments of no less than $26.4 million
annually to deal with the RPP and SRA deficits by way of a smoothed budget allocation over about 15 years. This smoothed approach provides for higher payments than required in the earlier years, thus holding off any possible solvency issues and providing for predictability.
6. The OISE plan is a closed plan (no new members) and is still in a surplus position. It is unlikely
that the university will have to make a current service cost contribution to this plan in the near future and therefore no budget is proposed for this.
7. Steadfastly make a special payment of no less than $26.4 million annually in respect of the RPP
and the SRA even if investment returns reduce plan deficits. By doing this, the University will be making provision for future periods of poor investment returns.
8. Continue to set these funds aside, regardless of Income Tax Act restrictions. If not permitted to
make contributions to the RPP, reserves should be set aside outside the RPP.
9. Make provision for funding any future augmentations that might occur by setting aside the corresponding amount from pension surpluses existing at the time.
FINANCIAL AND/OR PLANNING IMPLICATIONS:
To implement this strategy, the University’s operating budget allocation for pensions must rise from $31.2 million for fiscal year 2003-04 to $65.9 million for 2004-05, $75.5 million for 2005-06, $77.8 million in 2006-07, $80.3 million in 2007-08, $82.7 million in 2008-09 and $85.0 million in 2009-10.
With these contributions and if the assumptions contained in the projections with respect to investment returns, participation, etc. would be achieved, the RPP deficit would increase to about $236 million in 2004-05 and then gradually decline over time. The SRA deficit would remain approximately at current levels even though liabilities are projected to rise. There is considerable variability expected in these liabilities since they will be influenced by the rate of increase in the Income Tax Act maximum pension, which is pegged to the increase in the industrial wage starting in 2006.
The impact on the financial statements is expected to be an increase in pension expense on the
income statement from $39.7 million in 2002-03 to about $90 million annually. Pension liability on the balance sheet is expected to rise to about $131 million by 2007-08 and then begin to fall as the deficit is reduced over time. RECOMMENDATION:
That the Business Board approves the funding strategy contained in the nine recommendations provided above.

73
January 12, 2004
To: Members of the Business Board From: Sheila Brown, Acting Chief Financial Officer Subject: Pension Strategy - Funding of Pension Plans and Supplemental Retirement Arrangement
The purpose of this report is to recommend a strategy for funding the pension plans and supplemental retirement arrangement to ensure that the plans can continue to meet their obligations to provide pensions to current and future pensioners.
The University of Toronto has two registered pension plans and one unregistered plan. The University of Toronto Pension Plan (“RPP”) is the main plan which covers most employees at the university. The University of Toronto (OISE) Pension Plan (“OISE”) covers University of Toronto employees who were previously employees of OISE prior to June 30, 1996 and are either continuing employees of the University or retirees. The unregistered Supplemental Retirement Arrangement (“SRA”) was established in 1997 and provides additional retirement income to compensate for the limitations prescribed under the Income Tax Act (Canada) on the amount of lifetime retirement benefits payable from the registered pension plans. Financial Status of Pension Plans at July 1, 2003: University of Toronto Pension Plan:
• Deficit based on market value of assets $203.5 million • Surplus based on actuarial value of assets $2.2 million • Solvency ratio excluding indexing 1.02
Supplemental Retirement Arrangement:
• Deficit at market value of assets $17.4 million University of Toronto (OISE) Pension Plan:
• Surplus based on market value of assets $7.1 million • Surplus based on actuarial value of assets $18.0 million
Current pension funding strategy:
The current pension plan funding strategy was approved by the Business Board in 1997 and was imbedded in the University’s long-range budget plan. This strategy recognized that the University was prohibited under the Income Tax Act from contributing to the University Pension Plan since the pension surplus at the time was greater than 10% of liabilities. This strategy established the supplemental retirement arrangement and provided for the funding of its past service cost over five years as a first priority for allocation of funds generated from the required employer contribution holiday. The resulting operating budget strategy provided for the ongoing base budget for the current service costs of the RPP to be maintained at its then current level, which amounted to 75% of the annual employer current service cost. The OISE current service cost base budget was eliminated since the interest on the OISE surplus each year was sufficient to cover the yearly current service cost obligations.

74
What has changed since 1997?
The RPP has moved from a market surplus position to a market deficit position due to poor investment returns, pension enhancements and employer and employee contribution holidays. The SRA is no longer a new plan and enough funds have been set aside to cover the original SRA obligation of $78.0 million. Some of the liability is transferring back and forth between the SRA and the RPP in accordance with the increase in the Income Tax Act maximum pension. The University and employees must contribute the full current service cost and the University will be required to make additional special payments to deal with the pension deficit. These factors require a revised pension strategy going forward. Proposed pension strategy:
The University’s actuary, Hewitt Associates, has modeled a number of alternative strategies that have been considered. The proposed strategy is the one that best combines the need for financial prudence, maintenance of a solvency ratio greater than 1.0, and operating budget predictability. The proposed strategy incorporates the following recommendations:
10. Employees make their regular annual contributions.
11. For the 2003-04 fiscal year, the University contributes $26.8 million to the RPP and $9.5 million
to the SRA.
12. Beginning May 1, 2004, the University contributes 100% of the required employer current service cost for the RPP and SRA. This will require restoration of the operating budget pension budget to 100% of the RPP current service cost.
13. Beginning May 1, 2004, the SRA is put on the same basis as the RPP with respect to deficits.
With the achievement of full funding of the original past service liability occurring at the time the SRA was established in 1997 and because a portion of the liabilities will move back and forth between the SRA and the RPP in accordance with the Income Tax Act maximum pension over time, future SRA deficits should now be treated like those of the RPP and funded over 15 years.
14. Beginning May 1, 2004, the University makes special payments of no less than $26.4 million
annually to deal with the RPP and SRA deficits by way of a smoothed budget allocation over about 15 years. This smoothed approach provides for higher payments than required in the earlier years, thus holding off any possible solvency issues and providing for predictability.
15. The OISE plan is a closed plan (no new members) and is still in a surplus position. It is unlikely
that the university will have to make a current service cost contribution to this plan in the near future and therefore no budget is proposed for this.
16. Steadfastly make a special payment of no less than $26.4 million annually in respect of the RPP
and the SRA even if investment returns reduce plan deficits. By doing this, the University will be making provision for future periods of poor investment returns.
17. Continue to set these funds aside, regardless of Income Tax Act restrictions. If not permitted to
make contributions to the RPP, reserves should be set aside outside the RPP.
This strategy provides for prudent financial management of the pension plans combined with a level of predictability for the operating long-range budget plan.

75
Pension Projections Illustrating this Strategy: The graphs at the end of this paper illustrate the impact of the proposed strategy on the pension surplus (Graph # 1) and on the pension budget (Graph # 2). It is important to note that:
-the nominal investment return assumption used for both the RPP and the SRA is 7% for 2004 and thereafter. The models are therefore based on a 7% per annum average return over 15 years. It should be noted that 67% of the time, actual returns will fluctuate between minus 3% and plus 17%. -The annual special payment has been determined by the actuary to be $26.4 million representing approximately the amount that would be required to amortize the expected market value deficit as of July 1, 2004 in the combined RPP and the SRA over 15 years. The $26.4 million annual payment will be allocated as follows, $24.8 million in the RPP and $1.6 million in the SRA. -the proposed strategy, and thus these projections, includes the cost of pension augmentation from 75% of CPI to 100% of CPI for faculty and librarian retirees up to and including July 1, 2004, but not beyond July 1, 2004.
What about Possible Future Augmentations As noted above, the recent UTFA settlement provided for an augmentation to faculty and librarian pensioners benefits from 75% to 100% of inflation for 2003 and 2004. The cost of that augmentation is $12 million for faculty and librarian retirees. The cost of this augmentation has been amortized over 15 years with the addition of $1.4 million per annum to the annual special payment required. This does not however address the possibility of other future augmentations. Over the past years, augmentation has essentially represented a distribution of surplus. In the absence of a pension surplus, provision of further augmentation is very uncertain. However any augmentations that might be provided in future would have to be funded, either by contributions to the plan or from any future pension surpluses. The latter strategy makes the most sense given the rationale for making augmentations. Therefore, this gives rise to the following additional recommendation:
9. Make provision for funding any future augmentations that might occur by setting aside the corresponding amount from pension surpluses existing at the time.
To implement this strategy, the University’s operating budget allocation for pensions must rise
from $31.2 million for fiscal year 2003-04 to $65.9 million for 2004-05, $75.5 million for 2005-06, $77.8 million in 2006-07, $80.3 million in 2007-08, $82.7 million in 2008-09 and $85.0 million in 2009-10.
With these contributions and if the assumptions contained in the projections with respect to investment returns, participation, etc. would be achieved, the RPP deficit would increase to about $236 million in 2004-05 and then gradually decline over time. The SRA deficit would remain approximately at current levels even though liabilities are projected to rise. There is considerable variability expected in these liabilities since they will be influenced by the rate of increase in the Income Tax Act maximum pension, which is pegged to the increase in the industrial wage starting in 2006.
The impact on the financial statements is expected to be an increase in pension expense on the
income statement from $39.7 million in 2002-03 to about $90 million annually. Pension liability on the balance sheet is expected to rise to about $131 million by 2007-08 and then begin to fall as the deficit is reduced over time.

76
Recommendation
That the Business Board approves the funding strategy contained in the nine recommendations provided above.
GRAPH #1Registered Pension Plan Actuarial and Market Surplus
-$300.0
-$200.0
-$100.0
$0.0
$100.0
$200.0
$300.0
$400.0
$500.0
$600.0
Actuarial and market at July 1
Mill
ions
of $
Actuarial Surplus 391.8 337.7 2.2 -131.3 -168.5 -178.6 -173.9 -160.4 -141.0 -117.1
Market Surplus 579.1 294.4 -203.5 -236.0 -221.7 -205.7 -187.7 -167.4 -144.6 -118.9
2000 2001 2003 2005 2007 2009 2011 2013 2015 2017
GRAPH #2
Operating budget required
$20
$30
$40
$50
$60
$70
$80
$90
Mill
ions
Operating budget required 26.7 27.9 29.0 31.2 65.9 75.5 77.8 80.3 82.7 85.0
2001 2002 2003 2004 2005 2006 2007 2008 2009 2010
As at April 30


