29
UNIVERSITY TRAVEL PLAN First adopted May 2011 Revised June 2014 Last updated April 2016

UNIVERSITY TRAVEL PLAN
First adopted May 2011
Revised June 2014
Last updated April 2016

Document Revision Methodology This document is the second version of the travel plan originally adopted in 2011 and was first released in 2014. It is updated annually to include new policy where applicable, review of the Monitoring section (see Section 11), and up-to-date carbon emissions (see Appendix 4). Amendments made are listed below:
Sections: Date: 6.31 to 6.34 inclusive amended 4-12-15 Section 11.1 Monitoring added 23-12-15 Appendix 3 updated 18-03-16 Section 11.2 Monitoring added 22-03-16 Section 11.1 Monitoring updated 25-04-16 Appendix 2 added and appendices renumbered 25-04-16

TABLE OF CONTENTS
EXECUTIVE SUMMARY ....................................................................................................................... 1
1. INTRODUCTION .............................................................................................................................. 2
2. INSTITUTIONAL EVALUATION ......................................................................................................... 4
3. OBJECTIVES .................................................................................................................................... 6
4. TARGETS ........................................................................................................................................ 7
5. UNIVERSITY VEHICLE FLEET ............................................................................................................. 8
6. WORK RELATED TRAVEL ................................................................................................................. 9
7. COMMUTING ............................................................................................................................... 14
8. EXTERNAL VISITORS ...................................................................................................................... 18
9. SUPPLIERS AND DELIVERIES .......................................................................................................... 18
10. CONCLUSION .............................................................................................................................. 18
11. MONITORING ............................................................................................................................. 19
Appendix 1: Baseline Scope 1 Carbon Emissions for University Vehicle Fleet (2005-06) ...................... 22
Appendix 2: Baseline Scope 3 Carbon Emissions from Business Travel (2012-13) ................................ 22
Appendix 3a: Baseline Scope 3 Carbon Emissions from Student Commuting (2007-08) ....................... 23
Appendix 3b: Baseline Scope 3 Carbon Emissions from Staff Commuting (2007-08) ............................ 24
Appendix 4: Scope 1 and 3 Transport and Travel Carbon Emissions Data (2014-15) ............................ 25
Appendix 5: Business Travel Reimbursement Rates ............................................................................... 26

1
EXECUTIVE SUMMARY Climate change is a vitally important global issue and in the UK the Government has recognised this in legislation. The 2008 Climate Change Act introduced targets for reducing carbon 34% by 2020 and 80% by 2050 (against 1990 levels). The Higher Education Funding Council for England (HEFCE) expects higher education to be at the forefront of this work and has produced its own carbon reduction strategy for the sector. HEFCE has adopted the Climate Change Act targets as part of its carbon reduction strategy. It requires all universities to produce their own individual carbon reduction strategies and since 2011 has introduced a link between an institution’s capital allocation and its carbon performance. In 2006 a study commissioned by HEFCE concluded that carbon emissions from transport activity accounted for 38% of the sector’s carbon. HEFCE requires all universities to produce a travel plan as part of their carbon reduction strategy. This Travel Plan covers all travel and transport at the university, including travel by visitors and suppliers, and provides a framework within which local arrangements at the campuses can be developed. Its primary objective is to bring about a significant reduction in carbon emissions. Each form of transport activity is discussed and measures put forward to further the objectives. Carbon emissions from the university’s own vehicle fleet will be scrutinised and further investment made in new high tech low emission vehicles. Work related business travel will be closely monitored, better understood and reduced where possible. More sustainable forms of commuting will be encouraged whilst commuting by car will be discouraged primarily through parking charges. The income generated from this will be invested to support more sustainable travel. This Travel Plan is designed to exceed the HEFCE targets and will form a backdrop to stimulate awareness of sustainable travel throughout the university community. The plan will be ongoing with the objective of working towards the target milestones in 2020 and 2050. It will be reviewed annually and progress will be reported to the university via the Carbon Management Board.

2
1. INTRODUCTION 1.1 Climate change is a vitally important global issue. The UK Government has recognised this in legislation. The 2008 Climate Change Act introduced targets for reducing carbon1 34% by 2020 and 80% by 2050 (against 1990 levels). The Higher Education Funding Council for England (HEFCE) expects higher education to be at the forefront of this work and has produced its own carbon reduction strategy2 for the sector.
1.2 HEFCE has adopted the Climate Change Act targets as part of its reduction strategy. It requires all universities to produce their own individual carbon strategies with the aim of reducing their direct carbon emissions and those emissions resulting as a consequence of their activities. Since 2011 it has introduced a link between an institution’s capital allocation and its carbon performance. In essence capital projects will not receive funding unless they can demonstrate their sustainable credentials.
1.3 In 2006 a study commissioned by HEFCE concluded that emissions from transport activity3 account for 38% of the higher education sector’s carbon. HEFCE requires all universities to produce a travel plan as part of their carbon reduction strategy. 1.4 Carbon emissions are accounted for by allocating them to one of three recognised categories4 based on their relationship to an organisation:
Scope 1: Emissions from sources owned or controlled by an organisation Scope 2: Emissions from the generation of electricity purchased by an organisation Scope 3: Indirect emissions produced as a consequence of an organisation’s activities
1.5 The HEFCE reduction targets apply to Scope 1 and Scope 2 emissions. As of 2012-13 HEFCE required universities to report data to the Higher Education Statistics Agency (HESA) for all their carbon emissions including Scope 3 as part of their Estate Management Record (EMR) submission. It is anticipated that HEFCE will introduce a target for Scope 3 emissions in the future and in the meantime universities are expected to introduce policies to manage these emissions.
1 The word ‘carbon’ is abbreviated from ‘carbon dioxide’ and is used as a general term to define all greenhouse gas emissions which may also be abbreviated to emissions 2 Carbon Reduction Target and Strategy for Higher Education in England (HEFCE) January 2010/01 3 Report for HEFCE by SQW Consultants - all travel and transport activity at universities including international student travel 4 In accordance with the Greenhouse Gas Protocol

3
1.6 This Travel Plan (the Plan) covers all areas of transport and travel typically associated with an organisation. In the case of this institution these are as follows:
1. University owned vehicle fleet: Scope 1 2. Business travel: Scope 3 3. Commuting5 (staff and students): Scope 3 4. Deliveries and suppliers’ transport: Scope 3
1.7 The Plan is designed to make the University of Greenwich a leader in the sector by exceeding the HEFCE targets. It will be a challenge given the university’s multi-campus setting and some initiatives will need a local focus but at Greenwich Campus and Avery Hill Campus it is greatly aided by the Transport for London (TfL) travel network. 1.8 Staff will be made aware of the principles of the Plan online, in electronic communications, and where applicable as part of their induction to the university. 1.9 The Plan will be available on the university’s website and the measures adopted within it promoted to the student community periodically in electronic communications via the portal or email. Awareness of the importance of sustainable travel and transport will be raised as part of teaching and research and Sustainability will be part of the Graduate Attributes Programme. 1.10 Travel Surveys of staff and students will be carried out bi-annually as a way of measuring the success of the Plan. These will be supported where appropriate by ad hoc surveys of car and cycle parking at each campus. 1.11 The Plan is an institutional policy that is overseen by the Estates and Facilities Directorate. The role of Travel Plan Coordinator will be carried out by the Transport & Green Travel Manager within the Transport Department of that Directorate. The institution as a whole will however accept responsibility for the Plan’s overall success. 1.12 As part of its aim to reduce overall carbon emissions, the university is implementing a Carbon Management Plan for the period 2011-2016 approved by the Carbon Trust. The Travel Plan will contribute towards these aims.
5 Excludes student travel between home and term time residencies

4
2. INSTITUTIONAL EVALUATION University Vehicle Fleet 2.1 In 2012-13 the vehicle fleet travelled over 118,000 miles which emitted around 45 tonnes6 of Scope 1 carbon emissions. In 2009-10 slightly more carbon was emitted (46 tonnes) although around 9,000 fewer miles were travelled. Emissions per mile can therefore be seen to have reduced during this period as older vehicles in the fleet have gradually been replaced by vehicles with high tech diesel engines. The increase in distance travelled has been due to a business decision to increase the use of the fleet minibuses on the University Bus Service and thereby reduce the amount spent on externally owned coaches. This results in more Scope 1 emissions and less Scope 3. The baseline data for Scope 1 emissions (see 4.2) was gathered in 2005-06 (see Appendix 1). No mileage data is available for that period to make a further comparison. 2.2 The size of the electric vehicle fleet has remained unchanged following the purchase of five electric vehicles in 2009-10. These vehicles have to date proved relatively expensive to maintain and in some cases unreliable. Entry into the electric van market of major manufacturers is expected to raise standards and further electrification of the university fleet is now planned. 2.3 The university purchased a new car in 2012-13 a Skoda New Octavia (diesel). It is based at Avery Hill Campus and available to hire by staff for work related travel when not being use for chauffeuring. It utilises the latest vehicle and engine technology and emits just 102g CO2 per km as opposed to 213g for the Rover 75 which it replaced. University Bus Service 2.4 Most of the bus service contributes to the university’s Scope 3 emissions on account of vehicles mostly being owned and operated by a commercial coach company. The service timetable has remained largely unchanged since 2011 although the total mileage is thought to have reduced as a result of fewer passengers to and from Medway resulting in a need for fewer vehicles. The decline in passenger numbers has been around 25% between 2010-11 and 2013-14 coinciding with lower student recruitment to Medway. This period has also corresponded with a gradual increase in fares on the Medway service with the intention of controlling overall net costs. The university continues to subsidise the service despite the increase in fares. It is hoped that future improvements will be made to the bus timetable to enhance the effectiveness between campuses particularly the Medway – Greenwich route. Work Related Travel 2.5 Until recently there has been no reliable data collated for work related7 travel by mode across the institution. The requirement from 2012-13 to report this data to HESA as part of the Estate Management Record (EMR) has brought this activity into focus and highlighted the deficiencies that remain with its collection within the institution (see 6.8, 6.34 and 6.35).
6 Calculated by applying DEFRA emission per litre values to fuel purchased 7 Work related travel, frequently termed business travel, reimbursed by the university

5
Avery Hill Campus 2.6 The university implemented a travel plan at Avery Hill Campus in 2009. The plan was most noted for the introduction of parking charges in the campus car parks. The purpose was to reduce car use by at least 25%, eliminate parking congestion, and provide investment income for sustainable travel initiatives such as the intercampus bus service to/from Greenwich Campus. 2.7 Surveys and anecdotal evidence suggest that the travel plan has increased use of public transport, university buses, motorcycles, bicycles and walking, and thereby reduced overall car use. The level of success however has undoubtedly been undermined by the continued absence of parking controls off-campus with a significant number of vehicles belonging to students and staff parked in nearby streets. The transfer in 2014 of the Architecture departments to Greenwich is anticipated to further reduce car travel to the campus. Greenwich Campus 2.8 Greenwich is well served by public transport routes and this caters for most commuting to the campus. There is also evidence that demand from staff for parking space in Greenwich has diminished in recent years. 2.9 Significant demand is placed on the intercampus University Bus Service from students resident in the halls at Avery Hill studying at Greenwich. The transfer of Architecture departments to Greenwich is expected to increase demand for bus use from Avery Hill whilst simultaneously reducing demand for car parking at Avery Hill with an impact on car park income. Nevertheless the relocation is expected to reduce the university’s Scope 3 carbon emissions as commuting in private vehicles to Avery Hill is replaced by public transport and walking to Greenwich. Medway Campus 2.10 Parking controls and charges were introduced at Medway Campus at the start of 2011-12 to help solve parking congestion problems and bring about a reduction in car use. To date their introduction has successfully achieved these objectives. The income raised has been available to support local bus services via a partnership with Arriva in conjunction with the University of Kent and Canterbury Christ Church University. As a result of this partnership many students and staff have benefited from reduced bus fares in and around Medway. Furthermore a bus route through campus running between Chatham, Gillingham and Hempstead Valley has been introduced. Many bus journeys to the campus still however require a change in Chatham and National Rail services are a 20 minute walk away in Gillingham or a 5-10 minute bus ride to Chatham. 2.11 There has been an increase in the supply of student accommodation in the Medway area but this is not thought to have significantly affected demand for the University Bus Service from Avery Hill and Greenwich (see 2.4 on previous page).

6
3. OBJECTIVES
3.1.1 The Plan has a number of broad objectives and these are listed below:
Reduce transport related carbon emissions
Raise awareness amongst individuals of the benefits of using sustainable transport
Raise awareness about the environmental impact of unsustainable travel
Increase levels of participation in walking and cycling with a view to supporting healthier lifestyles
Enhance the local environment around each of the university campuses by reducing air pollution, noise, congestion and thereby improving the surroundings for all users
Reduce wastage of university resources
Eliminate regular parking congestion 3.1.2 It should be noted that the primary aim of the Plan is to reduce carbon emissions and the Plan targets are based on this objective and laid out in Section 4 (see next page).

7
4. TARGETS
HESA 4.1 The HEFCE carbon reduction strategy combined target for Scope 1 and 2 emissions is a 34% reduction by 2020, and 80% reduction by 2050 (based on 20058 data). Scope 3 emissions (for work related travel and commuting) are more difficult to calculate and in many cases data has not been collated. Nevertheless universities are encouraged to establish a baseline (see 4.2 below). It is anticipated that these emissions will be set a target by HESA in the future. Baseline Emissions Data 4.2 Data for Scope 1 emissions from the university vehicle fleet is available for the HESA agreed baseline year of 2005-06 (see Appendix 1). Reliable work related business travel records have only been available since 2011-12 (see Appendix 2). The first recorded travel surveys were carried out 2007-08 and have been used to estimate Scope 3 emissions from commuting (see Appendix 3). Data in Appendix 2 and 3 form the baseline for our Scope 3 travel emissions data. The first complete set of transport related emissions data was gathered for the period 2012-13 as part of the university’s EMR submission for that period. Subsequent EMR submissions will be used to monitor ongoing progress of the Plan. University Targets 4.3 To align the Plan with the reporting of emissions data to HESA (as part of the EMR) three targets have been set9:
Scope 1 university vehicle fleet emissions: 40% reduction by 2020 (2005 baseline) Scope 3 work related travel emissions: 20% reduction by 2020 (2013 baseline) Scope 3 commuting emissions: 20% reduction by 2020 (2007 baseline)
4.4 All targets are absolute regardless of any changes to the student headcount.
8 It was initially intended to use 1990 but data was not available across the sector for that period 9 Targets set in 2011 for 2016 did not align with HEFCE targets and data collected was insufficient to support them

8
5. UNIVERSITY VEHICLE FLEET 5.1 Emissions from the university’s own vehicle fleet are categorised as being Scope 1 emissions. The HEFCE sector target for these emissions is a 34% reduction by 2020 and 80% reduction by 2050 (based on 2005 data). 5.2 Most vehicles in the university fleet are operated daily on short journeys local to the campus. The fleet size as of April 2014 is 20 vehicles comprising the following:
17 light commercial vans (including 5 electric with zero emissions)
2 minibuses each of 16 passenger seats
1 car (used for chauffeuring and available for staff to hire for work) 5.3 Of the 20 vehicles outlined in 5.2 above 19 of them are operated by Estates and Facilities and one by ILS. 5.4 To achieve the HEFCE Scope 1 emissions target the vehicle fleet will be managed in line with the following principles:
Vehicles will be well maintained
Fuel consumption will be measured and monitored
Drivers will be trained in fuel efficient driving
The vehicle replacement programme will balance the embedded carbon in new vehicle production with the need to operate reliably using the newest technology low emission vehicles. Vehicles will not normally be kept beyond 10 years of age.
Where proven affordable technology exists, electric vehicles (hybrids or full electric) will be chosen in preference to vehicles powered ordinarily by petrol or diesel
All vehicle use will be kept under constant review

9
6. WORK RELATED TRAVEL OVERVIEW 6.1 Work related travel contributes to the university’s Scope 3 emissions. Data collected for the 2012-13 EMR submission to HESA indicates that travel on university business has a considerable impact on the environment as a result of the carbon emitted (see Appendix 4 for up-to-date emissions). In particular the emissions attributed to air travel alone were estimated by our travel agents to be 5,045t in 2012-13, equal to around 35% of all the university’s energy emissions for the same period. Clearer understanding of business travel activity may help to reduce these emissions and deliver cost savings. 6.2 If travel is necessary carbon emissions must be considered along with the traditional factors of cost, convenience and safety. These factors may sometimes compete and judgement will have to be exercised by individuals and budget holders. MEETING MANAGEMENT 6.3 The need for holding meetings and their frequency will be scrutinised by the meeting Chair or Convenor. The use of information technology as an alternative to meeting, such as video or telephone conferencing, will always be considered and encouraged. All telephone sets are compatible with telephone conferencing and each campus has appropriate meeting rooms with video conferencing equipment, including specialist support. 6.4 When meetings take place the location chosen should aim to minimise total travel distance and unproductive travel time amongst those invited. The principle of the few travelling to the many will normally be adopted. Where attendees need to travel by car they should liaise with each other before meetings and car share if possible. Meeting times will be set to align with the University Bus Service times wherever possible. 6.5 Individuals should aim to plan multiple meetings into single journeys where possible to reduce the need for travel. TRAVEL EXPENDITURE 6.6 The university’s Financial Regulations require prior approval to be sought before any travel expenditure is incurred. Staff may be reimbursed for their essential travel expenses by submitting details, including where applicable their receipts, on a Staff Expenses Claim Form (available on the Staff Portal). Reimbursement rates are reviewed annually to ensure they remain fair (see Appendix 5). 6.7 Budget holders must scrutinise expenses claims to ensure journeys undertaken are consistent with the requirements of this Plan and should encourage the adoption of sustainable travel. 6.8 To comply with reporting of Scope 3 emissions to HEFCE, all modes of business travel undertaken need to be recorded (each mode emits a different quantity of carbon per passenger km). More information about journeys will therefore need to be recorded on Staff Expenses Claim Forms.

10
PUBLIC TRANSPORT 6.9 Public transport with the exception of aviation is normally considered to be sustainable as on average it emits less carbon per passenger km than a car particularly one of single occupancy. 6.10 Public transport, including for intercampus journeys the University Bus Service, is the preferred method of work related travel. Journeys between locations with good public transport must not therefore be carried out by car unless:
One or more passengers are involved and public transport is not cost effective
Heavy or bulky items are carried
The journey is during unsocial hours
The journey forms a significant part of a commute to/from home and is therefore down to individual choice
6.11 In accordance with the Financial Regulations the lowest cost ticket option must be purchased. Where practicable on longer journeys this will mean booking in advance and ideally using one of the travel agents (see 6.34). Expenditure incurred by individuals will be reimbursed subject to proof of purchase by completing a Staff Expenses Claim Form (see 6.12 below for travel in London). Oyster 6.12 Public transport within the Greater London region is operated by TfL and the Oyster Card is the standard means of payment offering considerable cost savings against cash. Oyster cards are free, save a £5 refundable deposit, and members of staff are encouraged to hold a card for use on any work related trip or alternatively obtain the same discount by using a contactless bank card (where facility is available). Faculties and Directorates may additionally, or alternatively, hold corporate Oyster Cards that can be issued to their staff for work trips as and when necessary. All travel on public transport within the TfL area will be reimbursed at the Oyster fare level. UNIVERSITY BUS SERVICE 6.13 The university will maintain and develop its bus service to maximise the potential for staff use on intercampus trips. 6.14 Members of staff travelling for work on the University Bus Service to/from Medway are encouraged to obtain the necessary ticket from their Faculty or Directorates prior to travel in preference to purchasing as individuals from ticket outlets10 and submitting an expense claim. Tickets are supplied by the Transport Department to Faculties and Directorates and recharged using the Finance inter-departmental recharge system. UNIVERSITY CAR 6.15 The university fleet car referred to previously in 2.3 is available to hire by members of staff for work related trips (excluding journeys solely between Avery Hill and Greenwich Campus) in preference to using a private car or hiring a car externally. The Transport Department must be contacted to make a
10Ticket Outlets: John Smith Campus Store (Greenwich Campus and Mansion Site, Avery Hill Campus); Le Café (Greenwich Campus), Village Shop (Southwood Site, Avery Hill Campus); The Engine Room (Mansion Site, Avery Hill Campus); GKU Reception (Pilkington Building, Medway Campus) and Essentials Shop (Jellicoe Building Medway Campus).

11
reservation and is responsible for the vehicle’s efficient and proper use. Usage costs (fuel and a contribution towards fixed costs) are recharged using the Finance inter-departmental recharge system. CAR CLUB VEHICLES 6.16 Car club vehicles can be hired by-the-hour from locations across London including outside the Greenwich Campus and in Eltham. They are not subject to a minimum time or distance although where the hire period exceeds five hours a normal hire car may be cost effective. Vehicles have modern engine technology and on average tend to emit less carbon per km than those privately owned. Their use is therefore encouraged. 6.17 The university has a business account with Zipcar, the UK’s largest car club operator. Before making a reservation staff must request access to the university account via a link to the supplier’s website from the Staff Portal ‘Travel & Transport Channel’. The account and related invoices are managed by the Transport Department and hire fees are recharged using the Finance inter-departmental recharge system. TRADITIONAL HIRE CARS 6.18 Traditional hire cars normally have good maintenance controls and are frequently renewed leading to lower carbon emissions than the average privately owned car. The university has several vehicle hire companies as approved suppliers11. Arrangements may be accessed by any Faculty or Directorate, details are on the Staff Portal ‘Travel & Transport Channel’. Members of staff on work related journeys exceeding 100 miles per return trip are encouraged to utilise a hire car as opposed to using their own vehicle. When a private car is used above 100 miles, travel will be reimbursed at a lower rate per mile. Vehicles must not be hired with engines larger than 1.4 Litres for petrol and 1.7 Litres for diesel unless there are three or more travellers and or a large amount of luggage.
6.19 The Financial Regulations allow hire cars to be used for shorter trips of fewer than 100 miles where one of the following applies:
There is no reasonable public transport alternative available
More than one member of staff is travelling and a saving would be made over the group cost of public transport
Heavy equipment or bulky items are being carried 6.20 Where the hire period does not exceed five hours, a car club vehicle should be used where possible as this will normally be cost effective. PRIVATE CAR USE 6.21 The university does not require any of its staff to own a car and will not supply staff with exclusive use of company cars.
11 See Procurement & Business Services ‘Car and Vehicle Hire Buying Guide’

12
6.22 Cars belonging to members of staff used for work related travel are referred to as the ‘grey fleet’. Most work related trips at the university involve private cars12 and over which the university has limited influence. Based on staff expense claims from 2012-13 the scale of private car use is thought to extend to around 700 members of staff. The University Bus Service, public transport, the university car, or external hire cars; will on average produce fewer overall emissions and are therefore encouraged in preference to private cars. Visitor Parking 6.23 Avery Hill: No reservations are required to visit Avery Hill Campus. Permits may be purchased from the Transport Department (via the Finance inter-departmental recharge system) where the host has an important guest and does not wish them to pay and display. 6.24 Greenwich: An online visitor parking reservation system operates at Greenwich Campus with fees payable for car park use13. Greenwich based departments must pay the fee on behalf of their visiting guests. Departments from other campuses must pay for their visiting staff. Fees are payable using the Finance inter-departmental recharge system. 6.25 Medway: An online visitor parking request system operates at Medway Campus with the objective of determining a visitor’s entitlement to park and allowing the normal parking charge to be paid using the Finance inter-departmental recharge system as described in 6.24 above. 6.26 Parking Fees: Where business journeys to other campuses are essential by car, staff may claim back any normal parking charges incurred as an expense. Members of staff however, who hold a Staff Season Ticket Permit (see 7.16), are exempt from the normal visitor parking charge at Avery Hill and Medway Campus. These permits will also exempt staff from the requirement to make a visitor request at Medway Campus. TAXI AND MINICABS 6.27 Taxi and minicabs have high costs per passenger km compared with most other forms of transport and ‘dead’ mileage is normally involved before and or after the trip. This makes taxi and minicabs inefficient even when compared to most private car use. If shared however, the carbon emissions per passenger can be considerably reduced. 6.28 The university has several taxi and minicab approved suppliers. These are detailed online in the Procurement & Business Services ‘Taxi/Minicab Services Buying Guide’. 6.29 Taxi and minicab use is restricted to the following circumstances:
Where passengers share as part of a group and the total cost is less than for public transport
Where there is a large amount of luggage involved and it is impractical to use public transport
Where there are genuine concerns over safety
Where there is an essential high priority business need and no practical alternative
12 Often referred to in industry circles as the ‘grey fleet’ 13 Visits after 5pm and at weekends do not incur a fee

13
BICYCLES AND MOTORCYCLES 6.30 Members of staff who use bicycles and or motorcycles for work related travel may claim expenses from the university at the maximum mileage rate allowed by HMRC. LONG DISTANCE AND OVERSEAS TRAVEL 6.31 Long distance business trips are generally considered not to be sustainable by virtue of the energy used to support time efficient travel over longer distances. The university therefore aims to manage these journeys to minimise the effect on the environment. Air Travel 6.32 Economy Class air travel contributes considerably less carbon per passenger km than Business Class due to the more efficient use of space. All air travel undertaken by staff on University business shall be at the economy class with upgrade to premium economy only where the journey is a long haul flight that exceeds 8 hours in duration and the member of staff making the journey is expected to begin working immediately on arrival. Business Class and First Class are not permitted for any flight. Rail Travel Long Distance 6.33 Air travel to cities in Europe that benefit from being connected to the Euro Star rail network should be avoided. High speed train services should be chosen instead. TRAVEL AGENTS 6.34 The university has several approved travel agents detailed online in the Procurement & Business Services ‘Travel Agency Services Buying Guide’. All long distance and overseas travel should be booked through these suppliers (any travel outside of London and the south east is classed as long distance for this purpose). The approved travel agents record all emissions data related to business travel. Air travel or rail journeys booked through other means do not have their emissions recorded and this compromises the university’s ability to accurately report emissions data to HESA.
TRAVEL CLAIMS MANAGEMENT 6.35 Clearer understanding of work related travel activity may lead to more efficient management and could therefore reduce carbon emissions and produce cost savings. It would be desirable for the university to introduce a central system for staff to record their work related travel with the objective of automating the collection of emissions data required by HEFCE. WORK RELATED TRAVEL INFORMATION 6.36 The Transport Department is responsible for disseminating transport and travel information at the university. The Staff Intranet / Portal ‘Travel & Transport Channel’ will be the primary source of publicising information to staff about work related travel. It will reference information from public transport providers and other useful external links.

14
7. COMMUTING OVERVIEW 7.1 Emissions from commuting to and from the university by members of staff and students contribute to the university’s Scope 3 emissions. These emissions are particularly difficult to calculate as commuting is unrecorded other than by periodic survey. From 2012-13 HEFCE expects universities to measure and report these emissions (see Appendix 3). 7.2 The means by which members of staff and students commute to university is a matter of personal choice, however HEFCE has indicated that carbon emission targets for Scope 3 (which includes commuting) are being developed and universities will be expected to influence commuting in favour of more sustainable travel modes. Measures for each mode are presented below in order of their contribution towards sustainability. WALKING 7.3 Walking has an important role to play in commuting for journeys up to around two miles. Journey times are very reliable and the exercise involved provides excellent health benefits. The Government Chief Medical Officer recommends just 30 minutes of moderate exercise five times per week. This is consistent with a brisk two mile walk to work. 7.4 To encourage walking the university will:
Provide information on its website regarding walking routes to campus
Use the Human Resources Directorate and Sports Office to promote and encourage walking along with the health and fitness benefits it provides
Work with local authorities to ensure popular routes in the vicinity of campus are well lit and maintained
Provide access to shower and locker facilities at each campus 7.5 When developing or acquiring student accommodation the university will seek to locate it close to teaching facilities enabling large numbers of journeys to take place on foot. CYCLING 7.6 The university will promote cycling to staff and students by providing the following facilities at each of its campuses:
Covered parking space for bikes sufficient for peak demand
Individual bicycle lockers at low cost to users or free to use secure compounds
Sufficient shower, changing and locker facilities
Essential emergency bike maintenance equipment at each Gatehouse
Subsidised bicycle hire at each campus (currently provided by Brompton Bike Hire Ltd14) 7.7 The university will pursue the following initiatives across the institution:
14 See University Portal ‘Travel & Transport Channel’ for detail

15
Provide cycling information and maps at various points on each campus and on the university portal and website
Participate in the Government ‘Cycle to Work’ scheme for staff (details on Staff Portal ‘Travel & Transport Channel’)
Facilitate staff and students to participate in cycle training courses
Facilitate a Bicycle User Group for staff and students to join via the Portal
Promote the health benefits of cycling
Work with local authorities to improve local cycle routes and signage PUBLIC TRANSPORT 7.8 The university will encourage use of public transport for commuting to campus by:
Using income from the car parks to subsidise student and staff travel on popular local bus services where this achieves value for money, in preference to operating the service itself
Using income from the car parks to operate a subsidised university operated bus service on popular routes to campus where value for money cannot be achieved through subsidising publically operated services
Providing public transport information on its Portal, website and notice boards
Providing interest-free loans to staff for the purchase of annual travel cards
Facilitating Student Oyster Card applications
Lobbying relevant authorities and operators to improve their services in respect of the university’s needs
Where appropriate support public transport services in partnership with other education establishments or large organisations to achieve viability and cost efficiency
MOTORCYCLES AND SCOOTERS 7.9 Motorcycles and scooters on average emit less carbon per passenger km than a car and occupy a fraction of the road space. The university will provide at each campus ample parking for motorcycles and scooters exempt from normal parking charges and with enhanced parking security. 7.10 The university will provide motorcyclists with access to lockers. CAR USE 7.11 Car use is considered to be the least sustainable form of commuting as on average it emits more carbon per passenger km than other transport modes. The university will therefore discourage it through various policies and initiatives. Car Share 7.12 For some journeys, particularly those covering rural areas, obtaining or offering a lift may be the only practical way of travelling more sustainably. The university will provide a car share scheme www.5HARE.co.uk to facilitate car share amongst its staff and students. Car share partners may also share an annual ‘season ticket’ parking permit (see 7.16 on next page) and thereby split the cost.

16
CAR PARKING 7.13 A study15 carried out by the Department for Transport concluded that when taking into account, management, lighting, maintenance and land costs; the cost to an organisation of providing a parking space was on average £400 per annum and thought to be much higher in London. Parking Charges 7.14 Where the university provides parking a charge will be payable in order to manage the volume of car use and avoid any unintended subsidy to motorists. The level of charge will vary between the three campuses, being highest at Greenwich and lowest at Medway. The charge levels take into account the supply of and demand for parking space along with the availability of public transport to the campus. Parking charges will be reviewed periodically in order that they remain effective in managing parking demand and to keep pace with car park running costs. Income from parking charges will be ring-fenced to support investment in sustainable travel and to pay for car park management. 7.15 Where parking space on-campus is insufficient to meet demand from staff and the university currently buys-in space from external providers, it will aim to gradually reduce the subsidy provided with an eventual goal of this facility becoming an individual rather than university responsibility. Permits 7.16 The parking scheme at each campus will differ along with the need to hold a parking permit. At Greenwich Campus permits are compulsory and restricted in number for staff only. At Medway Campus all staff and students must hold one of two permit types, either a ‘Season Ticket’ or ‘Pay-on-the-Day’, the latter requires the holder to purchase and display a ticket. At Avery Hill Campus permits are not required, although staff and student residents may choose to hold one as a cost effective and convenient alternative to pay and display. Electric Vehicles 7.17 Electrically powered vehicles can have very much lower carbon emissions than vehicles powered solely by petrol or diesel, especially in the case of full electric vehicles. To encourage early take-up of this technology the university will exempt vehicles registered as electric with DVLA from the normal parking charge. Subject to planning and other consents the university will provide a vehicle re-charge facility on each campus for electric vehicles. Private users will incur a small fee to cover the cost of their electricity consumption. Lower Emission Vehicles 7.18 In order to encourage use of lower emission cars members of staff who have vehicles with lower emission engines will qualify for a discount off the normal cost of a staff permit for parking on that campus. The emission bands and level of discount may be varied from time to time in order to keep pace with developments in engine technology. Blue Badge Scheme 7.19 The Local Authority Blue Badge scheme is recognised in all university car parks. Blue Badge holders are entitled to park in bays marked for disabled use. Staff and students who hold a Blue Badge are not required to pay for parking provided they have their badge verified by Estates and Facilities and are
15 Making travel plans work: lessons from UK case studies, Department for Transport, 2002

17
thereby issued a permit for display alongside their Blue Badge. Visitors with Blue Badges may also be granted free parking at the university’s discretion. ESTATES STRATEGY 7.20 The availability of public transport and walking options will be an important determinant in the location of any new university buildings with the objective of supporting sustainable commuting. TRAVEL INFORMATION 7.21 The Transport Department is responsible for disseminating transport and travel information at the university. The Staff Intranet and Staff and Student Portal will be the primary source of publicising information to staff and students about commuting. It will reference information from public transport providers and other useful external links. 7.22 Travel information on the university website is provided by the Marketing Department in conjunction with the Transport & Green Travel Manager and is aimed at prospective students and visitors. The Transport Department will monitor the content and ensure it cross references the internal pages where appropriate. 7.23 The Transport Department will provide up to date travel information at the campus bus stops. Where appropriate and practicable, travel information will be provided on student facing noticeboards in conjunction with the relevant university department(s).

18
8. EXTERNAL VISITORS 8.1 Visitors to the university will be encouraged to use sustainable transport. If driving is necessary, parking will be provided according to the normal parking terms for that campus. In the case of Avery Hill and Medway Campus VIP guests and or those who give their time freely to support the university may at the discretion of the host be exempted from the visitor parking charge and reserved a space if appropriate. This must be arranged in consultation with the Transport Department and funded by the inviting Faculty or Directorate.
9. SUPPLIERS AND DELIVERIES 9.1 Procured goods and services normally involve transport to deliver or carry out the service. Carbon emitted from this transport contributes to the university’s Scope 3 emissions. 9.2 The university will aim to reduce carbon associated with its suppliers and deliveries by:
Using local service suppliers e.g. the University’s Sustainable Food Policy requires this
Purchasing goods manufactured locally
Managing meetings with suppliers
Reviewing service levels 9.3 Applying these principles in awarding contracts or procuring large volumes of goods will form an important aspect of the University’s Sustainable Procurement Policy.
10. CONCLUSION This Travel Plan is designed not only to meet HEFCE and university targets but also to stimulate awareness of sustainable travel and how individual actions can help to reduce the impact of travel on the environment. It is acknowledged that some changes in travel behaviour are difficult to develop and take time to achieve. The Plan requires regular monitoring and will evolve as circumstances change. The Plan will be reviewed periodically and reports will be submitted annually to the Sustainability Management Board.

19
11. MONITORING 11.1 The travel plan is reviewed regularly and progress against the stated aims and targets have been recorded using Red, Amber, Green analysis below. This review is carried out annually at the Sustainability Management Board. Section 4: Targets
Ranked Comments
Reduce university vehicle fleet emissions 40% by 2020 (based on 2005 baseline)
Red Reduced 9% to 2014-15
Reduce business travel emissions 20% by 2020 (based on 2013 baseline)
Green Reduced 42% to 2014-15
Reduce staff and student commuting emissions 20% by 2020 (based on 2007 baseline)
Unreliable data
Staff increased 19% to 2014-15 Student reduced 78% to 2014-15
Section 5: University Vehicle Fleet
Fuel consumption monitoring
Green
Driver training
Amber All regular employed drivers trained but refresher training now due
Vehicle replacement programme
Red Four fleet vehicles >10 years
Adoption of electric vehicles
Amber No new electric vehicles since 2009
Section 6: Work Related Travel
Meeting Management e.g. car share, V/C, minimising travel
Insufficient Information
Travel expense scrutiny to ensure green travel used where feasible
Insufficient Information
Business travel – quality of information collected
Amber Public transport distance requested but not captured. Intercampus journeys not identified.
Avoiding car use
Red Anecdotally car travel still the predominant form of travel on business between campuses.
Use of Oyster / contactless in London
Amber Some journeys in London still via paper tickets
Use of university car
Amber Spare capacity available
Use of car club vehicles
Amber Arrangements in place but poor uptake
Avoiding use of private cars on business trips >100 miles
Insufficient Information
Use of hire cars up to 1.4L petrol 1.7L diesel
Insufficient Information
Visitor parking is recharged
Green
Minimising taxi and minicab use
Red Use remains static
Pay travel expenses at HMRC rates for cyclists and motorbike riders
Green

20
Minimising air travel
Amber Use has reduced since 2012-13
Use of high speed rail in preference to flying
Red Journeys still by air which could be by rail, reasons of cost?
Use of travel agents
Amber Flights and train journeys still being booked privately.
Centralised collation of travel data
Red Not in place and no agreement to have
Section 7: Commuting
Walking routes to campus on website
Amber Medway route from Gillingham station to add. Greenwich routes?
Initiatives to encourage walking
Amber Walk to Work Week and informal walking clubs at Greenwich and Avery Hill
Sufficient covered bike parking
Amber Greenwich main campus still under supplied.
Secure bike parking (lockers or compounds)
Amber Greenwich main campus and Avery Hill not in place.
Adequate shower and locker facilities for walkers, cyclists and motorbike riders
Green Still aim for greater supply of lockers Greenwich main campus and Medway
Emergency bicycle repair kit at each campus
Green At each Security Gatehouse
Subsidised bicycle hire at each campus
Green Via Brompton Bike Hire
Cycling Information at each campus
Green
Cycle to work scheme participation
Green
Cycle training courses
Amber Promoted each year, not Medway.
Bicycle User Group
Red Not currently used
Promote health benefits of cycling
Green
With local authorities to improve cycle routes
Green Examples at Avery Hill and Medway
Investing income from car parks in green travel initiatives
Green
Public transport info provided online
Green
Staff interest free loans for travel cards
Green
Facilitate student Oyster card applications
Green
Lobby local authorities/bus companies to improve bus routes
Green
Work with other organisations to improve public transport
Green Medway working well
Dedicated motorbike parking with enhanced security
Amber Greenwich and Medway could be improved.
Discourage car use Green Car park charges used to manage demand

21
Car use scheme
Amber Needs better promotion
Withdrawal of subsidy for parking permits
Red Greenwich off-campus permits still subsidised
Plug-in places for electric cars
Amber Greenwich Campus absent
Vehicle emission based staff car park permits
Green
Free parking for Blue Badge holders
Green
Invest in new estate close to good public transport
Green
Section 9: Suppliers and Deliveries
Use of local suppliers
Amber Good examples in catering
Purchasing manufactured goods locally
Insufficient Information
Possibly limited opportunities to adopt this
Managing meetings and service levels with suppliers to reduce travel
Insufficient Information
11.2 Travel surveys of staff and students are carried out to calculate the modal split and estimate associated carbon emissions. Staff travel surveys are due every two years and student travel surveys every three years. Results are used to populate the Scope 3 emissions figures in Appendix 3. The most recent surveys are linked here: Staff Travel Survey Student Travel Survey

22
Appendix 1: Baseline Scope 1 Carbon Emissions for University Vehicle Fleet (2005-06)
Scope 1 Carbon Emissions - 2005 Baseline Data
Fuel Purchases for University Vehicle Fleet 2005-06 (Litres)
Fuel Type Aug-05 Sep-05 Oct-05 Nov-05 Dec-05 Jan-06 Feb-06 Mar-06 Apr-06 May-06 Jun-06 Jul-06 TOTAL, ltr
Diesel 134 941 1,640 1,333 1,240 1,231 1,087 1,265 969 1,229 774 1,078 12,921
LPG 153 250 373 295 76 68 88 158 - - - - 1,462
Supernul - - 74 64 52 18 - 75 101 113 187 69 754
Unleaded 230 203 179 212 362 357 229 289 249 394 229 525 3,458
Total 18,595
Carbon Emissions (from above)
Fuel Type
Total litres
purchased CO2 per kg
Emissions
CO2 kg
Diesel 12,921 2.672 34,525
LPG 1,462 1.470 2,149
Petrol 4,212 2.322 9,780
Total 18,595 46,454
Produced from fuel card invoice data.
Collated by V.Sezko 2014.
Appendix 2: Baseline Scope 3 Carbon Emissions from Business Travel (2012-13)
Scope 3 Business Travel Emissions 2012-13
Travel Activity Emissions CO2e (kg)
Hire Cars 11,683
Ad hoc leased buses/coaches 10,792
Leased vans (bought in transport) 887
Grey Fleet 134,774
Bus & Rail (UK) 0
Rail (UK) 36,975
Bus (UK) 9,800
Taxi (UK) 13,759
Bus & Rail (overseas) 0
Rail (overseas) 7,573
Bus (overseas) 2,873
Taxi (overseas) 8,044
Air Travel 4,835,794
Air Travel (NRI) 209,435
Rail (NRI) overseas 1,543
Bus (NRI overseas 585
Taxi (NRI) overseas 5,040
Ferry Travel 3,795
University Bus Service 165,891
Total 5,459,243

23
Appendix 3a: Baseline Scope 3 Carbon Emissions from Student Commuting (2007-08)
Scope 3 Emissions from Student Commuting 2007-2008
Avery Hill FTE 7832
Mode Participation Journeys pa Total km Emissions, kg CO2
Car 45% 317,196 10,321,558 2,162,366
Car share lift 3% 21,146 688,104 -
Motorbike 0% - - -
Bus 23% 162,122 5,275,463 470,044
Train 12% 84,586 2,752,415 165,695
DLR/Tube 4% 28,195 917,472 48,259
Cycle 3% 21,146 688,104 -
Walk 10% 70,488 2,293,680 -
TOTAL 100% 704,880 22,936,795 2,846,365
Greenwich FTE 7902
Mode Participation Journeys pa Total km Emissions, kg CO2
Car 16% 113,789 3,702,688 775,713
Car share lift 1% 7,112 231,418 -
Motorbike 0% - - -
Bus 28% 199,130 6,479,703 577,342
Train 17% 120,901 3,934,106 236,833
DLR/Tube 28% 199,130 6,479,703 340,832
Cycle 1% 7,112 231,418 -
Walk 9% 64,006 2,082,762 -
TOTAL 100% 711,180 23,141,797 1,930,720
Medway FTE 3000
Mode Participation Journeys pa Total km Emissions,kg CO2
Car 32% 86,400 2,811,456 589,000
Car share lift 3% 8,100 263,574 -
Motorbike 0% - - -
Bus 37% 99,900 3,250,746 289,641
Train 12% 32,400 1,054,296 63,469
DLR/Tube 4% 10,800 351,432 18,485
Cycle 2% 5,400 175,716 -
Walk 10% 27,000 878,580 -
TOTAL 100% 270,000 8,785,800 960,595
GRAND TOTAL 5,737,680
Based on 2012-13 EMR analysis assumptions:
Assumed average student commuting days p.a. 90 days
Average journey length per day 32.54 km
Conversion Factors 2007 (emissions kg of CO2 per km)
Mode kg CO2 per km
Car 0.2095
Car share lift 0
Motorbike 0.1067
Bus 0.0891
Train 0.0602
DLR/Tube 0.0526

24
Appendix 3b: Baseline Scope 3 Carbon Emissions from Staff Commuting (2007-08)
Scope 3 Emissions from Staff Commuting 2007-2008
Staff FTE: 1584
Mode Overall Journeys pa Total km Emissions,kg CO2
Car 59% 163,548 5,020,924 1,051,883
Car share lift 2% 5,544 170,201 -
Motorbike 1% 2,772 85,100 9,080
Bus 8% 22,176 680,803 60,660
Train 12% 33,264 1,021,205 61,477
DLR/Tube 6% 16,632 510,602 26,858
Cycle 5% 13,860 425,502 -
Walk 7% 19,404 595,703 -
TOTAL 100% 277,200 8,510,040 1,209,957
Notes:
Assumed average staff commuting days p.a. 175 days
Average journey length per day 30.7 km
Conversion Factors 2007 (emissions kg of CO2 per km)
Mode kg CO2 per km
Car 0.2095
Car share lift 0
Motorbike 0.1067
Bus 0.0891
Train 0.0602
DLR/Tube 0.0526
Note: The data in this Appendix 2 includes assumptions about journey length and frequency. These assumptions have a substantial impact on the total estimated emissions (in addition to the choice of travel mode and its associated average emissions). Future surveys will place a greater emphasis on data relating to journey length and frequency.
25
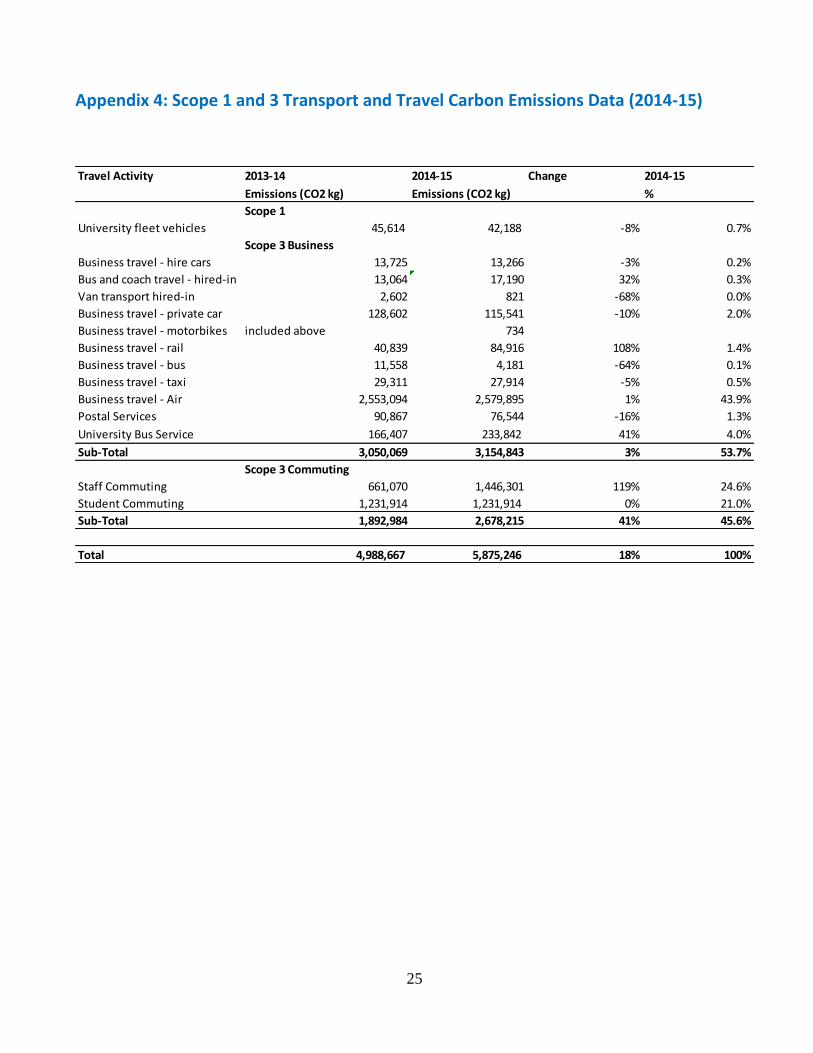
Appendix 4: Scope 1 and 3 Transport and Travel Carbon Emissions Data (2014-15)
Travel Activity 2013-14 2014-15 Change 2014-15
Emissions (CO2 kg) Emissions (CO2 kg) %
Scope 1
University fleet vehicles 45,614 42,188 -8% 0.7%
Scope 3 Business
Business travel - hire cars 13,725 13,266 -3% 0.2%
Bus and coach travel - hired-in 13,064 17,190 32% 0.3%
Van transport hired-in 2,602 821 -68% 0.0%
Business travel - private car 128,602 115,541 -10% 2.0%
Business travel - motorbikes included above 734
Business travel - rail 40,839 84,916 108% 1.4%
Business travel - bus 11,558 4,181 -64% 0.1%
Business travel - taxi 29,311 27,914 -5% 0.5%
Business travel - Air 2,553,094 2,579,895 1% 43.9%
Postal Services 90,867 76,544 -16% 1.3%
University Bus Service 166,407 233,842 41% 4.0%
Sub-Total 3,050,069 3,154,843 3% 53.7%
Scope 3 Commuting
Staff Commuting 661,070 1,446,301 119% 24.6%
Student Commuting 1,231,914 1,231,914 0% 21.0%
Sub-Total 1,892,984 2,678,215 41% 45.6%
Total 4,988,667 5,875,246 18% 100%

26
Appendix 5: Business Travel Reimbursement Rates Private cars: 40p per mile for the first 100 miles per return trip, 12p thereafter -Car Share: (an extra 5p per mile for each passenger carried) Bicycles: 20p per mile Motorcycles / scooters: 24p per mile Public transport: Reimbursed to the value of receipt or at the Oyster fare in Greater London The matrix below shows the sum paid on intercampus return journeys for single occupancy car travel (at 40p per mile). Single trips are paid at half the stated sum. Inter-Campus Business Mileage Cost Reimbursement Matrix
Avery Hill Greenwich Medway Woolwich
Avery Hill
£4.80 £18.80 £3.20
Greenwich
£4.80 £24.40 £3.20
Medway
£18.80 £24.40 £22.00
Woolwich
£3.20 £3.20 £22.00
Ends


