water Article Unraveling Flooding Dynamics and Nutrients’ Controls upon Phytoplankton Functional Dynamics in Amazonian Floodplain Lakes Cleber Nunes Kraus 1,2, * , Marie-Paule Bonnet 2,3 , Ina de Souza Nogueira 4 , Maria Tereza Morais Pereira Souza Lobo 4 , David da Motta Marques 5 ,Jérémie Garnier 2 and Ludgero Cardoso Galli Vieira 1 1 Environmental Science Post Graduate Program, Universidade de Brasília (UnB), Campus FUP-Planaltina, área Universitária 1, Vila Nossa Senhora de Fátima, CEP 73.340-710 Planaltina, Brazil; [email protected]2 Joint International Laboratory LMI OCE “Observatory of Environmental Change”, UnB/IRD, Instituto de Geociências, Universidade de Brasília (UnB), Campus Universtitário Darcy Ribeiro, ICC-Ala Central, Caixa posta 04465, CEP 70919-970, Brasilia, Brazil; [email protected] (M.-P.B.); [email protected] (J.G.) 3 UMR 228 Espace-DEV, Institut de Recherche pour le Développement (IRD), 13001 Marseille, France 4 Environmental Science Post Graduate Program, Universidade Federal de Goiás (UFG), 74690-900 Goiania, Brazil; [email protected] (I.d.S.N.); [email protected] (M.T.M.P.S.L.) 5 Institute of Hydraulic Research (IPH), Universidade Federal do Rio Grande do Sul (UFRGS), 90040-060 Porto Alegre, Brazil; [email protected]* Correspondence: [email protected]; Tel.: +55-24-98803-6467 Received: 2 November 2018; Accepted: 25 December 2018; Published: 16 January 2019 Abstract: The processes in tropical floodplain lakes enable maintaining phytoplankton nutrient requirements over a hydrological year. The nutrients such as nitrogen, phosphorus and carbon compounds play an essential role in phytoplankton growth. However, the way that nutrients and phytoplankton interact and how this relationship varies seasonally in tropical freshwater ecosystems is not clear. In this study, we evaluate the relationship between phytoplankton–nutrients over the hydrological cycle in Amazonian floodplain lakes and verify if this relationship influences the biomass of cyanobacteria. We also check what factors linked to nutrients act in structuring phytoplankton community. Using the phytoplankton functional approach, we verified how their ability to respond to hydrological and environmental variations reflects the ecological conditions and investigated how these interactions work. The results show that the Amazonian floodplain lakes could maintain long-term nutrient enrichment status. The nutrients input conduces to cyanobacteria dominance, that allied to other factors, play an essential role in supporting the stability of the phytoplankton–nutrients relationship over the hydrological cycle. Keywords: nutrient enrichment; floodplain dynamics; phytoplankton ecology; hydrological process 1. Introduction Nutrients are factors that may limiting the primary productivity of the phytoplankton community [1–3], and affect the efficiency in food chain ecological transfers [4]. Due to its low concentration in relatively pristine freshwater environments [5], phosphorus (P) in its bioavailable form for autotrophic organisms (orthophosphate) has long been considered as the main limiting factor for primary production [6]. Moreover, although Nitrogen (N) is also relatively rare, primary production requirement could be partly satisfied through atmospheric fixation, a capacity shared by some cyanobacteria genera [7]. However, at the ecosystem level, N 2 fixation serves only a fraction Water 2019, 11, 154; doi:10.3390/w11010154 www.mdpi.com/journal/water
Transcript
water
Article
Unraveling Flooding Dynamics and NutrientsrsquoControls upon Phytoplankton Functional Dynamicsin Amazonian Floodplain Lakes
Cleber Nunes Kraus 12 Marie-Paule Bonnet 23 Ina de Souza Nogueira 4Maria Tereza Morais Pereira Souza Lobo 4 David da Motta Marques 5 Jeacutereacutemie Garnier 2 andLudgero Cardoso Galli Vieira 1
1 Environmental Science Post Graduate Program Universidade de Brasiacutelia (UnB) Campus FUP-Planaltinaaacuterea Universitaacuteria 1 Vila Nossa Senhora de Faacutetima CEP 73340-710 Planaltina Brazil ludgerounbbr
2 Joint International Laboratory LMI OCE ldquoObservatory of Environmental Changerdquo UnBIRDInstituto de Geociecircncias Universidade de Brasiacutelia (UnB) Campus Universtitaacuterio Darcy RibeiroICC-Ala Central Caixa posta 04465 CEP 70919-970 Brasilia Brazil marie-paulebonnetirdfr (M-PB)garnierunbbr (JG)
3 UMR 228 Espace-DEV Institut de Recherche pour le Deacuteveloppement (IRD) 13001 Marseille France4 Environmental Science Post Graduate Program Universidade Federal de Goiaacutes (UFG) 74690-900 Goiania
Brazil inanogueiragmailcom (IdSN) mariatereza_loboyahoocombr (MTMPSL)5 Institute of Hydraulic Research (IPH) Universidade Federal do Rio Grande do Sul (UFRGS)
90040-060 Porto Alegre Brazil dmmiphufrgsbr Correspondence binhokrausgmailcom Tel +55-24-98803-6467
Received 2 November 2018 Accepted 25 December 2018 Published 16 January 2019
Abstract The processes in tropical floodplain lakes enable maintaining phytoplankton nutrientrequirements over a hydrological year The nutrients such as nitrogen phosphorus and carboncompounds play an essential role in phytoplankton growth However the way that nutrients andphytoplankton interact and how this relationship varies seasonally in tropical freshwater ecosystemsis not clear In this study we evaluate the relationship between phytoplanktonndashnutrients over thehydrological cycle in Amazonian floodplain lakes and verify if this relationship influences the biomassof cyanobacteria We also check what factors linked to nutrients act in structuring phytoplanktoncommunity Using the phytoplankton functional approach we verified how their ability to respondto hydrological and environmental variations reflects the ecological conditions and investigatedhow these interactions work The results show that the Amazonian floodplain lakes could maintainlong-term nutrient enrichment status The nutrients input conduces to cyanobacteria dominance thatallied to other factors play an essential role in supporting the stability of the phytoplanktonndashnutrientsrelationship over the hydrological cycle
Keywords nutrient enrichment floodplain dynamics phytoplankton ecology hydrological process
1 Introduction
Nutrients are factors that may limiting the primary productivity of the phytoplanktoncommunity [1ndash3] and affect the efficiency in food chain ecological transfers [4] Due to its lowconcentration in relatively pristine freshwater environments [5] phosphorus (P) in its bioavailableform for autotrophic organisms (orthophosphate) has long been considered as the main limitingfactor for primary production [6] Moreover although Nitrogen (N) is also relatively rare primaryproduction requirement could be partly satisfied through atmospheric fixation a capacity shared bysome cyanobacteria genera [7] However at the ecosystem level N2 fixation serves only a fraction
Water 2019 11 154 doi103390w11010154 wwwmdpicomjournalwater
Water 2019 11 154 2 of 17
of primary and secondary production demands [89] Furthermore current research showed thatnitrogen and phosphorus enrichment produces a positive synergistic response in environments [10]Disentangling what nutrient (P or N) is the most significant for primary production is stronglydependent on the environmental conditions and biological characteristics (especially related tophytoplankton community) prevailing in the considered aquatic ecosystem [671112]
Moreover the relationship between nutrient concentrations and phytoplankton is problematicsince nutrients can be blocked in phytoplankton cells in different ways In addition to the abilityof some genera of cyanobacteria that can fix atmospheric nitrogen [2612] other genera may alsostore phosphorus [13] and the settled phytoplankton can stimulate mineralization at the sedimentsurface and consequently nutrient release to the water column [1415] The carbon available in theenvironment also plays an essential factor in the aquatic ecosystem and influences the phytoplanktoncommunity at the same time that can have their cycle influenced by this community [16ndash18] Thuseven though the loading and concentrations of nutrients have a strong influence on the phytoplanktoncommunity their relationship may be in part consequential rather than causative
Regardless of cause and effect what is known is that nutrient enrichment in the aquatic environmentsleads to the eutrophication process which may cause cyanobacteria bloom that represents risks due to thepotential release of toxins as evidenced by several studies [19ndash23] The phytoplankton community havediverse responses to varying nutrient enrichments [182024] and should not be treated as a single groupwhen considering the effects of nutrient loading on community structure [25] The use of the functionalgroups approach may improve the understanding and the prediction of phytoplankton communityresponses to environmental changes [2627] It is expected that species of the same functional groupchange their biomass in response to environmental conditions making it possible to predict thedynamics of natural phytoplankton populations [28] The functional classification of Reynolds et al [29]updated by Padisaacutek et al [30] comprises 40 functional groups whose share ecological affinitiestolerances and sensitivities to different environmental conditions This classification has been testedsuccessfully in a variety of aquatic systems and is one of the most validated phytoplankton functionalclassifications [2731ndash33] Indeed these approaches allow the assessment of biological responses toenvironmental conditions where the species of different taxonomic groups can share the same ecologicalcharacteristics [29303435] It is worth mentioning that the nutrientsndashphytoplankton relationship isexpected to vary with time It is even more true for aquatic systems such as the Amazon floodplainssubmitted to highly variable hydrological conditions throughout the hydrological year
The annual hydrological variation known as flood pulse [3637] drives the Amazonian floodplainsproduction and diversity throughout different hydrological phases with different characteristics [3839]This monomodal variation promotes water oxygenation brings nutrients into these areas leading topeaks in primary productivity [4041] The autogenic organic material is partly locally degraded [42]In addition the hydrological variation tends to be more effective than spatial variation in structuringenvironmental and biological conditions in tropical floodplain systems [43ndash46] Here we aimed tostudy the relationship between the phytoplankton community structure and variations in nutrients onAmazonian floodplains a topic which has been addressed only a little in the literature Our workinghypothesis is that the annual hydrological variation is more effective in producing changes onphytoplankton community than the spatial variation of environmental conditions and these changes arerelated to variation in different kinds of nutrients over the hydrological cycle Hence we evaluated (i) ifchanges in hydrological conditions are more important than nutrients in structuring the phytoplanktoncommunity (ii) the importance of different kinds of nutrients in the structure of the phytoplanktoncommunity (functional groups) (iii) how it changes on the relationship driving the phytoplankton overthe hydrological cycle and (iv) if these relationships have an influence on the cyanobacteria biomass
2 Materials and Methods
The study site is the Curuai floodplain a large system composed of several temporallyinterconnected lakes located along the Amazon River (Figure 1) Several channels link the lakersquos
Water 2019 11 154 3 of 17
system with the mainstem but only the easternmost channel remains permanently connected [39]Waters from the Amazon River local drainage basin seepage and local precipitation seasonally floodthe system leading to an important seasonal water level variation (in average around 6 m) The largeamplitude of water level combined with flat relief induces a substantial difference of flood extentbetween low- and high-water periods [39] The river water rich in inorganic suspended material andnutrients [47ndash49] contrasts with the water quality of the other water sources that are poor in nutrientsand rich in dissolved organic matter [4150] We collected samples during two consecutive yearsspreading over four hydrological periods 2013 rising (RS) and flushing (FL) (March and Septemberrespectively) and 2014 high-waters (HW) and low-waters (LW) (July and November respectively)with 23 stations in each period
Water 2018 10 x FOR PEER REVIEW 3 of 16
system with the mainstem but only the easternmost channel remains permanently connected [39] Waters from the Amazon River local drainage basin seepage and local precipitation seasonally flood the system leading to an important seasonal water level variation (in average around 6 m) The large amplitude of water level combined with flat relief induces a substantial difference of flood extent between low- and high-water periods [39] The river water rich in inorganic suspended material and nutrients [47ndash49] contrasts with the water quality of the other water sources that are poor in nutrients and rich in dissolved organic matter [4150] We collected samples during two consecutive years spreading over four hydrological periods 2013 rising (RS) and flushing (FL) (March and September respectively) and 2014 high-waters (HW) and low-waters (LW) (July and November respectively) with 23 stations in each period
Figure 1 Map of study area Curuai floodplain basin with lakes sites of sampling units flooded area and permanent waters over hydrological periods
21 Environmental and Phytoplankton Data
Sub-surface water samples for nutrients and carbon analyses were collected at the same locations where phytoplankton was collected (Figure 1) Additionally at these locations depth (Dep) was recorded and dissolved oxygen (DO) oxygen saturation (O2Sat) and electrical conductivity (Cond) were measured with a multi-parameter probe (YSI 6820-V2) Total phosphorus (TP) orthophosphate (PO4) hydrolyzable reactive phosphorus (HdrP) and organic phosphorus (OP) were quantified following the methods of [51] Total nitrogen (TN) dissolved nitrogen (DIN) ammonium (NH4) nitrate (NO3) and nitrite (NO2) were analyzed with the non-dispersive infra-red (NDIR) Total organic carbon (TOC) dissolved organic carbon (DOC) particulate organic carbon (POC) total suspended solids (TSS) fixed suspended solids (FSS) and volatile suspended solids (VSS) were measured following procedures in the Standard Methods for the Examination of Water and Wastewater [52]
The quantitative samples of phytoplankton were collected and were stored in 100 mL amber vials and fixed with acetic Lugol solution Phytoplankton was counted following the Utermoumlhl method [53] at 400times magnification The counting was done randomly until obtaining 100 individuals
Figure 1 Map of study area Curuai floodplain basin with lakes sites of sampling units flooded areaand permanent waters over hydrological periods
21 Environmental and Phytoplankton Data
Sub-surface water samples for nutrients and carbon analyses were collected at the same locationswhere phytoplankton was collected (Figure 1) Additionally at these locations depth (Dep) wasrecorded and dissolved oxygen (DO) oxygen saturation (O2Sat) and electrical conductivity (Cond)were measured with a multi-parameter probe (YSI 6820-V2) Total phosphorus (TP) orthophosphate(PO4) hydrolyzable reactive phosphorus (HdrP) and organic phosphorus (OP) were quantifiedfollowing the methods of [51] Total nitrogen (TN) dissolved nitrogen (DIN) ammonium (NH4) nitrate(NO3) and nitrite (NO2) were analyzed with the non-dispersive infra-red (NDIR) Total organic carbon(TOC) dissolved organic carbon (DOC) particulate organic carbon (POC) total suspended solids(TSS) fixed suspended solids (FSS) and volatile suspended solids (VSS) were measured followingprocedures in the Standard Methods for the Examination of Water and Wastewater [52]
Water 2019 11 154 4 of 17
The quantitative samples of phytoplankton were collected and were stored in 100 mL ambervials and fixed with acetic Lugol solution Phytoplankton was counted following the Utermoumlhlmethod [53] at 400times magnification The counting was done randomly until obtaining 100 individuals(cells colonies or filaments) of the most frequent species keeping the error less than 20 with aconfidence coefficient of 95 [54] The adopted system for classifying phytoplankton was that of Guiryand Guiry [55] The algal biovolume was calculated by multiplying the abundance of each species bythe mean cell volume [56] based on the measurement of at least 30 individuals and was expressed inmm3 Lminus1 This biovolume was used to select the phytoplankton functional groups (FGs) FGs wereclassified according to Reynolds [29] with the modifications made by Padisaacutek [30] The FGsrsquo specificbiomass was estimated from the product of the population and mean unit volume and only speciesthat contributed with at least 5 of the total biovolume per sample unit were considered [57]
22 Data Analysis
The space-time interaction test (STI) [58] was used to verify how significant the variation in timeand in space of the structure of the phytoplankton community was It is worth mentioning that in ourstudy time variation is primary linked with hydrology cycling whereas spatial variation would alsobe related to processes that have taken place in the different locations of the floodplain The STI testconsisted of a two-way ANOVA to test the space-time interaction and the main effects of space ortime using one among a set of possible models [58] Firstly space and time were coded using Helmertcontrasts for the main factor effects Then they were coded using distance-based Moran EigenvectorMaps variables (dbMEM) for the interaction term If the interaction was not significant the test ofthe main factors was also done following the method for the previous step If the interaction wassignificant then we tested spatial and temporal structures using dbMEM variables to know whetherseparate spatial or temporal structures exist For more details consult [58] These analyses wereimplemented using the R packages ldquoadespatialrdquo
To evaluate the importance of nutrients in the structure of the phytoplankton community we dividedthe environmental variables into two subgroups one with the variables related to the nutrients (nitrogenphosphorus carbon and oxygen) and another group with the other variables to which we refer to ashydrological variables These two groups were used to perform a partial redundancy analysis [59]This analysis allowed us to estimate the importance and influence of different environmental variablespartitions (ie nutrients and hydrological) in the structure of the phytoplankton community To test thesignificance of each partition we performed an ANOVA test These analyses were implemented using theR packages ldquoveganrdquo [60]
We performed an analysis of the organization of three-way tables with Co-Inertia analysisrsquo(STATICO) to evaluate the relationships between the phytoplankton biomass and nutrients With thismethod we calculated the stable part of the relationships between nutrients and phytoplanktonthroughout the hydrological periods STATICO combines two analyses the STATIS that is finding thestable part of the structure in a series of tables and the co-inertia that consists in finding the commonstructure in two data tables [61] The STATICO maximizes the covariance between the row coordinatesof two tables The pair of tables here consist of one for the phytoplankton biomass and one for thenutrient conditions This analysis had three-steps (i) Each table was analyzed with a primary analysisso (ii) each pair was linked by co-inertia analysis that produces a cross table then (iii) the partial triadicanalysis (PTA) was used to analyze the series of cross tables [62] We evaluated four pairs of tablesRising (RS) flushing (FL) high-water (HW) and low-water (LW) With the interstructure we evaluatedthe variation of the phytoplanktonndashnutrients relationship Hence it is possible to quantify the strengthof the phytoplanknton biomassndashnutrients relationship over the hydrological periods The compromisedetermines the part of the structure between phytoplankton biomass and the nutrients that remainstable throughout the hydrological periods These analyses were implemented using the R packagesldquoade4rdquo [61]
Water 2019 11 154 5 of 17
We used a forward selection procedure [63] to keep only the environmental variables thatsignificantly influence the phytoplankton community structure This procedure consists of a globaltest using all possible explanatory variables Then if and only if the global test was significant onecan proceed with the forward selection The procedure has two stopping criteria and when a variablethat brings one or the other criterion over the fixed threshold is identified that variable is rejected andthe procedure is stopped For more details consults [63] With the selected variables we performed aMultiple Regression Tree [64] to evaluate if the relationship between phytoplankton and the selectedenvironmental variables were an important factor in structuring the community The MultipleRegression Tree (MRT) consists of a constrained partitioning of the data parallel cross-validationof the results that produce a model that forms a decision tree [65] This method forms clusters of sitesby repeating splitting of the data along axes of the explanatory variables Each split was chosen tominimize the dissimilarity of data within the clusters [6466] that were presented graphically by a treeThe overall fit of the tree was specified as adjusted R2 (adjR2) and the predictive accuracy was assessedby cross-validated relative error (CVRE) [66] The MRT was implemented using the R packagesldquomvpartrdquo [67] and ldquoMVPARTwraprdquo [68] We also performed an Indicator Species Analysis (Ind-Val) tofind a statistically significant phytoplankton functional group for each data split and groups resultingfrom MRT [69] The method combines FG mean abundance (ldquospecificityrdquo) and frequency of occurrence(ldquofidelityrdquo) FGs that are both abundant and occur in most of the hydrological periods belongingto one MRT group have a high Ind-Val Ind-Val ranges between 0 to 1 where 1 refers to a perfectindicator regarding both ldquospecificityrdquo and ldquofidelityrdquo We applied the Ind-Val to groups obtained withthe MRT analysis using the R package ldquoMVPARTwraprdquo
3 Results
31 Hydrological and Nutrients Data
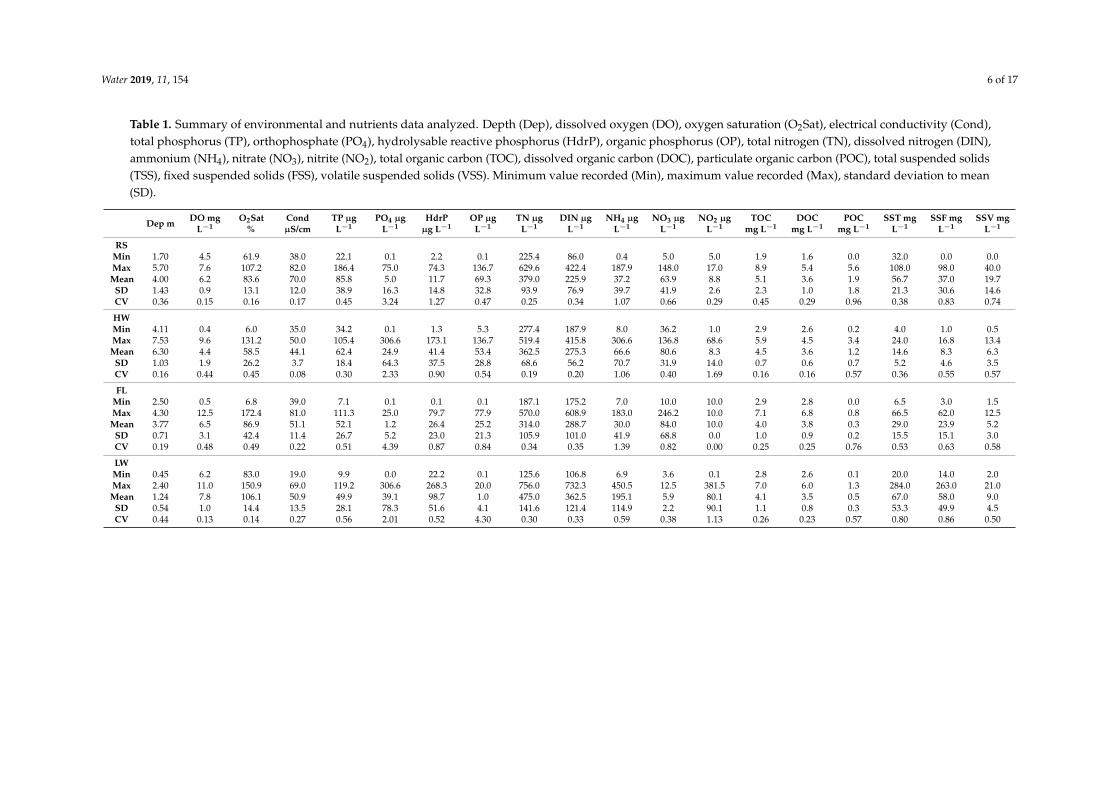
Depth conductivity and suspended solids presented contrasted mean values in function of thehydrological periods (Table 1) Depth was comparable between FL and RS it was three time higherduring HW than during LW Conductivity was comparable between FL and LW periods but was 60higher during FL than during HW Suspended solids (TSS and FSS) were minimum during HW andmaximum during LW
The total nitrogen mean value (TN) was maximum during LW about one third greater thanduring FL when it was minimum On the other hand if total inorganic nitrogen (DIN) was alsomaximum during LW it was minimum during the RS The main form of inorganic nitrogen was NO3
except during LW when NH4 was more than half DIN NO2 remained low below 10 microg Lminus1 exceptduring LW when it reached up to 80 microg Lminus1 while NO3 is very low Total organic carbon (TOC) wasmaximum during RS and minimum during LW with a mean value ranging between 4 and 55 mg Lminus1The dissolved fraction (DOC) represented up to 93 of TOC during FL and 65 during RS Duringthe rising and flushing periods PO4 only represents a small part of total phosphorus respectively 6and 2 During the high- and low-water periods it represents 40 and 78 respectively The watercolumn remained oxygenated with saturation above 58 regardless of the hydrological period
Water 2019 11 154 6 of 17
Table 1 Summary of environmental and nutrients data analyzed Depth (Dep) dissolved oxygen (DO) oxygen saturation (O2Sat) electrical conductivity (Cond)total phosphorus (TP) orthophosphate (PO4) hydrolysable reactive phosphorus (HdrP) organic phosphorus (OP) total nitrogen (TN) dissolved nitrogen (DIN)ammonium (NH4) nitrate (NO3) nitrite (NO2) total organic carbon (TOC) dissolved organic carbon (DOC) particulate organic carbon (POC) total suspended solids(TSS) fixed suspended solids (FSS) volatile suspended solids (VSS) Minimum value recorded (Min) maximum value recorded (Max) standard deviation to mean(SD)
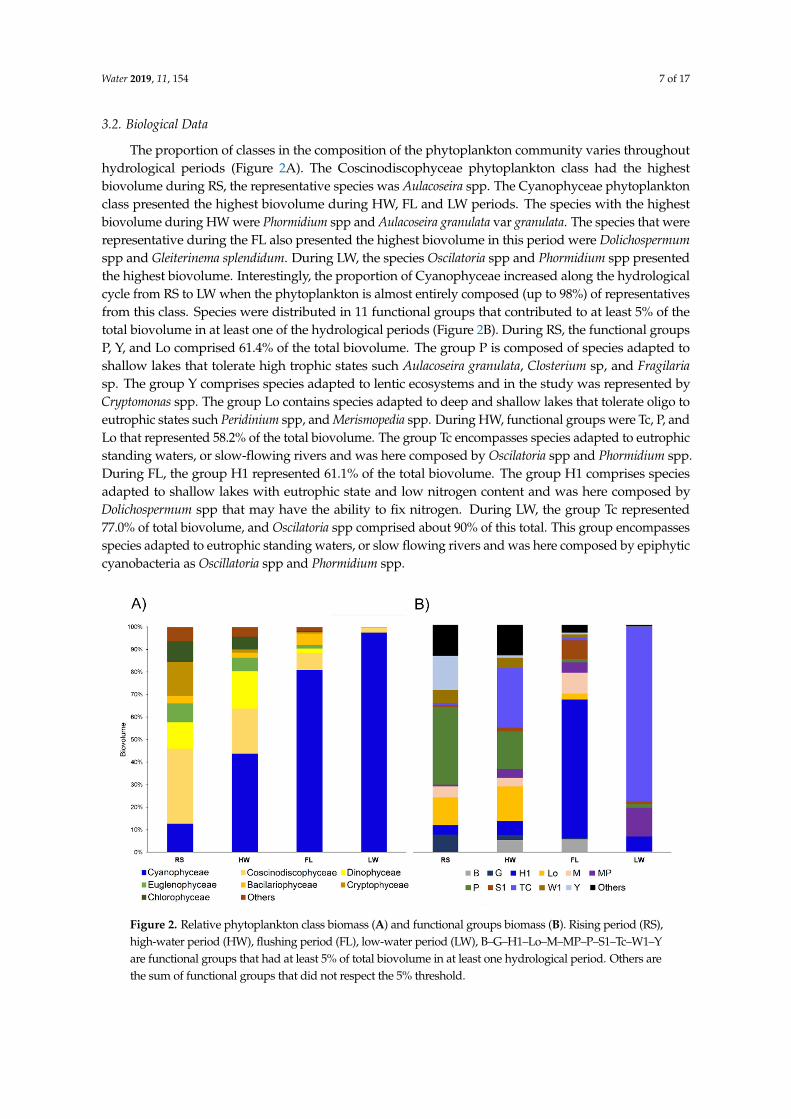
The proportion of classes in the composition of the phytoplankton community varies throughouthydrological periods (Figure 2A) The Coscinodiscophyceae phytoplankton class had the highestbiovolume during RS the representative species was Aulacoseira spp The Cyanophyceae phytoplanktonclass presented the highest biovolume during HW FL and LW periods The species with the highestbiovolume during HW were Phormidium spp and Aulacoseira granulata var granulata The species that wererepresentative during the FL also presented the highest biovolume in this period were Dolichospermumspp and Gleiterinema splendidum During LW the species Oscilatoria spp and Phormidium spp presentedthe highest biovolume Interestingly the proportion of Cyanophyceae increased along the hydrologicalcycle from RS to LW when the phytoplankton is almost entirely composed (up to 98) of representativesfrom this class Species were distributed in 11 functional groups that contributed to at least 5 of thetotal biovolume in at least one of the hydrological periods (Figure 2B) During RS the functional groupsP Y and Lo comprised 614 of the total biovolume The group P is composed of species adapted toshallow lakes that tolerate high trophic states such Aulacoseira granulata Closterium sp and Fragilariasp The group Y comprises species adapted to lentic ecosystems and in the study was represented byCryptomonas spp The group Lo contains species adapted to deep and shallow lakes that tolerate oligo toeutrophic states such Peridinium spp and Merismopedia spp During HW functional groups were Tc P andLo that represented 582 of the total biovolume The group Tc encompasses species adapted to eutrophicstanding waters or slow-flowing rivers and was here composed by Oscilatoria spp and Phormidium sppDuring FL the group H1 represented 611 of the total biovolume The group H1 comprises speciesadapted to shallow lakes with eutrophic state and low nitrogen content and was here composed byDolichospermum spp that may have the ability to fix nitrogen During LW the group Tc represented770 of total biovolume and Oscilatoria spp comprised about 90 of this total This group encompassesspecies adapted to eutrophic standing waters or slow flowing rivers and was here composed by epiphyticcyanobacteria as Oscillatoria spp and Phormidium spp
Water 2018 10 x FOR PEER REVIEW 7 of 16
32 Biological Data
The proportion of classes in the composition of the phytoplankton community varies throughout hydrological periods (Figure 2A) The Coscinodiscophyceae phytoplankton class had the highest biovolume during RS the representative species was Aulacoseira spp The Cyanophyceae phytoplankton class presented the highest biovolume during HW FL and LW periods The species with the highest biovolume during HW were Phormidium spp and Aulacoseira granulata var granulata The species that were representative during the FL also presented the highest biovolume in this period were Dolichospermum spp and Gleiterinema splendidum During LW the species Oscilatoria spp and Phormidium spp presented the highest biovolume Interestingly the proportion of Cyanophyceae increased along the hydrological cycle from RS to LW when the phytoplankton is almost entirely composed (up to 98) of representatives from this class Species were distributed in 11 functional groups that contributed to at least 5 of the total biovolume in at least one of the hydrological periods (Figure 2B) During RS the functional groups P Y and Lo comprised 614 of the total biovolume The group P is composed of species adapted to shallow lakes that tolerate high trophic states such Aulacoseira granulata Closterium sp and Fragilaria sp The group Y comprises species adapted to lentic ecosystems and in the study was represented by Cryptomonas spp The group Lo contains species adapted to deep and shallow lakes that tolerate oligo to eutrophic states such Peridinium spp and Merismopedia spp During HW functional groups were Tc P and Lo that represented 582 of the total biovolume The group Tc encompasses species adapted to eutrophic standing waters or slow-flowing rivers and was here composed by Oscilatoria spp and Phormidium spp During FL the group H1 represented 611 of the total biovolume The group H1 comprises species adapted to shallow lakes with eutrophic state and low nitrogen content and was here composed by Dolichospermum spp that may have the ability to fix nitrogen During LW the group Tc represented 770 of total biovolume and Oscilatoria spp comprised about 90 of this total This group encompasses species adapted to eutrophic standing waters or slow flowing rivers and was here composed by epiphytic cyanobacteria as Oscillatoria spp and Phormidium spp
Figure 2 Relative phytoplankton class biomass (A) and functional groups biomass (B) Rising period (RS) high-water period (HW) flushing period (FL) low-water period (LW) BndashGndashH1ndashLondashMndashMPndashPndashS1ndashTcndashW1ndashY are functional groups that had at least 5 of total biovolume in at least one hydrological period Others are the sum of functional groups that did not respect the 5 threshold
33 Statistical Results
The STI test indicated that the space-time interaction is not significant That is there was no significant influence of space-time on the structuring of the phytoplankton community at the functional group level The second step returned that only time had a significant importance in structuring the phytoplankton community hence indicating that spatial distribution of sample units
Figure 2 Relative phytoplankton class biomass (A) and functional groups biomass (B) Rising period (RS)high-water period (HW) flushing period (FL) low-water period (LW) BndashGndashH1ndashLondashMndashMPndashPndashS1ndashTcndashW1ndashYare functional groups that had at least 5 of total biovolume in at least one hydrological period Others arethe sum of functional groups that did not respect the 5 threshold
Water 2019 11 154 8 of 17
33 Statistical Results
The STI test indicated that the space-time interaction is not significant That is there was nosignificant influence of space-time on the structuring of the phytoplankton community at the functionalgroup level The second step returned that only time had a significant importance in structuring thephytoplankton community hence indicating that spatial distribution of sample units had no significantinfluence (Table 2) The time influence indicates that the hydrological cycle was the main factor in thedynamics of the phytoplankton community The partial redundancy analysis (pRDA) for partitionenvironmental data shows that both nutrients and hydrological variables had a significant influence instructuring the phytoplankton community but the strength of the nutrients partition was higher thanthat of hydrological variables (Table 2) The pRDA also returns a great residual indicating that therewere other important factors not measured which influenced the phytoplankton community structure
Table 2 Results of the space-time interaction test (STI) and pRDA tests Space-time interaction(Space + Time) common temporal structures (Time) common spatial structure (Space) variation dueto nutrients (Nutr) variations due to nutrients and hydrology together (Nutr + Hydr) variations dueto hydrology (Hydr) not-explanable variation (Res) adjusted R2 value (AdjR2) significance (p lt 005)
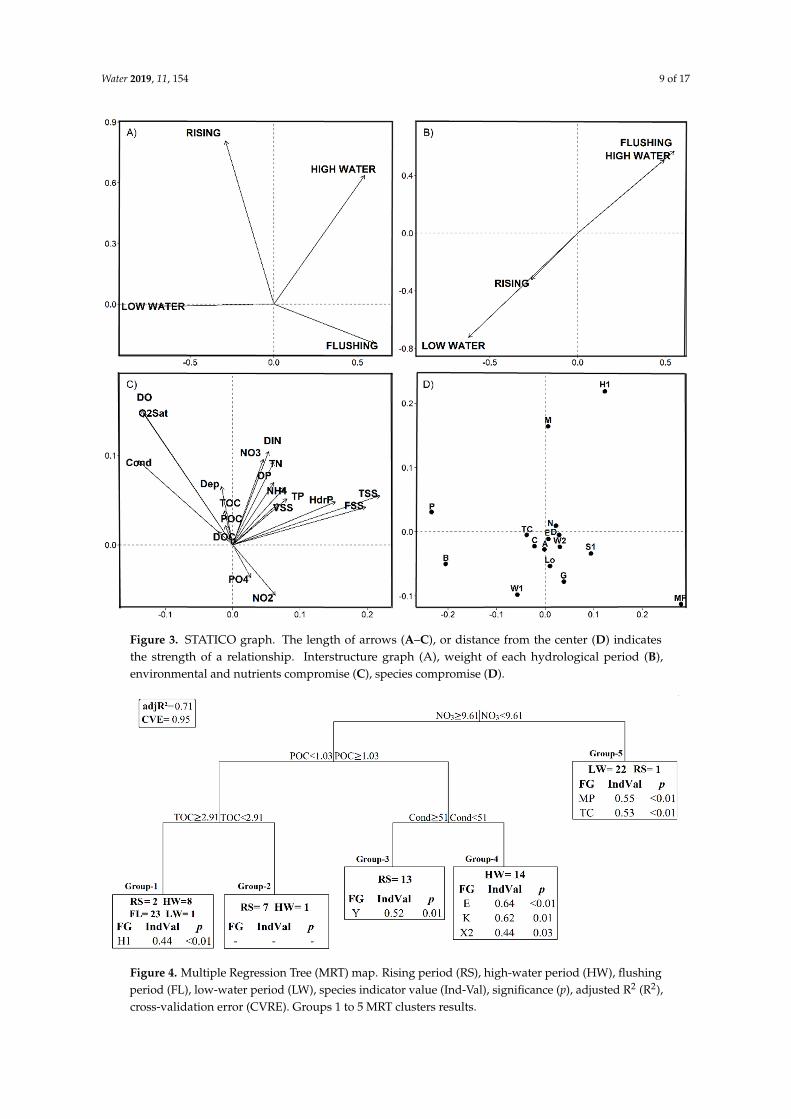
The STATICO analysis showed stability in the phytoplanktonndashnutrient relationship along periodsas illustrated by the longer arrows in the interstructure graph (Figure 3A) In these graphs thegreater length of arrows (or in case of points the distance from the center) the higher the stability inthis relationship However the weight of each hydrological period on the phytoplanktonndashnutrientsrelationship was different (Figure 3B) The first and second axes represented respectively 19 and 10of the total variability The first axis (horizontal axis) in the compromise graph (Figure 3C) accountedfor 42 of the explained variance and the second axis (vertical axis) accounted for 20 of the explainedvariance and was less significant Flushing and low-water periods were more related to the firstaxis which has twice the explanatory power of the second axis Hence the phytoplanktonndashnutrientsrelationship might be considered stronger during these two periods
As shown by the environmental variables compromise plot (Figure 3C) the first axis (horizontal)was more related to hydrolyzable phosphorus and suspended solids The second axis (vertical) wasmore related with PO4 and NO2 (Figure 3C) Other variables such as conductivity and oxygen arerelated to both axes and also have a great compromise (long arrow) The environmental variableswith shorter arrows have weak stability with the hydrological cycle and are more related to a specificperiod as detailed below For the functional groups compromise plot (Figure 3D) the most importantgroups are those more distant to the center of the graph The FGrsquos MP and H1 although have greatstability with the hydrological cycle also play an important role on specific period (Figure 4)
Water 2019 11 154 9 of 17
1
Figure 3 STATICO graph The length of arrows (AndashC) or distance from the center (D) indicatesthe strength of a relationship Interstructure graph (A) weight of each hydrological period (B)environmental and nutrients compromise (C) species compromise (D)
Water 2018 10 x FOR PEER REVIEW 9 of 16
Figure 3 STATICO graph The length of arrows (AndashC) or distance from the center (D) indicates the strength of a relationship Interstructure graph (A) weight of each hydrological period (B) environmental and nutrients compromise (C) species compromise (D)
As shown by the environmental variables compromise plot (Figure 3C) the first axis (horizontal) was more related to hydrolyzable phosphorus and suspended solids The second axis (vertical) was more related with PO4 and NO2 (Figure 3C) Other variables such as conductivity and oxygen are related to both axes and also have a great compromise (long arrow) The environmental variables with shorter arrows have weak stability with the hydrological cycle and are more related to a specific period as detailed below For the functional groups compromise plot (Figure 3D) the most important groups are those more distant to the center of the graph The FGrsquos MP and H1 although have great stability with the hydrological cycle also play an important role on specific period (Figure 4)
Figure 4 Multiple Regression Tree (MRT) map Rising period (RS) high-water period (HW) flushing period (FL) low-water period (LW) species indicator value (Ind-Val) significance (p) adjusted R2 (R2) cross-validation error (CVRE) Groups 1 to 5 MRT clusters results
MRT applied to the data resulted in five groups the model explained 71 of the phytoplankton data variability (adjR2 = 071) The predictive power of the model expressed as the cross-validation relative error (CVRE) was 095 MRT clearly separated LW samples (22 samples) apart from those collected during the other periods based on NO3 concentration (Figure 4) LW samples belonged to group 5 with low NO3 concentration Further group divisions were based successively upon particulate organic carbon total organic carbon and conductivity Interestingly similarly as LW period all samples from the FL period are gathered into a single group (group 1) characterized by high NO3 POC and TOC concentrations whereas samples collected during HW or RS are spread over three groups A majority of samples collected in HW were gathered into group 4 (high NO3 high POC and low Cond) and those collected during RS mostly divided into two groups a majority in group 3 (high NO3 high POC high Cond) Indicator value (Ind-Val) coupled with MRT analysis enabled extracting sets of FGrsquos indicators of the MRT groups (Figure 4) Based on the Ind-Val four groups are characterized by seven significant FGs (p lt 005) Group 2 does not have any FG indicators with a significative value
4 Discussion
41 Space-Time Components and Environmental Partitions
As we expected the hydrological variation (time) is a more significant factor of structuration of the functional phytoplankton community than the environmental spatial variability (space) Besides
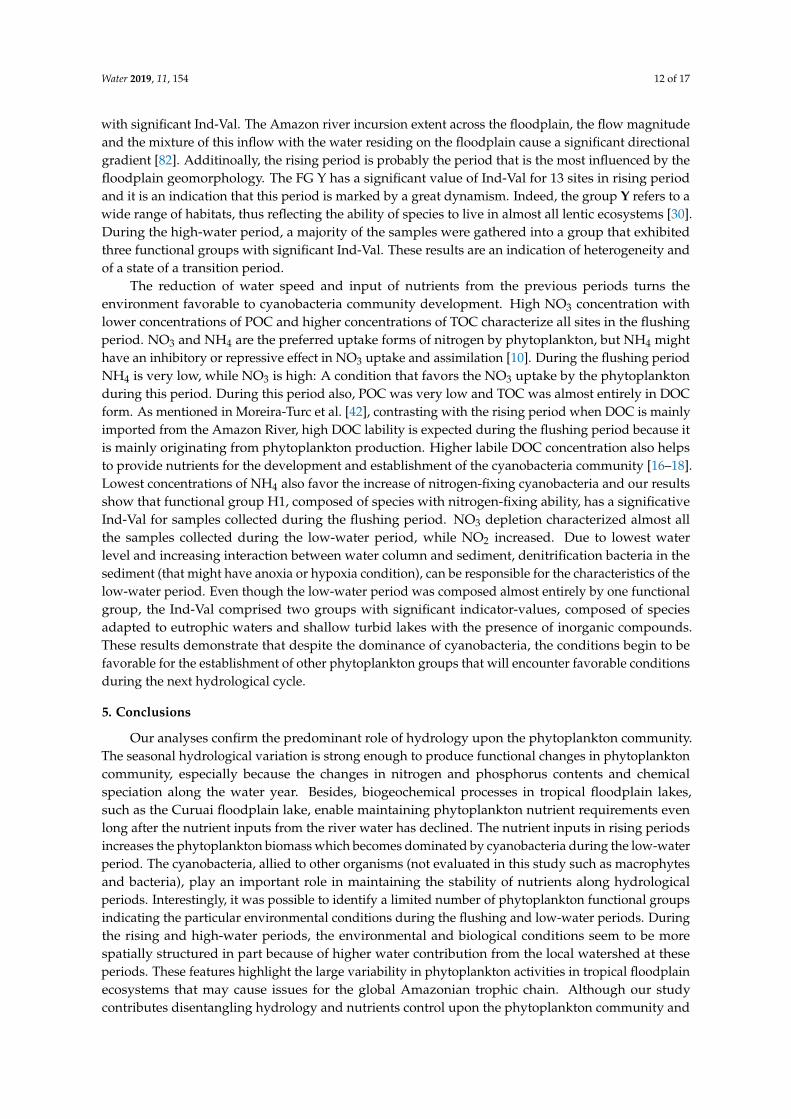
Figure 4 Multiple Regression Tree (MRT) map Rising period (RS) high-water period (HW) flushingperiod (FL) low-water period (LW) species indicator value (Ind-Val) significance (p) adjusted R2 (R2)cross-validation error (CVRE) Groups 1 to 5 MRT clusters results
Water 2019 11 154 10 of 17
MRT applied to the data resulted in five groups the model explained 71 of the phytoplanktondata variability (adjR2 = 071) The predictive power of the model expressed as the cross-validationrelative error (CVRE) was 095 MRT clearly separated LW samples (22 samples) apart from thosecollected during the other periods based on NO3 concentration (Figure 4) LW samples belongedto group 5 with low NO3 concentration Further group divisions were based successively uponparticulate organic carbon total organic carbon and conductivity Interestingly similarly as LW periodall samples from the FL period are gathered into a single group (group 1) characterized by high NO3POC and TOC concentrations whereas samples collected during HW or RS are spread over threegroups A majority of samples collected in HW were gathered into group 4 (high NO3 high POCand low Cond) and those collected during RS mostly divided into two groups a majority in group3 (high NO3 high POC high Cond) Indicator value (Ind-Val) coupled with MRT analysis enabledextracting sets of FGrsquos indicators of the MRT groups (Figure 4) Based on the Ind-Val four groups arecharacterized by seven significant FGs (p lt 005) Group 2 does not have any FG indicators with asignificative value
4 Discussion
41 Space-Time Components and Environmental Partitions
As we expected the hydrological variation (time) is a more significant factor of structuration ofthe functional phytoplankton community than the environmental spatial variability (space) Besidesthe STI test the STATICO also showed that most of the phytoplankton community variation is stronglylinked with variables related with hydrological conditions (TSS Cond) MRT further confirmed thegroups according to the hydrological periods The analyses show that only the hydrological variationis strong enough to produce functional changes in the phytoplankton community and this reflects theimportance of flood pulse dynamics in the Amazon basin In fact the hydrological variation or floodpulse is acknowledged as a strength that can promote changes in these environments and biologicalcommunities in several studies [367071] In addition our results showed that these changes are morerelated to nutrients changes (and especially nitrogen changes as indicated by MRT) than changes inanother factors (among those we have measured) Indeed the partition test showed that although thehydrological variables measured were significant in structuring the community the nutrients variableswere two times more decisive in this process thus confirming our starting hypothesis In addition thepartition involving both variables (Hydr + Nutr) has the same proportion than that of the nutrientspartition The hydrological annual variability promotes a lot of changes over the year and one of themis a variability of the different kinds of nutrients In general we measured only total nitrogen and totalphosphorus when performing research in this field for many reasons but the different fractions ofnitrogen and phosphorus compounds have different influences on the phytoplankton community
42 Nutrients-Phytoplankton Relationships over Hydrological Cycle
Our results showed that over the hydrological year (i) the interaction between phytoplanktoncommunity and phosphorus compounds is more stable than that of nitrogen compounds (Figure 3CD)and (ii) that the rising period has the weakest weight in the phytoplanktonndashnutrients interaction(Figure 3B) While the phytoplankton biovolume becomes higher the weight of the relationship insubsequent hydrological periods increases suggesting that there are both top-down and bottom-upcontrols for the phosphorus and nitrogen cycles in tropical floodplain system Top-down refers to theinput which occurs in the rising period from waters coming from the Amazon river while bottom-uprefers to phosphorus (or nitrogen) cycle processes occurring inside the floodplain
Regarding phosphorus our results suggest that bottom-up control is stronger than top-down orin other words that phosphorus compounds already present or in situ recycled in the system havea greater influence upon phytoplankton than allogenic phosphorus compounds It is well knownthat Amazonian rivers that drain the Andes (classified as white-water rivers according to Sioli 1984
Water 2019 11 154 11 of 17
typology) [47] carry high concentration in suspended solids and dissolved and sediment-boundnutrients [37] The river incursion across the floodplain during rising brings nutrients and sedimentinto the floodplain ecosystems and promotes a high peak in primary productivity [3972] However ourresults also showed that the phytoplanktonndashphosphorus relationship is stable along the hydrologicalyear Many processes can participate to maintain a rather constant concentration of phosphorus in thewater column Seasonal herbaceous plants that pump nutrients from the sediment to support theirgrowth and release nutrients in the water column during their decay [7374] sediment early diagenesisprocesses and resuspension may also participate [74]
Although weaker than with phosphorus compounds our results showed that there is a stableinteraction between nitrogen compounds (TN and DIN) and phytoplankton Wetlands such asfloodplains can be considered aggrading ecosystems where the nitrogen can come from adjacentdrained areas or the mainstream and in some cases from biological nitrogen fixation and atmosphericdeposition [75ndash77] The phytoplankton primary productivity peak occurring in the rising period isfollowed by a significant increase of nitrogen-fixing cyanobacteria biovolume Nitrogen fixation is anessential process for eutrophic wetlands once it may contribute from 5 to 80 of the total nitrogeninputs in these systems [8] NO3 is the most common reactive nitrogen species [74] and the highconcentration in flushing period allied to higher biovolume of FG H1 suggest that nitrogen-fixingprocess plays an essential role in maintaining the stability along the hydrological cycle
Besides nitrogen-fixation processes the increases in nitrogen compounds between rising andsubsequent periods similar to phosphorus can be influenced by processes mentioned above especiallythe seasonal herbaceous plants growthdecay cycle that may release NH4 and NO3 in the watercolumn Thus the sediment nutrients pool mobilization is another crucial factor that permits thenitrogen concentration to remain stable during the hydrological cycle Hence like phosphorusthe phytoplanktonndashnitrogen interaction also suggests that there is both a top-down and bottom-upinteraction for its cycle in tropical floodplain system
The idea that the phytoplankton has the potential to influence pools of nitrogen and phosphorusthat would be available is not new [77] but works with this approach are scarce in tropicalenvironments For temperate lakes the work of Cottingham et al [77] has demonstrated thatcyanobacteria have the potential to drive nitrogen and phosphorus cycles in lakes They remarkedthat the ability of many cyanobacterial taxa to fix nitrogen and to access pools of phosphorus insediments and bottom waters is the key behind this influence Their work suggests that cyanobacterialblooms warrant attention as potential drivers of the transition from a low-nutrient clear-water regimeto a high-nutrient turbid-water regime Our results show that there is a considerable increase incyanobacteria biovolume but it is difficult to know how much is a consequence of allochthonousnitrogen inputs and how much is a consequence of autochthonous nitrogen inputs However it iscertain that this increase is an important factor for maintaining the stability of nutrients over thehydrological cycle Thus the cyanobacteria dynamics are an essential factor in both nutrients cyclingand phytoplankton dynamics Increases in nutrients leading to a dominance of cyanobacteria havebeen reported by Dokulil and Teubner [78] and in Curuai Affonso et al [79] they found that theflushing period was the most eutrophic period Thus the extent to which the floodplain becomesshallow and water flow less intense the cyanobacteria community can be established [80]
43 Cyanobacteria Dynamics
The results showed that while the phytoplankton biomass increased and the environment becamemore eutrophic the phytoplankton functional group diversity was decreasing until the phytoplanktonwas almost entirely composed by the cyanobacteria group Even if phytoplankton species differ intheir nutritional requirements [81] and although nitrogen and phosphorus are essential factors for thephytoplankton growth they are not the unique Other factors play a vital role for the phytoplanktonin specific periods Unlike during the flushing and low-water periods samples collected during therising and high-water periods spread over a larger number of MRT groups with functional groups
Water 2019 11 154 12 of 17
with significant Ind-Val The Amazon river incursion extent across the floodplain the flow magnitudeand the mixture of this inflow with the water residing on the floodplain cause a significant directionalgradient [82] Additinoally the rising period is probably the period that is the most influenced by thefloodplain geomorphology The FG Y has a significant value of Ind-Val for 13 sites in rising periodand it is an indication that this period is marked by a great dynamism Indeed the group Y refers to awide range of habitats thus reflecting the ability of species to live in almost all lentic ecosystems [30]During the high-water period a majority of the samples were gathered into a group that exhibitedthree functional groups with significant Ind-Val These results are an indication of heterogeneity andof a state of a transition period
The reduction of water speed and input of nutrients from the previous periods turns theenvironment favorable to cyanobacteria community development High NO3 concentration withlower concentrations of POC and higher concentrations of TOC characterize all sites in the flushingperiod NO3 and NH4 are the preferred uptake forms of nitrogen by phytoplankton but NH4 mighthave an inhibitory or repressive effect in NO3 uptake and assimilation [10] During the flushing periodNH4 is very low while NO3 is high A condition that favors the NO3 uptake by the phytoplanktonduring this period During this period also POC was very low and TOC was almost entirely in DOCform As mentioned in Moreira-Turc et al [42] contrasting with the rising period when DOC is mainlyimported from the Amazon River high DOC lability is expected during the flushing period because itis mainly originating from phytoplankton production Higher labile DOC concentration also helpsto provide nutrients for the development and establishment of the cyanobacteria community [16ndash18]Lowest concentrations of NH4 also favor the increase of nitrogen-fixing cyanobacteria and our resultsshow that functional group H1 composed of species with nitrogen-fixing ability has a significativeInd-Val for samples collected during the flushing period NO3 depletion characterized almost allthe samples collected during the low-water period while NO2 increased Due to lowest waterlevel and increasing interaction between water column and sediment denitrification bacteria in thesediment (that might have anoxia or hypoxia condition) can be responsible for the characteristics of thelow-water period Even though the low-water period was composed almost entirely by one functionalgroup the Ind-Val comprised two groups with significant indicator-values composed of speciesadapted to eutrophic waters and shallow turbid lakes with the presence of inorganic compoundsThese results demonstrate that despite the dominance of cyanobacteria the conditions begin to befavorable for the establishment of other phytoplankton groups that will encounter favorable conditionsduring the next hydrological cycle
5 Conclusions
Our analyses confirm the predominant role of hydrology upon the phytoplankton communityThe seasonal hydrological variation is strong enough to produce functional changes in phytoplanktoncommunity especially because the changes in nitrogen and phosphorus contents and chemicalspeciation along the water year Besides biogeochemical processes in tropical floodplain lakessuch as the Curuai floodplain lake enable maintaining phytoplankton nutrient requirements evenlong after the nutrient inputs from the river water has declined The nutrient inputs in rising periodsincreases the phytoplankton biomass which becomes dominated by cyanobacteria during the low-waterperiod The cyanobacteria allied to other organisms (not evaluated in this study such as macrophytesand bacteria) play an important role in maintaining the stability of nutrients along hydrologicalperiods Interestingly it was possible to identify a limited number of phytoplankton functional groupsindicating the particular environmental conditions during the flushing and low-water periods Duringthe rising and high-water periods the environmental and biological conditions seem to be morespatially structured in part because of higher water contribution from the local watershed at theseperiods These features highlight the large variability in phytoplankton activities in tropical floodplainecosystems that may cause issues for the global Amazonian trophic chain Although our studycontributes disentangling hydrology and nutrients control upon the phytoplankton community and
Water 2019 11 154 13 of 17
better understands how the nutrientsndashphytoplankton relationship changes along the water year stillmore research is required upon the phytoplanktonndashnutrient relationship in tropical aquatic ecosystemsMost of the knowledge upon this relationship is based on experimental investigations and researchin temperate environments and thus limiting our understanding of what controls such processes intropical freshwater ecosystems
Author Contributions CNK and M-PB were mainly responsible for the development and organization of thework IdSN and MTMPSL assisted in the taxonomic identification of the phytoplankton community and inthe ecological interpretation of community results DdMM contributed to the analytical procedure of water andthe ecological interpretation of the data obtained JG assisted with the geochemical assessment LCGV assistedin the development and analysis of statistical data applied to the ecological community
Funding The authors are very grateful to the two anonymous revisors their constructive comments helped tosubstancially improve the manuscript This research was done under the auspices of CNPq (Conselho Nacionalde Desenvolvimento Cientiacutefico e Tecnoloacutegico Brazil) CAPES (Coordenaccedilatildeo de Aperfeiccediloamento de Pessoalde Niacutevel Superior Brazil) IRD (Institut de Recherche pour le Deacuteveloppement grant number 4906342013-3France) and LMI OCE (Laboratoire Mixte International lsquoObservatoire des Changements Environnementauxrsquo)and of three research programs Clim-FABIAM which was funded by FRB (Fondation pour la Recherche sur laBiodiversiteacute) and Bloom-ALERT which was funded by the GUYAMAZON program (IRDCIRADAmbassadede FranceFAPEAM) and INCT nordm 16- 2014 ODISSEIA with funding from CNPqCAPESFAP-DF The paperalso received funding from the European Unionrsquos Horizon 2020 Research and innovation program under theMarie SkłodowskamdashCurie grant agreement Nordm 691053
Conflicts of Interest The authors declare no conflict of interest
References
1 Fiore MDF Neilan BA Copp JN Rodrigues JLMM Tsai SM Lee H Trevors JT Characterizationof nitrogen-fixing cyanobacteria in the Brazilian Amazon floodplain Water Res 2005 39 5017ndash5026[CrossRef] [PubMed]
2 Schindler DW The dilemma of controlling cultural eutrophication of lakes Proc R Soc B Biol Sci 2012279 4322ndash4333 [CrossRef] [PubMed]
3 Paerl HW Gardner WS Havens KE Joyner AR McCarthy MJ Newell SE Qin B Scott JTMitigating cyanobacterial harmful algal blooms in aquatic ecosystems impacted by climate change andanthropogenic nutrients Harmful Algae 2016 54 213ndash222 [CrossRef] [PubMed]
4 Thomas MK Litchman E Effects of temperature and nitrogen availability on the growth of invasive andnative cyanobacteria Hydrobiologia 2016 763 357ndash369 [CrossRef]
5 Schindler DW Hecky RE Findlay DL Stainton MP Parker BR Paterson MJ Beaty KG Lyng MKasian SEM Eutrophication of lakes cannot be controlled by reducing nitrogen input Results of a 37-yearwhole-ecosystem experiment Proc Natl Acad Sci USA 2008 105 11254ndash11258 [CrossRef] [PubMed]
6 Conley DJ Paerl HW Howarth RW Boesch DF Seitzinger SP Havens KE Lancelot C Likens GEControlling Eutrophication Nitrogen and Phosphorus Science 2009 [CrossRef]
7 Howarth RW Nutrient Limitation of Net Primary Production in Marine Ecosystems Annu Rev Ecol Syst1988 19 89ndash110 [CrossRef]
8 Lewis WM Wurtsbaugh WA Paerl HW Rationale for Control of Anthropogenic Nitrogen andPhosphorus to Reduce Eutrophication of Inland Waters Environ Sci Technol 2011 45 10300ndash10305[CrossRef] [PubMed]
9 Elser JJ Bracken MES Cleland EE Gruner DS Harpole WS Hillebrand H Ngai JTSeabloom EW Shurin JB Smith JE Global analysis of nitrogen and phosphorus limitation of primaryproducers in freshwater marine and terrestrial ecosystems Ecol Lett 2007 10 1135ndash1142 [CrossRef]
10 Abell JM Oumlzkundakci D Hamilton DP Nitrogen and Phosphorus Limitation of Phytoplankton Growthin New Zealand Lakes Implications for Eutrophication Control Ecosystems 2010 13 966ndash977 [CrossRef]
11 Thad Scott J McCarthys MJ Nitrogen fixation may not balance the nitrogen pool in lakes over timescalesrelevant to eutrophication management Limnol Oceanogr 2010 55 1265ndash1270 [CrossRef]
12 Scheffer M Van Nes EH Shallow lakes theory revisited Various alternative regimes driven by climatenutrients depth and lake size Hydrobiologia 2007 584 455ndash466 [CrossRef]
Water 2019 11 154 14 of 17
13 Janssen ABG Teurlincx S An S Janse JH Paerl HW Mooij WM Alternative stable states in largeshallow lakes J Great Lakes Res 2014 40 813ndash826 [CrossRef]
14 Jeppesen E Meerhoff M Davidson TA Trolle D Soslashndergaard M Lauridsen TL Beklioglu MBrucet S Volta P Gonzaacutelez-Bergonzoni I et al Climate change impacts on lakes An integrated ecologicalperspective based on a multi-faceted approach with special focus on shallow lakes J Limnol 2014 7388ndash111 [CrossRef]
15 Lobo MTMPS de Souza Nogueira I Fabris Sgarbi L Nunes Kraus C de Oliveira Bomfim E Garnier Jda Motta Marques D Bonnet M-P Morphology-based functional groups as the best tool to characterizeshallow lake-dwelling phytoplankton on an Amazonian floodplain Ecol Indic 2018 95 579ndash588 [CrossRef]
16 Lampert W Sommer U Limnoecology Oxford University Press Oxford UK 2007 ISBN 978-0-19-921392-417 Soslashndergaard M Jensen JP Jeppesen E Role of sediment and internal loading of phosphorus in shallow
lakes Hydrobiologia 2003 506ndash509 135ndash14518 Scheffer M Rinaldi S Gragnani A Mur LR van Nes EH On the Dominance of Filamentous
Cyanobacteria in Shallow Turbid Lakes Ecology 1997 78 272 [CrossRef]19 Hays SG Ducat DC Engineering cyanobacteria as photosynthetic feedstock factories Photosynth Res
2014 123 1ndash11 [CrossRef]20 Benoiston A-S Ibarbalz FM Bittner L Guidi L Jahn O Dutkiewicz S Bowler C The evolution of
diatoms and their biogeochemical functions Philos Trans R Soc B Biol Sci 2017 372 20160397 [CrossRef]21 Peace A Effects of light nutrients and food chain length on trophic efficiencies in simple stoichiometric
aquatic food chain models Ecol Model 2015 312 125ndash135 [CrossRef]22 OrsquoNeil JM Davis TW Burford MA Gobler CJ The rise of harmful cyanobacteria blooms The potential
roles of eutrophication and climate change Harmful Algae 2012 14 313ndash334 [CrossRef]23 Catherine Q Susanna W Isidora ES Mark H Aureacutelie V Jean-Franccedilois H A review of current
knowledge on toxic benthic freshwater cyanobacteriamdashEcology toxin production and risk managementWater Res 2013 47 5464ndash5479 [CrossRef]
24 Boopathi T Ki J-S Impact of Environmental Factors on the Regulation of Cyanotoxin Production Toxins2014 6 1951ndash1978 [CrossRef] [PubMed]
25 Rastogi RP Madamwar D Incharoensakdi A Bloom dynamics of cyanobacteria and their toxinsEnvironmental health impacts and mitigation strategies Front Microbiol 2015 6 1ndash22 [CrossRef] [PubMed]
26 Sukenik A Quesada A Salmaso N Global expansion of toxic and non-toxic cyanobacteria Effect onecosystem functioning Biodivers Conserv 2015 24 889ndash908 [CrossRef]
27 Vilmi A Karjalainen SM Landeiro VL Heino J Freshwater diatoms as environmental indicators Evaluatingthe effects of eutrophication using species morphology and biological indices Environ Monit Assess 2015187 243 [CrossRef]
28 Dolman AM Ruumlcker J Pick FR Fastner J Rohrlack T Mischke U Wiedner C Cyanobacteria andcyanotoxins The influence of nitrogen versus phosphorus PLoS ONE 2012 7 e38757 [CrossRef]
29 LONGHI ML BEISNER BE Patterns in taxonomic and functional diversity of lake phytoplanktonFreshw Biol 2010 55 1349ndash1366 [CrossRef]
30 Colina M Calliari D Carballo C Kruk C A trait-based approach to summarizezooplanktonndashphytoplankton interactions in freshwaters Hydrobiologia 2015 767 221ndash233 [CrossRef]
31 Salmaso N Naselli-Flores L Padisaacutek J Functional classifications and their application in phytoplanktonecology Freshw Biol 2015 60 603ndash619 [CrossRef]
32 Reynolds CS Huszar V Kruk C Naselli-Flores L Melo SS Towards a functional classification of thefreshwater phytoplankton J Plankton Res 2002 24 417ndash428 [CrossRef]
33 Padisaacutek J Crossetti LO Naselli-Flores L Use and misuse in the application of the phytoplanktonfunctional classification A critical review with updates Hydrobiologia 2009 621 1ndash19 [CrossRef]
34 Kruk C Huszar VLM Peeters ETHM Bonilla S Costa L Luumlrling M Reynolds CS Scheffer M Amorphological classification capturing functional variation in phytoplankton Freshw Biol 2010 55 614ndash627[CrossRef]
35 Machado KB Borges PP Carneiro FM de Santana JF Vieira LCG de Moraes Huszar VLNabout JC Using lower taxonomic resolution and ecological approaches as a surrogate for planktonspecies Hydrobiologia 2015 743 255ndash267 [CrossRef]
Water 2019 11 154 15 of 17
36 Junk WJ Bayley PB Sparks RE The flood pulse concept in river-floodplain systems Can Spec PublFish Aquat Sci 1989 106 110ndash127
37 Junk WJ Piedade MTF Schoumlngart J Wittmann F A classification of major natural habitats of Amazonianwhite-water river floodplains (vaacuterzeas) Wetl Ecol Manag 2012 20 461ndash475 [CrossRef]
38 Tockner K Malard F Ward JV An extension of the flood pulse concept Hydrol Process 2000 142861ndash2883 [CrossRef]
39 Bonnet MPP Barroux G Martinez JMM Seyler F Moreira-Turcq P Cochonneau G Melack JMMBoaventura G Maurice-Bourgoin L Leoacuten JGG et al Floodplain hydrology in an Amazon floodplainlake (Lago Grande de Curuaiacute) J Hydrol 2008 349 18ndash30 [CrossRef]
40 Junk WJ Wantzen KM The flood pulse concept New aspects approaches and applicationsmdashAn updateIn Proceedings of the Second International Symposium on the Management of Large Rivers for FisheriesRome Italy 11ndash14 February 2003 pp 117ndash149
41 Bonnet M-P Pinel S Garnier J Bois J Resende Boaventura G Seyler P Motta Marques D Amazonianfloodplain water balance based on modelling and analyses of hydrologic and electrical conductivity dataHydrol Process 2017 31 1702ndash1718 [CrossRef]
42 Kraus CN Bonnet MP Miranda CA de Souza Nogueira I Garnier J Vieira LCG InterannualHydrological Variation and Ecological Phytoplankton Patterns in Amazonian Floodplain Lakes Hydrobiologia2018 [CrossRef]
43 Sioli H The Amazon and its main affluents Hydrography morphology of the river courses and river typesIn The Amazon Limnology and Landscape Ecology of a Mighty Tropical River and Its Basin Sioli H Ed SpringerDordrecht The Netherlands 1984 pp 127ndash165 ISBN 978-94-009-6542-3
44 Moquet JS Crave A Viers J Seyler P Armijos E Bourrel L Chavarri E Lagane C Laraque ACasimiro WSL et al Chemical weathering and atmosphericsoil CO(2) uptake in the Andean and ForelandAmazon basins Chem Geol 2011 287 1ndash26 [CrossRef]
45 Park E Latrubesse EM Water resources research Water Resour Res 2015 51 9127ndash914046 Bonnet MP Garnier J Barroux G Boaventura GR Seyler P Mse CC Bataillon PE Biogeochemical
functioning of amazonian floodplains The case of lago Grande de Curuai In Riparian Zones CharacteristicsManagement Practices and Ecological Impacts Environmental Research Advances Pokrovsky OS Viers J EdsNova Science Publishers New York NY USA 2016 pp 1ndash22 ISBN 978-1-63484-636-3
47 APHA Standard Methods for Examination of Water and Wastewater (Standard Methods for the Examination of Waterand Wastewater) Standard Methods American Public Health Association (APHA) Washington DC USA1998 pp 5ndash16
48 Utermoumlhl H Zur vervollkommnung der quantitativen phytoplankton-methodik Mitt Int Ver Angew Limnol1958 9 1ndash38 [CrossRef]
49 Lund JWG Kipling C Le Cren ED The inverted microscope method of estimating algal numbers andthe statistical basis of estimations by counting Hydrobiologia 1958 11 143ndash170 [CrossRef]
50 Guiry MD Guiry GM AlgaeBase World-Wide Electronic Publication Available online httpwwwalgaebaseorg (accessed on 20 October 2018)
51 Hillebrand H Duumlrselen C-D Kirschtel D Pollingher U Zohary T Biovolume Calculation for Pelagicand Benthic Microalgae J Phycol 1999 35 403ndash424 [CrossRef]
52 Kruk C Mazzeo N Lacerot G Reynolds CS Classification schemes for phytoplankton A local validationof a functional approach to the analysis of species temporal replacement J Plankton Res 2002 24 901ndash912[CrossRef]
53 Thioulouse J Simultaneous analysis of a sequence of paired ecological tables A comparison of severalmethods Ann Appl Stat 2012 5 2300ndash2325 [CrossRef]
54 Dray S Chessel D Thioulouse J Co-Inertia Analysis and the Linking of Ecological Data Tables Ecology2003 84 3078ndash3089 [CrossRef]
55 Blanchet FG Legendre P Borcard D Forward selection of explanatory variables Ecology 2008 892623ndash2632 [CrossRef]
56 Dersquoath G Multivariate Regression Tree A New Technique for Modeling SpeciesndashEnvironment RelationshipsEcology 2002 83 1105ndash1117
57 Borcard D Gillet F Legendre P Community Diversity In Numerical Ecology with R Springer BerlinHeidelbergGermany 2018 pp 369ndash412
Water 2019 11 154 16 of 17
58 DersquoAth G Fabricius KE Classification and regression trees A powerful yet simple technique for ecologicaldata analysis Ecology 2000 81 3178ndash3192 [CrossRef]
59 Therneau TM Atkinson B Ripley B Oksanen J Dersquoath G MVpart A Package for Running MultivariateRegression Trees in R Software Available online httpscranr-projectorgsrccontribArchivemvpart(accessed on 30 November 2018)
60 Ouellette MH Legendre P MVPARTwrap Additional Features for Package Mvpart R Package Version01-92 Available online httpscranr-projectorgsrccontribArchiveMVPARTwrap (accessed on 30November 2018)
61 Dufrecircne M Legendre P Species assemblages and indicator species The need for a flexible asymmetricalapproach Ecol Monogr 1997 67 345ndash366 [CrossRef]
62 Wu Z Shi J Li R Comparative studies on photosynthesis and phosphate metabolism of Cylindrospermopsisraciborskii with Microcystis aeruginosa and Aphanizomenon flos-aquae Harmful Algae 2009 8 910ndash915[CrossRef]
63 Ni Z Wang S Wang Y Characteristics of bioavailable organic phosphorus in sediment and its contributionto lake eutrophication in China Environ Pollut 2016 219 537ndash544 [CrossRef] [PubMed]
64 Junk WJ The flood pulse concept of large rivers Learning from the tropics Large Rivers 1999 11 261ndash280[CrossRef]
65 Zhou J Lau KM Principal modes of interannual and decadal variability of summer rainfall over SouthAmerica Int J Clim 2001 21 1623ndash1644 [CrossRef]
66 Osborne PL Tropical Ecosystems and Ecological Concepts Cambridge University Press Cambridge UK 2000ISBN 0521645239
67 Silva TSF Melack JM Novo EMLM Responses of aquatic macrophyte cover and productivity toflooding variability on the Amazon floodplain Glob Chang Biol 2013 19 3379ndash3389 [CrossRef] [PubMed]
68 Schlesinger WH Reckhow KH Bernhardt ES Global change The nitrogen cycle and rivers Water Resour Res2006 42 5ndash6 [CrossRef]
70 Peterson BJ Wollheim WM Mulholland PJ Webster JR Meyer JL Tank JL Marti E Bowden WBValett HM Hershey AE et al Control of nitrogen export from watersheds by headwater streams Science2001 292 86ndash90 [CrossRef]
71 Burkart MR Stoner JD Nitrogen in Groundwater Associated with Agricultural Systems Nitrogen Environ2008 177ndash202 [CrossRef]
72 Xiao M Willis A Burford MA Differences in cyanobacterial strain responses to light and temperaturereflect species plasticity Harmful Algae 2017 62 84ndash93 [CrossRef] [PubMed]
73 Cottingham KL Ewing HA Greer ML Carey CC Weathers KC Cyanobacteria as biological driversof lake nitrogen and phosphorus cycling Ecosphere 2015 6 1ndash9 [CrossRef]
74 Dokulil MT Teubner K Cyanobacterial dominance in lakes Hydrobiologia 2000 438 1ndash12 [CrossRef]75 Johnston CA Sediment and nutrient retention by freshwater wetlands Effects on surface water quality
Crit Rev Environ Control 1991 21 491ndash565 [CrossRef]76 Nogueira IDS Nabout JC Ibantildeez MDSR Bourgoin LM Rodrigues S Determinants of beta diversity
The relative importance of environmental and spatial processes in structuring phytoplankton communitiesin an Amazonian floodplain Acta Limnol Bras 2010 22 247ndash256 [CrossRef]
77 Affonso A Barbosa C Novo E Water quality changes in floodplain lakes due to the Amazon River floodpulse Lago Grande de Curuaiacute (Paraacute) Braz J Biol 2011 71 601ndash610 [CrossRef] [PubMed]
78 Reynolds CS Descy J-P Padisagravek J Are phytoplankton dynamics in rivers so different from those inshallow lakes Hydrobiologia 1994 289 1ndash7 [CrossRef]
79 Shan K Li L Wang X Wu Y Hu L Yu G Song L Modelling ecosystem structure and trophicinteractions in a typical cyanobacterial bloom-dominated shallow Lake Dianchi China Ecol Model 2014291 82ndash95 [CrossRef]
80 Barbosa CCF Moraes Novo EML Melack JM Gastil-Buhl M Filho WP Geospatial analysis ofspatiotemporal patterns of pH total suspended sediment and chlorophyll-a on the Amazon floodplainLimnology 2009 11 155ndash166 [CrossRef]
Water 2019 11 154 17 of 17
81 Bourgoin LM Bonnet M-P Martinez J-M Kosuth P Cochonneau G Moreira-Turcq P Guyot J-LVauchel P Filizola N Seyler P Temporal dynamics of water and sediment exchanges between the Curuaiacutefloodplain and the Amazon River Brazil J Hydrol 2007 335 140ndash156 [CrossRef]
82 Mulholland PJ Helton AM Poole GC Hall RO Hamilton SK Peterson BJ Tank JLAshkenas LR Cooper LW Dahm CN et al Stream denitrification across biomes and its response toanthropogenic nitrate loading Nature 2008 452 202ndash205 [CrossRef] [PubMed]
copy 2019 by the authors Licensee MDPI Basel Switzerland This article is an open accessarticle distributed under the terms and conditions of the Creative Commons Attribution(CC BY) license (httpcreativecommonsorglicensesby40)
Introduction
Materials and Methods
Environmental and Phytoplankton Data
Data Analysis
Results
Hydrological and Nutrients Data
Biological Data
Statistical Results
Discussion
Space-Time Components and Environmental Partitions
Nutrients-Phytoplankton Relationships over Hydrological Cycle
Cyanobacteria Dynamics
Conclusions
References
Water 2019 11 154 2 of 17
of primary and secondary production demands [89] Furthermore current research showed thatnitrogen and phosphorus enrichment produces a positive synergistic response in environments [10]Disentangling what nutrient (P or N) is the most significant for primary production is stronglydependent on the environmental conditions and biological characteristics (especially related tophytoplankton community) prevailing in the considered aquatic ecosystem [671112]
Moreover the relationship between nutrient concentrations and phytoplankton is problematicsince nutrients can be blocked in phytoplankton cells in different ways In addition to the abilityof some genera of cyanobacteria that can fix atmospheric nitrogen [2612] other genera may alsostore phosphorus [13] and the settled phytoplankton can stimulate mineralization at the sedimentsurface and consequently nutrient release to the water column [1415] The carbon available in theenvironment also plays an essential factor in the aquatic ecosystem and influences the phytoplanktoncommunity at the same time that can have their cycle influenced by this community [16ndash18] Thuseven though the loading and concentrations of nutrients have a strong influence on the phytoplanktoncommunity their relationship may be in part consequential rather than causative
Regardless of cause and effect what is known is that nutrient enrichment in the aquatic environmentsleads to the eutrophication process which may cause cyanobacteria bloom that represents risks due to thepotential release of toxins as evidenced by several studies [19ndash23] The phytoplankton community havediverse responses to varying nutrient enrichments [182024] and should not be treated as a single groupwhen considering the effects of nutrient loading on community structure [25] The use of the functionalgroups approach may improve the understanding and the prediction of phytoplankton communityresponses to environmental changes [2627] It is expected that species of the same functional groupchange their biomass in response to environmental conditions making it possible to predict thedynamics of natural phytoplankton populations [28] The functional classification of Reynolds et al [29]updated by Padisaacutek et al [30] comprises 40 functional groups whose share ecological affinitiestolerances and sensitivities to different environmental conditions This classification has been testedsuccessfully in a variety of aquatic systems and is one of the most validated phytoplankton functionalclassifications [2731ndash33] Indeed these approaches allow the assessment of biological responses toenvironmental conditions where the species of different taxonomic groups can share the same ecologicalcharacteristics [29303435] It is worth mentioning that the nutrientsndashphytoplankton relationship isexpected to vary with time It is even more true for aquatic systems such as the Amazon floodplainssubmitted to highly variable hydrological conditions throughout the hydrological year
The annual hydrological variation known as flood pulse [3637] drives the Amazonian floodplainsproduction and diversity throughout different hydrological phases with different characteristics [3839]This monomodal variation promotes water oxygenation brings nutrients into these areas leading topeaks in primary productivity [4041] The autogenic organic material is partly locally degraded [42]In addition the hydrological variation tends to be more effective than spatial variation in structuringenvironmental and biological conditions in tropical floodplain systems [43ndash46] Here we aimed tostudy the relationship between the phytoplankton community structure and variations in nutrients onAmazonian floodplains a topic which has been addressed only a little in the literature Our workinghypothesis is that the annual hydrological variation is more effective in producing changes onphytoplankton community than the spatial variation of environmental conditions and these changes arerelated to variation in different kinds of nutrients over the hydrological cycle Hence we evaluated (i) ifchanges in hydrological conditions are more important than nutrients in structuring the phytoplanktoncommunity (ii) the importance of different kinds of nutrients in the structure of the phytoplanktoncommunity (functional groups) (iii) how it changes on the relationship driving the phytoplankton overthe hydrological cycle and (iv) if these relationships have an influence on the cyanobacteria biomass
2 Materials and Methods
The study site is the Curuai floodplain a large system composed of several temporallyinterconnected lakes located along the Amazon River (Figure 1) Several channels link the lakersquos
Water 2019 11 154 3 of 17
system with the mainstem but only the easternmost channel remains permanently connected [39]Waters from the Amazon River local drainage basin seepage and local precipitation seasonally floodthe system leading to an important seasonal water level variation (in average around 6 m) The largeamplitude of water level combined with flat relief induces a substantial difference of flood extentbetween low- and high-water periods [39] The river water rich in inorganic suspended material andnutrients [47ndash49] contrasts with the water quality of the other water sources that are poor in nutrientsand rich in dissolved organic matter [4150] We collected samples during two consecutive yearsspreading over four hydrological periods 2013 rising (RS) and flushing (FL) (March and Septemberrespectively) and 2014 high-waters (HW) and low-waters (LW) (July and November respectively)with 23 stations in each period
Water 2018 10 x FOR PEER REVIEW 3 of 16
system with the mainstem but only the easternmost channel remains permanently connected [39] Waters from the Amazon River local drainage basin seepage and local precipitation seasonally flood the system leading to an important seasonal water level variation (in average around 6 m) The large amplitude of water level combined with flat relief induces a substantial difference of flood extent between low- and high-water periods [39] The river water rich in inorganic suspended material and nutrients [47ndash49] contrasts with the water quality of the other water sources that are poor in nutrients and rich in dissolved organic matter [4150] We collected samples during two consecutive years spreading over four hydrological periods 2013 rising (RS) and flushing (FL) (March and September respectively) and 2014 high-waters (HW) and low-waters (LW) (July and November respectively) with 23 stations in each period
Figure 1 Map of study area Curuai floodplain basin with lakes sites of sampling units flooded area and permanent waters over hydrological periods
21 Environmental and Phytoplankton Data
Sub-surface water samples for nutrients and carbon analyses were collected at the same locations where phytoplankton was collected (Figure 1) Additionally at these locations depth (Dep) was recorded and dissolved oxygen (DO) oxygen saturation (O2Sat) and electrical conductivity (Cond) were measured with a multi-parameter probe (YSI 6820-V2) Total phosphorus (TP) orthophosphate (PO4) hydrolyzable reactive phosphorus (HdrP) and organic phosphorus (OP) were quantified following the methods of [51] Total nitrogen (TN) dissolved nitrogen (DIN) ammonium (NH4) nitrate (NO3) and nitrite (NO2) were analyzed with the non-dispersive infra-red (NDIR) Total organic carbon (TOC) dissolved organic carbon (DOC) particulate organic carbon (POC) total suspended solids (TSS) fixed suspended solids (FSS) and volatile suspended solids (VSS) were measured following procedures in the Standard Methods for the Examination of Water and Wastewater [52]
The quantitative samples of phytoplankton were collected and were stored in 100 mL amber vials and fixed with acetic Lugol solution Phytoplankton was counted following the Utermoumlhl method [53] at 400times magnification The counting was done randomly until obtaining 100 individuals
Figure 1 Map of study area Curuai floodplain basin with lakes sites of sampling units flooded areaand permanent waters over hydrological periods
21 Environmental and Phytoplankton Data
Sub-surface water samples for nutrients and carbon analyses were collected at the same locationswhere phytoplankton was collected (Figure 1) Additionally at these locations depth (Dep) wasrecorded and dissolved oxygen (DO) oxygen saturation (O2Sat) and electrical conductivity (Cond)were measured with a multi-parameter probe (YSI 6820-V2) Total phosphorus (TP) orthophosphate(PO4) hydrolyzable reactive phosphorus (HdrP) and organic phosphorus (OP) were quantifiedfollowing the methods of [51] Total nitrogen (TN) dissolved nitrogen (DIN) ammonium (NH4) nitrate(NO3) and nitrite (NO2) were analyzed with the non-dispersive infra-red (NDIR) Total organic carbon(TOC) dissolved organic carbon (DOC) particulate organic carbon (POC) total suspended solids(TSS) fixed suspended solids (FSS) and volatile suspended solids (VSS) were measured followingprocedures in the Standard Methods for the Examination of Water and Wastewater [52]
Water 2019 11 154 4 of 17
The quantitative samples of phytoplankton were collected and were stored in 100 mL ambervials and fixed with acetic Lugol solution Phytoplankton was counted following the Utermoumlhlmethod [53] at 400times magnification The counting was done randomly until obtaining 100 individuals(cells colonies or filaments) of the most frequent species keeping the error less than 20 with aconfidence coefficient of 95 [54] The adopted system for classifying phytoplankton was that of Guiryand Guiry [55] The algal biovolume was calculated by multiplying the abundance of each species bythe mean cell volume [56] based on the measurement of at least 30 individuals and was expressed inmm3 Lminus1 This biovolume was used to select the phytoplankton functional groups (FGs) FGs wereclassified according to Reynolds [29] with the modifications made by Padisaacutek [30] The FGsrsquo specificbiomass was estimated from the product of the population and mean unit volume and only speciesthat contributed with at least 5 of the total biovolume per sample unit were considered [57]
22 Data Analysis
The space-time interaction test (STI) [58] was used to verify how significant the variation in timeand in space of the structure of the phytoplankton community was It is worth mentioning that in ourstudy time variation is primary linked with hydrology cycling whereas spatial variation would alsobe related to processes that have taken place in the different locations of the floodplain The STI testconsisted of a two-way ANOVA to test the space-time interaction and the main effects of space ortime using one among a set of possible models [58] Firstly space and time were coded using Helmertcontrasts for the main factor effects Then they were coded using distance-based Moran EigenvectorMaps variables (dbMEM) for the interaction term If the interaction was not significant the test ofthe main factors was also done following the method for the previous step If the interaction wassignificant then we tested spatial and temporal structures using dbMEM variables to know whetherseparate spatial or temporal structures exist For more details consult [58] These analyses wereimplemented using the R packages ldquoadespatialrdquo
To evaluate the importance of nutrients in the structure of the phytoplankton community we dividedthe environmental variables into two subgroups one with the variables related to the nutrients (nitrogenphosphorus carbon and oxygen) and another group with the other variables to which we refer to ashydrological variables These two groups were used to perform a partial redundancy analysis [59]This analysis allowed us to estimate the importance and influence of different environmental variablespartitions (ie nutrients and hydrological) in the structure of the phytoplankton community To test thesignificance of each partition we performed an ANOVA test These analyses were implemented using theR packages ldquoveganrdquo [60]
We performed an analysis of the organization of three-way tables with Co-Inertia analysisrsquo(STATICO) to evaluate the relationships between the phytoplankton biomass and nutrients With thismethod we calculated the stable part of the relationships between nutrients and phytoplanktonthroughout the hydrological periods STATICO combines two analyses the STATIS that is finding thestable part of the structure in a series of tables and the co-inertia that consists in finding the commonstructure in two data tables [61] The STATICO maximizes the covariance between the row coordinatesof two tables The pair of tables here consist of one for the phytoplankton biomass and one for thenutrient conditions This analysis had three-steps (i) Each table was analyzed with a primary analysisso (ii) each pair was linked by co-inertia analysis that produces a cross table then (iii) the partial triadicanalysis (PTA) was used to analyze the series of cross tables [62] We evaluated four pairs of tablesRising (RS) flushing (FL) high-water (HW) and low-water (LW) With the interstructure we evaluatedthe variation of the phytoplanktonndashnutrients relationship Hence it is possible to quantify the strengthof the phytoplanknton biomassndashnutrients relationship over the hydrological periods The compromisedetermines the part of the structure between phytoplankton biomass and the nutrients that remainstable throughout the hydrological periods These analyses were implemented using the R packagesldquoade4rdquo [61]
Water 2019 11 154 5 of 17
We used a forward selection procedure [63] to keep only the environmental variables thatsignificantly influence the phytoplankton community structure This procedure consists of a globaltest using all possible explanatory variables Then if and only if the global test was significant onecan proceed with the forward selection The procedure has two stopping criteria and when a variablethat brings one or the other criterion over the fixed threshold is identified that variable is rejected andthe procedure is stopped For more details consults [63] With the selected variables we performed aMultiple Regression Tree [64] to evaluate if the relationship between phytoplankton and the selectedenvironmental variables were an important factor in structuring the community The MultipleRegression Tree (MRT) consists of a constrained partitioning of the data parallel cross-validationof the results that produce a model that forms a decision tree [65] This method forms clusters of sitesby repeating splitting of the data along axes of the explanatory variables Each split was chosen tominimize the dissimilarity of data within the clusters [6466] that were presented graphically by a treeThe overall fit of the tree was specified as adjusted R2 (adjR2) and the predictive accuracy was assessedby cross-validated relative error (CVRE) [66] The MRT was implemented using the R packagesldquomvpartrdquo [67] and ldquoMVPARTwraprdquo [68] We also performed an Indicator Species Analysis (Ind-Val) tofind a statistically significant phytoplankton functional group for each data split and groups resultingfrom MRT [69] The method combines FG mean abundance (ldquospecificityrdquo) and frequency of occurrence(ldquofidelityrdquo) FGs that are both abundant and occur in most of the hydrological periods belongingto one MRT group have a high Ind-Val Ind-Val ranges between 0 to 1 where 1 refers to a perfectindicator regarding both ldquospecificityrdquo and ldquofidelityrdquo We applied the Ind-Val to groups obtained withthe MRT analysis using the R package ldquoMVPARTwraprdquo
3 Results
31 Hydrological and Nutrients Data
Depth conductivity and suspended solids presented contrasted mean values in function of thehydrological periods (Table 1) Depth was comparable between FL and RS it was three time higherduring HW than during LW Conductivity was comparable between FL and LW periods but was 60higher during FL than during HW Suspended solids (TSS and FSS) were minimum during HW andmaximum during LW
The total nitrogen mean value (TN) was maximum during LW about one third greater thanduring FL when it was minimum On the other hand if total inorganic nitrogen (DIN) was alsomaximum during LW it was minimum during the RS The main form of inorganic nitrogen was NO3
except during LW when NH4 was more than half DIN NO2 remained low below 10 microg Lminus1 exceptduring LW when it reached up to 80 microg Lminus1 while NO3 is very low Total organic carbon (TOC) wasmaximum during RS and minimum during LW with a mean value ranging between 4 and 55 mg Lminus1The dissolved fraction (DOC) represented up to 93 of TOC during FL and 65 during RS Duringthe rising and flushing periods PO4 only represents a small part of total phosphorus respectively 6and 2 During the high- and low-water periods it represents 40 and 78 respectively The watercolumn remained oxygenated with saturation above 58 regardless of the hydrological period
Water 2019 11 154 6 of 17
Table 1 Summary of environmental and nutrients data analyzed Depth (Dep) dissolved oxygen (DO) oxygen saturation (O2Sat) electrical conductivity (Cond)total phosphorus (TP) orthophosphate (PO4) hydrolysable reactive phosphorus (HdrP) organic phosphorus (OP) total nitrogen (TN) dissolved nitrogen (DIN)ammonium (NH4) nitrate (NO3) nitrite (NO2) total organic carbon (TOC) dissolved organic carbon (DOC) particulate organic carbon (POC) total suspended solids(TSS) fixed suspended solids (FSS) volatile suspended solids (VSS) Minimum value recorded (Min) maximum value recorded (Max) standard deviation to mean(SD)
The proportion of classes in the composition of the phytoplankton community varies throughouthydrological periods (Figure 2A) The Coscinodiscophyceae phytoplankton class had the highestbiovolume during RS the representative species was Aulacoseira spp The Cyanophyceae phytoplanktonclass presented the highest biovolume during HW FL and LW periods The species with the highestbiovolume during HW were Phormidium spp and Aulacoseira granulata var granulata The species that wererepresentative during the FL also presented the highest biovolume in this period were Dolichospermumspp and Gleiterinema splendidum During LW the species Oscilatoria spp and Phormidium spp presentedthe highest biovolume Interestingly the proportion of Cyanophyceae increased along the hydrologicalcycle from RS to LW when the phytoplankton is almost entirely composed (up to 98) of representativesfrom this class Species were distributed in 11 functional groups that contributed to at least 5 of thetotal biovolume in at least one of the hydrological periods (Figure 2B) During RS the functional groupsP Y and Lo comprised 614 of the total biovolume The group P is composed of species adapted toshallow lakes that tolerate high trophic states such Aulacoseira granulata Closterium sp and Fragilariasp The group Y comprises species adapted to lentic ecosystems and in the study was represented byCryptomonas spp The group Lo contains species adapted to deep and shallow lakes that tolerate oligo toeutrophic states such Peridinium spp and Merismopedia spp During HW functional groups were Tc P andLo that represented 582 of the total biovolume The group Tc encompasses species adapted to eutrophicstanding waters or slow-flowing rivers and was here composed by Oscilatoria spp and Phormidium sppDuring FL the group H1 represented 611 of the total biovolume The group H1 comprises speciesadapted to shallow lakes with eutrophic state and low nitrogen content and was here composed byDolichospermum spp that may have the ability to fix nitrogen During LW the group Tc represented770 of total biovolume and Oscilatoria spp comprised about 90 of this total This group encompassesspecies adapted to eutrophic standing waters or slow flowing rivers and was here composed by epiphyticcyanobacteria as Oscillatoria spp and Phormidium spp
Water 2018 10 x FOR PEER REVIEW 7 of 16
32 Biological Data
The proportion of classes in the composition of the phytoplankton community varies throughout hydrological periods (Figure 2A) The Coscinodiscophyceae phytoplankton class had the highest biovolume during RS the representative species was Aulacoseira spp The Cyanophyceae phytoplankton class presented the highest biovolume during HW FL and LW periods The species with the highest biovolume during HW were Phormidium spp and Aulacoseira granulata var granulata The species that were representative during the FL also presented the highest biovolume in this period were Dolichospermum spp and Gleiterinema splendidum During LW the species Oscilatoria spp and Phormidium spp presented the highest biovolume Interestingly the proportion of Cyanophyceae increased along the hydrological cycle from RS to LW when the phytoplankton is almost entirely composed (up to 98) of representatives from this class Species were distributed in 11 functional groups that contributed to at least 5 of the total biovolume in at least one of the hydrological periods (Figure 2B) During RS the functional groups P Y and Lo comprised 614 of the total biovolume The group P is composed of species adapted to shallow lakes that tolerate high trophic states such Aulacoseira granulata Closterium sp and Fragilaria sp The group Y comprises species adapted to lentic ecosystems and in the study was represented by Cryptomonas spp The group Lo contains species adapted to deep and shallow lakes that tolerate oligo to eutrophic states such Peridinium spp and Merismopedia spp During HW functional groups were Tc P and Lo that represented 582 of the total biovolume The group Tc encompasses species adapted to eutrophic standing waters or slow-flowing rivers and was here composed by Oscilatoria spp and Phormidium spp During FL the group H1 represented 611 of the total biovolume The group H1 comprises species adapted to shallow lakes with eutrophic state and low nitrogen content and was here composed by Dolichospermum spp that may have the ability to fix nitrogen During LW the group Tc represented 770 of total biovolume and Oscilatoria spp comprised about 90 of this total This group encompasses species adapted to eutrophic standing waters or slow flowing rivers and was here composed by epiphytic cyanobacteria as Oscillatoria spp and Phormidium spp
Figure 2 Relative phytoplankton class biomass (A) and functional groups biomass (B) Rising period (RS) high-water period (HW) flushing period (FL) low-water period (LW) BndashGndashH1ndashLondashMndashMPndashPndashS1ndashTcndashW1ndashY are functional groups that had at least 5 of total biovolume in at least one hydrological period Others are the sum of functional groups that did not respect the 5 threshold
33 Statistical Results
The STI test indicated that the space-time interaction is not significant That is there was no significant influence of space-time on the structuring of the phytoplankton community at the functional group level The second step returned that only time had a significant importance in structuring the phytoplankton community hence indicating that spatial distribution of sample units
Figure 2 Relative phytoplankton class biomass (A) and functional groups biomass (B) Rising period (RS)high-water period (HW) flushing period (FL) low-water period (LW) BndashGndashH1ndashLondashMndashMPndashPndashS1ndashTcndashW1ndashYare functional groups that had at least 5 of total biovolume in at least one hydrological period Others arethe sum of functional groups that did not respect the 5 threshold
Water 2019 11 154 8 of 17
33 Statistical Results
The STI test indicated that the space-time interaction is not significant That is there was nosignificant influence of space-time on the structuring of the phytoplankton community at the functionalgroup level The second step returned that only time had a significant importance in structuring thephytoplankton community hence indicating that spatial distribution of sample units had no significantinfluence (Table 2) The time influence indicates that the hydrological cycle was the main factor in thedynamics of the phytoplankton community The partial redundancy analysis (pRDA) for partitionenvironmental data shows that both nutrients and hydrological variables had a significant influence instructuring the phytoplankton community but the strength of the nutrients partition was higher thanthat of hydrological variables (Table 2) The pRDA also returns a great residual indicating that therewere other important factors not measured which influenced the phytoplankton community structure
Table 2 Results of the space-time interaction test (STI) and pRDA tests Space-time interaction(Space + Time) common temporal structures (Time) common spatial structure (Space) variation dueto nutrients (Nutr) variations due to nutrients and hydrology together (Nutr + Hydr) variations dueto hydrology (Hydr) not-explanable variation (Res) adjusted R2 value (AdjR2) significance (p lt 005)
The STATICO analysis showed stability in the phytoplanktonndashnutrient relationship along periodsas illustrated by the longer arrows in the interstructure graph (Figure 3A) In these graphs thegreater length of arrows (or in case of points the distance from the center) the higher the stability inthis relationship However the weight of each hydrological period on the phytoplanktonndashnutrientsrelationship was different (Figure 3B) The first and second axes represented respectively 19 and 10of the total variability The first axis (horizontal axis) in the compromise graph (Figure 3C) accountedfor 42 of the explained variance and the second axis (vertical axis) accounted for 20 of the explainedvariance and was less significant Flushing and low-water periods were more related to the firstaxis which has twice the explanatory power of the second axis Hence the phytoplanktonndashnutrientsrelationship might be considered stronger during these two periods
As shown by the environmental variables compromise plot (Figure 3C) the first axis (horizontal)was more related to hydrolyzable phosphorus and suspended solids The second axis (vertical) wasmore related with PO4 and NO2 (Figure 3C) Other variables such as conductivity and oxygen arerelated to both axes and also have a great compromise (long arrow) The environmental variableswith shorter arrows have weak stability with the hydrological cycle and are more related to a specificperiod as detailed below For the functional groups compromise plot (Figure 3D) the most importantgroups are those more distant to the center of the graph The FGrsquos MP and H1 although have greatstability with the hydrological cycle also play an important role on specific period (Figure 4)
Water 2019 11 154 9 of 17
1
Figure 3 STATICO graph The length of arrows (AndashC) or distance from the center (D) indicatesthe strength of a relationship Interstructure graph (A) weight of each hydrological period (B)environmental and nutrients compromise (C) species compromise (D)
Water 2018 10 x FOR PEER REVIEW 9 of 16
Figure 3 STATICO graph The length of arrows (AndashC) or distance from the center (D) indicates the strength of a relationship Interstructure graph (A) weight of each hydrological period (B) environmental and nutrients compromise (C) species compromise (D)
As shown by the environmental variables compromise plot (Figure 3C) the first axis (horizontal) was more related to hydrolyzable phosphorus and suspended solids The second axis (vertical) was more related with PO4 and NO2 (Figure 3C) Other variables such as conductivity and oxygen are related to both axes and also have a great compromise (long arrow) The environmental variables with shorter arrows have weak stability with the hydrological cycle and are more related to a specific period as detailed below For the functional groups compromise plot (Figure 3D) the most important groups are those more distant to the center of the graph The FGrsquos MP and H1 although have great stability with the hydrological cycle also play an important role on specific period (Figure 4)
Figure 4 Multiple Regression Tree (MRT) map Rising period (RS) high-water period (HW) flushing period (FL) low-water period (LW) species indicator value (Ind-Val) significance (p) adjusted R2 (R2) cross-validation error (CVRE) Groups 1 to 5 MRT clusters results
MRT applied to the data resulted in five groups the model explained 71 of the phytoplankton data variability (adjR2 = 071) The predictive power of the model expressed as the cross-validation relative error (CVRE) was 095 MRT clearly separated LW samples (22 samples) apart from those collected during the other periods based on NO3 concentration (Figure 4) LW samples belonged to group 5 with low NO3 concentration Further group divisions were based successively upon particulate organic carbon total organic carbon and conductivity Interestingly similarly as LW period all samples from the FL period are gathered into a single group (group 1) characterized by high NO3 POC and TOC concentrations whereas samples collected during HW or RS are spread over three groups A majority of samples collected in HW were gathered into group 4 (high NO3 high POC and low Cond) and those collected during RS mostly divided into two groups a majority in group 3 (high NO3 high POC high Cond) Indicator value (Ind-Val) coupled with MRT analysis enabled extracting sets of FGrsquos indicators of the MRT groups (Figure 4) Based on the Ind-Val four groups are characterized by seven significant FGs (p lt 005) Group 2 does not have any FG indicators with a significative value
4 Discussion
41 Space-Time Components and Environmental Partitions
As we expected the hydrological variation (time) is a more significant factor of structuration of the functional phytoplankton community than the environmental spatial variability (space) Besides
Figure 4 Multiple Regression Tree (MRT) map Rising period (RS) high-water period (HW) flushingperiod (FL) low-water period (LW) species indicator value (Ind-Val) significance (p) adjusted R2 (R2)cross-validation error (CVRE) Groups 1 to 5 MRT clusters results
Water 2019 11 154 10 of 17
MRT applied to the data resulted in five groups the model explained 71 of the phytoplanktondata variability (adjR2 = 071) The predictive power of the model expressed as the cross-validationrelative error (CVRE) was 095 MRT clearly separated LW samples (22 samples) apart from thosecollected during the other periods based on NO3 concentration (Figure 4) LW samples belongedto group 5 with low NO3 concentration Further group divisions were based successively uponparticulate organic carbon total organic carbon and conductivity Interestingly similarly as LW periodall samples from the FL period are gathered into a single group (group 1) characterized by high NO3POC and TOC concentrations whereas samples collected during HW or RS are spread over threegroups A majority of samples collected in HW were gathered into group 4 (high NO3 high POCand low Cond) and those collected during RS mostly divided into two groups a majority in group3 (high NO3 high POC high Cond) Indicator value (Ind-Val) coupled with MRT analysis enabledextracting sets of FGrsquos indicators of the MRT groups (Figure 4) Based on the Ind-Val four groups arecharacterized by seven significant FGs (p lt 005) Group 2 does not have any FG indicators with asignificative value
4 Discussion
41 Space-Time Components and Environmental Partitions
As we expected the hydrological variation (time) is a more significant factor of structuration ofthe functional phytoplankton community than the environmental spatial variability (space) Besidesthe STI test the STATICO also showed that most of the phytoplankton community variation is stronglylinked with variables related with hydrological conditions (TSS Cond) MRT further confirmed thegroups according to the hydrological periods The analyses show that only the hydrological variationis strong enough to produce functional changes in the phytoplankton community and this reflects theimportance of flood pulse dynamics in the Amazon basin In fact the hydrological variation or floodpulse is acknowledged as a strength that can promote changes in these environments and biologicalcommunities in several studies [367071] In addition our results showed that these changes are morerelated to nutrients changes (and especially nitrogen changes as indicated by MRT) than changes inanother factors (among those we have measured) Indeed the partition test showed that although thehydrological variables measured were significant in structuring the community the nutrients variableswere two times more decisive in this process thus confirming our starting hypothesis In addition thepartition involving both variables (Hydr + Nutr) has the same proportion than that of the nutrientspartition The hydrological annual variability promotes a lot of changes over the year and one of themis a variability of the different kinds of nutrients In general we measured only total nitrogen and totalphosphorus when performing research in this field for many reasons but the different fractions ofnitrogen and phosphorus compounds have different influences on the phytoplankton community
42 Nutrients-Phytoplankton Relationships over Hydrological Cycle
Our results showed that over the hydrological year (i) the interaction between phytoplanktoncommunity and phosphorus compounds is more stable than that of nitrogen compounds (Figure 3CD)and (ii) that the rising period has the weakest weight in the phytoplanktonndashnutrients interaction(Figure 3B) While the phytoplankton biovolume becomes higher the weight of the relationship insubsequent hydrological periods increases suggesting that there are both top-down and bottom-upcontrols for the phosphorus and nitrogen cycles in tropical floodplain system Top-down refers to theinput which occurs in the rising period from waters coming from the Amazon river while bottom-uprefers to phosphorus (or nitrogen) cycle processes occurring inside the floodplain
Regarding phosphorus our results suggest that bottom-up control is stronger than top-down orin other words that phosphorus compounds already present or in situ recycled in the system havea greater influence upon phytoplankton than allogenic phosphorus compounds It is well knownthat Amazonian rivers that drain the Andes (classified as white-water rivers according to Sioli 1984
Water 2019 11 154 11 of 17
typology) [47] carry high concentration in suspended solids and dissolved and sediment-boundnutrients [37] The river incursion across the floodplain during rising brings nutrients and sedimentinto the floodplain ecosystems and promotes a high peak in primary productivity [3972] However ourresults also showed that the phytoplanktonndashphosphorus relationship is stable along the hydrologicalyear Many processes can participate to maintain a rather constant concentration of phosphorus in thewater column Seasonal herbaceous plants that pump nutrients from the sediment to support theirgrowth and release nutrients in the water column during their decay [7374] sediment early diagenesisprocesses and resuspension may also participate [74]
Although weaker than with phosphorus compounds our results showed that there is a stableinteraction between nitrogen compounds (TN and DIN) and phytoplankton Wetlands such asfloodplains can be considered aggrading ecosystems where the nitrogen can come from adjacentdrained areas or the mainstream and in some cases from biological nitrogen fixation and atmosphericdeposition [75ndash77] The phytoplankton primary productivity peak occurring in the rising period isfollowed by a significant increase of nitrogen-fixing cyanobacteria biovolume Nitrogen fixation is anessential process for eutrophic wetlands once it may contribute from 5 to 80 of the total nitrogeninputs in these systems [8] NO3 is the most common reactive nitrogen species [74] and the highconcentration in flushing period allied to higher biovolume of FG H1 suggest that nitrogen-fixingprocess plays an essential role in maintaining the stability along the hydrological cycle
Besides nitrogen-fixation processes the increases in nitrogen compounds between rising andsubsequent periods similar to phosphorus can be influenced by processes mentioned above especiallythe seasonal herbaceous plants growthdecay cycle that may release NH4 and NO3 in the watercolumn Thus the sediment nutrients pool mobilization is another crucial factor that permits thenitrogen concentration to remain stable during the hydrological cycle Hence like phosphorusthe phytoplanktonndashnitrogen interaction also suggests that there is both a top-down and bottom-upinteraction for its cycle in tropical floodplain system
The idea that the phytoplankton has the potential to influence pools of nitrogen and phosphorusthat would be available is not new [77] but works with this approach are scarce in tropicalenvironments For temperate lakes the work of Cottingham et al [77] has demonstrated thatcyanobacteria have the potential to drive nitrogen and phosphorus cycles in lakes They remarkedthat the ability of many cyanobacterial taxa to fix nitrogen and to access pools of phosphorus insediments and bottom waters is the key behind this influence Their work suggests that cyanobacterialblooms warrant attention as potential drivers of the transition from a low-nutrient clear-water regimeto a high-nutrient turbid-water regime Our results show that there is a considerable increase incyanobacteria biovolume but it is difficult to know how much is a consequence of allochthonousnitrogen inputs and how much is a consequence of autochthonous nitrogen inputs However it iscertain that this increase is an important factor for maintaining the stability of nutrients over thehydrological cycle Thus the cyanobacteria dynamics are an essential factor in both nutrients cyclingand phytoplankton dynamics Increases in nutrients leading to a dominance of cyanobacteria havebeen reported by Dokulil and Teubner [78] and in Curuai Affonso et al [79] they found that theflushing period was the most eutrophic period Thus the extent to which the floodplain becomesshallow and water flow less intense the cyanobacteria community can be established [80]
43 Cyanobacteria Dynamics
The results showed that while the phytoplankton biomass increased and the environment becamemore eutrophic the phytoplankton functional group diversity was decreasing until the phytoplanktonwas almost entirely composed by the cyanobacteria group Even if phytoplankton species differ intheir nutritional requirements [81] and although nitrogen and phosphorus are essential factors for thephytoplankton growth they are not the unique Other factors play a vital role for the phytoplanktonin specific periods Unlike during the flushing and low-water periods samples collected during therising and high-water periods spread over a larger number of MRT groups with functional groups
Water 2019 11 154 12 of 17
with significant Ind-Val The Amazon river incursion extent across the floodplain the flow magnitudeand the mixture of this inflow with the water residing on the floodplain cause a significant directionalgradient [82] Additinoally the rising period is probably the period that is the most influenced by thefloodplain geomorphology The FG Y has a significant value of Ind-Val for 13 sites in rising periodand it is an indication that this period is marked by a great dynamism Indeed the group Y refers to awide range of habitats thus reflecting the ability of species to live in almost all lentic ecosystems [30]During the high-water period a majority of the samples were gathered into a group that exhibitedthree functional groups with significant Ind-Val These results are an indication of heterogeneity andof a state of a transition period
The reduction of water speed and input of nutrients from the previous periods turns theenvironment favorable to cyanobacteria community development High NO3 concentration withlower concentrations of POC and higher concentrations of TOC characterize all sites in the flushingperiod NO3 and NH4 are the preferred uptake forms of nitrogen by phytoplankton but NH4 mighthave an inhibitory or repressive effect in NO3 uptake and assimilation [10] During the flushing periodNH4 is very low while NO3 is high A condition that favors the NO3 uptake by the phytoplanktonduring this period During this period also POC was very low and TOC was almost entirely in DOCform As mentioned in Moreira-Turc et al [42] contrasting with the rising period when DOC is mainlyimported from the Amazon River high DOC lability is expected during the flushing period because itis mainly originating from phytoplankton production Higher labile DOC concentration also helpsto provide nutrients for the development and establishment of the cyanobacteria community [16ndash18]Lowest concentrations of NH4 also favor the increase of nitrogen-fixing cyanobacteria and our resultsshow that functional group H1 composed of species with nitrogen-fixing ability has a significativeInd-Val for samples collected during the flushing period NO3 depletion characterized almost allthe samples collected during the low-water period while NO2 increased Due to lowest waterlevel and increasing interaction between water column and sediment denitrification bacteria in thesediment (that might have anoxia or hypoxia condition) can be responsible for the characteristics of thelow-water period Even though the low-water period was composed almost entirely by one functionalgroup the Ind-Val comprised two groups with significant indicator-values composed of speciesadapted to eutrophic waters and shallow turbid lakes with the presence of inorganic compoundsThese results demonstrate that despite the dominance of cyanobacteria the conditions begin to befavorable for the establishment of other phytoplankton groups that will encounter favorable conditionsduring the next hydrological cycle
5 Conclusions
Our analyses confirm the predominant role of hydrology upon the phytoplankton communityThe seasonal hydrological variation is strong enough to produce functional changes in phytoplanktoncommunity especially because the changes in nitrogen and phosphorus contents and chemicalspeciation along the water year Besides biogeochemical processes in tropical floodplain lakessuch as the Curuai floodplain lake enable maintaining phytoplankton nutrient requirements evenlong after the nutrient inputs from the river water has declined The nutrient inputs in rising periodsincreases the phytoplankton biomass which becomes dominated by cyanobacteria during the low-waterperiod The cyanobacteria allied to other organisms (not evaluated in this study such as macrophytesand bacteria) play an important role in maintaining the stability of nutrients along hydrologicalperiods Interestingly it was possible to identify a limited number of phytoplankton functional groupsindicating the particular environmental conditions during the flushing and low-water periods Duringthe rising and high-water periods the environmental and biological conditions seem to be morespatially structured in part because of higher water contribution from the local watershed at theseperiods These features highlight the large variability in phytoplankton activities in tropical floodplainecosystems that may cause issues for the global Amazonian trophic chain Although our studycontributes disentangling hydrology and nutrients control upon the phytoplankton community and
Water 2019 11 154 13 of 17
better understands how the nutrientsndashphytoplankton relationship changes along the water year stillmore research is required upon the phytoplanktonndashnutrient relationship in tropical aquatic ecosystemsMost of the knowledge upon this relationship is based on experimental investigations and researchin temperate environments and thus limiting our understanding of what controls such processes intropical freshwater ecosystems
Author Contributions CNK and M-PB were mainly responsible for the development and organization of thework IdSN and MTMPSL assisted in the taxonomic identification of the phytoplankton community and inthe ecological interpretation of community results DdMM contributed to the analytical procedure of water andthe ecological interpretation of the data obtained JG assisted with the geochemical assessment LCGV assistedin the development and analysis of statistical data applied to the ecological community
Funding The authors are very grateful to the two anonymous revisors their constructive comments helped tosubstancially improve the manuscript This research was done under the auspices of CNPq (Conselho Nacionalde Desenvolvimento Cientiacutefico e Tecnoloacutegico Brazil) CAPES (Coordenaccedilatildeo de Aperfeiccediloamento de Pessoalde Niacutevel Superior Brazil) IRD (Institut de Recherche pour le Deacuteveloppement grant number 4906342013-3France) and LMI OCE (Laboratoire Mixte International lsquoObservatoire des Changements Environnementauxrsquo)and of three research programs Clim-FABIAM which was funded by FRB (Fondation pour la Recherche sur laBiodiversiteacute) and Bloom-ALERT which was funded by the GUYAMAZON program (IRDCIRADAmbassadede FranceFAPEAM) and INCT nordm 16- 2014 ODISSEIA with funding from CNPqCAPESFAP-DF The paperalso received funding from the European Unionrsquos Horizon 2020 Research and innovation program under theMarie SkłodowskamdashCurie grant agreement Nordm 691053
Conflicts of Interest The authors declare no conflict of interest
References
1 Fiore MDF Neilan BA Copp JN Rodrigues JLMM Tsai SM Lee H Trevors JT Characterizationof nitrogen-fixing cyanobacteria in the Brazilian Amazon floodplain Water Res 2005 39 5017ndash5026[CrossRef] [PubMed]
2 Schindler DW The dilemma of controlling cultural eutrophication of lakes Proc R Soc B Biol Sci 2012279 4322ndash4333 [CrossRef] [PubMed]
3 Paerl HW Gardner WS Havens KE Joyner AR McCarthy MJ Newell SE Qin B Scott JTMitigating cyanobacterial harmful algal blooms in aquatic ecosystems impacted by climate change andanthropogenic nutrients Harmful Algae 2016 54 213ndash222 [CrossRef] [PubMed]
4 Thomas MK Litchman E Effects of temperature and nitrogen availability on the growth of invasive andnative cyanobacteria Hydrobiologia 2016 763 357ndash369 [CrossRef]
5 Schindler DW Hecky RE Findlay DL Stainton MP Parker BR Paterson MJ Beaty KG Lyng MKasian SEM Eutrophication of lakes cannot be controlled by reducing nitrogen input Results of a 37-yearwhole-ecosystem experiment Proc Natl Acad Sci USA 2008 105 11254ndash11258 [CrossRef] [PubMed]
6 Conley DJ Paerl HW Howarth RW Boesch DF Seitzinger SP Havens KE Lancelot C Likens GEControlling Eutrophication Nitrogen and Phosphorus Science 2009 [CrossRef]
7 Howarth RW Nutrient Limitation of Net Primary Production in Marine Ecosystems Annu Rev Ecol Syst1988 19 89ndash110 [CrossRef]
8 Lewis WM Wurtsbaugh WA Paerl HW Rationale for Control of Anthropogenic Nitrogen andPhosphorus to Reduce Eutrophication of Inland Waters Environ Sci Technol 2011 45 10300ndash10305[CrossRef] [PubMed]
9 Elser JJ Bracken MES Cleland EE Gruner DS Harpole WS Hillebrand H Ngai JTSeabloom EW Shurin JB Smith JE Global analysis of nitrogen and phosphorus limitation of primaryproducers in freshwater marine and terrestrial ecosystems Ecol Lett 2007 10 1135ndash1142 [CrossRef]
10 Abell JM Oumlzkundakci D Hamilton DP Nitrogen and Phosphorus Limitation of Phytoplankton Growthin New Zealand Lakes Implications for Eutrophication Control Ecosystems 2010 13 966ndash977 [CrossRef]
11 Thad Scott J McCarthys MJ Nitrogen fixation may not balance the nitrogen pool in lakes over timescalesrelevant to eutrophication management Limnol Oceanogr 2010 55 1265ndash1270 [CrossRef]
12 Scheffer M Van Nes EH Shallow lakes theory revisited Various alternative regimes driven by climatenutrients depth and lake size Hydrobiologia 2007 584 455ndash466 [CrossRef]
Water 2019 11 154 14 of 17
13 Janssen ABG Teurlincx S An S Janse JH Paerl HW Mooij WM Alternative stable states in largeshallow lakes J Great Lakes Res 2014 40 813ndash826 [CrossRef]
14 Jeppesen E Meerhoff M Davidson TA Trolle D Soslashndergaard M Lauridsen TL Beklioglu MBrucet S Volta P Gonzaacutelez-Bergonzoni I et al Climate change impacts on lakes An integrated ecologicalperspective based on a multi-faceted approach with special focus on shallow lakes J Limnol 2014 7388ndash111 [CrossRef]
15 Lobo MTMPS de Souza Nogueira I Fabris Sgarbi L Nunes Kraus C de Oliveira Bomfim E Garnier Jda Motta Marques D Bonnet M-P Morphology-based functional groups as the best tool to characterizeshallow lake-dwelling phytoplankton on an Amazonian floodplain Ecol Indic 2018 95 579ndash588 [CrossRef]
16 Lampert W Sommer U Limnoecology Oxford University Press Oxford UK 2007 ISBN 978-0-19-921392-417 Soslashndergaard M Jensen JP Jeppesen E Role of sediment and internal loading of phosphorus in shallow
lakes Hydrobiologia 2003 506ndash509 135ndash14518 Scheffer M Rinaldi S Gragnani A Mur LR van Nes EH On the Dominance of Filamentous
Cyanobacteria in Shallow Turbid Lakes Ecology 1997 78 272 [CrossRef]19 Hays SG Ducat DC Engineering cyanobacteria as photosynthetic feedstock factories Photosynth Res
2014 123 1ndash11 [CrossRef]20 Benoiston A-S Ibarbalz FM Bittner L Guidi L Jahn O Dutkiewicz S Bowler C The evolution of
diatoms and their biogeochemical functions Philos Trans R Soc B Biol Sci 2017 372 20160397 [CrossRef]21 Peace A Effects of light nutrients and food chain length on trophic efficiencies in simple stoichiometric
aquatic food chain models Ecol Model 2015 312 125ndash135 [CrossRef]22 OrsquoNeil JM Davis TW Burford MA Gobler CJ The rise of harmful cyanobacteria blooms The potential
roles of eutrophication and climate change Harmful Algae 2012 14 313ndash334 [CrossRef]23 Catherine Q Susanna W Isidora ES Mark H Aureacutelie V Jean-Franccedilois H A review of current
knowledge on toxic benthic freshwater cyanobacteriamdashEcology toxin production and risk managementWater Res 2013 47 5464ndash5479 [CrossRef]
24 Boopathi T Ki J-S Impact of Environmental Factors on the Regulation of Cyanotoxin Production Toxins2014 6 1951ndash1978 [CrossRef] [PubMed]
25 Rastogi RP Madamwar D Incharoensakdi A Bloom dynamics of cyanobacteria and their toxinsEnvironmental health impacts and mitigation strategies Front Microbiol 2015 6 1ndash22 [CrossRef] [PubMed]
26 Sukenik A Quesada A Salmaso N Global expansion of toxic and non-toxic cyanobacteria Effect onecosystem functioning Biodivers Conserv 2015 24 889ndash908 [CrossRef]
27 Vilmi A Karjalainen SM Landeiro VL Heino J Freshwater diatoms as environmental indicators Evaluatingthe effects of eutrophication using species morphology and biological indices Environ Monit Assess 2015187 243 [CrossRef]
28 Dolman AM Ruumlcker J Pick FR Fastner J Rohrlack T Mischke U Wiedner C Cyanobacteria andcyanotoxins The influence of nitrogen versus phosphorus PLoS ONE 2012 7 e38757 [CrossRef]
29 LONGHI ML BEISNER BE Patterns in taxonomic and functional diversity of lake phytoplanktonFreshw Biol 2010 55 1349ndash1366 [CrossRef]
30 Colina M Calliari D Carballo C Kruk C A trait-based approach to summarizezooplanktonndashphytoplankton interactions in freshwaters Hydrobiologia 2015 767 221ndash233 [CrossRef]
31 Salmaso N Naselli-Flores L Padisaacutek J Functional classifications and their application in phytoplanktonecology Freshw Biol 2015 60 603ndash619 [CrossRef]
32 Reynolds CS Huszar V Kruk C Naselli-Flores L Melo SS Towards a functional classification of thefreshwater phytoplankton J Plankton Res 2002 24 417ndash428 [CrossRef]
33 Padisaacutek J Crossetti LO Naselli-Flores L Use and misuse in the application of the phytoplanktonfunctional classification A critical review with updates Hydrobiologia 2009 621 1ndash19 [CrossRef]
34 Kruk C Huszar VLM Peeters ETHM Bonilla S Costa L Luumlrling M Reynolds CS Scheffer M Amorphological classification capturing functional variation in phytoplankton Freshw Biol 2010 55 614ndash627[CrossRef]
35 Machado KB Borges PP Carneiro FM de Santana JF Vieira LCG de Moraes Huszar VLNabout JC Using lower taxonomic resolution and ecological approaches as a surrogate for planktonspecies Hydrobiologia 2015 743 255ndash267 [CrossRef]
Water 2019 11 154 15 of 17
36 Junk WJ Bayley PB Sparks RE The flood pulse concept in river-floodplain systems Can Spec PublFish Aquat Sci 1989 106 110ndash127
37 Junk WJ Piedade MTF Schoumlngart J Wittmann F A classification of major natural habitats of Amazonianwhite-water river floodplains (vaacuterzeas) Wetl Ecol Manag 2012 20 461ndash475 [CrossRef]
38 Tockner K Malard F Ward JV An extension of the flood pulse concept Hydrol Process 2000 142861ndash2883 [CrossRef]
39 Bonnet MPP Barroux G Martinez JMM Seyler F Moreira-Turcq P Cochonneau G Melack JMMBoaventura G Maurice-Bourgoin L Leoacuten JGG et al Floodplain hydrology in an Amazon floodplainlake (Lago Grande de Curuaiacute) J Hydrol 2008 349 18ndash30 [CrossRef]
40 Junk WJ Wantzen KM The flood pulse concept New aspects approaches and applicationsmdashAn updateIn Proceedings of the Second International Symposium on the Management of Large Rivers for FisheriesRome Italy 11ndash14 February 2003 pp 117ndash149
41 Bonnet M-P Pinel S Garnier J Bois J Resende Boaventura G Seyler P Motta Marques D Amazonianfloodplain water balance based on modelling and analyses of hydrologic and electrical conductivity dataHydrol Process 2017 31 1702ndash1718 [CrossRef]
42 Kraus CN Bonnet MP Miranda CA de Souza Nogueira I Garnier J Vieira LCG InterannualHydrological Variation and Ecological Phytoplankton Patterns in Amazonian Floodplain Lakes Hydrobiologia2018 [CrossRef]
43 Sioli H The Amazon and its main affluents Hydrography morphology of the river courses and river typesIn The Amazon Limnology and Landscape Ecology of a Mighty Tropical River and Its Basin Sioli H Ed SpringerDordrecht The Netherlands 1984 pp 127ndash165 ISBN 978-94-009-6542-3
44 Moquet JS Crave A Viers J Seyler P Armijos E Bourrel L Chavarri E Lagane C Laraque ACasimiro WSL et al Chemical weathering and atmosphericsoil CO(2) uptake in the Andean and ForelandAmazon basins Chem Geol 2011 287 1ndash26 [CrossRef]
45 Park E Latrubesse EM Water resources research Water Resour Res 2015 51 9127ndash914046 Bonnet MP Garnier J Barroux G Boaventura GR Seyler P Mse CC Bataillon PE Biogeochemical
functioning of amazonian floodplains The case of lago Grande de Curuai In Riparian Zones CharacteristicsManagement Practices and Ecological Impacts Environmental Research Advances Pokrovsky OS Viers J EdsNova Science Publishers New York NY USA 2016 pp 1ndash22 ISBN 978-1-63484-636-3
47 APHA Standard Methods for Examination of Water and Wastewater (Standard Methods for the Examination of Waterand Wastewater) Standard Methods American Public Health Association (APHA) Washington DC USA1998 pp 5ndash16
48 Utermoumlhl H Zur vervollkommnung der quantitativen phytoplankton-methodik Mitt Int Ver Angew Limnol1958 9 1ndash38 [CrossRef]
49 Lund JWG Kipling C Le Cren ED The inverted microscope method of estimating algal numbers andthe statistical basis of estimations by counting Hydrobiologia 1958 11 143ndash170 [CrossRef]
50 Guiry MD Guiry GM AlgaeBase World-Wide Electronic Publication Available online httpwwwalgaebaseorg (accessed on 20 October 2018)
51 Hillebrand H Duumlrselen C-D Kirschtel D Pollingher U Zohary T Biovolume Calculation for Pelagicand Benthic Microalgae J Phycol 1999 35 403ndash424 [CrossRef]
52 Kruk C Mazzeo N Lacerot G Reynolds CS Classification schemes for phytoplankton A local validationof a functional approach to the analysis of species temporal replacement J Plankton Res 2002 24 901ndash912[CrossRef]
53 Thioulouse J Simultaneous analysis of a sequence of paired ecological tables A comparison of severalmethods Ann Appl Stat 2012 5 2300ndash2325 [CrossRef]
54 Dray S Chessel D Thioulouse J Co-Inertia Analysis and the Linking of Ecological Data Tables Ecology2003 84 3078ndash3089 [CrossRef]
55 Blanchet FG Legendre P Borcard D Forward selection of explanatory variables Ecology 2008 892623ndash2632 [CrossRef]
56 Dersquoath G Multivariate Regression Tree A New Technique for Modeling SpeciesndashEnvironment RelationshipsEcology 2002 83 1105ndash1117
57 Borcard D Gillet F Legendre P Community Diversity In Numerical Ecology with R Springer BerlinHeidelbergGermany 2018 pp 369ndash412
Water 2019 11 154 16 of 17
58 DersquoAth G Fabricius KE Classification and regression trees A powerful yet simple technique for ecologicaldata analysis Ecology 2000 81 3178ndash3192 [CrossRef]
59 Therneau TM Atkinson B Ripley B Oksanen J Dersquoath G MVpart A Package for Running MultivariateRegression Trees in R Software Available online httpscranr-projectorgsrccontribArchivemvpart(accessed on 30 November 2018)
60 Ouellette MH Legendre P MVPARTwrap Additional Features for Package Mvpart R Package Version01-92 Available online httpscranr-projectorgsrccontribArchiveMVPARTwrap (accessed on 30November 2018)
61 Dufrecircne M Legendre P Species assemblages and indicator species The need for a flexible asymmetricalapproach Ecol Monogr 1997 67 345ndash366 [CrossRef]
62 Wu Z Shi J Li R Comparative studies on photosynthesis and phosphate metabolism of Cylindrospermopsisraciborskii with Microcystis aeruginosa and Aphanizomenon flos-aquae Harmful Algae 2009 8 910ndash915[CrossRef]
63 Ni Z Wang S Wang Y Characteristics of bioavailable organic phosphorus in sediment and its contributionto lake eutrophication in China Environ Pollut 2016 219 537ndash544 [CrossRef] [PubMed]
64 Junk WJ The flood pulse concept of large rivers Learning from the tropics Large Rivers 1999 11 261ndash280[CrossRef]
65 Zhou J Lau KM Principal modes of interannual and decadal variability of summer rainfall over SouthAmerica Int J Clim 2001 21 1623ndash1644 [CrossRef]
66 Osborne PL Tropical Ecosystems and Ecological Concepts Cambridge University Press Cambridge UK 2000ISBN 0521645239
67 Silva TSF Melack JM Novo EMLM Responses of aquatic macrophyte cover and productivity toflooding variability on the Amazon floodplain Glob Chang Biol 2013 19 3379ndash3389 [CrossRef] [PubMed]
68 Schlesinger WH Reckhow KH Bernhardt ES Global change The nitrogen cycle and rivers Water Resour Res2006 42 5ndash6 [CrossRef]
70 Peterson BJ Wollheim WM Mulholland PJ Webster JR Meyer JL Tank JL Marti E Bowden WBValett HM Hershey AE et al Control of nitrogen export from watersheds by headwater streams Science2001 292 86ndash90 [CrossRef]
71 Burkart MR Stoner JD Nitrogen in Groundwater Associated with Agricultural Systems Nitrogen Environ2008 177ndash202 [CrossRef]
72 Xiao M Willis A Burford MA Differences in cyanobacterial strain responses to light and temperaturereflect species plasticity Harmful Algae 2017 62 84ndash93 [CrossRef] [PubMed]
73 Cottingham KL Ewing HA Greer ML Carey CC Weathers KC Cyanobacteria as biological driversof lake nitrogen and phosphorus cycling Ecosphere 2015 6 1ndash9 [CrossRef]
74 Dokulil MT Teubner K Cyanobacterial dominance in lakes Hydrobiologia 2000 438 1ndash12 [CrossRef]75 Johnston CA Sediment and nutrient retention by freshwater wetlands Effects on surface water quality
Crit Rev Environ Control 1991 21 491ndash565 [CrossRef]76 Nogueira IDS Nabout JC Ibantildeez MDSR Bourgoin LM Rodrigues S Determinants of beta diversity
The relative importance of environmental and spatial processes in structuring phytoplankton communitiesin an Amazonian floodplain Acta Limnol Bras 2010 22 247ndash256 [CrossRef]
77 Affonso A Barbosa C Novo E Water quality changes in floodplain lakes due to the Amazon River floodpulse Lago Grande de Curuaiacute (Paraacute) Braz J Biol 2011 71 601ndash610 [CrossRef] [PubMed]
78 Reynolds CS Descy J-P Padisagravek J Are phytoplankton dynamics in rivers so different from those inshallow lakes Hydrobiologia 1994 289 1ndash7 [CrossRef]
79 Shan K Li L Wang X Wu Y Hu L Yu G Song L Modelling ecosystem structure and trophicinteractions in a typical cyanobacterial bloom-dominated shallow Lake Dianchi China Ecol Model 2014291 82ndash95 [CrossRef]
80 Barbosa CCF Moraes Novo EML Melack JM Gastil-Buhl M Filho WP Geospatial analysis ofspatiotemporal patterns of pH total suspended sediment and chlorophyll-a on the Amazon floodplainLimnology 2009 11 155ndash166 [CrossRef]
Water 2019 11 154 17 of 17
81 Bourgoin LM Bonnet M-P Martinez J-M Kosuth P Cochonneau G Moreira-Turcq P Guyot J-LVauchel P Filizola N Seyler P Temporal dynamics of water and sediment exchanges between the Curuaiacutefloodplain and the Amazon River Brazil J Hydrol 2007 335 140ndash156 [CrossRef]
82 Mulholland PJ Helton AM Poole GC Hall RO Hamilton SK Peterson BJ Tank JLAshkenas LR Cooper LW Dahm CN et al Stream denitrification across biomes and its response toanthropogenic nitrate loading Nature 2008 452 202ndash205 [CrossRef] [PubMed]
copy 2019 by the authors Licensee MDPI Basel Switzerland This article is an open accessarticle distributed under the terms and conditions of the Creative Commons Attribution(CC BY) license (httpcreativecommonsorglicensesby40)
Introduction
Materials and Methods
Environmental and Phytoplankton Data
Data Analysis
Results
Hydrological and Nutrients Data
Biological Data
Statistical Results
Discussion
Space-Time Components and Environmental Partitions
Nutrients-Phytoplankton Relationships over Hydrological Cycle
Cyanobacteria Dynamics
Conclusions
References
Water 2019 11 154 7 of 17
32 Biological Data
The proportion of classes in the composition of the phytoplankton community varies throughouthydrological periods (Figure 2A) The Coscinodiscophyceae phytoplankton class had the highestbiovolume during RS the representative species was Aulacoseira spp The Cyanophyceae phytoplanktonclass presented the highest biovolume during HW FL and LW periods The species with the highestbiovolume during HW were Phormidium spp and Aulacoseira granulata var granulata The species that wererepresentative during the FL also presented the highest biovolume in this period were Dolichospermumspp and Gleiterinema splendidum During LW the species Oscilatoria spp and Phormidium spp presentedthe highest biovolume Interestingly the proportion of Cyanophyceae increased along the hydrologicalcycle from RS to LW when the phytoplankton is almost entirely composed (up to 98) of representativesfrom this class Species were distributed in 11 functional groups that contributed to at least 5 of thetotal biovolume in at least one of the hydrological periods (Figure 2B) During RS the functional groupsP Y and Lo comprised 614 of the total biovolume The group P is composed of species adapted toshallow lakes that tolerate high trophic states such Aulacoseira granulata Closterium sp and Fragilariasp The group Y comprises species adapted to lentic ecosystems and in the study was represented byCryptomonas spp The group Lo contains species adapted to deep and shallow lakes that tolerate oligo toeutrophic states such Peridinium spp and Merismopedia spp During HW functional groups were Tc P andLo that represented 582 of the total biovolume The group Tc encompasses species adapted to eutrophicstanding waters or slow-flowing rivers and was here composed by Oscilatoria spp and Phormidium sppDuring FL the group H1 represented 611 of the total biovolume The group H1 comprises speciesadapted to shallow lakes with eutrophic state and low nitrogen content and was here composed byDolichospermum spp that may have the ability to fix nitrogen During LW the group Tc represented770 of total biovolume and Oscilatoria spp comprised about 90 of this total This group encompassesspecies adapted to eutrophic standing waters or slow flowing rivers and was here composed by epiphyticcyanobacteria as Oscillatoria spp and Phormidium spp
Water 2018 10 x FOR PEER REVIEW 7 of 16
32 Biological Data
The proportion of classes in the composition of the phytoplankton community varies throughout hydrological periods (Figure 2A) The Coscinodiscophyceae phytoplankton class had the highest biovolume during RS the representative species was Aulacoseira spp The Cyanophyceae phytoplankton class presented the highest biovolume during HW FL and LW periods The species with the highest biovolume during HW were Phormidium spp and Aulacoseira granulata var granulata The species that were representative during the FL also presented the highest biovolume in this period were Dolichospermum spp and Gleiterinema splendidum During LW the species Oscilatoria spp and Phormidium spp presented the highest biovolume Interestingly the proportion of Cyanophyceae increased along the hydrological cycle from RS to LW when the phytoplankton is almost entirely composed (up to 98) of representatives from this class Species were distributed in 11 functional groups that contributed to at least 5 of the total biovolume in at least one of the hydrological periods (Figure 2B) During RS the functional groups P Y and Lo comprised 614 of the total biovolume The group P is composed of species adapted to shallow lakes that tolerate high trophic states such Aulacoseira granulata Closterium sp and Fragilaria sp The group Y comprises species adapted to lentic ecosystems and in the study was represented by Cryptomonas spp The group Lo contains species adapted to deep and shallow lakes that tolerate oligo to eutrophic states such Peridinium spp and Merismopedia spp During HW functional groups were Tc P and Lo that represented 582 of the total biovolume The group Tc encompasses species adapted to eutrophic standing waters or slow-flowing rivers and was here composed by Oscilatoria spp and Phormidium spp During FL the group H1 represented 611 of the total biovolume The group H1 comprises species adapted to shallow lakes with eutrophic state and low nitrogen content and was here composed by Dolichospermum spp that may have the ability to fix nitrogen During LW the group Tc represented 770 of total biovolume and Oscilatoria spp comprised about 90 of this total This group encompasses species adapted to eutrophic standing waters or slow flowing rivers and was here composed by epiphytic cyanobacteria as Oscillatoria spp and Phormidium spp
Figure 2 Relative phytoplankton class biomass (A) and functional groups biomass (B) Rising period (RS) high-water period (HW) flushing period (FL) low-water period (LW) BndashGndashH1ndashLondashMndashMPndashPndashS1ndashTcndashW1ndashY are functional groups that had at least 5 of total biovolume in at least one hydrological period Others are the sum of functional groups that did not respect the 5 threshold
33 Statistical Results
The STI test indicated that the space-time interaction is not significant That is there was no significant influence of space-time on the structuring of the phytoplankton community at the functional group level The second step returned that only time had a significant importance in structuring the phytoplankton community hence indicating that spatial distribution of sample units
Figure 2 Relative phytoplankton class biomass (A) and functional groups biomass (B) Rising period (RS)high-water period (HW) flushing period (FL) low-water period (LW) BndashGndashH1ndashLondashMndashMPndashPndashS1ndashTcndashW1ndashYare functional groups that had at least 5 of total biovolume in at least one hydrological period Others arethe sum of functional groups that did not respect the 5 threshold
Water 2019 11 154 8 of 17
33 Statistical Results
The STI test indicated that the space-time interaction is not significant That is there was nosignificant influence of space-time on the structuring of the phytoplankton community at the functionalgroup level The second step returned that only time had a significant importance in structuring thephytoplankton community hence indicating that spatial distribution of sample units had no significantinfluence (Table 2) The time influence indicates that the hydrological cycle was the main factor in thedynamics of the phytoplankton community The partial redundancy analysis (pRDA) for partitionenvironmental data shows that both nutrients and hydrological variables had a significant influence instructuring the phytoplankton community but the strength of the nutrients partition was higher thanthat of hydrological variables (Table 2) The pRDA also returns a great residual indicating that therewere other important factors not measured which influenced the phytoplankton community structure
Table 2 Results of the space-time interaction test (STI) and pRDA tests Space-time interaction(Space + Time) common temporal structures (Time) common spatial structure (Space) variation dueto nutrients (Nutr) variations due to nutrients and hydrology together (Nutr + Hydr) variations dueto hydrology (Hydr) not-explanable variation (Res) adjusted R2 value (AdjR2) significance (p lt 005)
The STATICO analysis showed stability in the phytoplanktonndashnutrient relationship along periodsas illustrated by the longer arrows in the interstructure graph (Figure 3A) In these graphs thegreater length of arrows (or in case of points the distance from the center) the higher the stability inthis relationship However the weight of each hydrological period on the phytoplanktonndashnutrientsrelationship was different (Figure 3B) The first and second axes represented respectively 19 and 10of the total variability The first axis (horizontal axis) in the compromise graph (Figure 3C) accountedfor 42 of the explained variance and the second axis (vertical axis) accounted for 20 of the explainedvariance and was less significant Flushing and low-water periods were more related to the firstaxis which has twice the explanatory power of the second axis Hence the phytoplanktonndashnutrientsrelationship might be considered stronger during these two periods
As shown by the environmental variables compromise plot (Figure 3C) the first axis (horizontal)was more related to hydrolyzable phosphorus and suspended solids The second axis (vertical) wasmore related with PO4 and NO2 (Figure 3C) Other variables such as conductivity and oxygen arerelated to both axes and also have a great compromise (long arrow) The environmental variableswith shorter arrows have weak stability with the hydrological cycle and are more related to a specificperiod as detailed below For the functional groups compromise plot (Figure 3D) the most importantgroups are those more distant to the center of the graph The FGrsquos MP and H1 although have greatstability with the hydrological cycle also play an important role on specific period (Figure 4)
Water 2019 11 154 9 of 17
1
Figure 3 STATICO graph The length of arrows (AndashC) or distance from the center (D) indicatesthe strength of a relationship Interstructure graph (A) weight of each hydrological period (B)environmental and nutrients compromise (C) species compromise (D)
Water 2018 10 x FOR PEER REVIEW 9 of 16
Figure 3 STATICO graph The length of arrows (AndashC) or distance from the center (D) indicates the strength of a relationship Interstructure graph (A) weight of each hydrological period (B) environmental and nutrients compromise (C) species compromise (D)
As shown by the environmental variables compromise plot (Figure 3C) the first axis (horizontal) was more related to hydrolyzable phosphorus and suspended solids The second axis (vertical) was more related with PO4 and NO2 (Figure 3C) Other variables such as conductivity and oxygen are related to both axes and also have a great compromise (long arrow) The environmental variables with shorter arrows have weak stability with the hydrological cycle and are more related to a specific period as detailed below For the functional groups compromise plot (Figure 3D) the most important groups are those more distant to the center of the graph The FGrsquos MP and H1 although have great stability with the hydrological cycle also play an important role on specific period (Figure 4)
Figure 4 Multiple Regression Tree (MRT) map Rising period (RS) high-water period (HW) flushing period (FL) low-water period (LW) species indicator value (Ind-Val) significance (p) adjusted R2 (R2) cross-validation error (CVRE) Groups 1 to 5 MRT clusters results
MRT applied to the data resulted in five groups the model explained 71 of the phytoplankton data variability (adjR2 = 071) The predictive power of the model expressed as the cross-validation relative error (CVRE) was 095 MRT clearly separated LW samples (22 samples) apart from those collected during the other periods based on NO3 concentration (Figure 4) LW samples belonged to group 5 with low NO3 concentration Further group divisions were based successively upon particulate organic carbon total organic carbon and conductivity Interestingly similarly as LW period all samples from the FL period are gathered into a single group (group 1) characterized by high NO3 POC and TOC concentrations whereas samples collected during HW or RS are spread over three groups A majority of samples collected in HW were gathered into group 4 (high NO3 high POC and low Cond) and those collected during RS mostly divided into two groups a majority in group 3 (high NO3 high POC high Cond) Indicator value (Ind-Val) coupled with MRT analysis enabled extracting sets of FGrsquos indicators of the MRT groups (Figure 4) Based on the Ind-Val four groups are characterized by seven significant FGs (p lt 005) Group 2 does not have any FG indicators with a significative value
4 Discussion
41 Space-Time Components and Environmental Partitions
As we expected the hydrological variation (time) is a more significant factor of structuration of the functional phytoplankton community than the environmental spatial variability (space) Besides
Figure 4 Multiple Regression Tree (MRT) map Rising period (RS) high-water period (HW) flushingperiod (FL) low-water period (LW) species indicator value (Ind-Val) significance (p) adjusted R2 (R2)cross-validation error (CVRE) Groups 1 to 5 MRT clusters results
Water 2019 11 154 10 of 17
MRT applied to the data resulted in five groups the model explained 71 of the phytoplanktondata variability (adjR2 = 071) The predictive power of the model expressed as the cross-validationrelative error (CVRE) was 095 MRT clearly separated LW samples (22 samples) apart from thosecollected during the other periods based on NO3 concentration (Figure 4) LW samples belongedto group 5 with low NO3 concentration Further group divisions were based successively uponparticulate organic carbon total organic carbon and conductivity Interestingly similarly as LW periodall samples from the FL period are gathered into a single group (group 1) characterized by high NO3POC and TOC concentrations whereas samples collected during HW or RS are spread over threegroups A majority of samples collected in HW were gathered into group 4 (high NO3 high POCand low Cond) and those collected during RS mostly divided into two groups a majority in group3 (high NO3 high POC high Cond) Indicator value (Ind-Val) coupled with MRT analysis enabledextracting sets of FGrsquos indicators of the MRT groups (Figure 4) Based on the Ind-Val four groups arecharacterized by seven significant FGs (p lt 005) Group 2 does not have any FG indicators with asignificative value
4 Discussion
41 Space-Time Components and Environmental Partitions
As we expected the hydrological variation (time) is a more significant factor of structuration ofthe functional phytoplankton community than the environmental spatial variability (space) Besidesthe STI test the STATICO also showed that most of the phytoplankton community variation is stronglylinked with variables related with hydrological conditions (TSS Cond) MRT further confirmed thegroups according to the hydrological periods The analyses show that only the hydrological variationis strong enough to produce functional changes in the phytoplankton community and this reflects theimportance of flood pulse dynamics in the Amazon basin In fact the hydrological variation or floodpulse is acknowledged as a strength that can promote changes in these environments and biologicalcommunities in several studies [367071] In addition our results showed that these changes are morerelated to nutrients changes (and especially nitrogen changes as indicated by MRT) than changes inanother factors (among those we have measured) Indeed the partition test showed that although thehydrological variables measured were significant in structuring the community the nutrients variableswere two times more decisive in this process thus confirming our starting hypothesis In addition thepartition involving both variables (Hydr + Nutr) has the same proportion than that of the nutrientspartition The hydrological annual variability promotes a lot of changes over the year and one of themis a variability of the different kinds of nutrients In general we measured only total nitrogen and totalphosphorus when performing research in this field for many reasons but the different fractions ofnitrogen and phosphorus compounds have different influences on the phytoplankton community
42 Nutrients-Phytoplankton Relationships over Hydrological Cycle
Our results showed that over the hydrological year (i) the interaction between phytoplanktoncommunity and phosphorus compounds is more stable than that of nitrogen compounds (Figure 3CD)and (ii) that the rising period has the weakest weight in the phytoplanktonndashnutrients interaction(Figure 3B) While the phytoplankton biovolume becomes higher the weight of the relationship insubsequent hydrological periods increases suggesting that there are both top-down and bottom-upcontrols for the phosphorus and nitrogen cycles in tropical floodplain system Top-down refers to theinput which occurs in the rising period from waters coming from the Amazon river while bottom-uprefers to phosphorus (or nitrogen) cycle processes occurring inside the floodplain
Regarding phosphorus our results suggest that bottom-up control is stronger than top-down orin other words that phosphorus compounds already present or in situ recycled in the system havea greater influence upon phytoplankton than allogenic phosphorus compounds It is well knownthat Amazonian rivers that drain the Andes (classified as white-water rivers according to Sioli 1984
Water 2019 11 154 11 of 17
typology) [47] carry high concentration in suspended solids and dissolved and sediment-boundnutrients [37] The river incursion across the floodplain during rising brings nutrients and sedimentinto the floodplain ecosystems and promotes a high peak in primary productivity [3972] However ourresults also showed that the phytoplanktonndashphosphorus relationship is stable along the hydrologicalyear Many processes can participate to maintain a rather constant concentration of phosphorus in thewater column Seasonal herbaceous plants that pump nutrients from the sediment to support theirgrowth and release nutrients in the water column during their decay [7374] sediment early diagenesisprocesses and resuspension may also participate [74]
Although weaker than with phosphorus compounds our results showed that there is a stableinteraction between nitrogen compounds (TN and DIN) and phytoplankton Wetlands such asfloodplains can be considered aggrading ecosystems where the nitrogen can come from adjacentdrained areas or the mainstream and in some cases from biological nitrogen fixation and atmosphericdeposition [75ndash77] The phytoplankton primary productivity peak occurring in the rising period isfollowed by a significant increase of nitrogen-fixing cyanobacteria biovolume Nitrogen fixation is anessential process for eutrophic wetlands once it may contribute from 5 to 80 of the total nitrogeninputs in these systems [8] NO3 is the most common reactive nitrogen species [74] and the highconcentration in flushing period allied to higher biovolume of FG H1 suggest that nitrogen-fixingprocess plays an essential role in maintaining the stability along the hydrological cycle
Besides nitrogen-fixation processes the increases in nitrogen compounds between rising andsubsequent periods similar to phosphorus can be influenced by processes mentioned above especiallythe seasonal herbaceous plants growthdecay cycle that may release NH4 and NO3 in the watercolumn Thus the sediment nutrients pool mobilization is another crucial factor that permits thenitrogen concentration to remain stable during the hydrological cycle Hence like phosphorusthe phytoplanktonndashnitrogen interaction also suggests that there is both a top-down and bottom-upinteraction for its cycle in tropical floodplain system
The idea that the phytoplankton has the potential to influence pools of nitrogen and phosphorusthat would be available is not new [77] but works with this approach are scarce in tropicalenvironments For temperate lakes the work of Cottingham et al [77] has demonstrated thatcyanobacteria have the potential to drive nitrogen and phosphorus cycles in lakes They remarkedthat the ability of many cyanobacterial taxa to fix nitrogen and to access pools of phosphorus insediments and bottom waters is the key behind this influence Their work suggests that cyanobacterialblooms warrant attention as potential drivers of the transition from a low-nutrient clear-water regimeto a high-nutrient turbid-water regime Our results show that there is a considerable increase incyanobacteria biovolume but it is difficult to know how much is a consequence of allochthonousnitrogen inputs and how much is a consequence of autochthonous nitrogen inputs However it iscertain that this increase is an important factor for maintaining the stability of nutrients over thehydrological cycle Thus the cyanobacteria dynamics are an essential factor in both nutrients cyclingand phytoplankton dynamics Increases in nutrients leading to a dominance of cyanobacteria havebeen reported by Dokulil and Teubner [78] and in Curuai Affonso et al [79] they found that theflushing period was the most eutrophic period Thus the extent to which the floodplain becomesshallow and water flow less intense the cyanobacteria community can be established [80]
43 Cyanobacteria Dynamics
The results showed that while the phytoplankton biomass increased and the environment becamemore eutrophic the phytoplankton functional group diversity was decreasing until the phytoplanktonwas almost entirely composed by the cyanobacteria group Even if phytoplankton species differ intheir nutritional requirements [81] and although nitrogen and phosphorus are essential factors for thephytoplankton growth they are not the unique Other factors play a vital role for the phytoplanktonin specific periods Unlike during the flushing and low-water periods samples collected during therising and high-water periods spread over a larger number of MRT groups with functional groups
Water 2019 11 154 12 of 17
with significant Ind-Val The Amazon river incursion extent across the floodplain the flow magnitudeand the mixture of this inflow with the water residing on the floodplain cause a significant directionalgradient [82] Additinoally the rising period is probably the period that is the most influenced by thefloodplain geomorphology The FG Y has a significant value of Ind-Val for 13 sites in rising periodand it is an indication that this period is marked by a great dynamism Indeed the group Y refers to awide range of habitats thus reflecting the ability of species to live in almost all lentic ecosystems [30]During the high-water period a majority of the samples were gathered into a group that exhibitedthree functional groups with significant Ind-Val These results are an indication of heterogeneity andof a state of a transition period
The reduction of water speed and input of nutrients from the previous periods turns theenvironment favorable to cyanobacteria community development High NO3 concentration withlower concentrations of POC and higher concentrations of TOC characterize all sites in the flushingperiod NO3 and NH4 are the preferred uptake forms of nitrogen by phytoplankton but NH4 mighthave an inhibitory or repressive effect in NO3 uptake and assimilation [10] During the flushing periodNH4 is very low while NO3 is high A condition that favors the NO3 uptake by the phytoplanktonduring this period During this period also POC was very low and TOC was almost entirely in DOCform As mentioned in Moreira-Turc et al [42] contrasting with the rising period when DOC is mainlyimported from the Amazon River high DOC lability is expected during the flushing period because itis mainly originating from phytoplankton production Higher labile DOC concentration also helpsto provide nutrients for the development and establishment of the cyanobacteria community [16ndash18]Lowest concentrations of NH4 also favor the increase of nitrogen-fixing cyanobacteria and our resultsshow that functional group H1 composed of species with nitrogen-fixing ability has a significativeInd-Val for samples collected during the flushing period NO3 depletion characterized almost allthe samples collected during the low-water period while NO2 increased Due to lowest waterlevel and increasing interaction between water column and sediment denitrification bacteria in thesediment (that might have anoxia or hypoxia condition) can be responsible for the characteristics of thelow-water period Even though the low-water period was composed almost entirely by one functionalgroup the Ind-Val comprised two groups with significant indicator-values composed of speciesadapted to eutrophic waters and shallow turbid lakes with the presence of inorganic compoundsThese results demonstrate that despite the dominance of cyanobacteria the conditions begin to befavorable for the establishment of other phytoplankton groups that will encounter favorable conditionsduring the next hydrological cycle
5 Conclusions
Our analyses confirm the predominant role of hydrology upon the phytoplankton communityThe seasonal hydrological variation is strong enough to produce functional changes in phytoplanktoncommunity especially because the changes in nitrogen and phosphorus contents and chemicalspeciation along the water year Besides biogeochemical processes in tropical floodplain lakessuch as the Curuai floodplain lake enable maintaining phytoplankton nutrient requirements evenlong after the nutrient inputs from the river water has declined The nutrient inputs in rising periodsincreases the phytoplankton biomass which becomes dominated by cyanobacteria during the low-waterperiod The cyanobacteria allied to other organisms (not evaluated in this study such as macrophytesand bacteria) play an important role in maintaining the stability of nutrients along hydrologicalperiods Interestingly it was possible to identify a limited number of phytoplankton functional groupsindicating the particular environmental conditions during the flushing and low-water periods Duringthe rising and high-water periods the environmental and biological conditions seem to be morespatially structured in part because of higher water contribution from the local watershed at theseperiods These features highlight the large variability in phytoplankton activities in tropical floodplainecosystems that may cause issues for the global Amazonian trophic chain Although our studycontributes disentangling hydrology and nutrients control upon the phytoplankton community and
Water 2019 11 154 13 of 17
better understands how the nutrientsndashphytoplankton relationship changes along the water year stillmore research is required upon the phytoplanktonndashnutrient relationship in tropical aquatic ecosystemsMost of the knowledge upon this relationship is based on experimental investigations and researchin temperate environments and thus limiting our understanding of what controls such processes intropical freshwater ecosystems
Author Contributions CNK and M-PB were mainly responsible for the development and organization of thework IdSN and MTMPSL assisted in the taxonomic identification of the phytoplankton community and inthe ecological interpretation of community results DdMM contributed to the analytical procedure of water andthe ecological interpretation of the data obtained JG assisted with the geochemical assessment LCGV assistedin the development and analysis of statistical data applied to the ecological community
Funding The authors are very grateful to the two anonymous revisors their constructive comments helped tosubstancially improve the manuscript This research was done under the auspices of CNPq (Conselho Nacionalde Desenvolvimento Cientiacutefico e Tecnoloacutegico Brazil) CAPES (Coordenaccedilatildeo de Aperfeiccediloamento de Pessoalde Niacutevel Superior Brazil) IRD (Institut de Recherche pour le Deacuteveloppement grant number 4906342013-3France) and LMI OCE (Laboratoire Mixte International lsquoObservatoire des Changements Environnementauxrsquo)and of three research programs Clim-FABIAM which was funded by FRB (Fondation pour la Recherche sur laBiodiversiteacute) and Bloom-ALERT which was funded by the GUYAMAZON program (IRDCIRADAmbassadede FranceFAPEAM) and INCT nordm 16- 2014 ODISSEIA with funding from CNPqCAPESFAP-DF The paperalso received funding from the European Unionrsquos Horizon 2020 Research and innovation program under theMarie SkłodowskamdashCurie grant agreement Nordm 691053
Conflicts of Interest The authors declare no conflict of interest
References
1 Fiore MDF Neilan BA Copp JN Rodrigues JLMM Tsai SM Lee H Trevors JT Characterizationof nitrogen-fixing cyanobacteria in the Brazilian Amazon floodplain Water Res 2005 39 5017ndash5026[CrossRef] [PubMed]
2 Schindler DW The dilemma of controlling cultural eutrophication of lakes Proc R Soc B Biol Sci 2012279 4322ndash4333 [CrossRef] [PubMed]
3 Paerl HW Gardner WS Havens KE Joyner AR McCarthy MJ Newell SE Qin B Scott JTMitigating cyanobacterial harmful algal blooms in aquatic ecosystems impacted by climate change andanthropogenic nutrients Harmful Algae 2016 54 213ndash222 [CrossRef] [PubMed]
4 Thomas MK Litchman E Effects of temperature and nitrogen availability on the growth of invasive andnative cyanobacteria Hydrobiologia 2016 763 357ndash369 [CrossRef]
5 Schindler DW Hecky RE Findlay DL Stainton MP Parker BR Paterson MJ Beaty KG Lyng MKasian SEM Eutrophication of lakes cannot be controlled by reducing nitrogen input Results of a 37-yearwhole-ecosystem experiment Proc Natl Acad Sci USA 2008 105 11254ndash11258 [CrossRef] [PubMed]
6 Conley DJ Paerl HW Howarth RW Boesch DF Seitzinger SP Havens KE Lancelot C Likens GEControlling Eutrophication Nitrogen and Phosphorus Science 2009 [CrossRef]
7 Howarth RW Nutrient Limitation of Net Primary Production in Marine Ecosystems Annu Rev Ecol Syst1988 19 89ndash110 [CrossRef]
8 Lewis WM Wurtsbaugh WA Paerl HW Rationale for Control of Anthropogenic Nitrogen andPhosphorus to Reduce Eutrophication of Inland Waters Environ Sci Technol 2011 45 10300ndash10305[CrossRef] [PubMed]
9 Elser JJ Bracken MES Cleland EE Gruner DS Harpole WS Hillebrand H Ngai JTSeabloom EW Shurin JB Smith JE Global analysis of nitrogen and phosphorus limitation of primaryproducers in freshwater marine and terrestrial ecosystems Ecol Lett 2007 10 1135ndash1142 [CrossRef]
10 Abell JM Oumlzkundakci D Hamilton DP Nitrogen and Phosphorus Limitation of Phytoplankton Growthin New Zealand Lakes Implications for Eutrophication Control Ecosystems 2010 13 966ndash977 [CrossRef]
11 Thad Scott J McCarthys MJ Nitrogen fixation may not balance the nitrogen pool in lakes over timescalesrelevant to eutrophication management Limnol Oceanogr 2010 55 1265ndash1270 [CrossRef]
12 Scheffer M Van Nes EH Shallow lakes theory revisited Various alternative regimes driven by climatenutrients depth and lake size Hydrobiologia 2007 584 455ndash466 [CrossRef]
Water 2019 11 154 14 of 17
13 Janssen ABG Teurlincx S An S Janse JH Paerl HW Mooij WM Alternative stable states in largeshallow lakes J Great Lakes Res 2014 40 813ndash826 [CrossRef]
14 Jeppesen E Meerhoff M Davidson TA Trolle D Soslashndergaard M Lauridsen TL Beklioglu MBrucet S Volta P Gonzaacutelez-Bergonzoni I et al Climate change impacts on lakes An integrated ecologicalperspective based on a multi-faceted approach with special focus on shallow lakes J Limnol 2014 7388ndash111 [CrossRef]
15 Lobo MTMPS de Souza Nogueira I Fabris Sgarbi L Nunes Kraus C de Oliveira Bomfim E Garnier Jda Motta Marques D Bonnet M-P Morphology-based functional groups as the best tool to characterizeshallow lake-dwelling phytoplankton on an Amazonian floodplain Ecol Indic 2018 95 579ndash588 [CrossRef]
16 Lampert W Sommer U Limnoecology Oxford University Press Oxford UK 2007 ISBN 978-0-19-921392-417 Soslashndergaard M Jensen JP Jeppesen E Role of sediment and internal loading of phosphorus in shallow
lakes Hydrobiologia 2003 506ndash509 135ndash14518 Scheffer M Rinaldi S Gragnani A Mur LR van Nes EH On the Dominance of Filamentous
Cyanobacteria in Shallow Turbid Lakes Ecology 1997 78 272 [CrossRef]19 Hays SG Ducat DC Engineering cyanobacteria as photosynthetic feedstock factories Photosynth Res
2014 123 1ndash11 [CrossRef]20 Benoiston A-S Ibarbalz FM Bittner L Guidi L Jahn O Dutkiewicz S Bowler C The evolution of
diatoms and their biogeochemical functions Philos Trans R Soc B Biol Sci 2017 372 20160397 [CrossRef]21 Peace A Effects of light nutrients and food chain length on trophic efficiencies in simple stoichiometric
aquatic food chain models Ecol Model 2015 312 125ndash135 [CrossRef]22 OrsquoNeil JM Davis TW Burford MA Gobler CJ The rise of harmful cyanobacteria blooms The potential
roles of eutrophication and climate change Harmful Algae 2012 14 313ndash334 [CrossRef]23 Catherine Q Susanna W Isidora ES Mark H Aureacutelie V Jean-Franccedilois H A review of current
knowledge on toxic benthic freshwater cyanobacteriamdashEcology toxin production and risk managementWater Res 2013 47 5464ndash5479 [CrossRef]
24 Boopathi T Ki J-S Impact of Environmental Factors on the Regulation of Cyanotoxin Production Toxins2014 6 1951ndash1978 [CrossRef] [PubMed]
25 Rastogi RP Madamwar D Incharoensakdi A Bloom dynamics of cyanobacteria and their toxinsEnvironmental health impacts and mitigation strategies Front Microbiol 2015 6 1ndash22 [CrossRef] [PubMed]
26 Sukenik A Quesada A Salmaso N Global expansion of toxic and non-toxic cyanobacteria Effect onecosystem functioning Biodivers Conserv 2015 24 889ndash908 [CrossRef]
27 Vilmi A Karjalainen SM Landeiro VL Heino J Freshwater diatoms as environmental indicators Evaluatingthe effects of eutrophication using species morphology and biological indices Environ Monit Assess 2015187 243 [CrossRef]
28 Dolman AM Ruumlcker J Pick FR Fastner J Rohrlack T Mischke U Wiedner C Cyanobacteria andcyanotoxins The influence of nitrogen versus phosphorus PLoS ONE 2012 7 e38757 [CrossRef]
29 LONGHI ML BEISNER BE Patterns in taxonomic and functional diversity of lake phytoplanktonFreshw Biol 2010 55 1349ndash1366 [CrossRef]
30 Colina M Calliari D Carballo C Kruk C A trait-based approach to summarizezooplanktonndashphytoplankton interactions in freshwaters Hydrobiologia 2015 767 221ndash233 [CrossRef]
31 Salmaso N Naselli-Flores L Padisaacutek J Functional classifications and their application in phytoplanktonecology Freshw Biol 2015 60 603ndash619 [CrossRef]
32 Reynolds CS Huszar V Kruk C Naselli-Flores L Melo SS Towards a functional classification of thefreshwater phytoplankton J Plankton Res 2002 24 417ndash428 [CrossRef]
33 Padisaacutek J Crossetti LO Naselli-Flores L Use and misuse in the application of the phytoplanktonfunctional classification A critical review with updates Hydrobiologia 2009 621 1ndash19 [CrossRef]
34 Kruk C Huszar VLM Peeters ETHM Bonilla S Costa L Luumlrling M Reynolds CS Scheffer M Amorphological classification capturing functional variation in phytoplankton Freshw Biol 2010 55 614ndash627[CrossRef]
35 Machado KB Borges PP Carneiro FM de Santana JF Vieira LCG de Moraes Huszar VLNabout JC Using lower taxonomic resolution and ecological approaches as a surrogate for planktonspecies Hydrobiologia 2015 743 255ndash267 [CrossRef]
Water 2019 11 154 15 of 17
36 Junk WJ Bayley PB Sparks RE The flood pulse concept in river-floodplain systems Can Spec PublFish Aquat Sci 1989 106 110ndash127
37 Junk WJ Piedade MTF Schoumlngart J Wittmann F A classification of major natural habitats of Amazonianwhite-water river floodplains (vaacuterzeas) Wetl Ecol Manag 2012 20 461ndash475 [CrossRef]
38 Tockner K Malard F Ward JV An extension of the flood pulse concept Hydrol Process 2000 142861ndash2883 [CrossRef]
39 Bonnet MPP Barroux G Martinez JMM Seyler F Moreira-Turcq P Cochonneau G Melack JMMBoaventura G Maurice-Bourgoin L Leoacuten JGG et al Floodplain hydrology in an Amazon floodplainlake (Lago Grande de Curuaiacute) J Hydrol 2008 349 18ndash30 [CrossRef]
40 Junk WJ Wantzen KM The flood pulse concept New aspects approaches and applicationsmdashAn updateIn Proceedings of the Second International Symposium on the Management of Large Rivers for FisheriesRome Italy 11ndash14 February 2003 pp 117ndash149
41 Bonnet M-P Pinel S Garnier J Bois J Resende Boaventura G Seyler P Motta Marques D Amazonianfloodplain water balance based on modelling and analyses of hydrologic and electrical conductivity dataHydrol Process 2017 31 1702ndash1718 [CrossRef]
42 Kraus CN Bonnet MP Miranda CA de Souza Nogueira I Garnier J Vieira LCG InterannualHydrological Variation and Ecological Phytoplankton Patterns in Amazonian Floodplain Lakes Hydrobiologia2018 [CrossRef]
43 Sioli H The Amazon and its main affluents Hydrography morphology of the river courses and river typesIn The Amazon Limnology and Landscape Ecology of a Mighty Tropical River and Its Basin Sioli H Ed SpringerDordrecht The Netherlands 1984 pp 127ndash165 ISBN 978-94-009-6542-3
44 Moquet JS Crave A Viers J Seyler P Armijos E Bourrel L Chavarri E Lagane C Laraque ACasimiro WSL et al Chemical weathering and atmosphericsoil CO(2) uptake in the Andean and ForelandAmazon basins Chem Geol 2011 287 1ndash26 [CrossRef]
45 Park E Latrubesse EM Water resources research Water Resour Res 2015 51 9127ndash914046 Bonnet MP Garnier J Barroux G Boaventura GR Seyler P Mse CC Bataillon PE Biogeochemical
functioning of amazonian floodplains The case of lago Grande de Curuai In Riparian Zones CharacteristicsManagement Practices and Ecological Impacts Environmental Research Advances Pokrovsky OS Viers J EdsNova Science Publishers New York NY USA 2016 pp 1ndash22 ISBN 978-1-63484-636-3
47 APHA Standard Methods for Examination of Water and Wastewater (Standard Methods for the Examination of Waterand Wastewater) Standard Methods American Public Health Association (APHA) Washington DC USA1998 pp 5ndash16
48 Utermoumlhl H Zur vervollkommnung der quantitativen phytoplankton-methodik Mitt Int Ver Angew Limnol1958 9 1ndash38 [CrossRef]
49 Lund JWG Kipling C Le Cren ED The inverted microscope method of estimating algal numbers andthe statistical basis of estimations by counting Hydrobiologia 1958 11 143ndash170 [CrossRef]
50 Guiry MD Guiry GM AlgaeBase World-Wide Electronic Publication Available online httpwwwalgaebaseorg (accessed on 20 October 2018)
51 Hillebrand H Duumlrselen C-D Kirschtel D Pollingher U Zohary T Biovolume Calculation for Pelagicand Benthic Microalgae J Phycol 1999 35 403ndash424 [CrossRef]
52 Kruk C Mazzeo N Lacerot G Reynolds CS Classification schemes for phytoplankton A local validationof a functional approach to the analysis of species temporal replacement J Plankton Res 2002 24 901ndash912[CrossRef]
53 Thioulouse J Simultaneous analysis of a sequence of paired ecological tables A comparison of severalmethods Ann Appl Stat 2012 5 2300ndash2325 [CrossRef]
54 Dray S Chessel D Thioulouse J Co-Inertia Analysis and the Linking of Ecological Data Tables Ecology2003 84 3078ndash3089 [CrossRef]
55 Blanchet FG Legendre P Borcard D Forward selection of explanatory variables Ecology 2008 892623ndash2632 [CrossRef]
56 Dersquoath G Multivariate Regression Tree A New Technique for Modeling SpeciesndashEnvironment RelationshipsEcology 2002 83 1105ndash1117
57 Borcard D Gillet F Legendre P Community Diversity In Numerical Ecology with R Springer BerlinHeidelbergGermany 2018 pp 369ndash412
Water 2019 11 154 16 of 17
58 DersquoAth G Fabricius KE Classification and regression trees A powerful yet simple technique for ecologicaldata analysis Ecology 2000 81 3178ndash3192 [CrossRef]
59 Therneau TM Atkinson B Ripley B Oksanen J Dersquoath G MVpart A Package for Running MultivariateRegression Trees in R Software Available online httpscranr-projectorgsrccontribArchivemvpart(accessed on 30 November 2018)
60 Ouellette MH Legendre P MVPARTwrap Additional Features for Package Mvpart R Package Version01-92 Available online httpscranr-projectorgsrccontribArchiveMVPARTwrap (accessed on 30November 2018)
61 Dufrecircne M Legendre P Species assemblages and indicator species The need for a flexible asymmetricalapproach Ecol Monogr 1997 67 345ndash366 [CrossRef]
62 Wu Z Shi J Li R Comparative studies on photosynthesis and phosphate metabolism of Cylindrospermopsisraciborskii with Microcystis aeruginosa and Aphanizomenon flos-aquae Harmful Algae 2009 8 910ndash915[CrossRef]
63 Ni Z Wang S Wang Y Characteristics of bioavailable organic phosphorus in sediment and its contributionto lake eutrophication in China Environ Pollut 2016 219 537ndash544 [CrossRef] [PubMed]
64 Junk WJ The flood pulse concept of large rivers Learning from the tropics Large Rivers 1999 11 261ndash280[CrossRef]
65 Zhou J Lau KM Principal modes of interannual and decadal variability of summer rainfall over SouthAmerica Int J Clim 2001 21 1623ndash1644 [CrossRef]
66 Osborne PL Tropical Ecosystems and Ecological Concepts Cambridge University Press Cambridge UK 2000ISBN 0521645239
67 Silva TSF Melack JM Novo EMLM Responses of aquatic macrophyte cover and productivity toflooding variability on the Amazon floodplain Glob Chang Biol 2013 19 3379ndash3389 [CrossRef] [PubMed]
68 Schlesinger WH Reckhow KH Bernhardt ES Global change The nitrogen cycle and rivers Water Resour Res2006 42 5ndash6 [CrossRef]
70 Peterson BJ Wollheim WM Mulholland PJ Webster JR Meyer JL Tank JL Marti E Bowden WBValett HM Hershey AE et al Control of nitrogen export from watersheds by headwater streams Science2001 292 86ndash90 [CrossRef]
71 Burkart MR Stoner JD Nitrogen in Groundwater Associated with Agricultural Systems Nitrogen Environ2008 177ndash202 [CrossRef]
72 Xiao M Willis A Burford MA Differences in cyanobacterial strain responses to light and temperaturereflect species plasticity Harmful Algae 2017 62 84ndash93 [CrossRef] [PubMed]
73 Cottingham KL Ewing HA Greer ML Carey CC Weathers KC Cyanobacteria as biological driversof lake nitrogen and phosphorus cycling Ecosphere 2015 6 1ndash9 [CrossRef]
74 Dokulil MT Teubner K Cyanobacterial dominance in lakes Hydrobiologia 2000 438 1ndash12 [CrossRef]75 Johnston CA Sediment and nutrient retention by freshwater wetlands Effects on surface water quality
Crit Rev Environ Control 1991 21 491ndash565 [CrossRef]76 Nogueira IDS Nabout JC Ibantildeez MDSR Bourgoin LM Rodrigues S Determinants of beta diversity
The relative importance of environmental and spatial processes in structuring phytoplankton communitiesin an Amazonian floodplain Acta Limnol Bras 2010 22 247ndash256 [CrossRef]
77 Affonso A Barbosa C Novo E Water quality changes in floodplain lakes due to the Amazon River floodpulse Lago Grande de Curuaiacute (Paraacute) Braz J Biol 2011 71 601ndash610 [CrossRef] [PubMed]
78 Reynolds CS Descy J-P Padisagravek J Are phytoplankton dynamics in rivers so different from those inshallow lakes Hydrobiologia 1994 289 1ndash7 [CrossRef]
79 Shan K Li L Wang X Wu Y Hu L Yu G Song L Modelling ecosystem structure and trophicinteractions in a typical cyanobacterial bloom-dominated shallow Lake Dianchi China Ecol Model 2014291 82ndash95 [CrossRef]
80 Barbosa CCF Moraes Novo EML Melack JM Gastil-Buhl M Filho WP Geospatial analysis ofspatiotemporal patterns of pH total suspended sediment and chlorophyll-a on the Amazon floodplainLimnology 2009 11 155ndash166 [CrossRef]
Water 2019 11 154 17 of 17
81 Bourgoin LM Bonnet M-P Martinez J-M Kosuth P Cochonneau G Moreira-Turcq P Guyot J-LVauchel P Filizola N Seyler P Temporal dynamics of water and sediment exchanges between the Curuaiacutefloodplain and the Amazon River Brazil J Hydrol 2007 335 140ndash156 [CrossRef]
82 Mulholland PJ Helton AM Poole GC Hall RO Hamilton SK Peterson BJ Tank JLAshkenas LR Cooper LW Dahm CN et al Stream denitrification across biomes and its response toanthropogenic nitrate loading Nature 2008 452 202ndash205 [CrossRef] [PubMed]
copy 2019 by the authors Licensee MDPI Basel Switzerland This article is an open accessarticle distributed under the terms and conditions of the Creative Commons Attribution(CC BY) license (httpcreativecommonsorglicensesby40)
Introduction
Materials and Methods
Environmental and Phytoplankton Data
Data Analysis
Results
Hydrological and Nutrients Data
Biological Data
Statistical Results
Discussion
Space-Time Components and Environmental Partitions
Nutrients-Phytoplankton Relationships over Hydrological Cycle
Cyanobacteria Dynamics
Conclusions
References
Water 2019 11 154 17 of 17
81 Bourgoin LM Bonnet M-P Martinez J-M Kosuth P Cochonneau G Moreira-Turcq P Guyot J-LVauchel P Filizola N Seyler P Temporal dynamics of water and sediment exchanges between the Curuaiacutefloodplain and the Amazon River Brazil J Hydrol 2007 335 140ndash156 [CrossRef]
82 Mulholland PJ Helton AM Poole GC Hall RO Hamilton SK Peterson BJ Tank JLAshkenas LR Cooper LW Dahm CN et al Stream denitrification across biomes and its response toanthropogenic nitrate loading Nature 2008 452 202ndash205 [CrossRef] [PubMed]
copy 2019 by the authors Licensee MDPI Basel Switzerland This article is an open accessarticle distributed under the terms and conditions of the Creative Commons Attribution(CC BY) license (httpcreativecommonsorglicensesby40)
Introduction
Materials and Methods
Environmental and Phytoplankton Data
Data Analysis
Results
Hydrological and Nutrients Data
Biological Data
Statistical Results
Discussion
Space-Time Components and Environmental Partitions
Nutrients-Phytoplankton Relationships over Hydrological Cycle