Under consideration for publication in J. Fluid Mech. 1 Unsteady dynamics of rapid perching manoeuvres Delyle T. Polet 1 , David E. Rival 1,2 and Gabriel D. Weymouth 3 † 1 Department of Mechanical Engineering, University of Calgary, Calgary, AB T2N 1N4, Canada 2 Department of Mechanical and Materials Engineering, Queen’s University, Kingston, ON K7L 3N6, Canada 3 Southampton Marine and Maritime Institute, University of Southampton, Southampton SO17 1BJ, UK (Received 18 August 2015) A perching bird is able to rapidly decelerate while maintaining lift and control, but the underlying aerodynamic mechanism is poorly understood. In this work we perform a study on a simultaneously decelerating and pitching aerofoil section to increase our un- derstanding of the unsteady aerodynamics of perching. We first explore the problem an- alytically, developing expressions for the added-mass and circulatory forces arising from boundary-layer separation on a flat-plate aerofoil. Next, we study the model problem through a detailed series of experiments at Re = 22000 and two-dimensional simulations at Re = 2000. Simulated vorticity fields agree with particle image velocimetry measure- ments, showing the same wake features and vorticity magnitudes. Peak lift and drag forces during rapid perching are measured to be more than 10 times the quasi-steady values. The majority of these forces can be attributed to added-mass energy transfer between the fluid and aerofoil, and to energy lost to the fluid by flow separation at the leading and trailing edges. Thus, despite the large angles of attack and decreasing flow velocity, this simple pitch-up manoeuvre provides a means through which a perching bird can maintain high lift and drag simultaneously while slowing to a controlled stop. Key words: biological fluid dynamics, swimming/flying, vortex shedding. 1. Introduction Birds execute precise manoeuvres, such as banking, braking, takeoff and landing, al- lowing them to navigate dense forests and urban environments. Micro-aerial Vehicles (MAVs) are contemporary flying machines operating on the same scale as small birds, and are designed to carry out remote sensing and small payload delivery tasks in cluttered airspaces. Mimicking the manoeuvrability of birds, particularly the ability to land safely on narrow platforms, would allow them to complete these tasks effectively and efficiently. Though recent advances have been made in designing MAVs that can land on a perch (Doyle et al. 2011; Moore et al. 2014; Reich et al. 2009), existing MAVs still fall short in achieving the control, speed and precision of natural flyers in landing manoeuvres. Birds are tremendously adept at controlled, fast landings. Provini et al. (2014) observed that zebra finches are able to decelerate from 15 to 7 body lengths per second in 0.15 seconds, entirely through aerodynamic means. Though the exact kinematic motion used † Email address for correspondence: [email protected]
Transcript
Under consideration for publication in J. Fluid Mech. 1
Unsteady dynamics of rapid perchingmanoeuvres
Delyle T. Polet1, David E. Rival1,2
and Gabriel D. Weymouth3†1Department of Mechanical Engineering, University of Calgary, Calgary, AB T2N 1N4, Canada2Department of Mechanical and Materials Engineering, Queen’s University, Kingston, ON K7L
3N6, Canada3Southampton Marine and Maritime Institute, University of Southampton, Southampton
SO17 1BJ, UK
(Received 18 August 2015)
A perching bird is able to rapidly decelerate while maintaining lift and control, but theunderlying aerodynamic mechanism is poorly understood. In this work we perform astudy on a simultaneously decelerating and pitching aerofoil section to increase our un-derstanding of the unsteady aerodynamics of perching. We first explore the problem an-alytically, developing expressions for the added-mass and circulatory forces arising fromboundary-layer separation on a flat-plate aerofoil. Next, we study the model problemthrough a detailed series of experiments at Re = 22000 and two-dimensional simulationsat Re = 2000. Simulated vorticity fields agree with particle image velocimetry measure-ments, showing the same wake features and vorticity magnitudes. Peak lift and dragforces during rapid perching are measured to be more than 10 times the quasi-steadyvalues. The majority of these forces can be attributed to added-mass energy transferbetween the fluid and aerofoil, and to energy lost to the fluid by flow separation at theleading and trailing edges. Thus, despite the large angles of attack and decreasing flowvelocity, this simple pitch-up manoeuvre provides a means through which a perching birdcan maintain high lift and drag simultaneously while slowing to a controlled stop.
Birds execute precise manoeuvres, such as banking, braking, takeoff and landing, al-lowing them to navigate dense forests and urban environments. Micro-aerial Vehicles(MAVs) are contemporary flying machines operating on the same scale as small birds,and are designed to carry out remote sensing and small payload delivery tasks in clutteredairspaces. Mimicking the manoeuvrability of birds, particularly the ability to land safelyon narrow platforms, would allow them to complete these tasks effectively and efficiently.Though recent advances have been made in designing MAVs that can land on a perch(Doyle et al. 2011; Moore et al. 2014; Reich et al. 2009), existing MAVs still fall short inachieving the control, speed and precision of natural flyers in landing manoeuvres.
Birds are tremendously adept at controlled, fast landings. Provini et al. (2014) observedthat zebra finches are able to decelerate from 15 to 7 body lengths per second in 0.15seconds, entirely through aerodynamic means. Though the exact kinematic motion used
by birds in perching manoeuvres varies between species (Berg & Biewener 2010; Proviniet al. 2014), one relatively simple motion is for a bird to pitch its wings continuously fromnear-horizontal to approximately 90◦ angle of attack. Carruthers et al. (2007) observedthis motion in a Steppe Eagle and noted that the eagle gained altitude quickly duringthe landing phase, implying that large lift was produced. However, steady-state analysispredicted that the bird would lose lift at high angles of attack due to stall effects andreduced airspeed (Carruthers et al. 2010). When decelerating most rapidly and gainingheight, the eagle entered a “rapid pitch-up phase”, in which it increased its angle ofattack quickly while simultaneously spreading its wings.
To model the aerodynamics of the pitch-up wing motion in landing birds, we consideran aerofoil that rapidly increases its angle of attack while simultaneously decelerating.Though bird flight and landing is a three-dimensional problem, two-dimensional flowtopologies often dominate in highly unsteady manoeuvres, as was shown by Garmannet al. (2013), and so we restrict ourselves to the two-dimensional pitch-up problem.
When an aerofoil pitches to high angles of attack, its frontal area rapidly increases.Rapid frontal area change of bodies in acceleratory manoeuvres results in significantadded-mass effects, notably the recapture of added-mass energy as demonstrated byWeymouth & Triantafyllou (2012) in a shrinking cylinder and Weymouth & Triantafyllou(2013) in a squid-like deflating body. Rapid area change can also affect boundary-layervorticity, causing sudden global shedding of vorticity in a vanishing aerofoil (Wibawaet al. 2012) and annihilation of boundary-layer vorticity in a shrinking cylinder (Wey-mouth & Triantafyllou 2012).
These above studies have all looked at the fluid dynamics of a body with rapidly de-creasing area. However, the case of a body with rapidly increasing frontal area has seencomparatively little attention, despite the potential to inform biological and technolog-ical designs. We show that the case of a pitching and decelerating aerofoil manipulatesadded-mass forces in a similar way to other rapid area change problems, but here therapid increase in area bears unique performance challenges. Additionally, the rotation ofthe body produces lift and dynamic forces from boundary-layer separation, which havehitherto not been considered in rapid area change problems.
To study the unsteady dynamics of pitch-up during stopping manoeuvres, we firstdevelop a low-order analytic model for the lift and drag force history on an aerofoilperforming simultaneous pitch and deceleration. Such a model provides two benefits: (a)it identifies the salient features of the flow in order to understand physical mechanisms,and (b) it may be used to predict forces for MAV control at low computational cost.
Next, a complete set of numerical simulations and experimental studies are performed.The results demonstrate that a high speed pitch and deceleration manoeuvre producesremarkable instantaneous lift and drag forces. By examining these results in the contextof the analytic model, we determine that the majority of these forces can be attributed to(i) added-mass energy transfer between the fluid and aerofoil, and (ii) to energy dissipatedinto the fluid by boundary-layer separation at the leading and trailing edges. These effectscombine to achieve instantaneous and integrated forces compatible with the perchingabilities of birds.
2. Analytic arguments
We first develop an analytic model of the forces produced during a pitch-up and stopmanoeuvre to understand mechanisms of lift and drag generation in perching. Recentstudies (Ol et al. 2009; Baik et al. 2012; Pitt Ford & Babinsky 2013) have shown thatclassical potential flow theory from Theodorsen (1935), von Karman & Sears (1938) and
Unsteady dynamics of rapid perching manoeuvres 3
(a)
c
cx∗pα(t)
c(1 − x∗p)α
U(t)
0 0.5 1
0
0.5
1
t∗
(b) U/U0 2α/π
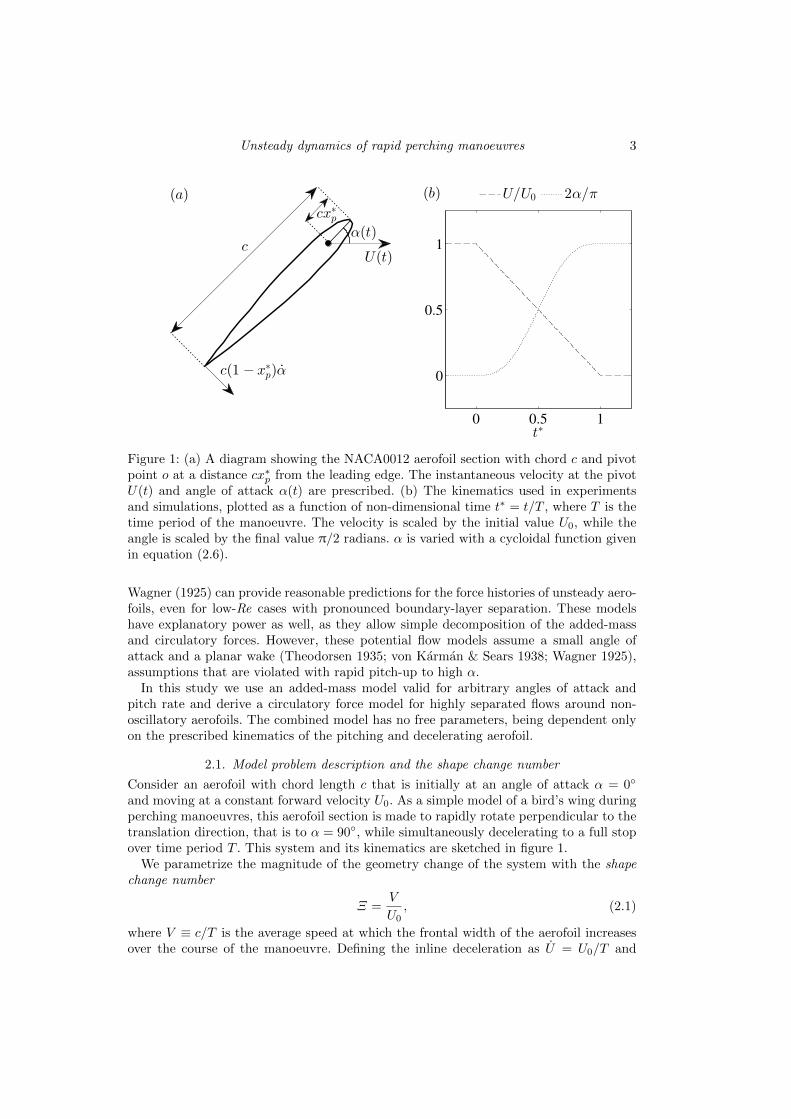
Figure 1: (a) A diagram showing the NACA0012 aerofoil section with chord c and pivotpoint o at a distance cx∗p from the leading edge. The instantaneous velocity at the pivotU(t) and angle of attack α(t) are prescribed. (b) The kinematics used in experimentsand simulations, plotted as a function of non-dimensional time t∗ = t/T , where T is thetime period of the manoeuvre. The velocity is scaled by the initial value U0, while theangle is scaled by the final value π/2 radians. α is varied with a cycloidal function givenin equation (2.6).
Wagner (1925) can provide reasonable predictions for the force histories of unsteady aero-foils, even for low-Re cases with pronounced boundary-layer separation. These modelshave explanatory power as well, as they allow simple decomposition of the added-massand circulatory forces. However, these potential flow models assume a small angle ofattack and a planar wake (Theodorsen 1935; von Karman & Sears 1938; Wagner 1925),assumptions that are violated with rapid pitch-up to high α.
In this study we use an added-mass model valid for arbitrary angles of attack andpitch rate and derive a circulatory force model for highly separated flows around non-oscillatory aerofoils. The combined model has no free parameters, being dependent onlyon the prescribed kinematics of the pitching and decelerating aerofoil.
2.1. Model problem description and the shape change number
Consider an aerofoil with chord length c that is initially at an angle of attack α = 0◦
and moving at a constant forward velocity U0. As a simple model of a bird’s wing duringperching manoeuvres, this aerofoil section is made to rapidly rotate perpendicular to thetranslation direction, that is to α = 90◦, while simultaneously decelerating to a full stopover time period T . This system and its kinematics are sketched in figure 1.
We parametrize the magnitude of the geometry change of the system with the shapechange number
Ξ =V
U0, (2.1)
where V ≡ c/T is the average speed at which the frontal width of the aerofoil increasesover the course of the manoeuvre. Defining the inline deceleration as U = U0/T and
4 D. T. Polet, D. E. Rival and G. D. Weymouth
substituting, we have Ξ = V 2/(Uc), matching that definition of shape change number inWeymouth & Triantafyllou (2013). The parameter Ξ acts as a measure of the unsteadi-ness of the problem, similar to the reduced frequency, k = πfc/U0, where f is a circularfrequency. We choose to use Ξ in this work to emphasize that the motion is not cyclicand that the change in frontal area is fundamental to the perching problem.
For an aerofoil rotating from α = 0◦ to 90◦ and simultaneously decelerating fromU = U0 to 0 in time T , the magnitudes of α, α and U can be estimated as
α ∝ 1
T=U0
cΞ, |α| ∝ 1
T 2=U2
0
c2Ξ2, U ∝ U2
0
cΞ (2.2)
so long as U and α are continuous functions in time. The relations given by (2.2) show thatΞ parametrizes the rate of rotation, rotational acceleration and translational acceleration.
2.2. Added-mass manipulation through frontal area change
This change in frontal area has pronounced consequences on the added-mass forces pro-duced during the manoeuvre. These can be described from very simple relations, andmerit a brief discussion for readers unfamiliar with the topic.
Consider a body accelerating in one dimension but allowed to modify its frontal area intime. As the body expands, it displaces more fluid, effectively increasing its added mass.Conversely, a reduction in frontal area would decrease the added mass in time. The onedimensional added-mass force can be written as
FAM = − ∂
∂t(maU) = −maU −maU (2.3)
where ma is the instantaneous added-mass of the body. The first term on the right handside refers to the rate of increase of added mass momentum (maU) and the second refersto the acceleration of the added mass (maU). Weymouth & Triantafyllou (2013) foundthat the added mass of an accelerating prolate spheroid decreased during body deflation(ma < 0). This had a twofold effect in view of equation (2.3). The first was in achievingadditional thrust by recovering added-mass energy (the −maU term). The second was inreducing parasitic drag throughout the manoeuvre (the −maU term). Both effects werebeneficial for the performance goal of high acceleration.
However, there is a tradeoff for an expanding body when deceleration is desired. Onthe one hand, addition of added-mass from frontal area expansion (ma > 0) would createdrag through −maU . But this would also increase the total added mass in time, makingit difficult to stop the body late in the manoeuvre by producing a net thrust through−maU . The sudden change in the direction of forces would tend to yield an uncontrolledperching manoeuvre, which is not observed (Green & Cheng 1998; Berg & Biewener2010; Carruthers et al. 2007). In the next two sections we extend the simple 1D forcemodel equation (2.3) by discussing the effects of rotation on the added-mass force, andby modeling the circulation forces induced by vortex shedding.
2.3. The added-mass force
The general added-mass force normal to a flat-plate aerofoil in translation and rotationat general angles of attack can be developed in a number of ways. The general boundaryfunction method of Milne-Thompson (1968) can be applied to give the potential solutionφ for the case of a rotating and accelerating flat-plate, from which the added-mass forcecoefficient is determined to be
CFφ =πc
2U20
[α cos(α)U + sin(α)U + cα(1/2− x∗p)
](2.4)
Unsteady dynamics of rapid perching manoeuvres 5
where cx∗p is the distance from the leading edge of the aerofoil to the pivot location.Xia & Mohseni (2013) use an alternative rotating reference frame argument to developthe same added-mass force expression. In the context of equation (2.3), the first termin brackets in equation (2.4) arises from to the time rate of change of added mass, andthe second from linear acceleration of added mass. The final term arises from rotationalacceleration absent in the one-dimensional analogy.
For the perching manoeuvre, we apply the relations given by (2.2) and see that theadded-mass force in equation (2.4) should scale by no more than Ξ2. We also note thatthe added-mass force disappears as Ξ→ 0 (the quasi-steady limit), as expected.
We next study equation (2.4) through a prescribed set of kinematics representingsimultaneous deceleration and pitch-up to large α, relevant to perching manoeuvres inbirds (Carruthers et al. 2007):
U = U0(1− t∗) (2.5)
α(t) =π
2
[t∗ − sin(2πt∗)
2π
](2.6)
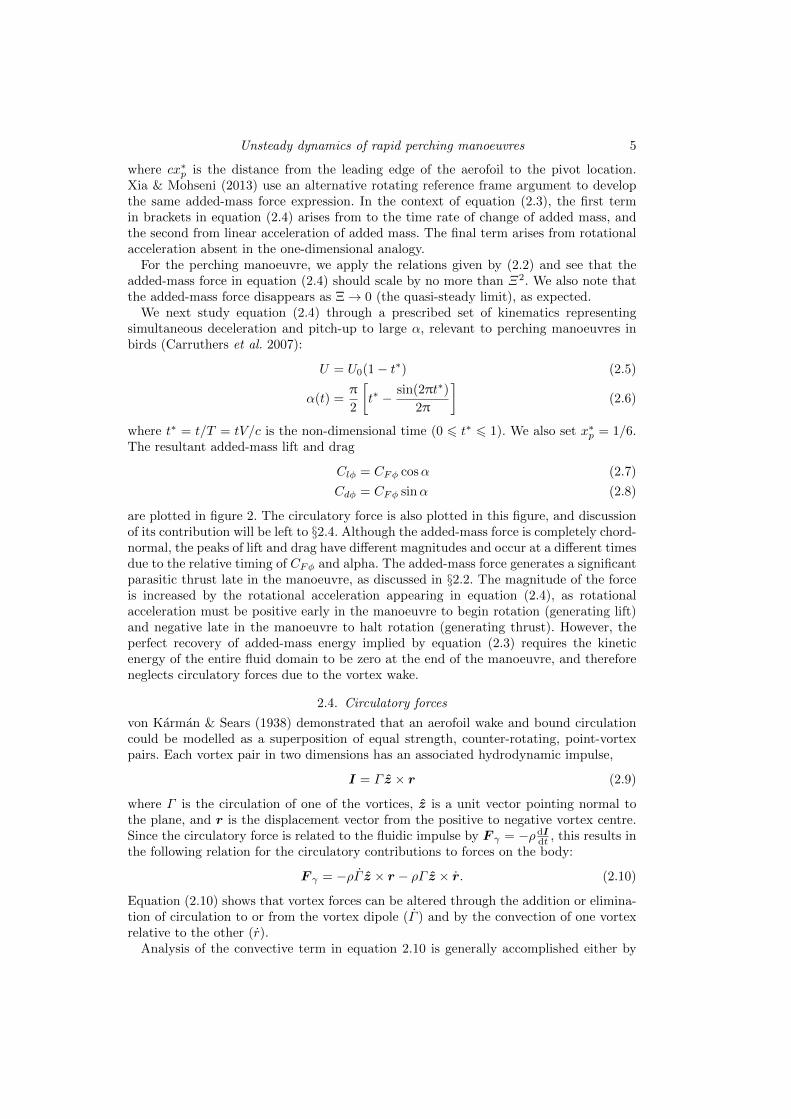
where t∗ = t/T = tV/c is the non-dimensional time (0 6 t∗ 6 1). We also set x∗p = 1/6.The resultant added-mass lift and drag
Clφ = CFφ cosα (2.7)
Cdφ = CFφ sinα (2.8)
are plotted in figure 2. The circulatory force is also plotted in this figure, and discussionof its contribution will be left to §2.4. Although the added-mass force is completely chord-normal, the peaks of lift and drag have different magnitudes and occur at a different timesdue to the relative timing of CFφ and alpha. The added-mass force generates a significantparasitic thrust late in the manoeuvre, as discussed in §2.2. The magnitude of the forceis increased by the rotational acceleration appearing in equation (2.4), as rotationalacceleration must be positive early in the manoeuvre to begin rotation (generating lift)and negative late in the manoeuvre to halt rotation (generating thrust). However, theperfect recovery of added-mass energy implied by equation (2.3) requires the kineticenergy of the entire fluid domain to be zero at the end of the manoeuvre, and thereforeneglects circulatory forces due to the vortex wake.
2.4. Circulatory forces
von Karman & Sears (1938) demonstrated that an aerofoil wake and bound circulationcould be modelled as a superposition of equal strength, counter-rotating, point-vortexpairs. Each vortex pair in two dimensions has an associated hydrodynamic impulse,
I = Γ z × r (2.9)
where Γ is the circulation of one of the vortices, z is a unit vector pointing normal tothe plane, and r is the displacement vector from the positive to negative vortex centre.Since the circulatory force is related to the fluidic impulse by F γ = −ρdI
dt , this results inthe following relation for the circulatory contributions to forces on the body:
F γ = −ρΓ z × r − ρΓ z × r. (2.10)
Equation (2.10) shows that vortex forces can be altered through the addition or elimina-tion of circulation to or from the vortex dipole (Γ ) and by the convection of one vortexrelative to the other (r).
Analysis of the convective term in equation 2.10 is generally accomplished either by
6 D. T. Polet, D. E. Rival and G. D. Weymouth
0 0.5 1
−2
−1
0
1
2
3
4
5
C l
t∗
circulatory
non-cir-
culatory
Ξ= 1/2
Ξ= 1/4
Ξ= 0
0 0.5 1
−2
−1
0
1
2
3
4
5
Cd
t∗
Figure 2: Predicted circulatory (equation (2.14), dashed lines) and added-mass (equations(2.7) and (2.8), dotted lines) forces for the kinematic values given by equations (2.5-2.6). For lift, added-mass forces are most pronounced early in the manoeuvre but arequickly surpassed by circulatory forces. Peak circulatory drag dominates peak added-massdrag, however the parasitic thrust from the added-mass force overwhelms circulatorycontributions late in the manoeuvre at high Ξ. As Ξ → 0, added-mass lift and dragapproach zero.
assuming the wake is stationary relative to the undisturbed fluid, which leads to a liftproportional to UΓ as in von Karman & Sears (1938), or by numerically tracking thedistribution of vorticity in the wake. As the transient perching flow is certain to be non-stationary, and as the goal of the model is to develop an understandable descriptionof the forcing to complement further numerical and experimental testing, neither ofthese options is satisfactory. Moreover, in the limit of a very high speed manoeuvre itis reasonable to assume that the flow simply will not have time to convect significantly,making this term negligible; whereas in the limit of a very slow manoeuvre with significantvortex shedding, the average value of Γ in the wake will tend to zero, and therefore sowill the mean convective force.
Therefore, for simplicity, we focus solely on the generation term. Pitt Ford & Babinsky(2013) showed that net bound circulation was negligible for a flat-plate undergoing a rapidacceleration; nearly all circulation was contained in the trailing edge wake and LEV. Forthis reason, we suppose that all circulation is added to the flow at the leading and trailingedges such that at the instant that vorticity is added to the flow, the two small resultingvortices are separated by one chord length. From equation (2.10), the resultant force dueto the generation of vorticity is
Fγ = −ρcΓ (2.11)
where Γ is the rate of (absolute) circulation shed into the flow at one edge and thedirection of force is normal to the chord towards the suction side.
We can estimate the production of circulation at the trailing edge of the aerofoil byassuming that the fluid is detached on the suction side, such that the chord-normal
Unsteady dynamics of rapid perching manoeuvres 7
Figure 3: Sketch of the circulation production model. Velocity on the pressure side in-creases an amount equal to U⊥ while the separated fluid on the suction side does not.This differential speed leads to a circulation per unit length γ = ∆u‖ = U⊥ at the trailingedge. The negative vorticity in the wake, shown here as a blue line, increases in lengthat the trailing edge at a rate equal to the trailing-edge speed: ds
dt = Ute. This results in
the total rate of change of circulation Γ = dΓds
dsdt = UteU⊥. The circulation of the LEV
increases by an equal and opposite amount in accordance with Kelvin’s Theorem.
component of the velocity u⊥ only slowly decays with increased distance from the foil. Incontrast, the velocity field on the high-pressure side will quickly decay as in the potentialflow solution. Incompressibility of the flow therefore requires that the tangential velocityu‖ on the high pressure side increases an amount equal to the normal velocity of theaerofoil whereas the suction side does not (figure 3). The velocity difference across theaerofoil implies the fluid in the region of the trailing edge should be modelled as a vortexsheet with strength
γ = ∆u‖ = U⊥ (2.12)
where U⊥ is the velocity of the trailing edge of the aerofoil normal to the chord. Over atime dt this sheet streams off the aerofoil as the trailing edge covers a distance ds = Utedt.As dΓ = γds, the production of circulation in the fluid is therefore
Γ = UteU⊥. (2.13)
From equation (2.11), this results in a force coefficient of
CFγ =2UteU⊥U2
0
. (2.14)
It is informative to expand these speeds in terms of the aerofoil kinematics. We have
Ute =√U2 + 2Uη∗pcα sinα+ η∗2p c
2α2 (2.15)
U⊥ = U sinα+ η∗pcα (2.16)
η∗p ≡ 1− x∗p. (2.17)
Since α ∝ Ξ from equation (2.2), when Ξ � 1 we have Fγ → ρc(η∗pcα)2, showing thatthe translational component becomes negligible and that the production of circulationis dominated by the rotation of the sharp trailing edge. Also note that as Ξ → 0,
8 D. T. Polet, D. E. Rival and G. D. Weymouth
Fγ → ρc sin(α)U2, showing that this circulatory model has a quasi-steady contribution.Unlike the steady Kutta lift force, which is valid for attached flows at low angles of attack,this mean force estimate is chord-normal and assumes fully detached flow.
Returning to figure 2, we note that the circulatory forces increase with Ξ, and thepeak lift and drag at Ξ = 1/2 are ∼ 10 times the steady-state values. Because the forceis due solely to the production of leading and trailing-edge vorticity, energy is transferredin only one direction - from the aerofoil to the wake.
2.5. The net force on an aerofoil
By superimposing the added-mass (2.4) and circulatory (2.14) contributions we arrive atour analytic model of the force coefficient:
CF =2
U20
[sin(α)U + cα(1− x∗p)
]√U2 + 2Ucα(1− x∗p) sin(α) + c2α2(1− x∗p)2
+πc
2U20
[α cos(α)U + sin(α)U + cα(1/2− x∗p)
]. (2.18)
This model depends only on two geometric and two kinematic (time-dependent) param-eters: the chord length c, the pivot point x∗p, the translational speed U(t), and the angleof attack α(t).
We next present our experimental and numerical investigations of the two-dimensionalperching problem. We then discuss the results in the context of our simplified analyticmodel.
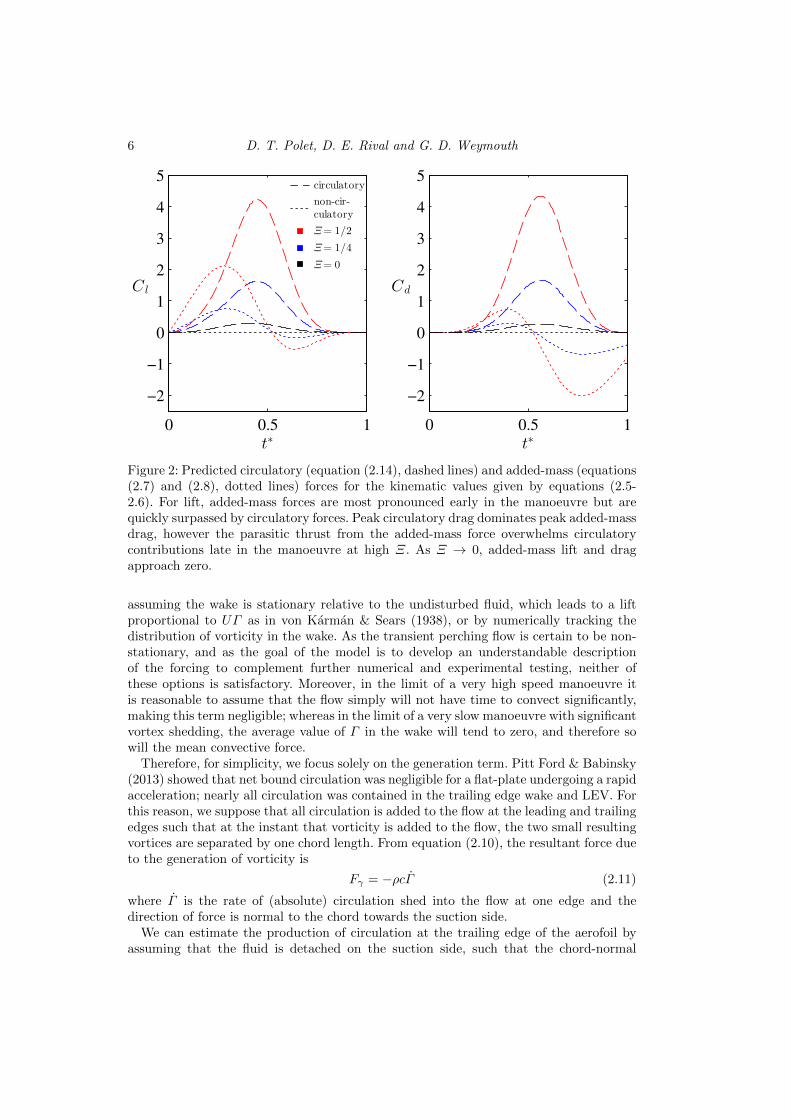
3. Experimental setup
To quantitatively assess the fluid dynamics induced by rapid perching, we performed aset of experimental manoeuvres by varying Ξ using a towed NACA0012 aerofoil. Forceson the aerofoil were measured directly, and the velocity field was measured using ParticleImage Velocimetry (PIV) to evaluate circulatory effects. All experiments were performedin a free-surface towing facility at the University of Calgary. The water channel testsection is 38.6cm wide, and water level was maintained at a 42cm depth. An aluminumNACA0012 aerofoil with 48mm chord was positioned midway between the channel wallsin a vertical orientation (figure 4b and 2c) and pierced the free surface from above. Theaerofoil tip was 4mm from the bottom of the test section to reduce tip effects. Thus theaerofoil had a submerged span of 416mm and an aspect ratio of 8.7. The high aspectratio further justifies the assumption of two-dimensional flow. A plastic skim plate of112mm diameter and 2mm thickness was secured to the aerofoil and sat 3mm below thewater surface. This skim plate eliminated the formation of free-surface funnel vortices.The aerofoil was attached at one end to an ATI Gamma force/torque balance. The forcebalance was attached to a two-phase stepper motor with 0.9◦ step angle. The pitchingaxis was c/6 from the leading edge. The apparatus was fixed to a Parker linear traverse,which ran along the length of the water channel.
The aerofoil first established a steady-state condition at α = 0◦ and speed U0 =0.45 m/s for at least 10 chord lengths before beginning rotation and deceleration. TheReynolds number at the beginning of the manoeuvre is therefore Re = U0c
ν = 22000, inthe range relevant for small, highly-manoeuvrable birds. The start of unsteady kinematicswas synced through an induction sensor at a fixed position on the traverse track, whichdetected the passing traverse stage. The kinematics follow those shown in figure 1 andequations (2.5) and (2.6).
Unsteady dynamics of rapid perching manoeuvres 9
Figure 4: (Colour online) (a) PIV setup, showing a laser (A) projecting a laser sheetinto the water tunnel from the side. The aerofoil (C), which is attached to the traversestage (B), is translated through the laser sheet with prescribed kinematics. A PhotronSA4 high-speed camera (D) filmed the manoeuvre through the glass bottom of the waterchannel. (b) The aerofoil attachment used for PIV and force measurements. The aerofoil(C) was attached to a 6-component force/torque balance (F), which in turn was attachedto a stepper motor (E). A plastic skim plate (G) prevented the formation of free surfacevortex funnels. The entire attachment was secured to the stage of a linear traverse (B),which sat on top of the water channel. (c) The aerofoil attachment used for steady forcemeasurements. The same aerofoil (C), skim plate (G), and force balance (F) attachmentas the unsteady setup (b) was used. The force balance was attached to a rotational stage(H), which in turn was secured to the traverse stage (B).
3.1. Force measurements
Force measurements were taken at a 1000 Hz sample rate (16 bit sample depth). Recordedforce data were averaged across 10 trials for each test case. The force measurements wererepeated for the same kinematics once water had been drained from the channel in orderto measure the non-hydrodynamic inertia of the system. Force data were transformedfrom an aerofoil-fixed frame to a lab-fixed frame, and the inertia was subtracted. Thetransformed data were further smoothed with a two-degree Butterworth low-pass filter.Filter frequency cutoff was chosen as 4 Hz for Ξ = 1/32 and 10 Hz for Ξ = 1/2. Filterfrequency cutoffs for intermediate Ξ were determined by interpolating linearly betweenthese values. This method was found to best preserve peaks while eliminating noise.To avoid time-shifting of data, a forward-backward filtering technique was used. Forcemeasurements were synchronized through the same induction sensor on the traverse trackthat triggered the deceleration.
Force measurements were also performed on the same aerofoil at a constant speed (0.45m/s) with the angle of attack varying between trials. α was varied from 0◦ to 5◦ with 1◦
increments, and from 5◦ to 90◦ with 5◦ increments using a rotational stage (figure 4c).The same measurements were performed for negative values of α to assess the symmetryof the setup. These measurements were used to make quasi-steady predictions (Ξ = 0).
Table 1: Estimates of uncertainty and signal-to-noise ratios (SNRdb, in decibels) for liftand drag. σf is the measured standard deviation of the peak force coefficient across trials,and σt is the measured standard deviation of peak force time. Clmax and Cdmax are thepeak average lift and drag coefficients, respectively.
Quasi-steady force coefficients were computed as
CF =2F
ρcS
U(α)2
U40
, (3.1)
where F is the measured force, U(α) is the speed of the aerofoil at a particular angle ofattack in the unsteady case, and U0 is the starting speed.
To estimate the uncertainty of force measurements, the standard deviations of peaklift and drag between trials at each shape change number were measured. Signal-to-noise ratios were also calculated between filtered and ensemble-averaged data. Values arepresented in table 1. The measured standard deviations of peak forces do not exceed 8%of the corresponding average peak value, and the measured standard deviations of thetime of peak forces do not exceed 4% of the corresponding period of deceleration andpitch.
3.2. Particle Image Velocimetry (PIV)
A 1 W, continuous-wave laser (λ= 532 nm) projected a laser sheet into a plane orthogonalto the aerofoil (figure 4a). This laser sheet was 21.1 cm above the water channel floor.The water was seeded with silver-coated, hollow glass spheres of 100 µm diameter. Theseparticles have a Stokes number of approximately 2.4×10⁻³, and therefore were assumedto accurately follow the fluid flow. As the aerofoil passed through the laser sheet, aPhotron SA4 high-speed camera (1024 × 1024 pixel resolution) captured images at 250frames per second. PIV data collection was synchronized with the same induction sensoron the traverse track that triggered the profile deceleration.
Raw images were preprocessed with a min/max contrast normalization filter of size16x16 pixels and a sliding-average subtraction filter of 50 pixel width. Velocity fields werecalculated with a multigrid/multipass cross-correlation algorithm using DaVis software(LaVision, v8.1.2). Velocity fields were averaged across nine trials.
Based on the random error estimates of Raffel et al. (2007), pixel displacement uncer-tainty is taken as δs = ±0.1px. Propagation of uncertainty through velocity and vorticitywith a 4 pixel spacing between velocity vectors yields
δω∗ =δs
4∆t√n
c
U0, (3.2)
where δω∗ is the non-dimensional uncertainty in vorticity, ∆t is the time interval between
Unsteady dynamics of rapid perching manoeuvres 11
frames and n is the number of trials. Given equation (3.2), the uncertainty in non-dimensional vorticity for PIV measurements is estimated as δω∗ = ±0.2.
4. Numerical method
A set of two-dimensional incompressible Navier-Stokes simulations of the model perch-ing problem introduced in section 2 were used to provide high-resolution data with theexact kinematics of this challenging test case. To further this aim, the Reynolds numberbased on the initial steady speed U0 is set to Re = 2000 in these simulations to ensure themodel flow remains fully two-dimensional near the foil and the vortex structures remainclean and easily identifiable.
The Boundary Data Immersion Method (BDIM), a robust immersed boundary methodsuitable for dynamic fluid-structure interaction problems detailed in Weymouth & Yue(2011) and Maertens & Weymouth (2015), was used for this purpose. Briefly, the fullNavier-Stokes equations and the prescribed body kinematics shown in figure 1 are con-volved with a kernel of support ε = 2h, where h is the grid spacing. The integratedequations are valid over the complete domain and allow for general solid-body dynamicsto be simulated. Previous work has validated this approach for a variety of dynamicrigid-body problems such as accelerating aerofoils (Wibawa et al. 2012) and deforming-body problems (Weymouth & Triantafyllou 2013). In Maertens & Weymouth (2015) thismethod was validated against stationary and flapping aerofoil test cases at moderate Reand found to produce accurate and efficient numerical solutions.
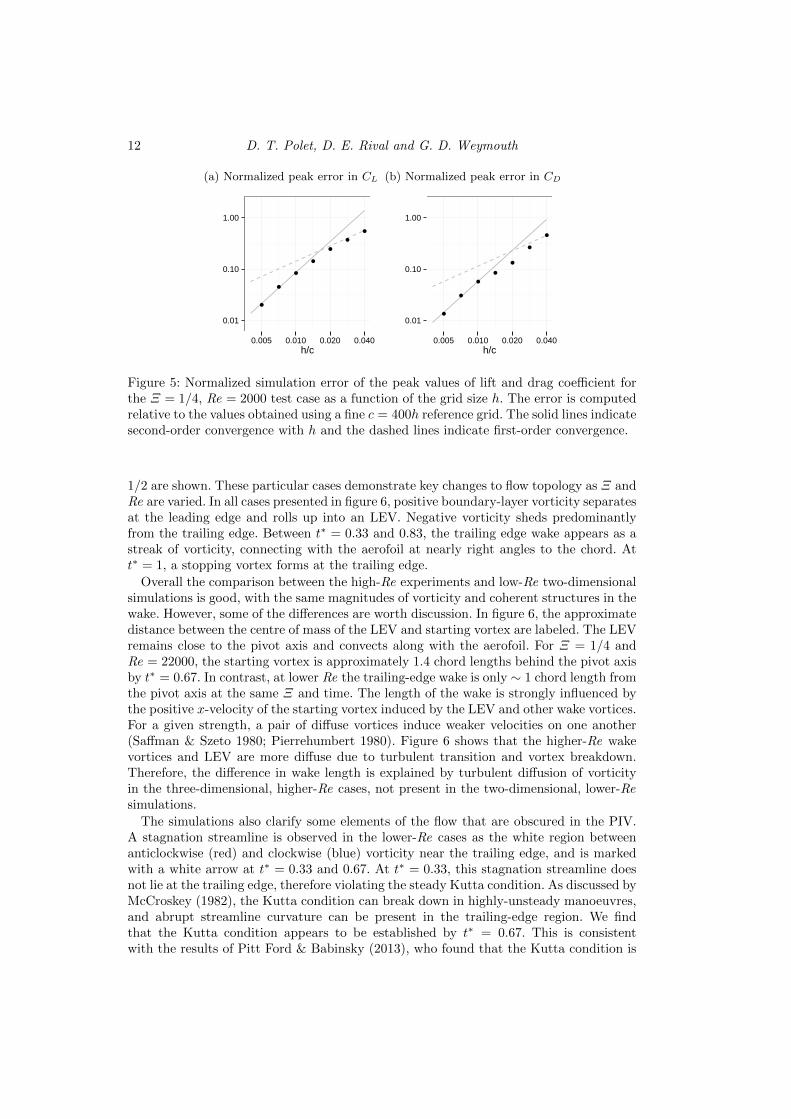
A non-inertial computational domain is used with dimensions 8c×8c, which translatesand decelerates with the body but does not rotate. All cases use the no-slip and no-penetration boundary conditions on the solid/fluid interface. No-penetration conditionsare applied on the top and bottom walls and a convection exit condition is used. Thecoupled BDIM equations are discretized using a finite-volume method (third-order con-vection and second-order diffusion) in space and Heun’s explicit second-order method intime. An adaptive time-stepping scheme is used to maintain stability. Figure 5 presentsa grid convergence study on the peak lift and drag coefficients for the Ξ = 1/4 test case.The results converge with second-order accuracy overall and the difference in the solutionbetween an extremely fine reference grid (using 400 points along the chord) and a 200point-per-chord grid is less than 2% in lift and drag. The velocity, pressure and vorticityfields for these grids are indistinguishable. This verifies the convergence of these viscoustwo-dimensional simulations and the 200 points-per-chord grid is used for the remainderof the paper.
5. Results and discussion
In §5.1, we present velocity-field measurements from two test cases (Ξ = 1/4 and1/2) using data from PIV at Re = 22000 and BDIM simulations at Re = 2000. In§5.2, we present results from force measurements and compare them to the low-orderanalytic model. First, we compare instantaneous forces between Re at high Ξ and discussdifferences in view of observed flow topology. Next, we compare the model to results froma large range of Ξ. Finally, in §5.3 we present the time-averaged lift and drag generatedduring the manoeuvre with applications to functional trade-offs in landing birds.
5.1. Velocity-field results
Figure 6 shows vorticity fields arising from the perching manoeuvre, derived from PIV atRe = 22000 and simulations at Re = 2000. For each Re, key timesteps from Ξ = 1/4 and
12 D. T. Polet, D. E. Rival and G. D. Weymouth
(a) Normalized peak error in CL
●
●
●
●
●
●
●
0.01
0.10
1.00
0.005 0.010 0.020 0.040h/c
(b) Normalized peak error in CD
●
●
●
●
●
●
●
0.01
0.10
1.00
0.005 0.010 0.020 0.040h/c
Figure 5: Normalized simulation error of the peak values of lift and drag coefficient forthe Ξ = 1/4, Re = 2000 test case as a function of the grid size h. The error is computedrelative to the values obtained using a fine c = 400h reference grid. The solid lines indicatesecond-order convergence with h and the dashed lines indicate first-order convergence.
1/2 are shown. These particular cases demonstrate key changes to flow topology as Ξ andRe are varied. In all cases presented in figure 6, positive boundary-layer vorticity separatesat the leading edge and rolls up into an LEV. Negative vorticity sheds predominantlyfrom the trailing edge. Between t∗ = 0.33 and 0.83, the trailing edge wake appears as astreak of vorticity, connecting with the aerofoil at nearly right angles to the chord. Att∗ = 1, a stopping vortex forms at the trailing edge.
Overall the comparison between the high-Re experiments and low-Re two-dimensionalsimulations is good, with the same magnitudes of vorticity and coherent structures in thewake. However, some of the differences are worth discussion. In figure 6, the approximatedistance between the centre of mass of the LEV and starting vortex are labeled. The LEVremains close to the pivot axis and convects along with the aerofoil. For Ξ = 1/4 andRe = 22000, the starting vortex is approximately 1.4 chord lengths behind the pivot axisby t∗ = 0.67. In contrast, at lower Re the trailing-edge wake is only ∼ 1 chord length fromthe pivot axis at the same Ξ and time. The length of the wake is strongly influenced bythe positive x-velocity of the starting vortex induced by the LEV and other wake vortices.For a given strength, a pair of diffuse vortices induce weaker velocities on one another(Saffman & Szeto 1980; Pierrehumbert 1980). Figure 6 shows that the higher-Re wakevortices and LEV are more diffuse due to turbulent transition and vortex breakdown.Therefore, the difference in wake length is explained by turbulent diffusion of vorticityin the three-dimensional, higher-Re cases, not present in the two-dimensional, lower-Resimulations.
The simulations also clarify some elements of the flow that are obscured in the PIV.A stagnation streamline is observed in the lower-Re cases as the white region betweenanticlockwise (red) and clockwise (blue) vorticity near the trailing edge, and is markedwith a white arrow at t∗ = 0.33 and 0.67. At t∗ = 0.33, this stagnation streamline doesnot lie at the trailing edge, therefore violating the steady Kutta condition. As discussed byMcCroskey (1982), the Kutta condition can break down in highly-unsteady manoeuvres,and abrupt streamline curvature can be present in the trailing-edge region. We findthat the Kutta condition appears to be established by t∗ = 0.67. This is consistentwith the results of Pitt Ford & Babinsky (2013), who found that the Kutta condition is
Unsteady dynamics of rapid perching manoeuvres 13
Figure 6: PIV measurements (Re = 22000) and simulations (Re = 2000) of vorticity fieldsat Ξ = 1/4 (top) and Ξ = 1/2 (bottom). Black dotted lines represent the approximatex-position of the centre-of-mass of the starting vortex and LEV. The the high Re Ξ = 1/4case, the starting vortex trails behind the LEV by a distance of x/c = 1.4 at t∗ = 0.67,whereas the starting vortex trails less than x/c = 1.0 behind the LEV in the other cases.The white arrows, shown at Re = 2000, point to a stagnation streamline that connectswith the aerofoil near the trailing edge. At t∗ = 0.33, the stagnation streamline does notlie at the trailing edge. By t∗ = 0.67, the stagnation streamline has moved to the aerofoiltip. The reference frame translates such that the origin is fixed at the pivot point. Theaerofoil is translating in the positive x-direction. Grey-shaded areas in PIV plots denoteregions that have been masked due to shadowing effects or visual obstruction. Vorticityis non-dimensionalized by ω∗ = ωc/U0.
14 D. T. Polet, D. E. Rival and G. D. Weymouth
t∗0 0.5 1
Cd
-2
0
2
4
t∗0 0.5 1
Cl
0
2
4
6Re = 22000
Re = 2000
Model
Ξ = 1/2Ξ = 1/4Ξ = 1/8
Figure 7: A comparison between force results from experiments at Re = 22000 (solidlines), simulations at Re = 2000 (dotted lines), and model predictions (dot-dash lines)for 1/8 6 Ξ 6 1/2. The magnitudes and timing of peaks in drag are similar between Recases. The timing of peak lift is similar as well. However, magnitudes of lift are similaronly in the Ξ = 1/2 case. Model predictions are in close agreement with low-Re forcehistories.
violated early in an impulsive manoeuvre due to the presence of the starting vortex, butis established as distance from the starting vortex increases.
5.2. Force history
The forces on the aerofoil from the Re = 2000 simulations and Re = 22000 experimentsfor shape change numbers of 1/8, 1/4 and 1/2 are shown in figure 7 along with the modelpredictions from equation (2.18). In all cases, general trends predicted by the analyticmodel are observed: a single lift peak appears close to t∗ = 0.4, a drag peak appearsclose to t∗ = 0.5, a thrust peak appears late in the manoeuvre, and the magnitudes ofall peaks increase with Ξ.
Overall, the model agrees with low-Re lift at all Ξ, suggesting that added-mass forcescombined with boundary-layer separation at the leading and trailing edges are the dom-inant mechanisms of lift generation in low-Re cases. In the higher-Re cases, however,vortex convection appears to be an important lift-generating mechanism. The vorticityfields shown in figure 6 indicate that streamwise vortex convection is greater at Re=22000than at Re=2000 for Ξ = 1/4, and the force measurements support this by showing in-creased lift forces on the aerofoil for Ξ 6 1/4 relative to the simulations and the model.Again, the differences in vortex convection between Re cases are attributed to turbulentdiffusion at higher Re not present in the simulation resulting in convective force that wasneglected in the analytic force model.
Drag histories compare well between the model, simulations, and experiment, particu-larly in the large drag peak for t∗ < 0.75 when added-mass and boundary-layer separationare the dominant mechanism of force generation. From 0.75 < t∗ < 1, the measurementsand simulations demonstrate the parasitic thrust forces predicted by the added-mass
Unsteady dynamics of rapid perching manoeuvres 15
t∗0 0.5 1
Cd
-0.5
0
0.5
1
t∗0 0.5 1
Cl
-0.5
0
0.5
1
Re = 22000
Model
Ξ = 1/8Ξ = 1/16Ξ = 1/32Ξ = 0
Figure 8: Lift and drag coefficients in non-dimensionalized time, plotted for varying Ξ.The magnitudes of forces increase with Ξ. At lower Ξ, results approach quasi-steadypredictions (solid black line). The model is overlaid as a dot-dash line. Experiment agreeswith the model best at low shape change numbers numbers. The Ξ = 0 case displays apeak lift at pre-stall angles of attack.
model. The magnitude of the thrust measured for Ξ = 1/2 at higher-Re is larger thanthat predicted by the combined model, but in line with the thrust predicted by theadded-mass estimate in equation (2.3). This indicates that the model over-predicts thevortex drag late in the manoeuvre, probably due to interaction effects between the LEVand trailing edge wake as the aerofoil comes to a stop.
Figure 7 shows that the accuracy of the model in lift generally increases as Ξ increasesfor higher-Re. In §2.4, we proposed that the model would also become more accurate inthe quasi-steady limit because of the von Karman vortex street which drives the meanconvective force to zero. To assess agreement as Ξ → 0, we performed force measurementsat Re = 22000 with shape change numbers varying from 1/8 to 0 (figure 8). As Ξ isreduced, measured forces approach quasi-steady values at Ξ = 0. In the quasi-steadycase, note that increased ‘time’ in figure 8 corresponds to increased angle of attack viaequation (2.6), and the mean forces are shown scaled as in equation (3.1).
A continuation of the trends in figure 7 are observed in figure 8: single peaks in lift, dragand thrust are observed, and the magnitudes of these force peaks continue to decrease asΞ decreases. As proposed, the model predicts the quasi-steady measurements well overallas long as the angle of attack is sufficiently large to induce shedding from the leading andtrailing edge. The flow remains attached along the suction side of this NACA aerofoilsection below α ∼ 15◦ → t∗ ∼ 0.4, enhancing lift well above model predictions. At highangles of attack vortices shed rapidly from the trailing and leading edges, the foil stallsand the lift drops rapidly. Once this rapid shedding begins, the assumptions of the modelare satisfied, explaining the better agreement at large t∗. Similarly, in the Ξ = 1/32 caselift drops off suddenly after reaching its peak and thereafter is closely predicted by themodel. The peak and decay in lift for Ξ = 1/32 occur at a higher angle of attack thanfor Ξ = 0, which is a manifestation of dynamic stall, a phenomenon in which boundary-
16 D. T. Polet, D. E. Rival and G. D. Weymouth
Ξ
0 0.1 0.2 0.3 0.4 0.5
Cl
0
0.5
1
1.5
2
2.5
Re = 22000
Re = 2000
Model
Ξ
0 0.1 0.2 0.3 0.4 0.5
Cd
0
0.2
0.4
0.6
0.8
1
1.2
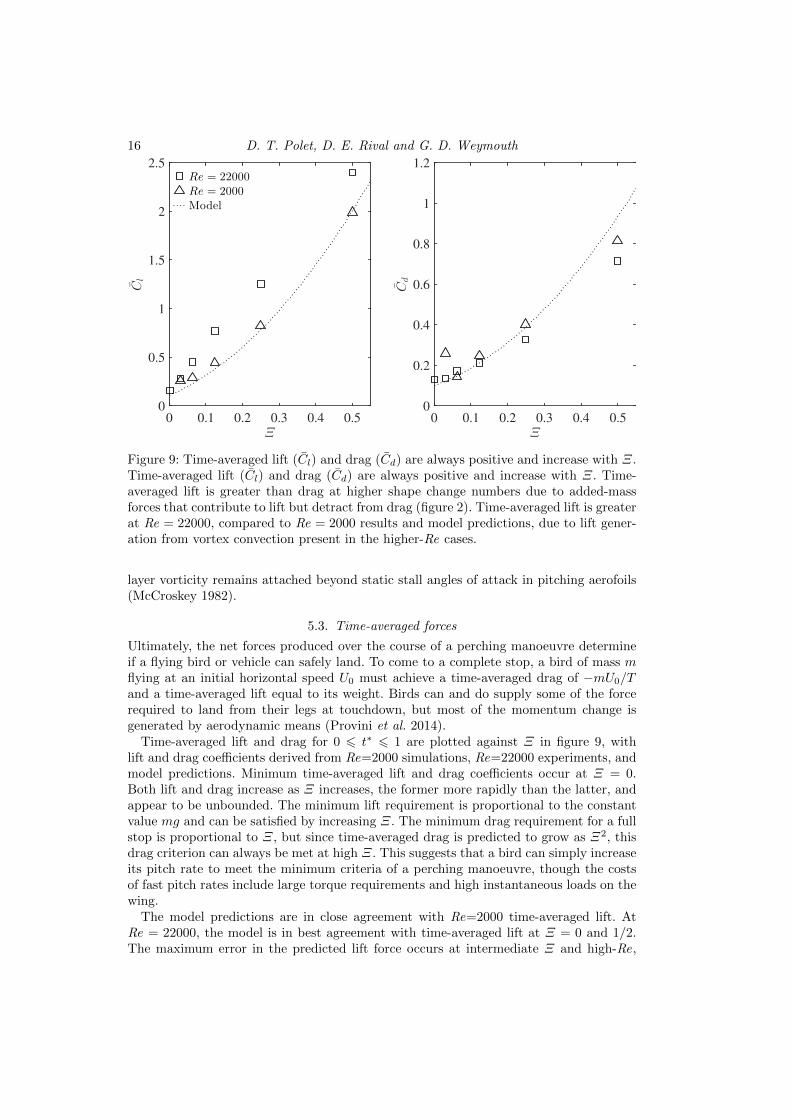
Figure 9: Time-averaged lift (Cl) and drag (Cd) are always positive and increase with Ξ.Time-averaged lift (Cl) and drag (Cd) are always positive and increase with Ξ. Time-averaged lift is greater than drag at higher shape change numbers due to added-massforces that contribute to lift but detract from drag (figure 2). Time-averaged lift is greaterat Re = 22000, compared to Re = 2000 results and model predictions, due to lift gener-ation from vortex convection present in the higher-Re cases.
layer vorticity remains attached beyond static stall angles of attack in pitching aerofoils(McCroskey 1982).
5.3. Time-averaged forces
Ultimately, the net forces produced over the course of a perching manoeuvre determineif a flying bird or vehicle can safely land. To come to a complete stop, a bird of mass mflying at an initial horizontal speed U0 must achieve a time-averaged drag of −mU0/Tand a time-averaged lift equal to its weight. Birds can and do supply some of the forcerequired to land from their legs at touchdown, but most of the momentum change isgenerated by aerodynamic means (Provini et al. 2014).
Time-averaged lift and drag for 0 6 t∗ 6 1 are plotted against Ξ in figure 9, withlift and drag coefficients derived from Re=2000 simulations, Re=22000 experiments, andmodel predictions. Minimum time-averaged lift and drag coefficients occur at Ξ = 0.Both lift and drag increase as Ξ increases, the former more rapidly than the latter, andappear to be unbounded. The minimum lift requirement is proportional to the constantvalue mg and can be satisfied by increasing Ξ. The minimum drag requirement for a fullstop is proportional to Ξ, but since time-averaged drag is predicted to grow as Ξ2, thisdrag criterion can always be met at high Ξ. This suggests that a bird can simply increaseits pitch rate to meet the minimum criteria of a perching manoeuvre, though the costsof fast pitch rates include large torque requirements and high instantaneous loads on thewing.
The model predictions are in close agreement with Re=2000 time-averaged lift. AtRe = 22000, the model is in best agreement with time-averaged lift at Ξ = 0 and 1/2.The maximum error in the predicted lift force occurs at intermediate Ξ and high-Re,
Unsteady dynamics of rapid perching manoeuvres 17
owing to neglect of the additional lift mechanism of vortex convection, but is alwaysless than 33%. Model predictions also agree with lower-Re time-averaged drag and areslightly lower than higher-Re results at low Ξ. The large thrust late in the Ξ = 1/2experiment reduces the accuracy of the average for that case.
The model predicts that time-averaged lift is much higher than drag at larger Ξ. Thisis due to added-mass forces that contribute to lift but detract from drag (figure 2).The large differences in integrated lift and drag are amplified by increasing Re to 22000,primarily due to lift generation from vortex convection. A landing bird may thus generategreater time-averaged lift than drag during a pitch-up manoeuvre. This may help explainwhy the eagle observed by Carruthers et al. (2007) would consistently approach its perchfrom below, and exhibited a rapid increase in altitude during its pitch-up phase. As theauthors of that study suggested, this may be a means to aid deceleration by transferringkinetic energy to potential energy. However, it may also be that the pitching manoeuvrenecessary to generate the required drag produces so much excess lift that an altitudecorrection is needed to avoid overshooting the perch.
6. Summary and conclusions
In this study we investigate how high lift and drag can be generated through a con-trolled pitch-up manoeuvre in the context of bird perching. As a simple perching model,we study the aerodynamics of an aerofoil that simultaneously decelerates and pitches toa high angle of attack. The pitch rate and deceleration is parameterized by the shapechange number, Ξ, a ratio between the speed of frontal area expansion and initial trans-lational speed. We investigate differences in forces and vorticity fields as shape changenumber is varied from 0 to 1/2, using force measurements and Particle Image Velocime-try at Re = 22000 and simulations using the Boundary Data Immersion Method atRe = 2000. A simple analytic model that includes forces from added-mass effects andboundary layer separation at the leading and trailing edges is derived and compared tothe measurements.
The simulations and PIV measurements for Ξ = 1/4 and Ξ = 1/2 reveal that the wakeof the perching aerofoil is dominated by a large leading edge vortex, which remains closeto the foil, and the trailing edge vorticity, which forms a vortex shear layer that rolls updue to Kelvin-Helmholtz instability. The distance between the leading and trailing edgestructures is found to be greater than the chord length c in the Re = 22000 and Ξ = 1/4case, indicating that vortex convection, neglected in the analytic model, is present inthis case. The trailing edge separation point was found to be located on the suction sideof the foil initially, only moving to the aerofoil tip halfway through the manoeuvre, inagreement with previous experiments.
Both experiments and simulations demonstrated that the lift and drag forces increasesuper-linearly with Ξ, achieving peak values of Cl = 5.3 and Cd = 4.0 at Ξ = 1/2,which are more than an order of magnitude larger than their steady-state peak values.The aerofoil is found to experience parasitic thrust at the end of the manoeuvre, but theaverage drag on the aerofoil is always positive and increases with Ξ.
Analogous to previous rapid area change studies, we find that added-mass energy inthe perching problem is transferred from the immersed body to the fluid as the frontalarea and added-mass increases, producing large lift and small drag. This energy is thenrecovered by the aerofoil late in the manoeuvre in the form of a parasitic thrust, whichwould be counterproductive to a decelerating manoeuvre. However, a simple model ofthe vortex force developed in this work predicts that the generation of circulation at theleading and trailing edges dissipates enough energy into the wake to nearly overwhelm
18 D. T. Polet, D. E. Rival and G. D. Weymouth
this parasitic thrust. We find that the analytic model agrees best with force historiesat lower Re, and with higher Re cases in the limits of quasi-steady and near-impulsiverotation. In particular, the effects of vortex convection were found to be negligible afterstall in near steady-state manoeuvres, overwhelmed by the production of vorticity inrapid manoeuvres, and account for no more than 1/3 of the average force in intermediatecases. As these forces can be difficult to estimate in transient flows, the simple kinematicmodel developed in this work is of great utility.
The large forces observed suggest that pitching rates can be tuned to meet the demand-ing lift and drag requirements of landing manoeuvres. Rapid pitch-up may therefore bea means by which a landing bird can maintain lift while quickly braking to a controlledstop and could be effectively applied in manoeuvrable micro-aerial vehicles in the nearfuture.
Acknowledgements
The authors wish to thank the Natural Sciences and Engineering Research Council ofCanada and Alberta Innovates Technology Futures for financial support.
REFERENCES
Baik, Y., Bernal, L., Granlund, K. & Ol, M. 2012 Unsteady force generation and vortexdynamics of pitching and plunging aerofoils. Journal of Fluid Mechanics 709, 37–68.
Berg, A.M. & Biewener, A.A. 2010 Wing and body kinematics of takeoff and landing flightin the pigeon (columbia livia). Journal of Experimental Biology 213, 1651–1658.
Carruthers, Anna C., Thomas, Adrian L. R. & Taylor, Graham K. 2007 Automaticaeroelastic devices in the wings of a steppe eagle aquila nipalensis. Journal of ExperimentalBiology 210 (23), 4136–4149.
Carruthers, Anna C., Thomas, Adrian L. R., Walker, Simon M. & Taylor, Gra-ham K. 2010 Mechanics and aerodynamics of perching manoeuvres in a large bird of prey.Aeronautical Journal 114 (1161), 673–680.
Doyle, C.E., Bird, J.J., Isom, T.A, Johnson, C.J., Kallman, J.C., Simpson, J.A, King,R.J., Abbott, J.J. & Minor, M.A 2011 Avian-inspired passive perching mechanism forrobotic rotorcraft. In Intelligent Robots and Systems (IROS), 2011 IEEE/RSJ InternationalConference on, pp. 4975–4980.
Garmann, Daniel J., Visbal, Miguel. & Orkwis, Paul D. 2013 Three-dimensional flowstructure and aerodynamic loading on a revolving wing. Physics of Fluids 25, 034101.
Green, Patrick R & Cheng, Peter 1998 Variation in kinematics and dynamics of the landingflights of pigeons on a novel perch. Journal of experimental biology 201 (24), 3309–3316.
von Karman, T. & Sears, W. R. 1938 Airfoil theory for non-uniform motion. Journal ofAeronautical Sciences 5, 379–390.
Maertens, A. P. & Weymouth, G. D. 2015 Accurate cartesian-grid simulations of near-body flows at intermediate reynolds numbers. Computer Methods in Applied Mechanicsand Engineering 283, 106–129.
London.Moore, Joseph, Cory, Rick & Tedrake, Russ 2014 Robust post-stall perching with a simple
fixed-wing glider using lqr-trees. Bioinspiration & Biomimetics 9 (2), 025013.Ol, Michael V., Bernal, Luis, Kang, Chang-Kwon & Shyy, Wei 2009 Shallow and deep
dynamic stall for flapping low Reynolds number airfoils. Experiments in Fluids 46, 883–901.Pierrehumbert, RT 1980 A family of steady, translating vortex pairs with distributed vorticity.
Journal of Fluid Mechanics 99 (01), 129–144.Pitt Ford, C. W. & Babinsky, H. 2013 Lift and the leading edge vortex. Journal of Fluid
Mechanics 720, 280–313.
Unsteady dynamics of rapid perching manoeuvres 19
Provini, Pauline, Tobalske, Bret W., Crandell, Kristen E. & Abourachid, Anick2014 Transition from wing to leg forces during landing in birds. The Journal of ExperimentalBiology .
Raffel, Markus, Willert, Christian, Wereley, Steve & Kompenhans, Jurgen 2007Particle image velocimetry: a practical guide, 2nd edn. Springer.
Reich, Gregory, Wojnar, Olek & Albertani, Roberto 2009 Aerodynamic performanceof a notional perching mav design. In 47th AIAA Aerospace Sciences Meeting includingThe New Horizons Forum and Aerospace Exposition. American Institute of Aeronauticsand Astronautics.
Saffman, PG & Szeto, R 1980 Equilibrium shapes of a pair of equal uniform vortices. Physicsof Fluids (1958-1988) 23 (12), 2339–2342.
Theodorsen, T 1935 General theory of aerodynamic instability and the mechanism of flutter.NACA Report 496 .
Wagner, Herbert 1925 Uber die entstehung des dynamischen auftriebes von tragflugeln.ZAMM-Journal of Applied Mathematics and Mechanics/Zeitschrift fur Angewandte Math-ematik und Mechanik 5 (1), 17–35.
Weymouth, G.D. & Triantafyllou, M. S. 2012 Global vorticity shedding for a shrinkingcylinder. Journal of Fluid Mechanics 702, 470–487.
Weymouth, G.D. & Triantafyllou, M. S. 2013 Ultra-fast escape of a deformable jet-propelled body. Journal of Fluid Mechanics 721, 367–385.
Weymouth, G.D. & Yue, D.K.-P. 2011 Boundary data immersion method for cartesian-gridsimulations of fluid-body interaction problems. Journal of Computational Physics 230 (16),6233 – 6247.
Wibawa, M. S., Steele, S. C., Dahl, J. M., Rival, D. E., Weymouth, G. D. & Tri-antafyllou, M. S. 2012 Global vorticity shedding for a vanishing wing. Journal of FluidMechanics 695, 112–134.
Xia, X. & Mohseni, K. 2013 Lift evaluation of a two-dimensional pitching flat plate. Physicsof Fluids 25, 091901.