24
Update – 1 st Half 2016
Update – 1st Half 2016

This presentation is made to provide information. No representation or warranty is made as tothe fairness, accuracy, completeness or correctness of the information, opinions and conclusionscontained within this presentation. All information including business forward plans in thispresentation should not be considered as a recommendation in relation to holding purchasing orselling shares in any jurisdiction. No copy or use of this presentation should occur without thepermission of PT INDUSTRI JAMU DAN FARMASI SIDO MUNCUL TBK.
Disclaimer
INTRODUCTION
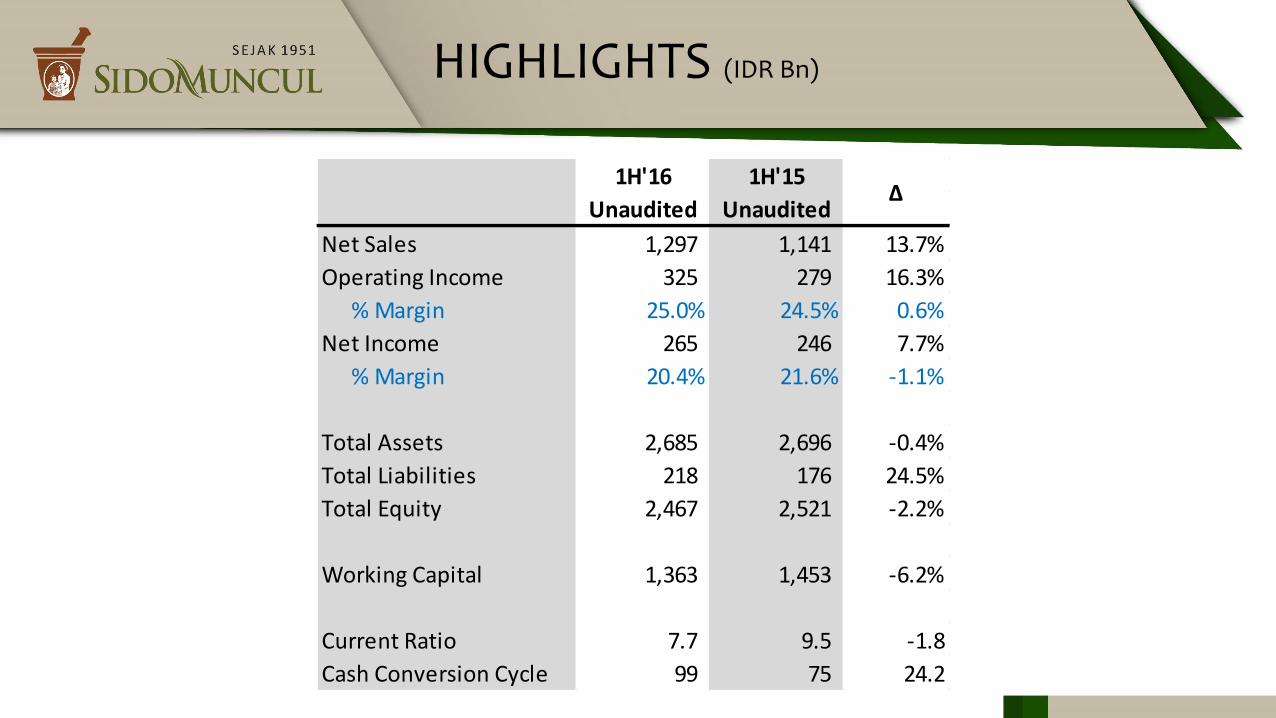
HIGHLIGHTS (IDR Bn)
1H'16 1H'15
Unaudited Unaudited
Net Sales 1,297 1,141 13.7%
Operating Income 325 279 16.3%
% Margin 25.0% 24.5% 0.6%
Net Income 265 246 7.7%
% Margin 20.4% 21.6% -1.1%
Total Assets 2,685 2,696 -0.4%
Total Liabilities 218 176 24.5%
Total Equity 2,467 2,521 -2.2%
Working Capital 1,363 1,453 -6.2%
Current Ratio 7.7 9.5 -1.8
Cash Conversion Cycle 99 75 24.2
∆

MILESTONES
1940 1984
The company initially was a domestic herbalmedicine industry managed by Mrs. RahmatSulistio in Yogyakarta.
The production process was moved toSemarang, and an unpretentious companywas founded with the name SIDO MUNCULwhich means “a dream come true” with itsfirst factory located in Jl. Mlaten Trenggulun,Semarang.
1951 1970
The limited partnership was formedunder the name CV Industri Jamu &Farmasi Sido Muncul.
The factory was moved to LingkunganIndustri Kecil Semarang. The plant beganto be equipped with modern machinery.
Establishment of herbal medicineindustry turned into a Limited Companyunder the name of PT Industri Jamu danFarmasi Sido Muncul.
1975
Cornerstone-laying was held for theconstruction of a new, bigger and moremodern factory in Klepu, Ungaran by SriSultan Hamengkubuwono X and witnessed byDirector General of Food and DrugAdministration.
1997
The new factory is located in Klepu, subBergas, Ungaran with an area of about 30hectares..
2000
Sido Muncul conducted initial publicoffering of 1,500,000,000 shares withthe issue price of Rp 580.- per share.
2013
PT Berlico Mulia Farma joined the SidoMuncul Group, expanding Sido Muncul’sbusiness in pharmaceutical industry.
2014
The expansion of extraction plantof PT Semarang Herbal Indo Plantwas completed and fullyoperational.
2015

BUSINESS OVERVIEW

PRODUCT PORTFOLIO
HERBAL&
SUPPLEMENT
FOOD&
BEVERAGES
PHARMACEUTICAL
Medan
Batam
PadangBangka
Belitung
Palembang
Bandar Lampung
Bengkulu
Jambi
Samarinda
Tarakan
Pontianak
Ketapang
Banjarmasin
Manado
GorontaloPalu
Kendari
Makassar
Ambon
Tobelo
Ternate
BiakSorong
Manokwari
Nabire
Timika
Jayapura
Merauke
Atambua
KupangSumbawa
LombokBali
Jakarta
Surabaya
YogyakartaSolo
Cilacap
Tangerang
Purwakarta
Cilacap
Madura
Jombang
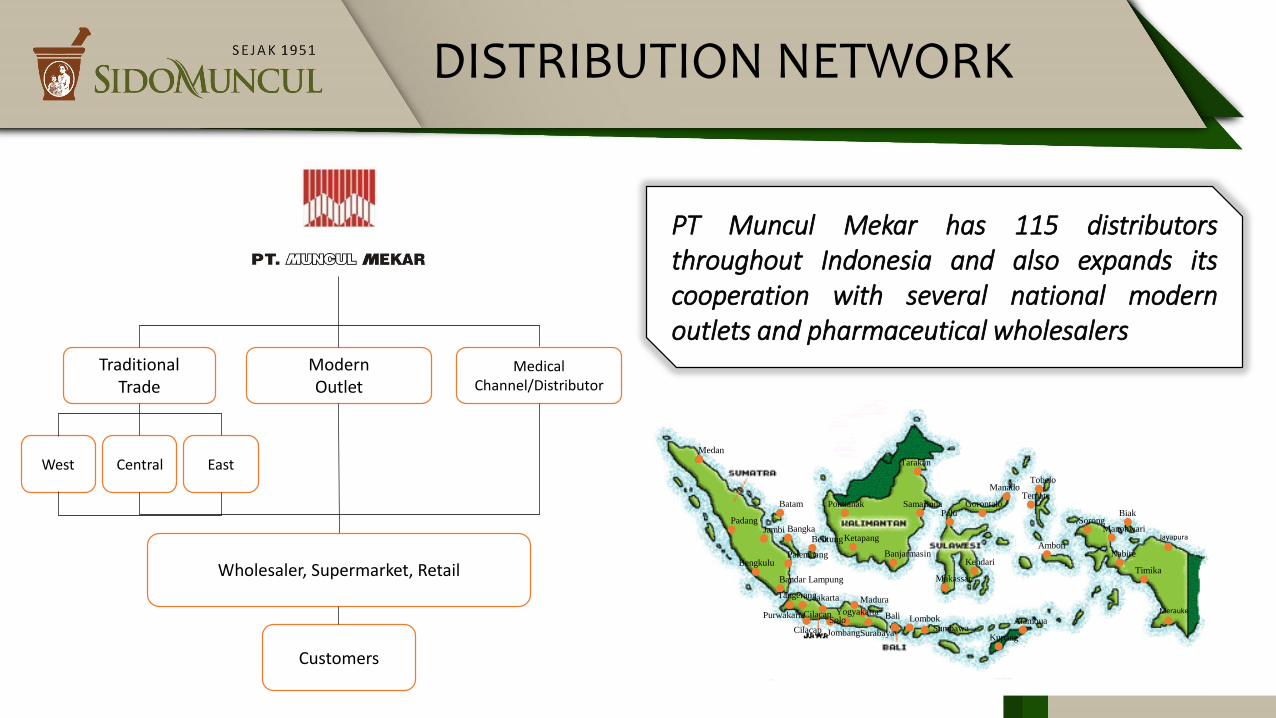
DISTRIBUTION NETWORK
PT Muncul Mekar has 115 distributorsthroughout Indonesia and also expands itscooperation with several national modernoutlets and pharmaceutical wholesalers
TraditionalTrade
ModernOutlet
MedicalChannel/Distributor
West EastCentral
Wholesaler, Supermarket, Retail
Customers
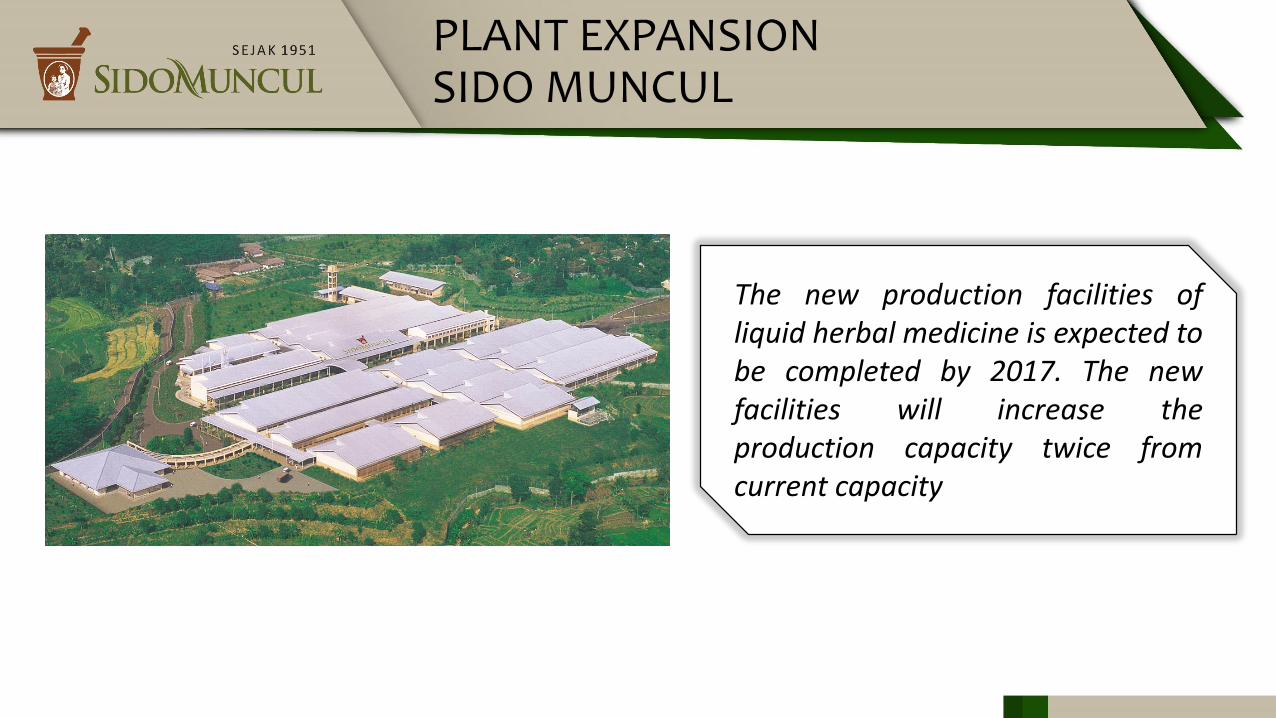
PLANT EXPANSIONSIDO MUNCUL
The new production facilities ofliquid herbal medicine is expected tobe completed by 2017. The newfacilities will increase theproduction capacity twice fromcurrent capacity
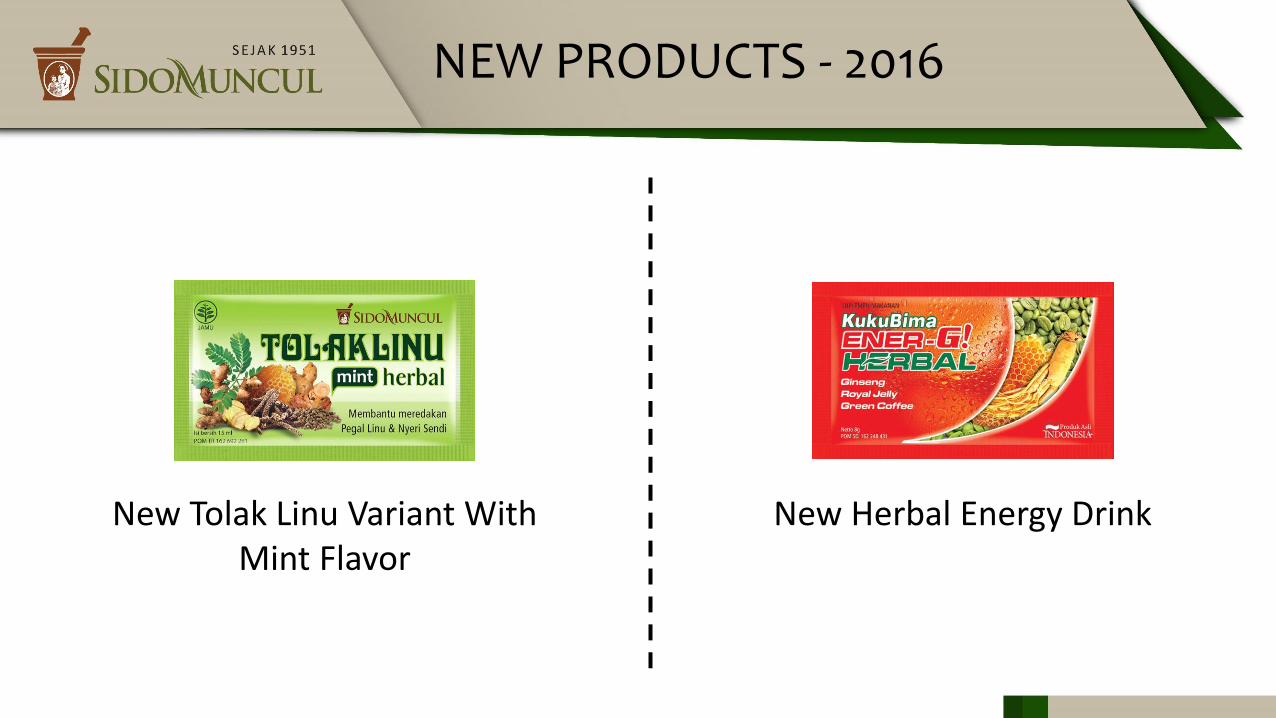
NEW PRODUCTS - 2016
New Tolak Linu Variant With Mint Flavor
New Herbal Energy Drink

FINANCIAL OVERVIEW
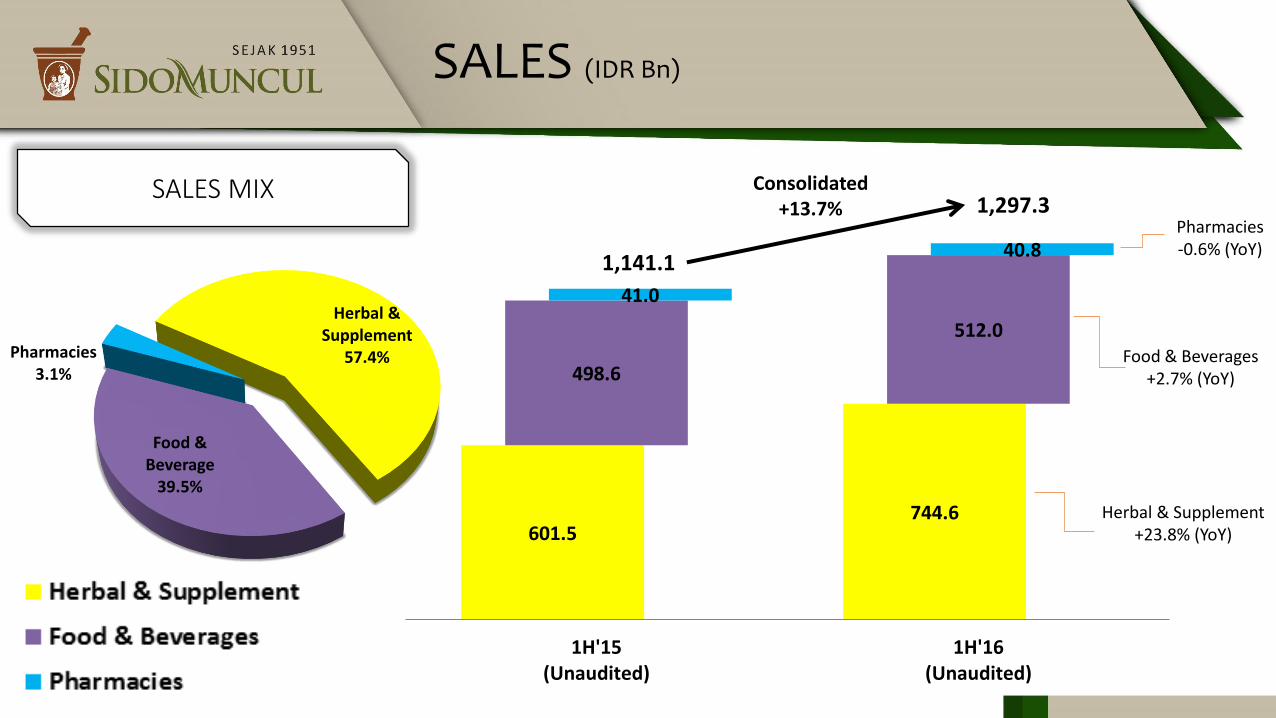
601.5 744.6
498.6
512.0
41.0
40.8
1H'15(Unaudited)
1H'16(Unaudited)
SALES (IDR Bn)
SALES MIX
1,141.1
1,297.3Consolidated
+13.7%Pharmacies-0.6% (YoY)
Food & Beverages+2.7% (YoY)
Herbal & Supplement+23.8% (YoY)
Herbal & Supplement
57.4%
Food & Beverage
39.5%
Pharmacies3.1%
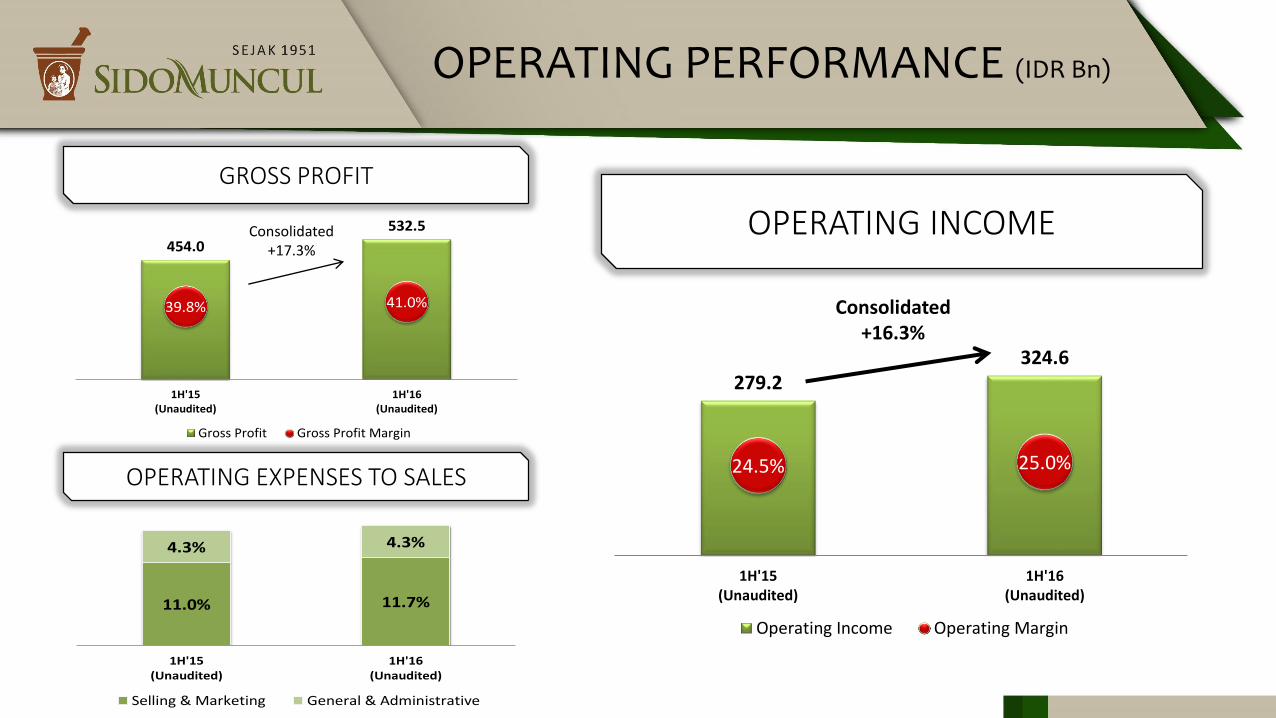
279.2 324.6
24.5% 25.0%
1H'15(Unaudited)
1H'16(Unaudited)
Operating Income Operating Margin
11.0% 11.7%
4.3% 4.3%
1H'15(Unaudited)
1H'16(Unaudited)
Selling & Marketing General & Administrative
454.0
532.5
39.8% 41.0%
1H'15(Unaudited)
1H'16(Unaudited)
Gross Profit Gross Profit Margin
OPERATING PERFORMANCE (IDR Bn)
OPERATING EXPENSES TO SALES
GROSS PROFIT
OPERATING INCOMEConsolidated+17.3%
Consolidated+16.3%
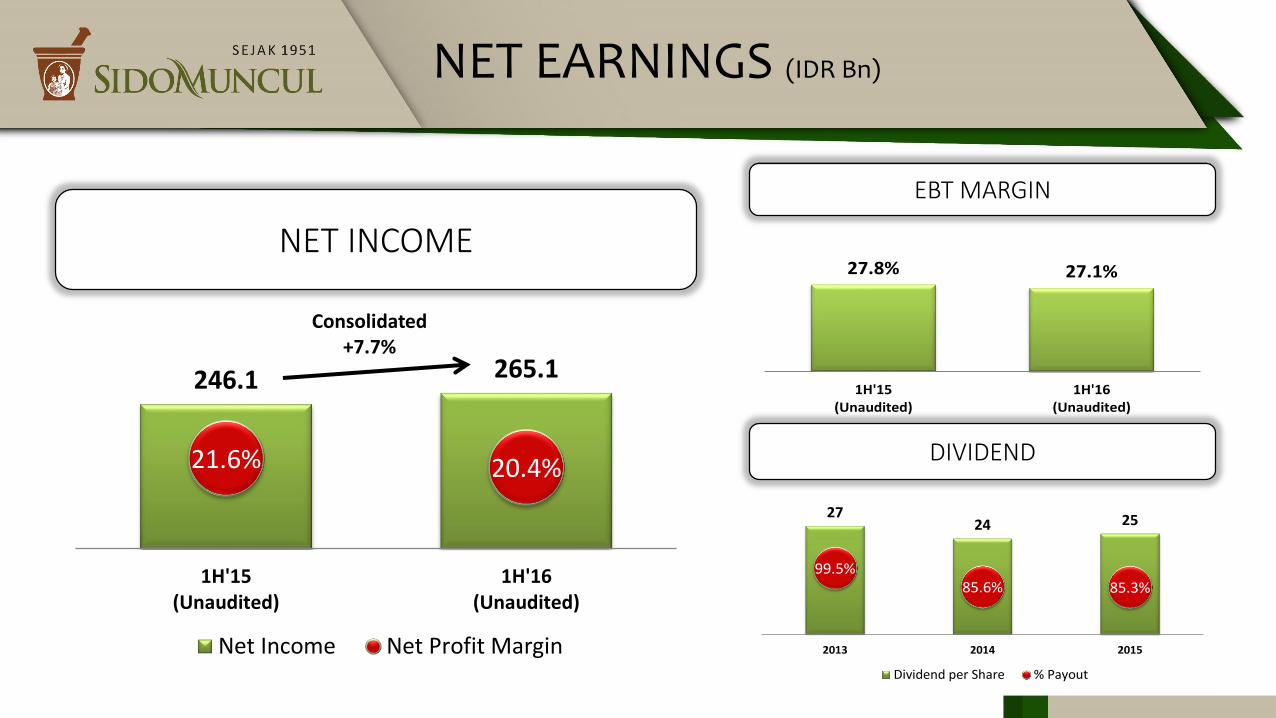
2724 25
99.5%85.6% 85.3%
2013 2014 2015
Dividend per Share % Payout
27.8% 27.1%
1H'15(Unaudited)
1H'16(Unaudited)
246.1 265.1
21.6% 20.4%
1H'15(Unaudited)
1H'16(Unaudited)
Net Income Net Profit Margin
NET EARNINGS (IDR Bn)
NET INCOME
DIVIDEND
EBT MARGIN
Consolidated+7.7%

79 78 86
99
2013(Audited)
2014(Audited)
2015(Audited)
1H'16(Unaudited)
0.0 0.0 0.0 0.0
2013(Audited)
2014(Audited)
2015(Audited)
1H'16(Unaudited)
FINANCIAL POSITION (IDR Bn)
ASSETS & EQUITY
CASH CONVERSION
DEBT POSITION
2,955
2,821 2,796
2,685 2,614 2,625 2,598
2,467
2013(Audited)
2014(Audited)
2015(Audited)
1H'16(Unaudited)
Assets Equity
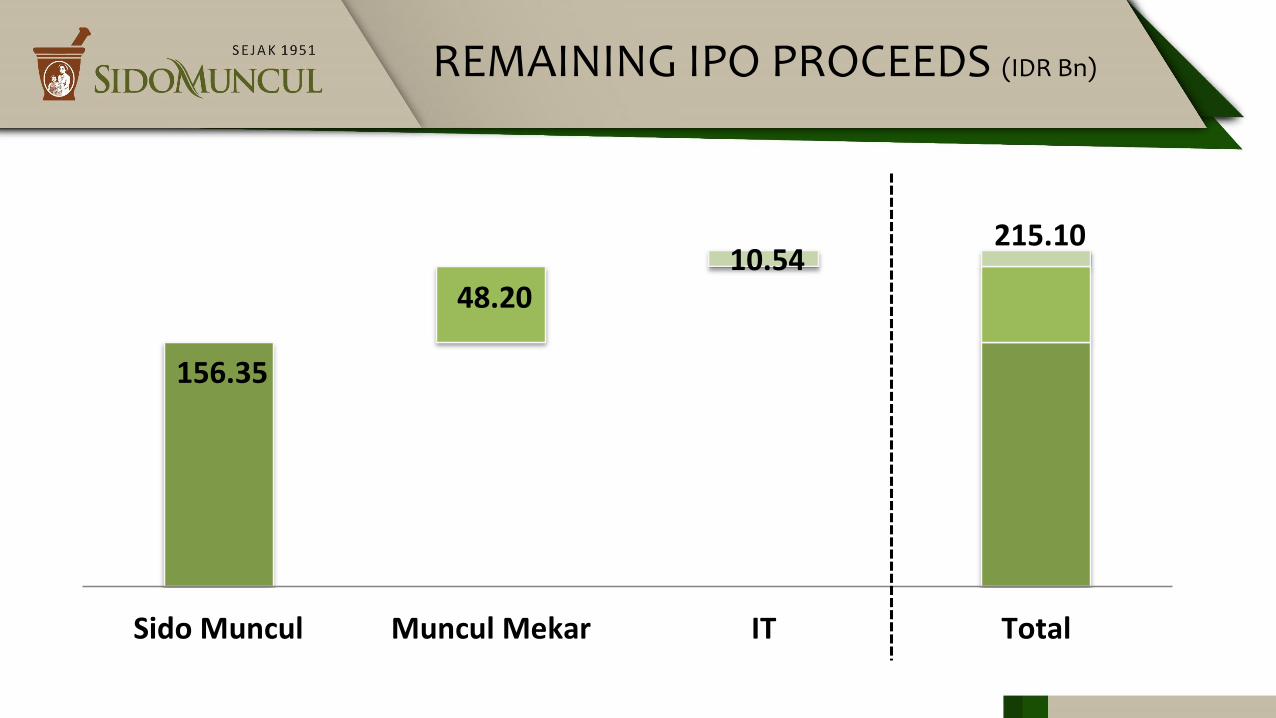
156.35
48.20 10.54
215.10
Sido Muncul Muncul Mekar IT Total
REMAINING IPO PROCEEDS (IDR Bn)
APPENDICES
Main Office:
Gedung Menara Suara Merdeka Lantai 16
Jl Pandanaran No.30
Semarang 50134, Indonesia
Phone: (+6224) 7692-8811
Fax: (+6224) 7692-8815
Factory:
Jl Soekarno Hatta km 28
Kecamatan Bergas, Klepu
Semarang 50552, Indonesia
Phone: (+62298) 523-515
Fax: (+62298) 523-509
Website : www.sidomuncul.com
Online Store : www.sidomunculstore.com
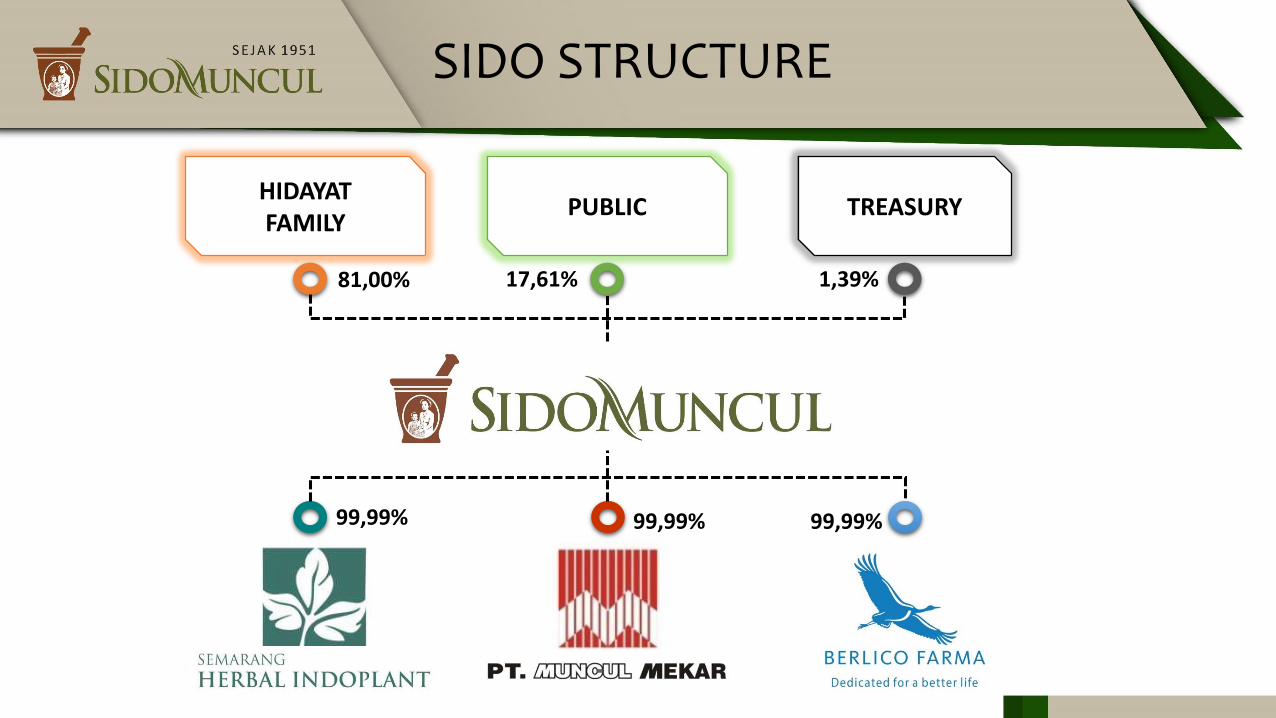
SIDO STRUCTURE
HIDAYATFAMILY
PUBLIC
81,00% 17,61%
99,99% 99,99% 99,99%
TREASURY
1,39%

BOC & BOD
Carlo Lukman WindartoIndependent Director
BOARD OF COMMISSIONERS
BOARD OF DIRECTORS
Sigit Hartojo Hadi SantosoPresident Commissioner
Johan HidayatCommissioner
Budi Setiawan PranotoIndependent Commissioner
Jonatha Sofjan HidayatPresident Director
Irwan HidayatDirector
David HidayatDirector
Venancia Sri IndrijatiDirector
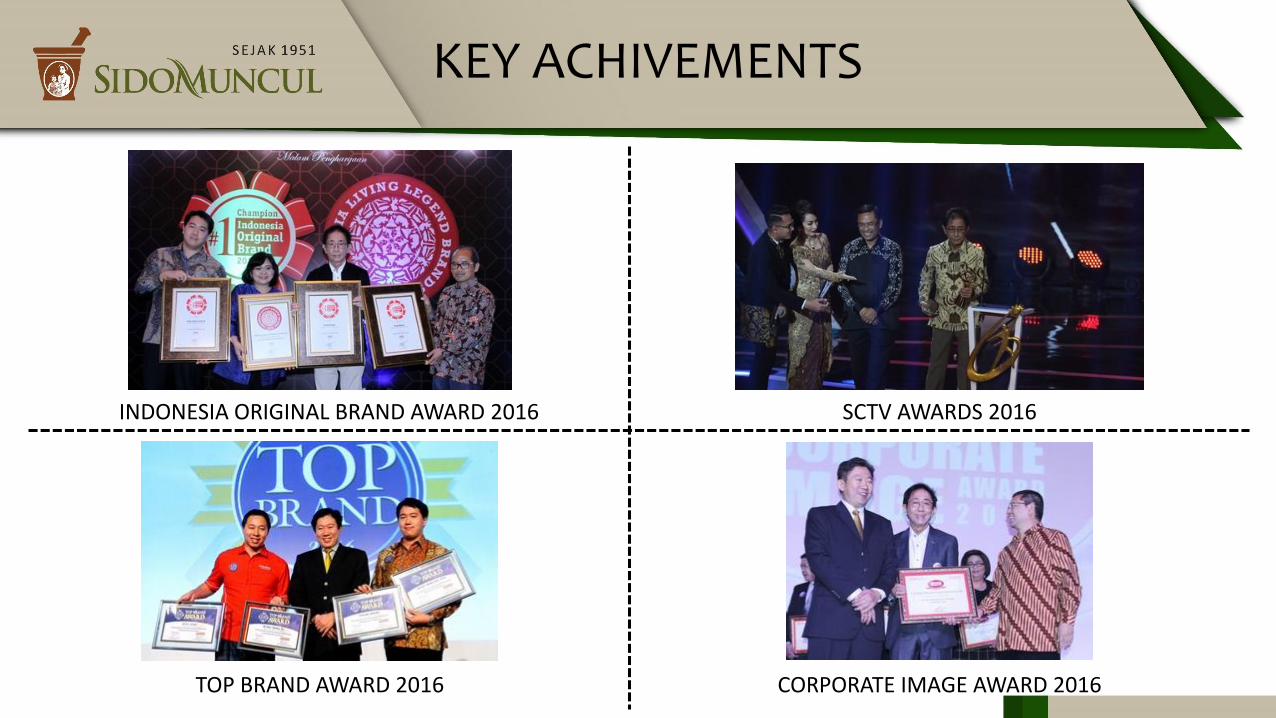
KEY ACHIVEMENTS
INDONESIA ORIGINAL BRAND AWARD 2016 SCTV AWARDS 2016
TOP BRAND AWARD 2016 CORPORATE IMAGE AWARD 2016

CONSOLIDATED STATEMENTS OF FINANCIAL POSITION
in IDR Mn 1H'16 2015
Unaudited Audited
Current Assets
Cash and Cash Equivalents 740,901 836,975 -11.5%
Time Deposits - 190,000 -100.0%
Trade Receivables 423,600 335,600 26.2%
Inventories - Net 320,497 264,982 21.0%
Others 82,443 79,882 3.2%
Total Current Assets 1,567,441 1,707,439 -8.2%
Total Non-current Assets 1,117,561 1,088,672 2.7%
TOTAL ASSETS 2,685,002 2,796,111 -4.0%
∆
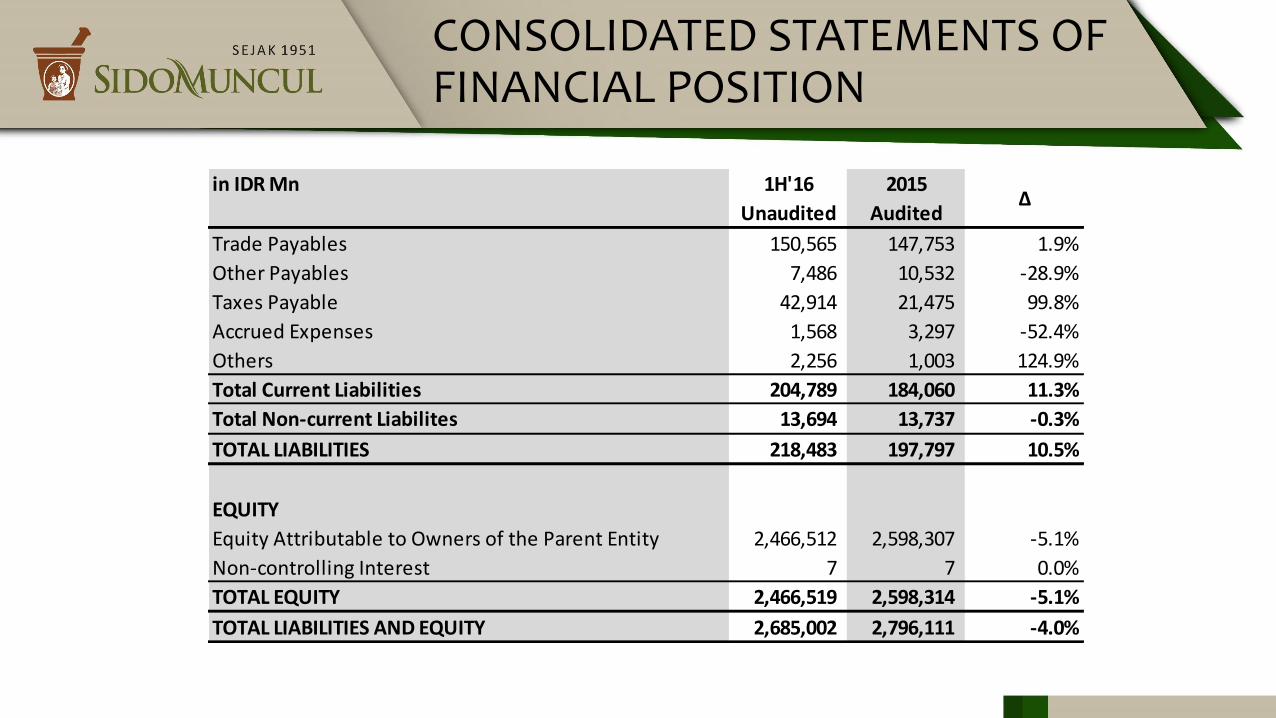
CONSOLIDATED STATEMENTS OF FINANCIAL POSITION
in IDR Mn 1H'16 2015
Unaudited Audited
Trade Payables 150,565 147,753 1.9%
Other Payables 7,486 10,532 -28.9%
Taxes Payable 42,914 21,475 99.8%
Accrued Expenses 1,568 3,297 -52.4%
Others 2,256 1,003 124.9%
Total Current Liabilities 204,789 184,060 11.3%
Total Non-current Liabilites 13,694 13,737 -0.3%
TOTAL LIABILITIES 218,483 197,797 10.5%
EQUITY
Equity Attributable to Owners of the Parent Entity 2,466,512 2,598,307 -5.1%
Non-controlling Interest 7 7 0.0%
TOTAL EQUITY 2,466,519 2,598,314 -5.1%
TOTAL LIABILITIES AND EQUITY 2,685,002 2,796,111 -4.0%
∆

CONSOLIDATED STATEMENTS OF COMPREHENSIVE INCOME
in IDR Mn 1H'16 1H'15
Unaudited Unaudited
Sales 1,297,327 1,141,112 13.7%
Cost of Good Sold 764,817 687,066 11.3%
Gross Profit 532,510 454,046 17.3%
% Margin 41.0% 39.8% 1.3%
Sales and Marketing Expenses 151,504 125,708 20.5%
General and Administrative Expenses 56,432 49,146 14.8%
Operating Income 324,574 279,192 16.3%
% Margin 25.0% 24.5% 0.6%
Other Finance Income 29,863 39,521 -24.4%
Other Finance Expenses 4,932 3,865 27.6%
Other Operating Income 2,908 5,112 -43.1%
Other Operating Expenses 623 2,797 -77.7%
Income Before Tax 351,790 317,163 10.9%
% Margin 27.1% 27.8% -0.7%
Income Tax Expenses 86,641 71,044 22.0%
Net Income for the Year 265,149 246,119 7.7%
% Margin 20.4% 21.6% -1.1%
Other Comprehensive Income (Loss) 0.0%
Total Comprehensive Income for the Year 265,149 246,119 7.7%
% Margin 20.4% 21.6% -1.1%
∆
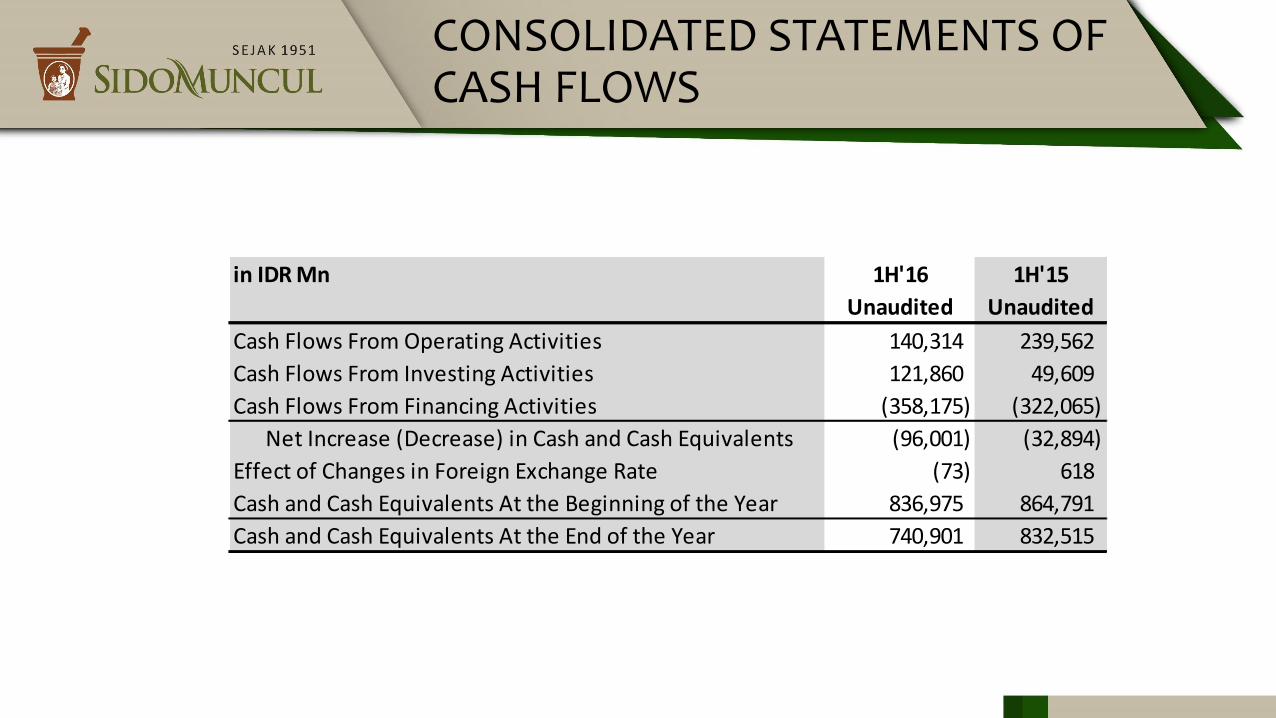
CONSOLIDATED STATEMENTS OF CASH FLOWS
in IDR Mn 1H'16 1H'15
Unaudited Unaudited
Cash Flows From Operating Activities 140,314 239,562
Cash Flows From Investing Activities 121,860 49,609
Cash Flows From Financing Activities (358,175) (322,065)
Net Increase (Decrease) in Cash and Cash Equivalents (96,001) (32,894)
Effect of Changes in Foreign Exchange Rate (73) 618
Cash and Cash Equivalents At the Beginning of the Year 836,975 864,791
Cash and Cash Equivalents At the End of the Year 740,901 832,515


