Update on Child Outcomes for Early Childhood Special Education Lynne Kahn ECO at UNC The Early Childhood Outcomes (ECO) Center The National Association of State Directors of Special Education (NASDSE) June 2011 Kathy Hebbeler ECO at SRI International
Transcript
Update on Child Outcomes for Early
Childhood Special Education
Lynne KahnECO at UNC
The Early Childhood Outcomes (ECO) CenterThe National Association of State Directors
of Special Education (NASDSE)June 2011
Kathy HebbelerECO at SRI International
What we will cover
• Quick review of the reporting requirement and state approaches
• Share the national data• Describe how the national data were
computed• Discuss the quality of the national data• Discuss the meaning of the numbers
2Early Childhood Outcomes Center
3Early Childhood Outcomes Center
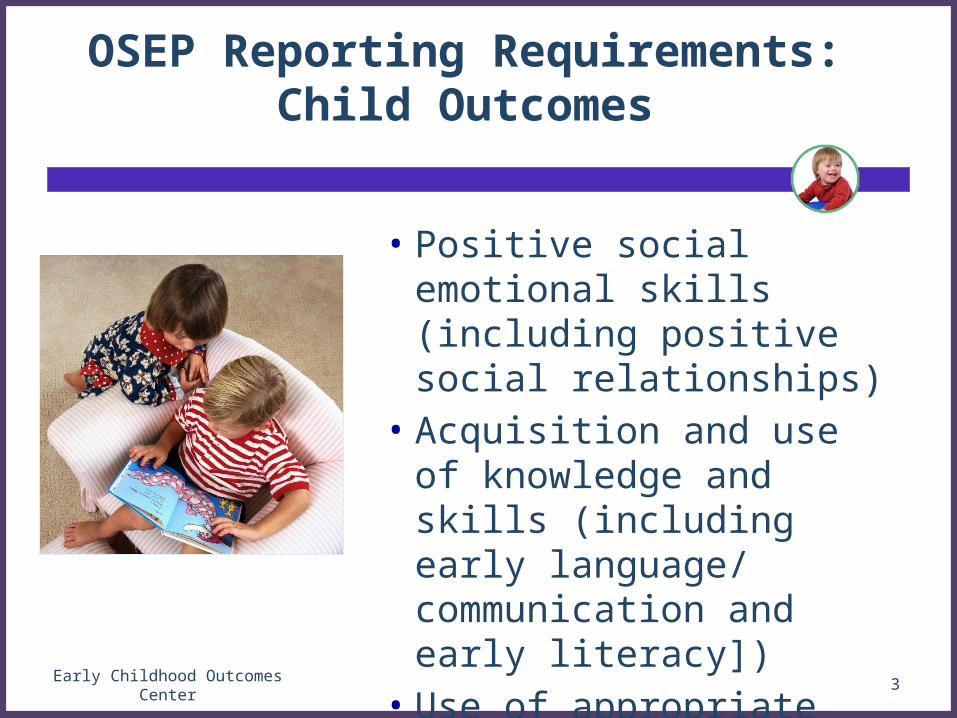
OSEP Reporting Requirements: Child Outcomes
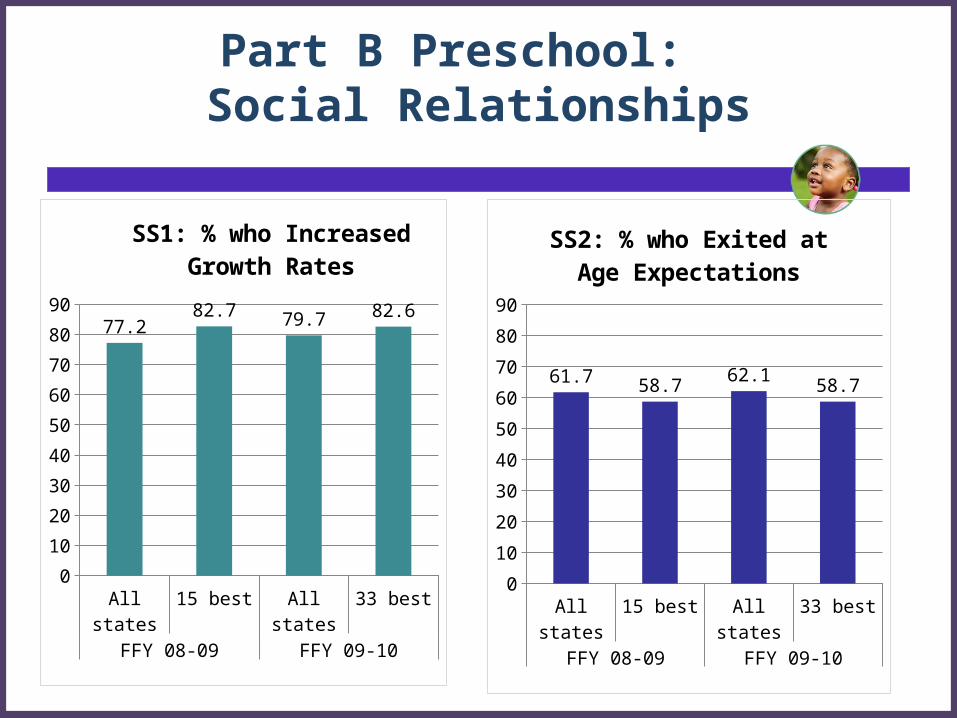
• Positive social emotional skills (including positive social relationships)
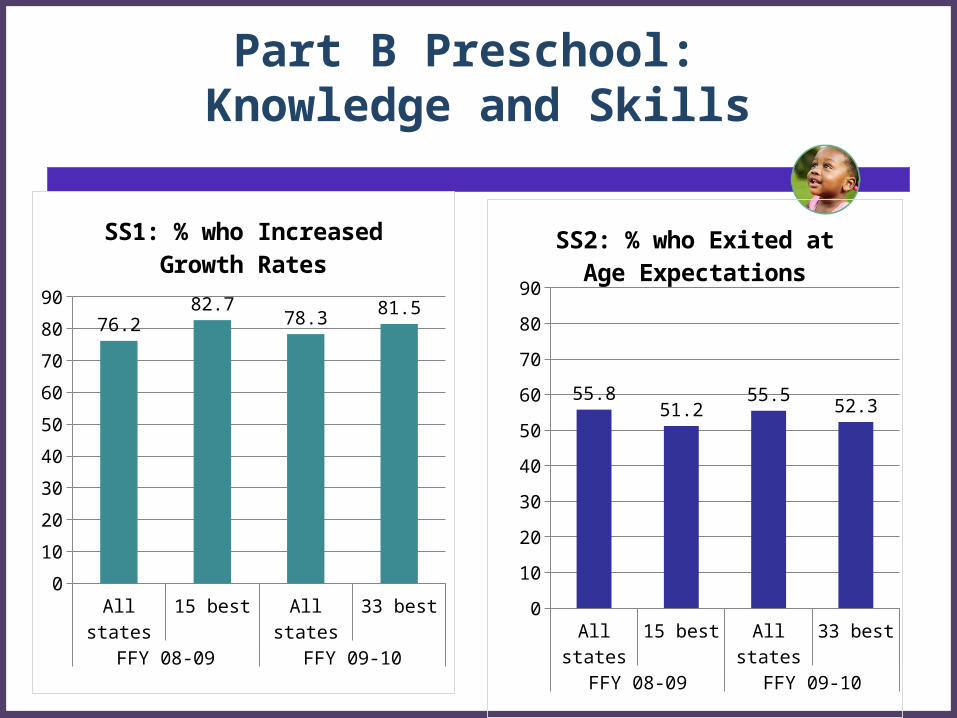
• Acquisition and use of knowledge and skills (including early language/ communication and early literacy])
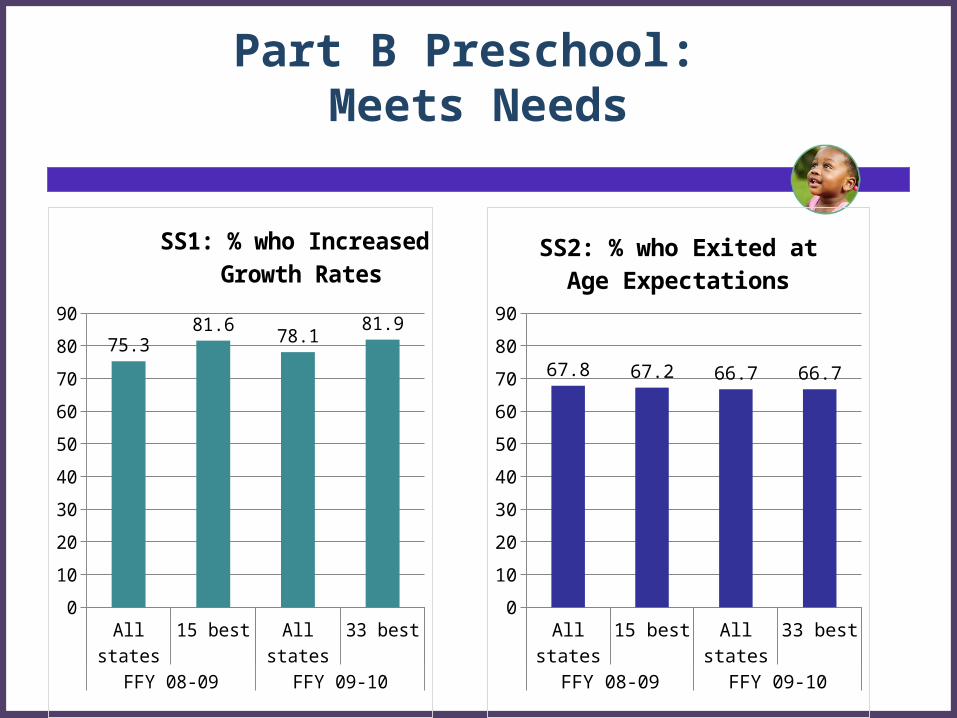
• Use of appropriate behaviors to meet their needs
4Early Childhood Outcomes Center
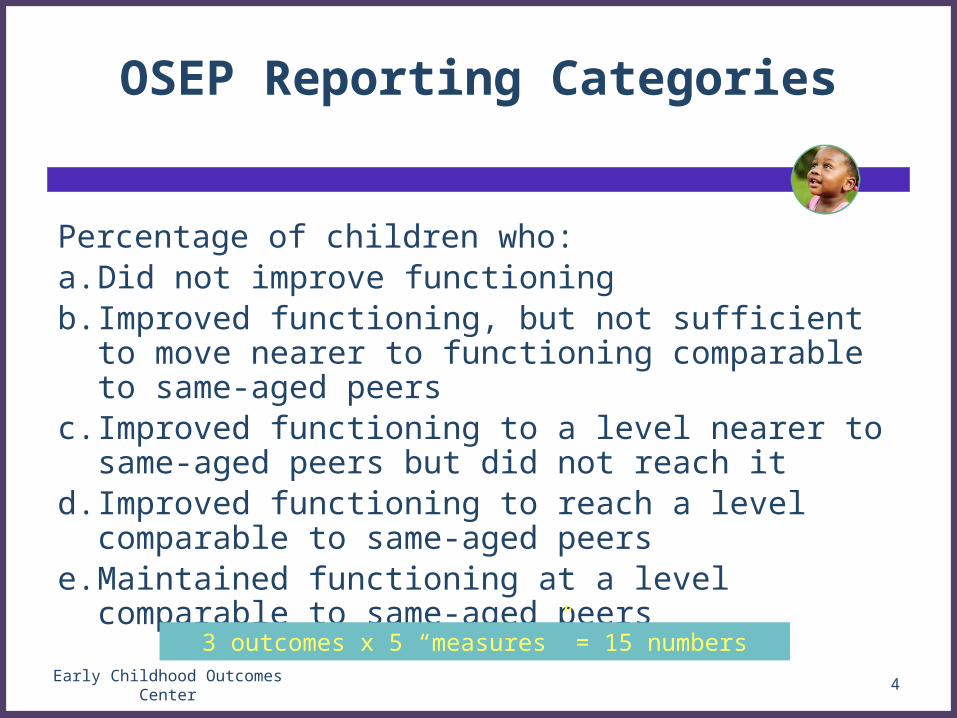
OSEP Reporting Categories
Percentage of children who: a. Did not improve functioningb. Improved functioning, but not sufficient to move nearer
to functioning comparable to same-aged peers c. Improved functioning to a level nearer to same-aged
peers but did not reach itd. Improved functioning to reach a level comparable to
same-aged peerse. Maintained functioning at a level comparable to same-
aged peers
3 outcomes x 5 “measures” = 15 numbers
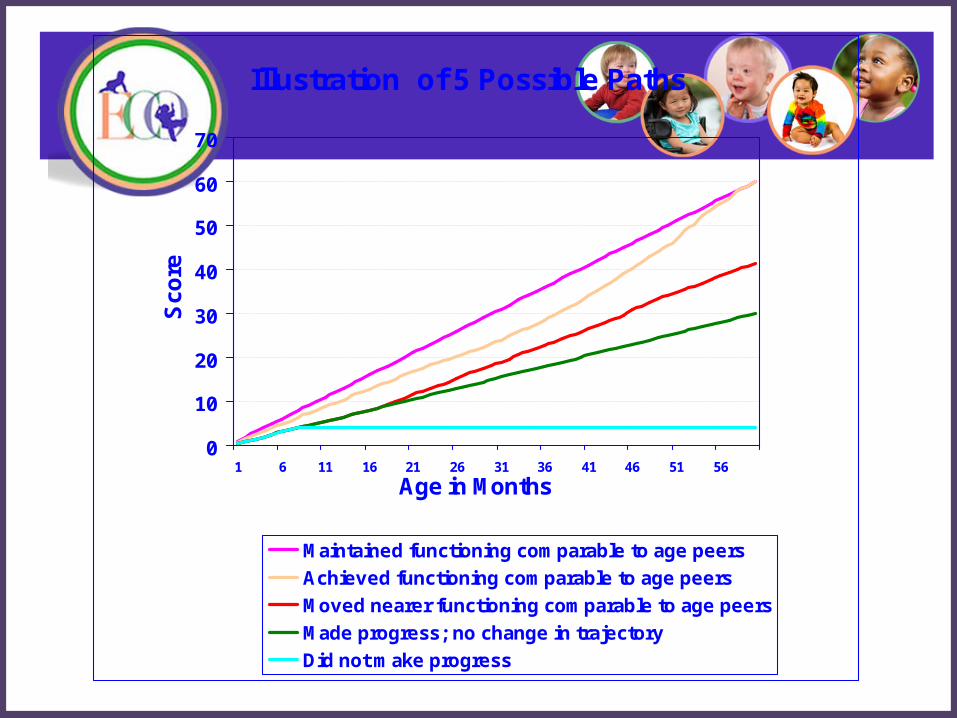
Illustration of 5 Possible Paths
0
10
20
30
40
50
60
70
1 6 11 16 21 26 31 36 41 46 51 56
Age in Months
Sco
re
Maintained functioning comparable to age peers
Achieved functioning comparable to age peers
Moved nearer functioning comparable to age peers
Made progress; no change in trajectory
Did not make progress
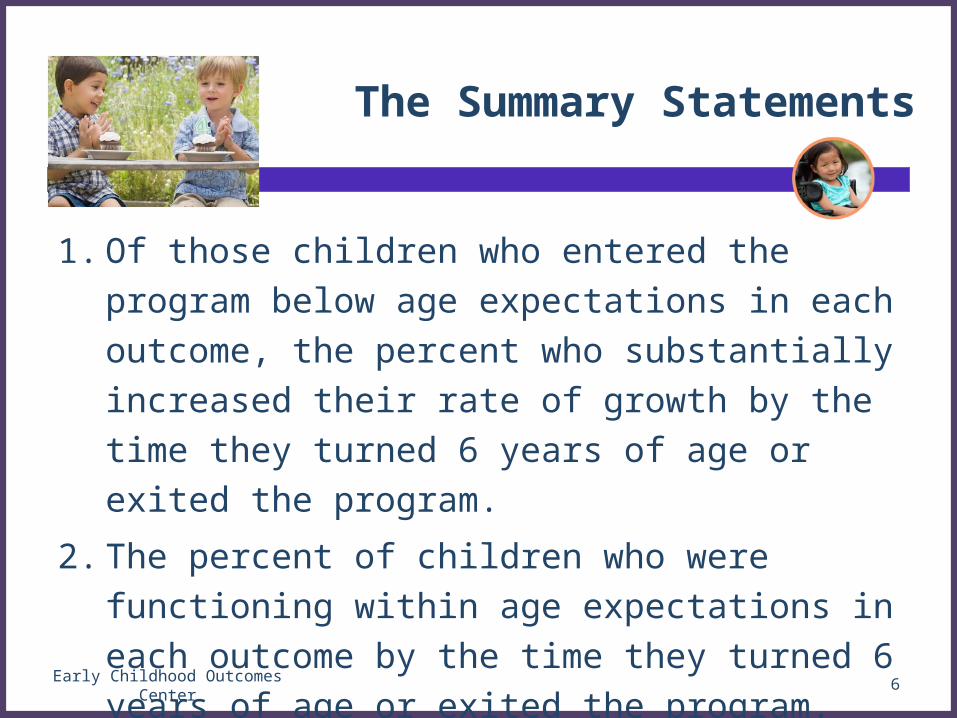
The Summary Statements
1. Of those children who entered the program below
age expectations in each outcome, the percent who
substantially increased their rate of growth by the
time they turned 6 years of age or exited the
program.
2. The percent of children who were functioning within
age expectations in each outcome by the time they
turned 6 years of age or exited the program.
6Early Childhood Outcomes Center
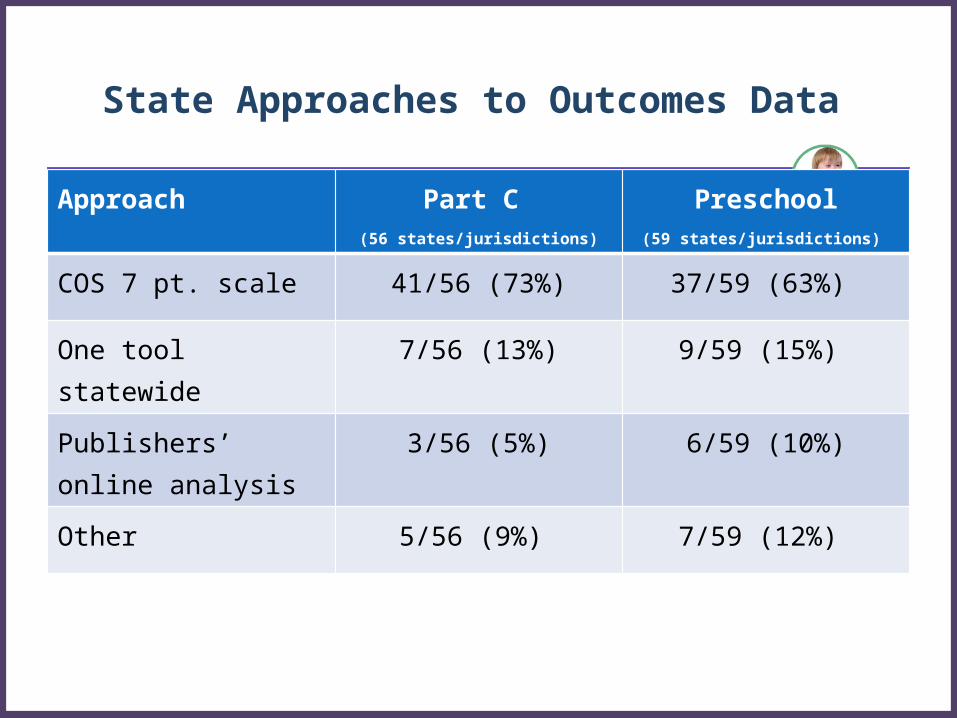
State Approaches to Outcomes Data
Approach Part C (56 states/jurisdictions)
Preschool(59 states/jurisdictions)
COS 7 pt. scale 41/56 (73%) 37/59 (63%)
One tool statewide 7/56 (13%) 9/59 (15%)
Publishers’ online analysis
3/56 (5%) 6/59 (10%)
Other 5/56 (9%) 7/59 (12%)
Early Childhood Outcomes Center 8
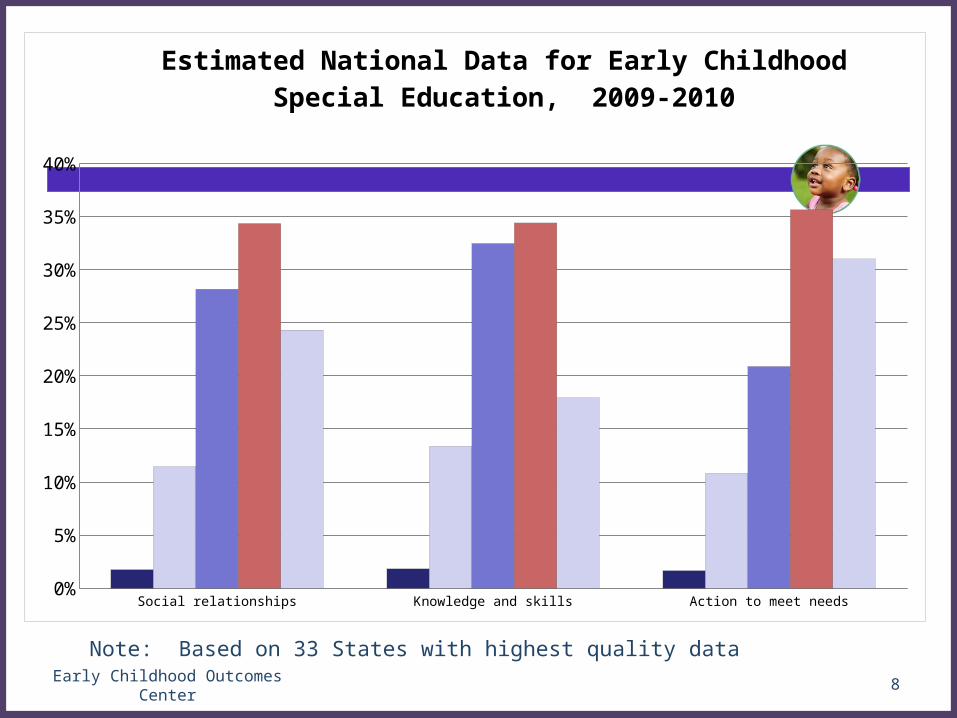
Social relationships Knowledge and skills Action to meet needs
a 0.0173423475321513 0.0182367034048671 0.0164717096861928
b 0.114520004403404 0.133727833654954 0.108153036923834
c 0.281561785450637 0.32470410889358 0.208844242808853
d 0.343437919521324 0.34397760817479 0.356458315050575
e 0.243152978902516 0.179335862613809 0.310081127789362
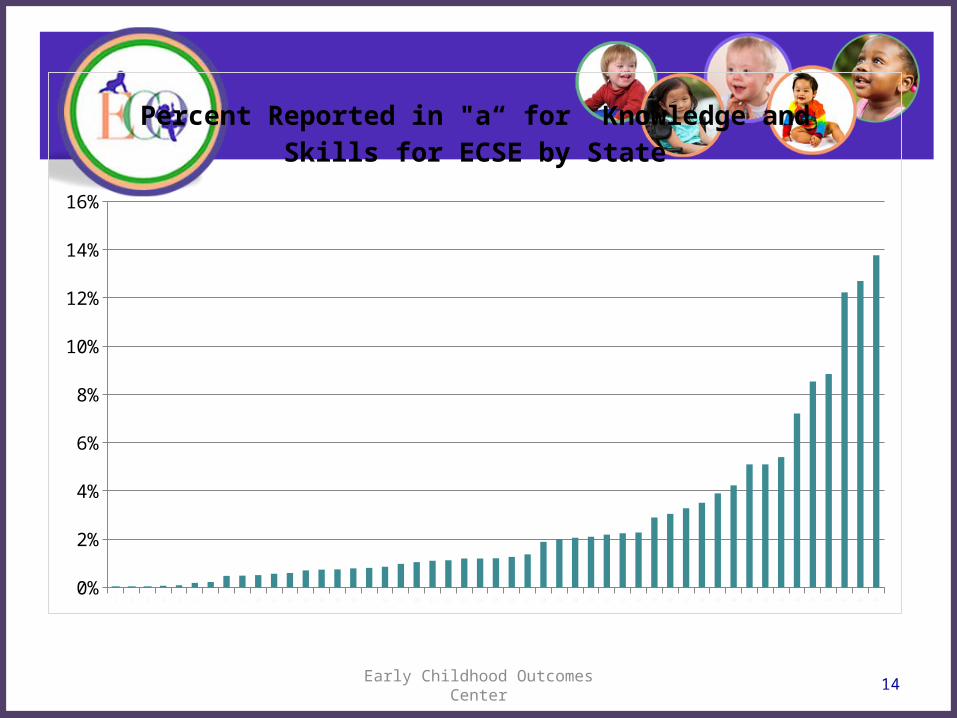
3%
8%
13%
18%
23%
28%
33%
38%
Estimated National Data for Early Childhood Special Education, 2009-2010
Note: Based on 33 States with highest quality data
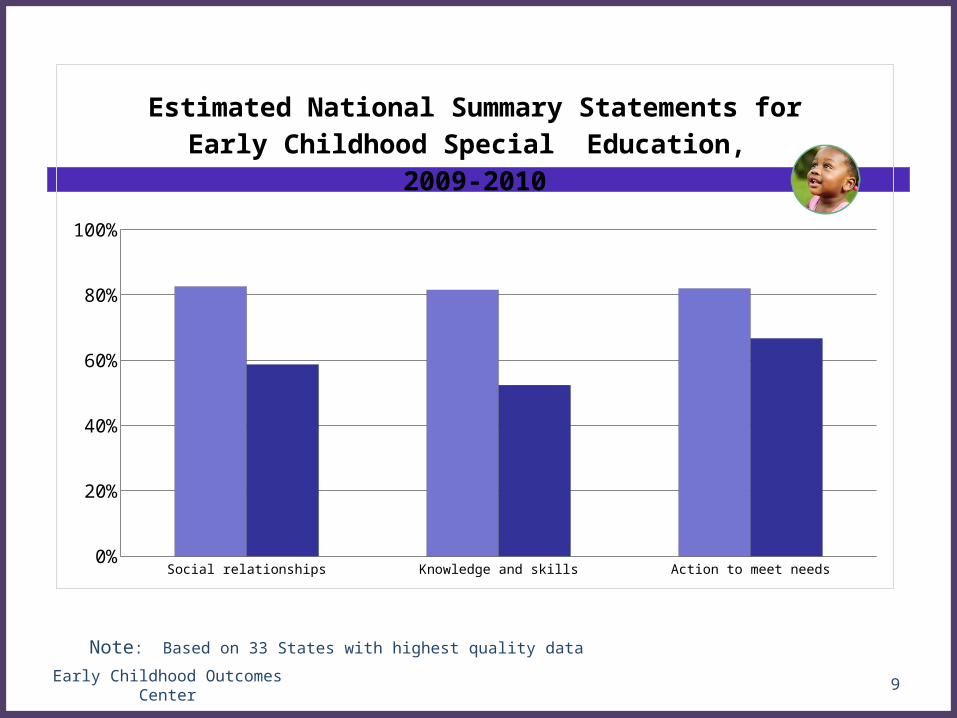
Early Childhood Outcomes Center 9
Note: Based on 33 States with highest quality data
Social relationships Knowledge and skills Action to meet needs
Estimated National Summary Statements for Early Childhood Special Education, 2009-2010
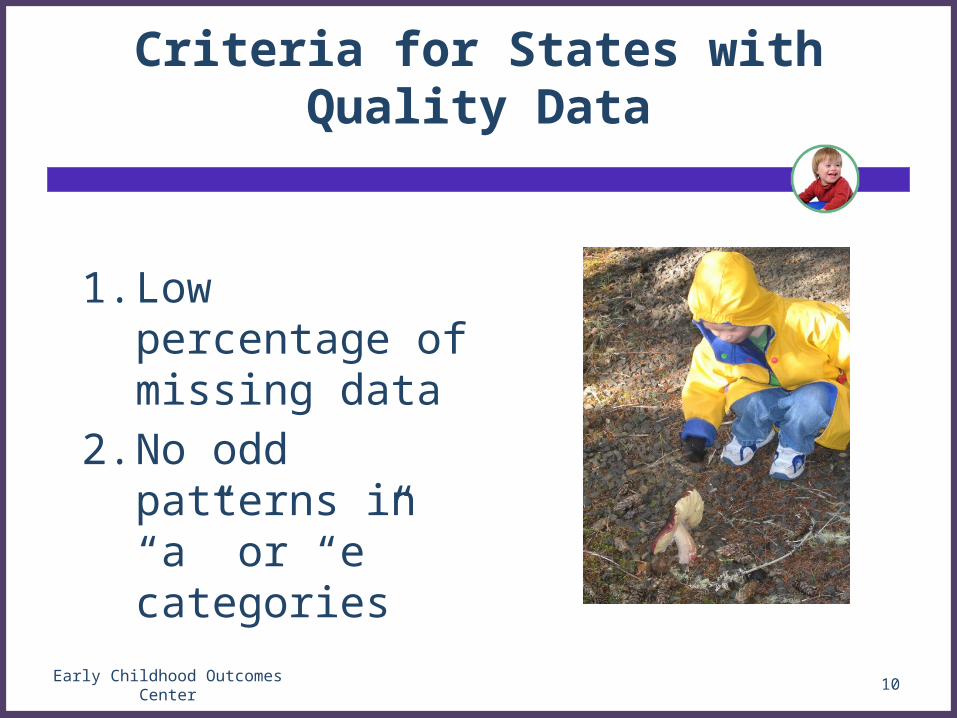
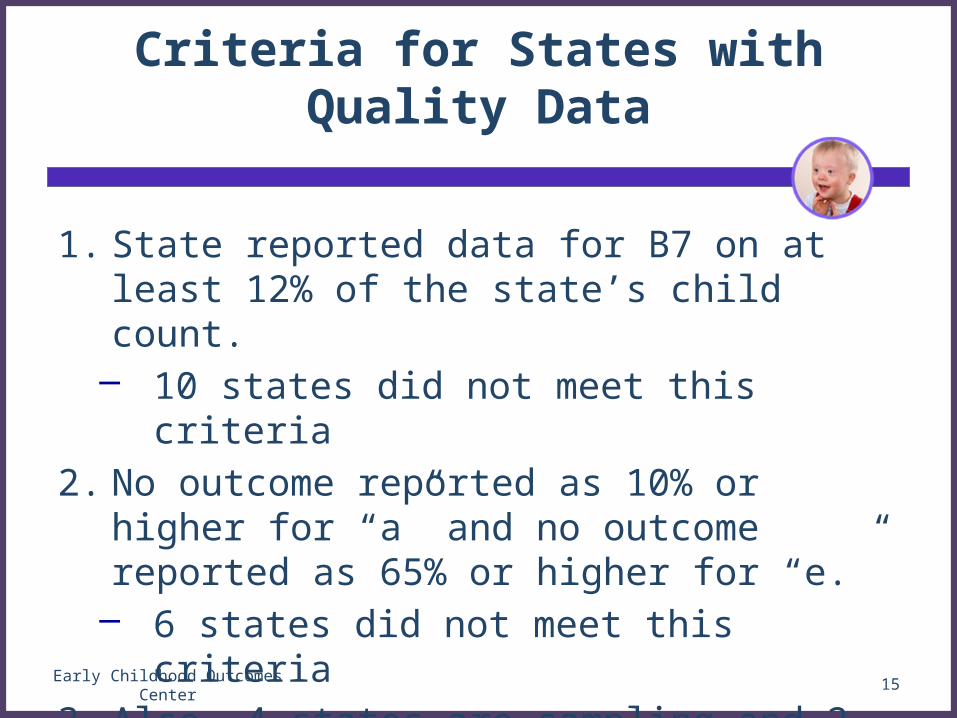
Criteria for States with Quality Data
1. Low percentage of missing data
2. No odd patterns in “a” or “e” categories
10Early Childhood Outcomes Center
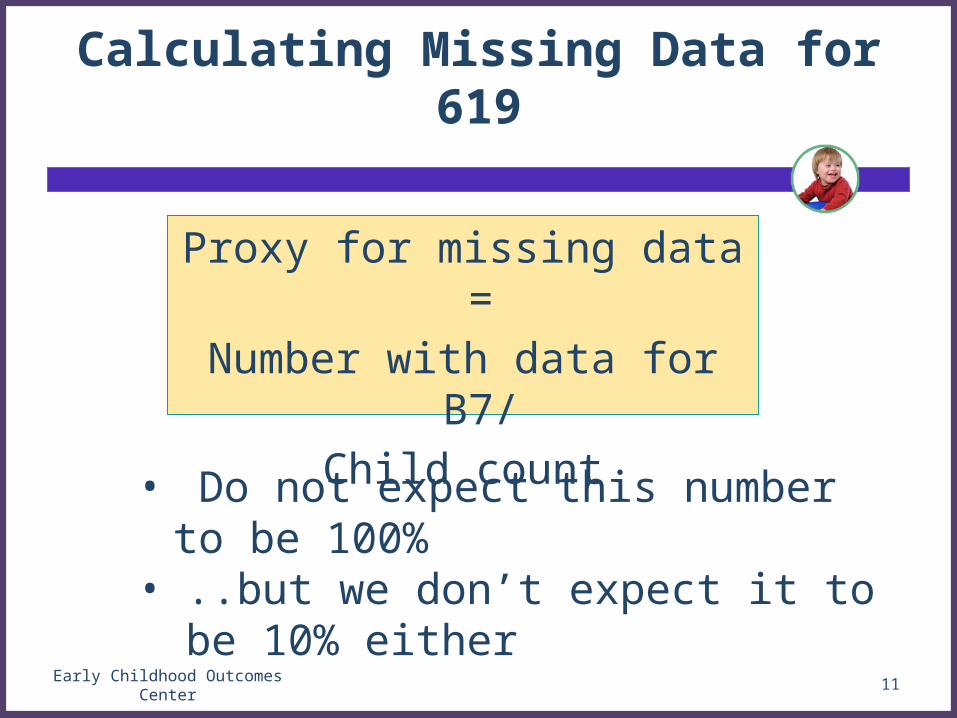
Calculating Missing Data for 619
Proxy for missing data =
Number with data for B7/
Child count
11Early Childhood Outcomes Center
• Do not expect this number to be 100%
• ..but we don’t expect it to be 10% either
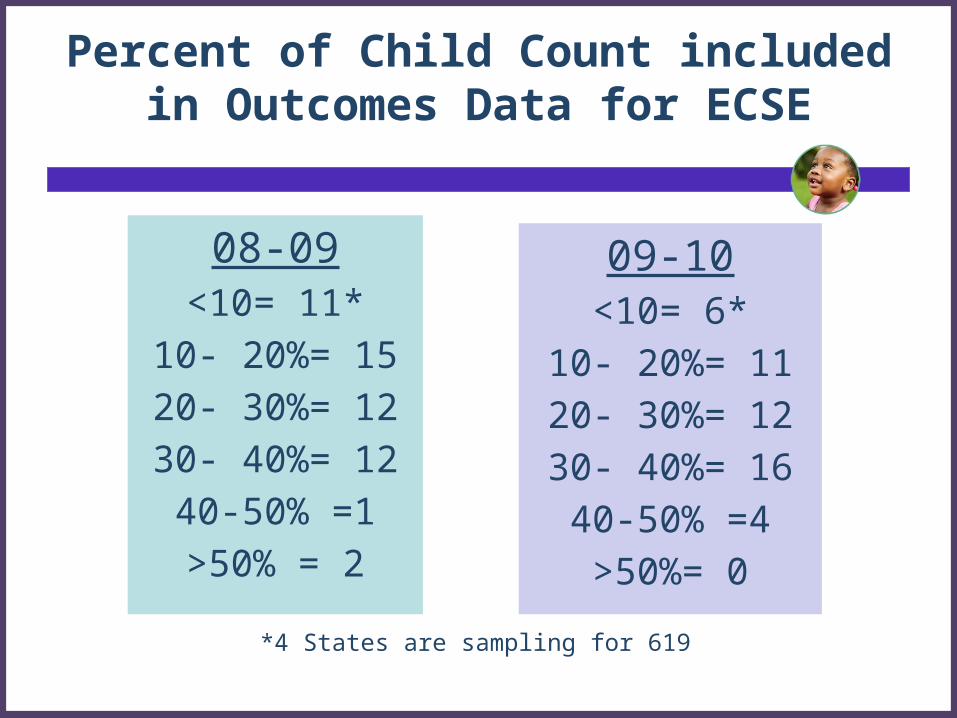
Percent of Child Count included in Outcomes Data for ECSE
08-09<10= 11*
10- 20%= 15
20- 30%= 12
30- 40%= 12
40-50% =1
>50% = 2
09-10<10= 6*
10- 20%= 11
20- 30%= 12
30- 40%= 16
40-50% =4
>50%= 0
*4 States are sampling for 619
Problem with Missing Data
• We don’t know how well the data the state has represent the entire state.
• If the data are representative, the percentages for the a to e Progress Categories and the Summary Statements won’t change as data are added on more children.