47
UPDATED REGIONAL POWER STATUS IN AFRICA POWER POOLS REPORT

1
UPDATED REGIONAL POWER STATUS IN AFRICA POWER POOLSREPORT
2
UPDATED REGIONAL POWER STATUS IN AFRICA POWER POOLSREPORT
Infrastructure Consortium for Africa (ICA)November 2016
The Infrastructure Consortium for Africa Secretariatc/o African Development Bank CCIA BuildingP.O. Box 1387Abidjan, Ivory Coast www.icafrica.org
Disclaimer
The ICA Secretariat produced this report in collaboration with a consultant. While care has been taken to ensure the accuracy of the information provided in this report, the authors
make no represtation, warranty or conevant with respect to its accuracy or validity.
No responsibility or liability will be accepted by the ICA Secretariat, its members, employees, associates and/or consultants for reliance placed upon information contained in this
document by any third party.

3
This report was prepared by Mr. Kamu Karekaho, consultant for the ICA. Mr. Mohammed Hassan, ICA Coordinator, provided valuable strategic guidance. Mr. Callixte Kambanda, Chief Infrastructure Specialist at the ICA Secretariat, ensured the overall coordination for the production of this report and Ms. Essui Viviane Kouadjo provided highly needed logistical support. All due appreciation is extended to the following staff members in the various Power Pools and to the African Energy Commission (AFREC) for their invaluable support during the preparation of this Report:
1. West African Power Pool (WAPP) Secretariat y Siengui A. Si. y Adeyemo Babatunde. y Momodou A.K. Njie. y Jeremiah Oyewole.
2. Eastern Africa Power Pool (EAPP) Secretariat y Lebbi Changullah. y Zelalem Gebrehiwott. y Joseph Magochi.
3. Southern African Power Pool (SAPP) Coordination Centre y Allison Chikova. y Sydney Zimba. y Edeline Mujongondi.
4. African Energy Commission (AFREC) y Atef Marzouk. y Abdoulaye Oueddo.
ForewordAcknowledgements

4
TABLE OF CONTENTS
Acknowledgements ................................................................................................................................................... 3List of Tables ............................................................................................................................................................... 6List of Figures ............................................................................................................................................................. 7Acronyms .................................................................................................................................................................... 8Executive Summary ................................................................................................................................................... 9 1. Introduction to the Report ................................................................................................................................. 112. Eastern Africa Power Pool (EAPP) ...................................................................................................................... 12 2.1 Introduction .........................................................................................................................................................12 2.2 Vision ....................................................................................................................................................................12 2.3 Objectives .............................................................................................................................................................12 2.4 Membership .........................................................................................................................................................13 2.5 Governance ..........................................................................................................................................................13 2.6 Socio-economic background ..............................................................................................................................13 2.7 Overview of the energy sector ..........................................................................................................................14 2.7.1 Installed generation capacity .........................................................................................................................14 2.7.2 Production ........................................................................................................................................................14 2.7.3 Consumption ...................................................................................................................................................14 2.7.4 Consumption per capita .................................................................................................................................14 2.7.5 Imports and exports .......................................................................................................................................15 2.7.6 Electrification rates ..........................................................................................................................................15 2.7.7 Development projects ....................................................................................................................................15 2.7.8 Challenges ........................................................................................................................................................16 2.7.9 Trends ...............................................................................................................................................................163. West African Power Pool (WAPP) ....................................................................................................................... 17 3.1 Introduction .........................................................................................................................................................17 3.2 Vision ....................................................................................................................................................................17 3.3 Objectives .............................................................................................................................................................17 3.4 Membership .........................................................................................................................................................18 3.5 Governance structure .........................................................................................................................................18 3.6 Socio-economic background ..............................................................................................................................18 3.7 Overview of the energy sector ..........................................................................................................................19 3.7.1 Installed capacity .............................................................................................................................................19 3.7.2 Production ........................................................................................................................................................19 3.7.3 Consumption ...................................................................................................................................................19 3.7.4 Consumption per capita .................................................................................................................................19 3.7.5 Imports and exports .......................................................................................................................................20 3.7.6 Electrification rates ..........................................................................................................................................20 3.7.7 Development projects ....................................................................................................................................20 3.7.8 Challenges ahead ............................................................................................................................................21 3.7.9 Trends ...............................................................................................................................................................214. Southern African Power Pool (SAPP) ................................................................................................................. 22 4.1 Introduction .........................................................................................................................................................22 4.2 Vision ....................................................................................................................................................................22 4.3 Objectives .............................................................................................................................................................22 4.4 Membership .........................................................................................................................................................23 4.5 Governance ..........................................................................................................................................................23 4.6 Socio-economic background ..............................................................................................................................23 4.7 Overview of the energy sector ..........................................................................................................................24 4.7.1 Installed capacity ..............................................................................................................................................24 4.7.2 Production ........................................................................................................................................................24 4.7.3 Consumption ...................................................................................................................................................24 4.7.4 Consumption per Capita ................................................................................................................................24 4.7.5 Imports and Exports .......................................................................................................................................25 4.7.6 Electrification rates ..........................................................................................................................................25 4.7.7 Development projects ....................................................................................................................................25 4.7.8 Challenges ........................................................................................................................................................25 4.7.9 Trend forward ..................................................................................................................................................255. Central African Power Pool (CAPP) / Pool Energé que de l’Afrique Centrale (PEAC) ................................... 27 5.1 Introduction .........................................................................................................................................................27 5.2 Mission .................................................................................................................................................................27 5.3 Objectives .............................................................................................................................................................27 5.4 Membership .........................................................................................................................................................27

5
5.5 Governance ..........................................................................................................................................................27 5.6 Socio-economic background ..............................................................................................................................28 5.7 Overview of the energy sector ..........................................................................................................................28 5.7.1 Installed capacity .............................................................................................................................................28 5.7.2 Production ........................................................................................................................................................28 5.7.3 Power consumption (GWh) ............................................................................................................................28 5.7.4 Consumption per capita .................................................................................................................................29 5.7.5 Imports and exports .......................................................................................................................................29 5.7.6 Electrification access .......................................................................................................................................30 5.7.7 Priority projects ...............................................................................................................................................30 5.7.8 Challenges ........................................................................................................................................................30 5.7.9 Trends ...............................................................................................................................................................306. COMITÉ MAGHRÉBIN DE L’ELECTRICITÉ (COMELEC) ........................................................................................ 31 6.1 Introduction .........................................................................................................................................................31 6.2 Vision ....................................................................................................................................................................31 6.3 Objectives .............................................................................................................................................................31 6.4 Membership .........................................................................................................................................................31 6.5 Governance ..........................................................................................................................................................31 6.6 Socio-economic background ..............................................................................................................................32 6.7 Overview of the energy sector ..........................................................................................................................32 6.7.1 Installed capacity .............................................................................................................................................32 6.7.2 Production ........................................................................................................................................................33 6.7.3 Power consumption ........................................................................................................................................33 6.7.4 Consumption per capita .................................................................................................................................33 6.7.5 Imports and exports .......................................................................................................................................33 6.7.6 Electrification rates ..........................................................................................................................................34 6.7.7 Development projects ....................................................................................................................................34 6.7.8 Challenges ........................................................................................................................................................34 6.7.9 Trends ...............................................................................................................................................................347. Analysis of Power Pools data ............................................................................................................................. 35 7.1 Introduction .........................................................................................................................................................35 7.2 Power market development status and trends ..............................................................................................35 7.2.1 EAPP ..................................................................................................................................................................36 7.2.2 WAPP .................................................................................................................................................................36 7.2.3 SAPP ..................................................................................................................................................................36 7.2.4 CAPP ..................................................................................................................................................................36 7.2.5 COMELEC ..........................................................................................................................................................36 7.3 Factors for power sector growth .......................................................................................................................36 7.3.1 Economic growth: ............................................................................................................................................37 7.3.2 Demographics ..................................................................................................................................................37 7.3.3 Urbanisation ....................................................................................................................................................37 7.3.4 Technology .......................................................................................................................................................38 7.3.5 China .................................................................................................................................................................38 7.3.6 International frameworks...............................................................................................................................38 7.3.7 Private sector growth ......................................................................................................................................39 7.3.8 Political will .......................................................................................................................................................39 7.3.9 Increased public awareness ...........................................................................................................................40 7.3.10 Regional cooperation ....................................................................................................................................40 7.4 Way forward .........................................................................................................................................................40 7.4.1 Challenges ahead ............................................................................................................................................40 7.4.2 Recommendations ..........................................................................................................................................418. Appendices ........................................................................................................................................................... 42 8.1 Appendix 1: Priority projects in EAPP ...............................................................................................................42 8.2 Appendix 2: Priority projects in WAPP ..............................................................................................................42 8.3 Appendix 3: Priority projects in SAPP ...............................................................................................................43 8.4 Appendix 4: Priority projects in CAPP ...............................................................................................................43 8.5 Appendix 5: Priority projects in COMELEC .......................................................................................................449. References ............................................................................................................................................................ 45

6
LIST OF TABLES
TABLE 1: SOCIO-ECONOMIC DATA OF EAPP MEMBER COUNTRIES ...............................................................................13TABLE 2: INSTALLED CAPACITY ...........................................................................................................................................14TABLE 3: GENERATION .........................................................................................................................................................14TABLE 4: CONSUMPTION IN EAPP COUNTRIES .................................................................................................................14TABLE 5: CONSUMPTION PER CAPITA IN 2013 .................................................................................................................15TABLE 6: IMPORTS AND EXPORTS .......................................................................................................................................15TABLE 7: ELECTRIFICATION RATES ......................................................................................................................................15TABLE 8: SOCIO-ECONOMIC DATA OF WAPP MEMBER COUNTRIES ..............................................................................18TABLE 9: INSTALLED CAPACITY ...........................................................................................................................................19TABLE 10: GENERATION IN WAPP .......................................................................................................................................19TABLE 11: CONSUMPTION (GWh) .......................................................................................................................................19TABLE 12: CONSUMPTION PER CAPITA (kWh) ...................................................................................................................20TABLE 13: IMPORTS AND EXPORTS ....................................................................................................................................20TABLE 14: AGGREGATED ELECTRIFICATION RATES ...........................................................................................................20TABLE 15: ELECTRIFICATION (%) RATES IN 2015 ...............................................................................................................21TABLE 16: SOCIO – ECONOMIC DATA OF SAPP MEMBER COUNTRIES ...........................................................................23TABLE 17: INSTALLED CAPACITY .........................................................................................................................................24TABLE 18: GE NERATION ......................................................................................................................................................24TABLE 19: CONSUMPTION ...................................................................................................................................................24TABLE 20: CONSUMPTION PER CAPITA ..............................................................................................................................25TABLE 21: IMPORTS AND EXPORTS ....................................................................................................................................25TABLE 22: ELECTRIFICATION RATES ....................................................................................................................................25TABLE 23: SOCIO-ECONOMIC DATA OF CAPP MEMBER COUNTRIES .............................................................................28TABLE 24: INSTALLED CAPACITY .........................................................................................................................................28TABLE 25: GENERATION IN CAPP ........................................................................................................................................29TABLE 26: CONSUMPTION ...................................................................................................................................................29TABLE 27: CONSUMPTION PER CAPITA (kWh) ...................................................................................................................29TABLE 28: NET IMPORTAND EXPORT (GWh) ......................................................................................................................29TABLE 29: ELECTRIFICATION RATES IN CAPP .....................................................................................................................30TABLE 30: SOCIO-ECONOMIC DATA OF COMELEC MEMBER COUNTRIES .....................................................................33TABLE 31: INSTALLED CAPACITY (MW) ...............................................................................................................................33TABLE 32: GENERATION (GWh) ...........................................................................................................................................33TABLE 33: CONSUMPTION IN COMELEC(GWh) .................................................................................................................33TABLE 34: CONSUMPTION PER CAPITA (kWh) ...................................................................................................................33TABLE 35: IMPORTS AND EXPORTS (GWh) .........................................................................................................................33TABLE 36: ELECTRIFICATION RATES (%) .............................................................................................................................34TABLE 37: NATIONAL ELECTRIFICATION RATES ................................................................................................................34TABLE 38: PROPOSED POWER TRADE ROAD MAP ............................................................................................................36

7
LIST OF FIGURES
FIGURE 1: ORGANISATION CHART EAPP ......................................................................................................................... 13FIGURE 2: WAPP ORGANISATION STRUCTURE ............................................................................................................... 18FIGURE 3: SAPP MANAGEMENT STRUCTURE .................................................................................................................. 23FIGURE 4: CAPP MANAGEMENT STRUCTURE ................................................................................................................. 28FIGURE 5: ORGANISATION STRUCTURE FOR COMELEC ................................................................................................ 32FIGURE 7: ELECTRICITY PRODUCTION AND CONSUMPTION ....................................................................................... 36FIGURE 8: AFRICA’S ECONOMIC GROWTH ...................................................................................................................... 37FIGURE 9: PROJECTED POPULATION GROWTH IN AFRICA ............................................................................................ 37FIGURE 10: URBANISATION GROWTH IN AFRICA ........................................................................................................... 37FIGURE 11: SMART PHONE GROWTH IN SELECTED AFRICAN COUNTRIES ................................................................. 38FIGURE 12: EXTERNAL INFRASTRUCTURE INVESTMENT COMMITMENTS 1990 - 2012.............................................. 39FIGURE 13: TOP 10 PPI RECIPIENTS IN SUB-SAHARAN AFRICA .................................................................................... 39

8
ACP African, Caribbean and PacificAFREC African Energy CommissionBn Billion (1,000,000,000)CAPP/PEAC Central African Power Pool/ Pool Energé que de l’Afrique Centrale CAR Central Africa RepublicCEO Chief Executive OfficerCOMELEC Comité Maghrébin de L’Electricité (Maghreb Electricity Committee)COMESA Common Market for Eastern and Southern AfricaCPE Commission for Planning and StudiesDAM Day Ahead MarketDRC Democratic Republic of CongoEAC East African CommunityEAPP Eastern Africa Power PoolECCAS Central African StatesECOWAS Economic Community for West African StatesEDF European Development FundEU European UnionGDP Gross Domestic ProductGEIDCO Global Energy Interconnection Development and CooperationGW Giga-watt (1,000 mega-watts)GWh Giga-watt-hours (1,000 MWh)ICA Infrastructure Consortium for AfricaIEA International Energy AgencyIGMOU Inter-Governmental Memorandum of UnderstandingIRENA International Renewable Energy AgencyKm Kilometre (1,000 metres)kW Kilo-watt (1,000 watts)kWh Kilo-watt hour (1,000 Watt-hour)MDG Millennium Development GoalsMOU Memorandum of UnderstandingMW Mega-watt (1,000 kilo-watts)OECD Organization for Economic Co-operation and DevelopmentOMVG Gambia River Basin Development OrganisationOMVS Senegal River Basin Development OrganisationONE Office National de l’Electricité of Morocco PIDA Programme for Infrastructure Development in AfricaPPI Private Participation in InfrastructurePRB Population Reference BureauREC Regional Economic CommunityRSMO Regional System Market OperatorSADC Southern African Development CommunitySAPP Southern Africa Power Pool SE4ALL Sustainable Energy for AllSONELGAZ Société Nationale de l’Electricité et du Gaz of AlgeriaSSA Sub Saharan AfricaSTEG Société Tunisienne de l’Electricité et du Gaz of Tunisia T&D Transmission and DistributionTICAD Tokyo International Conference on African DevelopmentTWh Terra-watt-hour (1,000,000 GWh)UMA Union of Maghreb areaUN United NationsUNECA United Nations Economic Commission for AfricaUSD United States DollarWAPP West African Power Pool
Acronyms

9
In November 2011, the ICA published a report entitled “Regional Power Status in African Power Pools” that provided an overview of the status of Africa’s five Regional Power Pools - the Eastern Africa Power Pool, the Central African Power Pool, the Southern African Power Pool, the West African Power Pool and the Comité Maghrébin de l’Electricité using baseline data from between 2008 and 2010.
This Updated Report provides the status of the five Power Pools based on data for the period between 2013 and 2015.
As part of its mandate to increase knowledge and information sharing, ICA carried out an update of the 2011 Report in order to provide updated data on the energy sector.
Based on the study findings, there has been growth in the power sector across the African continent since the publ icat ion of the 2011 Report; the progress in each power pool is outlined below:
1. EAPP: with a membership of 11 countries, has attained a growth in the installed c a p a c i t y f ro m 3 8 , 513 M W a n d t h e corresponding consumption of 162,322 GWh in and 2008 to 54,311 MW and 2 32 , 505 G W h in 2013 respec t i ve l y. Based on the proposed roadmap, the attainment of a centralised trading regime may occur between 2020 and 2025.
2. WAPP: with a membership of 14 countries, WAPP has attained a growth in the installed capacity from 14,669 MW in 2008 to 19,648 MW in 2015. And the corresponding
consumption increased from 46,936 GWh in 2008 to 50,634 GWh in 2015 respectively. Based on the proposed roadmap, the attainment of a centralised trading regime may occur by 2019 subject to the completion of the regional interconnection projects.
3. S A P P : w i t h a m e m b e r s h i p o f 1 1 countries, has attained a growth in the installed capacity from 55,948 MW and the corresponding consumpt ion of 260,081 GWh in and 2008 to 61,859 MW and 269,375 GWh in 2015 respectively. The Southern African Power Pool (SAPP) was created in 1995 and is now the most advanced power pool on the continent; given the developments taking place in the region, it is expected that more countries will be operational members by the end of 2018, and there will also be an interconnection between EAPP and SAPP.
4. CAPP: with a membership of 10 countries, has attained a growth in the installed capacity from 5,345 MW and the corresponding consumption of 15,238 GWh in 2008 to 6,299 MW and 24,744 GWh in 2013 respectively. Given the developments in the region, i t i s probable that by end of 2020, CAPP may start functioning as a Power Pool for the interconnected countries.
5. COMELEC: w i th a membership of 5 countr ies, has attained a growth in the installed capacity from 24,027 MW and the corresponding consumption of 160,322 GWh in 2009 to 36,367 MW and 120,200 GWh in 2013 respectively. Given the enhanced support to regional power development, COMELEC could start its operations as a Power Pool as early as late 2018; but this depends more on political rather than technical considerations.
Executive Summary1. Introduction
2. Objectivte
3. Key Findings

10
While in general there has been commendable progress, the key challenges include:
y Lack of infrastructure: the need for infrastructure requires no over-emphasis as no power trade/exchange can take place without the necessary infrastructure in place:
y Lack of national strategies: Many countries st i l l lack a comprehensive strategic framework in the context of national goals and objectives to help guide the roles and responsibilities for all players including government utilities, the private sector, civil society and development organisations;
y Utility financial distress: These are mainly attributed to below-cost tariffs, weak management and political interference; and
y Politics: The ultimate goal to harness energy resources for the socio-economic transformation of Africa will necessarily hinge on political will and support. The need to harmonise power sector regulatory policies and the adoption of regional master plans to guide national development plans cannot be compromised.
4. Challenges
5. Conclusion
The Continent needs to sustain the commendable positive trend, and for this the countries should continue to:
yMobilise investments for physical intra-regional infrastructure - this should include agreeing on strategies for the mobilisation of domestic resources such as pension funds and infrastructure bonds;
y Provide conducive legal and regulatory frameworks for private sector participation - this should include legally empowering the power pools to act on behalf of RECs (and
governments), particularly on power deals;
y Continue strengthening the institutional capacity and skills of the power pools and directorates in charge of energy in the RECs – with a focus on enhancing the capacity and skills for structuring and negotiating power deals with the private sector; and
y Take necessary measures to enhance the role of the private sector.

11
Chapter 1IntroductIon to the report
In November 2011, the ICA published a report entitled “Regional Power Status in African Power Pools” that provided an overview of the status of Africa’s five Regional Power Pools - the Eastern Africa Power Pool (EAPP), the Central African Power Pool (CAPP), the Southern African Power Pool (SAPP), the West African Power Pool (WAPP) and the Maghreb Electricity Committee (or Comité Maghrébin de l’Electricité, COMELEC) using baseline data from between 2008 and 2010.
The ICA’s Strategic Business Plan for the three-year period 2014 to 2016 includes a section on “Increased Knowledge and Information Sharing”. As one of its activities in this area, the ICA Secretariat produced this Report that provides an update of the 2011 Report; it includes:
1. Updated data on the energy sector in Africa;
2. Extensive analysis of data, identifying findings, trends and possible solutions for the respective regions of the five P o w e r P o o l s , a n d t h e p o t e n t i a l t o build effective power markets in the r e g i o n s ( a n e l e m e n t t h a t w a s n o t exhaustively addressed in the 2011 report);
3. A section on private sector participation.
This Report is based on data collected from the following:
y Data col lected from 3 Power Pools , EAPP, WAPP and SAPP during physical site visits undertaken by the consultant during October and November 2016;
1.1 Background
y Published data sources include AFREC, UN, World Bank and the International Energy Agency’s World Outlook 2015 database. Due acknowledgement has been indicated in the text; and y Other sources as indicated in the list of references.
This report is divided into six chapters. Chapter 2 provides a review of East African Power Pool. Chapter 3 discusses the West African Power Pool. Chapter 4, 5, and 6 reviews the various the status of the Southern African Power Pool, Central African Power Pool, and Maghreb Electricity Committee respectively. Chapter 7 provides the analysis of power pool data, challenges along with the recommendation.
1.2 Outline of the report

12
The Eastern Africa Power Pool, established in 2005 by 7 member countries, had by 2013 grown to cover 11 countries with an estimated population of 450 million, while its installed capacity has increased from 38GW in 2008 to 55GW in 2013. While the region is well endowed with natural resources with respect to electricity generation, varying from hydro in Ethiopia and Uganda, geothermal in Kenya and gas in Tanzania, most of this remains undeveloped and electrification rates in these countries vary from 2% in Burundi to 40% in Ethiopia.
The EAPP has made commendable progress towards formation of a power pool by undertaking a Master Plan in 2011. This was updated in 2014 but it still faces a number of challenges, including:
1. Limited power trade among countries due to a lack of interconnections;
2. Weak alignment of national development plans with the regional Master Plan;
3. Weak incent ives for pr ivate sector participation; and
4. Inadequate reliable data.
It is expected, however, that if current developments are sustained, demand will increase to about 500TWh by 2030 with Egypt accounting for more than 75% of the total installed capacity. The total required investment will amount to about USD$ 400 billion to meet the demand.
chapter 2eastern afrIca power pool (eapp)
Box 1: EAPP trends
2.1 Introduction
The Eastern Africa Power Pool (EAPP) was
established in 2005 with the signing of an Inter-Governmental Memorandum of Understanding (IGMOU) by seven Eastern Africa countries, namely: Burundi, Democratic Republic of Congo (DRC), Egypt, Ethiopia, Kenya, Rwanda and Sudan. In a further development, the EAPP was adopted as a specialised institution to foster power system interconnectivity by the heads of states of the Common Market for Eastern and Southern Africa (COMESA) region in November 2006. Later Tanzania, Libya and Uganda joined EAPP in March 2010, February 2011 and December 2012 respectively; Djibouti is the latest entrant.
2.2 Vision
2.3 Objectives
To facilitate and secure power supply to the countries of the Eastern Africa region at the lowest possible cost.
y To be a framework for pooling energy resources, promoting power exchanges between utilities in Eastern Africa and reduce power supply costs based on an integrated master plan and pre-established rules (Grid code); y Optimise the usage of energy resources available in the region by working out regional investment schemes in power generation, transmission and distribution; y Reduce electricity costs in the region by using power systems interconnection and increasing power exchanges between countries; and y Provide efficient co-ordination between various initiatives taken in the fields of power production, transmission as well as exchanges in the Region.

13
Year 2010 Year 2013 GDP (US$ Bn) GDP per Capita ($) GDP (US$ Bn) Population (Million)
Burundi 2 228 3 10.9Djibouti 1 1,411 2 0.9DRC 21 309 35 71.1Egypt 219 2,922 331 84.7Ethiopia 30 378 62 89.2Kenya 40 1,053 63 44.2Libya 75 11,869 29 6.5Rwanda 6 594 8 11.1Sudan 66 1,666 84 34.2Tanzania 31 781 45 49.1Uganda 20 691 26 36.9
2.4 Membership
2.5 Governance
2.6 Socio-economic background
The current membership consists of the following eleven (11) countries Burundi, Democratic Republic of Congo (DRC), Egypt, Ethiopia, Kenya, Rwanda, Sudan, Tanzania, Libya and Uganda; and the latest addition Djibouti. Based on information from the EAPP Secretariat, South Sudan is expected to become a member soon.
The EAPP has four (4) governing bodies: the Council of Ministers, the Steering Committee, the Organisational Committees and the General Secretariat; as illustrated in the Figure 1 below:
The GDP of the countries is as indicated in Table 1 shows that Egypt is well above the other members in the region in terms of economic performance. This is followed (at a considerable distance) by Ethiopia, Kenya and Sudan and this correlates positively with the electricity demand see Table 4, 5 and 8.
PlanningCommittee
IndependentRegulatory
Board
SteeringCommittee
Governance and HR
Committee
Secretariat
EnvironmentCommittee
OperationCommittee
Council of
Ministers
Source: Oduor, 2010
Figure 1: Organisation chart EAPP
Source: World Bank database, 2013; PRB database 2010, 2013Table 1: Socio-economic data of EAPP member countries

14
Country 2008 2013 * % change
Burundi 33 42 27Djibouti 130 130 0
DRC 2,476 2,506 1Egypt 24,185 32,702 35
Ethiopia 878 2,311 163Kenya 1,326 1,723 30Libya 6,612 9,455 43
Rwanda 56 109 95Sudan 1,268 3,117 146
Tanzania 1,010 1,380 37Uganda 539 836 55
Total 38,513 54,311 41
Country 2010 2013 Burundi 241 184Djibouti 325 82
DRC 7,600 8,391Egypt 146,795 157,930
Ethiopia 4,931 8,461Kenya 7,467 8,989Libya 32,753 31,183
Rwanda 280 769Sudan 8,009 11,870
Tanzania 5,080 6,051Uganda 2,406 3,207
Total 215,887 237,117
Country Consumption in 2008 (GWh)
Consumption in 2013 (GWh)
Burundi 61 271Djibouti 243 341
DRC 7,489 7,876Egypt 106,558 155,596
Ethiopia 3,238 7,633Kenya 5,377 8,579Libya 28,396 31,295
Rwanda 177 769Sudan 4,285 11,862
Tanzania 3,292 6,136Uganda 1,206 2147
Total 160,322 232,505
2.7.1 Installed generation capacity
2.7.2 Production
2.7.3 Consumption
2.7.4 Consumption per capita
The installed generation capacity in the region has increased from roughly about 39,000MW in 2008 to about 54,000MW in 2013; an increase of about 38%; see Table 2 below for more details. Based on the available information, the increment in installed capacity is due to a number of factors that include the increased capacity to meet demand due to GDP growth, global initiatives like SE4ALL that aim at universal access to modern energy services by 2030 and increasing regional power trade.
The production as indicated in the Table 3 shows that there is correspondingly general increase of power generation over the period across all member countries in varying degree; with Ethiopia and Sudan presenting the highest increments.
In line with the increased production, the consumption has increased in each of the countries as shown in Table 4 below supporting the positive correlation between energy
In line with the GDP growth Table 1 and supported by the availability of more capacity Table 3; correspondingly the consumption per capita also increased - Table 5.
2.7 Overview of the energy sector
Source: UN data-base, 2013
Source: AFREC, 2015
Source: AFREC, 2015
Table 2: Installed capacity (MW)
Table 3: Generation (GWh)
Table 4: Consumption in EAPP countries
demand and GDP growth (refer to the Table 1).
15
Country Consumption per capita in 2008 (kWh)
Consumption per capita in 2013 (kWh)
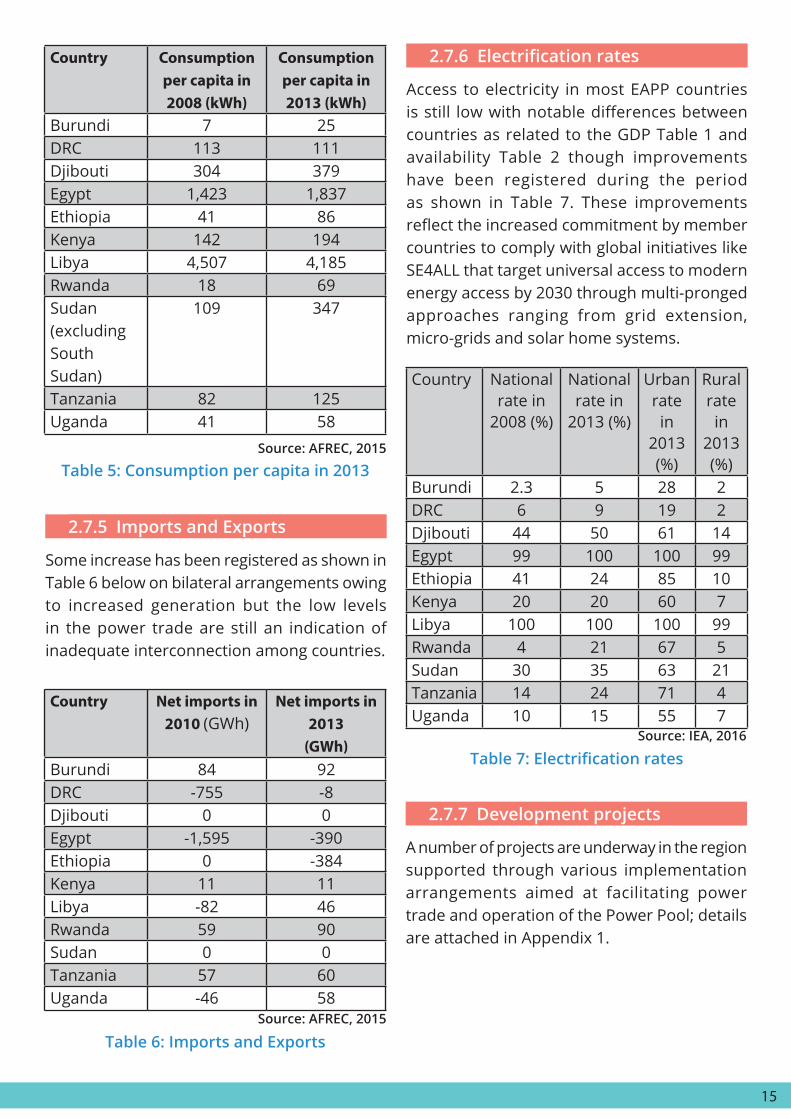
Burundi 7 25DRC 113 111Djibouti 304 379Egypt 1,423 1,837Ethiopia 41 86Kenya 142 194Libya 4,507 4,185Rwanda 18 69Sudan (excluding South Sudan)
109 347
Tanzania 82 125Uganda 41 58
Country Net imports in 2010 (GWh)
Net imports in 2013
(GWh)Burundi 84 92DRC -755 -8Djibouti 0 0Egypt -1,595 -390Ethiopia 0 -384Kenya 11 11Libya -82 46Rwanda 59 90Sudan 0 0Tanzania 57 60Uganda -46 58
Country National rate in
2008 (%)
National rate in
2013 (%)
Urban rate in
2013 (%)
Rural rate in
2013 (%)
Burundi 2.3 5 28 2DRC 6 9 19 2Djibouti 44 50 61 14Egypt 99 100 100 99Ethiopia 41 24 85 10Kenya 20 20 60 7Libya 100 100 100 99Rwanda 4 21 67 5Sudan 30 35 63 21Tanzania 14 24 71 4Uganda 10 15 55 7
2.7.5 Imports and Exports
2.7.7 Development projects
2.7.6 Electrificationrates
Some increase has been registered as shown in Table 6 below on bilateral arrangements owing to increased generation but the low levels in the power trade are still an indication of inadequate interconnection among countries.
A number of projects are underway in the region supported through various implementation arrangements aimed at facilitating power trade and operation of the Power Pool; details are attached in Appendix 1.
Access to electricity in most EAPP countries is still low with notable differences between countries as related to the GDP Table 1 and availability Table 2 though improvements have been registered during the period as shown in Table 7. These improvements reflect the increased commitment by member countries to comply with global initiatives like SE4ALL that target universal access to modern energy access by 2030 through multi-pronged approaches ranging from grid extension, micro-grids and solar home systems.
Source: AFREC, 2015
Source: AFREC, 2015
Source: IEA, 2016
Table 5: Consumption per capita in 2013
Table 6: Imports and Exports
Table7:Electrificationrates

16
2.7.8 Challenges
2.7.9 Trends
EAPP faces a number of challenges that include:
1. Lack of adequate capacity but a number of countries that include Rwanda, Tanzania, Kenya, Uganda and Ethiopia are pursuing several development projects to address this;
2. Limited power trade among countries due to a lack of interconnections, however a number of priority projects are being carried out (section 1.7.8) to address this matter;
3. Weak alignment of national development plans with the regional Master Plan; this will be addressed with time as the Power Pool gains more ground;
4. Weak incent ives for pr ivate sector participation; a number of countries have enacted enabling legislation to enhance Public-Private- Partnerships; and
5. Inadequate reliable data; a key input in planning but with continued development and more resources, this matter will also be addressed.
Demand is projected to increase by a factor of 3.5 by 2030, based on the EAPP/EAC Master Plan, boosting regional demand to around 500 TWh by 2030, with Egypt accounting for almost 75% of the total, at more than 370 TWh. In contrast, five smaller countries (including Burundi and Rwanda) would together account for less than 2% of the total. Demand from industrial users would account for the largest share by 2030, at 44%, with urban and rural demand at 39% and 17% respectively. The total investment needs would amount to almost US$ 400 billion (undiscounted), of which more than 40% would go to country-level transmission and distribution networks.

17
The West African Power Pool (WAPP) was created by Decision A/DEC.5/12/99 of the 22 nd Summit of the Author i ty of the Economic Community for West African
chapter 3west afrIcan power pool (wapp)
The West African Power Pool was established by the Summit of the Economic Community for West African States in 2000 to promote reliable power supply in a region that is characterised by lower levels of connections and power trade among states - despite widespread and diverse energy assets that include crude oil, natural gas and hydropower.
Commendable efforts are underway to deal with this power problem and member countries seem committed to the regional approach through WAPP to convert these resources into power production, with the ensuing revenue used for public benefits. This still faces a number of challenges:
1. Limited power trade among countries due to a lack of interconnections;
2. Weak alignment of national development plans with the Regional Master Plan;
3. Weak incent ives for pr ivate sector participation;
4. High tariffs; and5. Lack of adequate reliable data.
The demand is projected to increase fivefold by 2030, to 250 TWh, based on the ECOWAS Master Plan with an overall investment need amounting to US$ 170 billion. This will cover domestic transmission and distribution (T&D) costs and cross-border transmission line costs.
Box 2: WAPP trends
3.1 Introduction
States (ECOWAS) Heads of State and Government with the aim of promoting reliable power supply in the West African sub-region. Subsequently in January 2006, through Decisions A/DEC.18/01/06 and A/DEC.20/01/06, the 29th Summit of the Authority of ECOWAS Heads of State and Government held in Niamey respectively adopted the Articles of Agreement for the establishment and functioning of WAPP, and granted the WAPP Secretariat status of a specialised institution of ECOWAS.
To integrate the operations of the national power systems into a unified regional electricity market, which will, over the medium to long term, assure the citizens of ECOWAS Member States stable and reliable electricity supply at a competitive cost.
WAPP’s key objectives are to:
y Increase investments needed for power grid expansion in the region, with emphasis on the implementation of cross-border projects that will enhance supply and reliability, and reduce costs to end users;
y Create an attractive environment for investment in order to facilitate the funding of power generation and transmission facilities, including creating a common operating standard, rules and a transparent and reliable mechanism for the swift settlement of power trade transactions; and
y Formalise official and extended collaboration in the region to expand power generation,
2.2 Vision
3.3 Objectives

18
The present membership consists of the following 14 countries: Benin, Burkina Faso, Côte d’Ivoire, Gambia, Ghana, Guinea, Guinea Bissau, Liberia, Mali, Niger, Nigeria, Senegal, Sierra Leone and Togo.
WAPP has four (4) governing bodies: the General Assembly, the Executive Board, the Organisational Committees and the General Secretariat; as illustrated in the Figure 2 below:
The GDP of the countries in the region is as shown in the Table 8, with Nigeria well above the rest other members of the community; and as expected this is positively correlated with the consumption Table 11 and electrification rates Table 14:
3.4 Membership
3.5 Governance structure
3.6 Socio-economic background
HR & Governance Committee
Secretariat
Strategic Planning & Environment Committee
WAPP Executive Board
Distribution & Commercialization
Committee
Finance Committee
Engineering & Operating Committee
WAPP General Assembly
Source: Ki, 2016
Source: World Bank database, 2013; PRB 2008, 2015
Figure 2: WAPP Organisation structure
Table 8: Socio-economic data of WAPP member countries
Year 2008 Year 2015Country GDP ($Bn) Pop. (Mn) GDP ($Bn) Pop. (Mn)
Benin 7 9.3 8 10.6Burkina Faso 9 15.2 11 18.5Côte d’Ivoire 25 20.7 32 23.3Gambia 1 1.6 1 2Ghana 32 23.9 38 27.7Guinea 5 10.3 7 11Guinea Bissau 1 1.7 1 1.8Liberia 1 3.9 2 4.5Mali 11 12.7 13 16.7Niger 6 14.7 7 18.7Nigeria 369 148.1 481 181.8Senegal 12 12.7 14 14.7Sierra Leone 3 5.5 4 6.5Togo 3 6.8 4 7.2
transmission and trade.
19
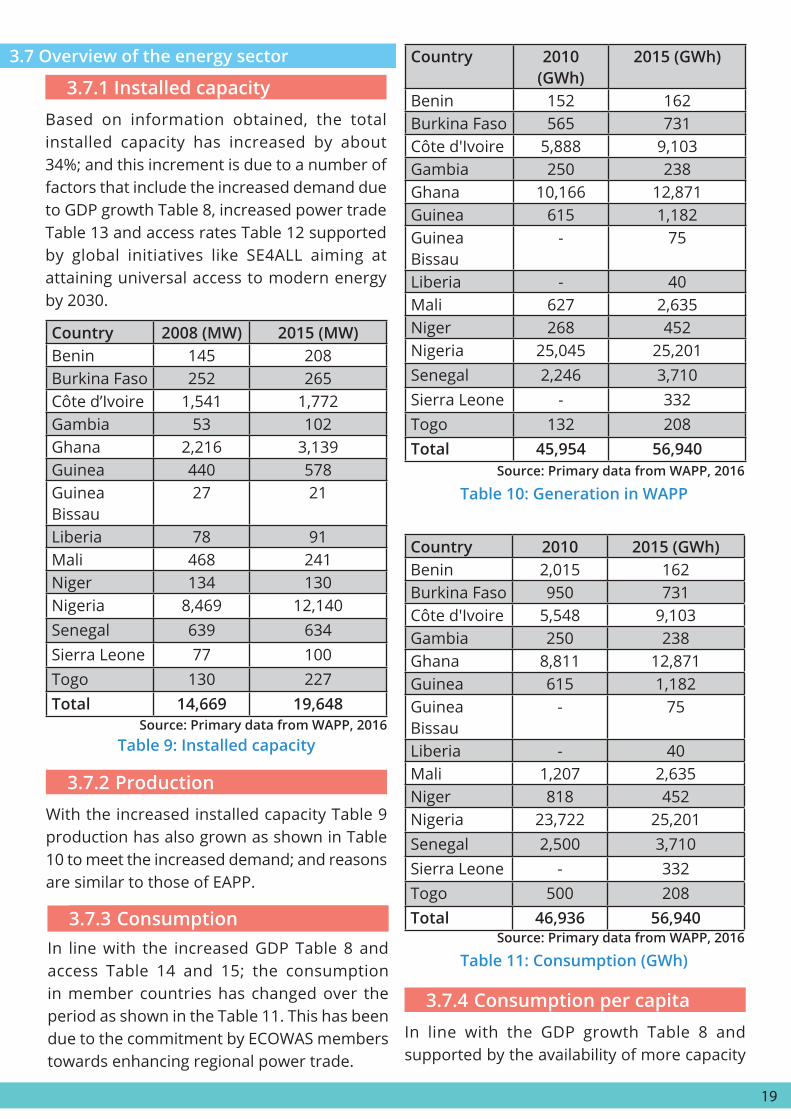
Based on information obtained, the total installed capacity has increased by about 34%; and this increment is due to a number of factors that include the increased demand due to GDP growth Table 8, increased power trade Table 13 and access rates Table 12 supported by global initiatives like SE4ALL aiming at attaining universal access to modern energy by 2030.
With the increased installed capacity Table 9 production has also grown as shown in Table 10 to meet the increased demand; and reasons are similar to those of EAPP.
In line with the GDP growth Table 8 and supported by the availability of more capacity
In line with the increased GDP Table 8 and access Table 14 and 15; the consumption in member countries has changed over the period as shown in the Table 11. This has been due to the commitment by ECOWAS members towards enhancing regional power trade.
Source: Primary data from WAPP, 2016
Source: Primary data from WAPP, 2016
Source: Primary data from WAPP, 2016
Table 9: Installed capacity
Table 10: Generation in WAPP
Table 11: Consumption (GWh)
3.7 Overview of the energy sector
3.7.1 Installed capacity
3.7.2 Production
3.7.4 Consumption per capita
3.7.3 Consumption
Country 2008 (MW) 2015 (MW)Benin 145 208Burkina Faso 252 265Côte d’Ivoire 1,541 1,772Gambia 53 102Ghana 2,216 3,139Guinea 440 578Guinea Bissau
27 21
Liberia 78 91Mali 468 241Niger 134 130Nigeria 8,469 12,140Senegal 639 634Sierra Leone 77 100Togo 130 227Total 14,669 19,648
Country 2010 (GWh)
2015 (GWh)
Benin 152 162Burkina Faso 565 731Côte d'Ivoire 5,888 9,103Gambia 250 238Ghana 10,166 12,871Guinea 615 1,182Guinea Bissau
- 75
Liberia - 40Mali 627 2,635Niger 268 452Nigeria 25,045 25,201Senegal 2,246 3,710Sierra Leone - 332Togo 132 208Total 45,954 56,940
Country 2010 2015 (GWh)Benin 2,015 162Burkina Faso 950 731Côte d'Ivoire 5,548 9,103Gambia 250 238Ghana 8,811 12,871Guinea 615 1,182Guinea Bissau
- 75
Liberia - 40Mali 1,207 2,635Niger 818 452Nigeria 23,722 25,201Senegal 2,500 3,710Sierra Leone - 332Togo 500 208Total 46,936 56,940

20
Further analysis shows the divide between electrification rates in urban and rural areas are found to be very pronounced across coun-tries in the region, see Table 15 below. Like other countries in other regions. Countries in the community are pursuing a number of ini-tiatives with international support to address this matter.
3.7.6Electrificationrates
3.7.7 Development projects
Country 2008 2015Benin 23 29Burkina Faso 10 17Côte d'Ivoire 30 26Gambia 25 36Ghana 25 72Guinea 13 26Guinea Bissau
3 21
Mali 10 26Niger 3 15Nigeria 40 45Senegal 30 55Sierra Leone 8 5Togo 13 27
There have been dramatic changes in electrification rates particularly in Ghana, while the declines in Ivory Coast and Sierra Leone are attributed to political upheavals, as shown in the Table 14. Based on information obtained from WAPP; there are many initiatives in the Region aimed at increasing capacity enhancement, regional interconnections and access to modern energy and these are expected to result into dramatic upturn.
In 2011, WAPP had an ambitious programme of proposed investments, premised on the following priority projects that will not only enhance regional power trade but will also boost the demand and access resulting into increased GDP growth.
Source: Primary data from WAPP, 2016
Table14:Aggregatedelectrification national rates (%)
Power imports and exports among the various countries have changed over the period as tabulated below in the Table 13 on account of increased interconnection and cooperation among countries.
Source: Primary data from WAPP and PRB, 2014
Source: AFREC, 2015
Table 12: Consumption per capita (KWh)
Table 13: Net imports and exports (GWh)
3.7.5 Imports and Exports
Country 2010 2015Benin 217 219Burkina Faso 59 147 Côte d'ivoire 252 239 G Bissau - 44 Gambia 139 126 Ghana 284 358 Guinea 57 94 Liberia - 9 Mali 79 168 Niger 51 44 Nigeria 150 135 S Leone - 51 Senegal 200 228 Togo 74 162
Country 2010 2015Benin 935 987Burkina Faso 385 523Côte d'Ivoire -471 -551Ghana -930 -519Guinea - -Guinea Bissau
- -
Mali 0 13Niger 653 643Nigeria 0 0Senegal 253 284Sierra Leone - -Togo 706 659
Table 10; correspondingly the consumption per capita also increased – Table 12; the drop in Nigeria is partly due to lack of adequate capacity.

21
The Project include:
y Coastal Transmission Backbone Sub-programme (Côte d’Ivoire, Ghana, Benin/Togo, Nigeria); y In ter -zona l Transmiss ion Hub Sub-programme (Burkina Faso, OMVS via Mali, Mali via Côte d’Ivoire, Liberia / Sierra Leone / Guinea via Côte d’Ivoire); y North-core Transmission Subprogram (Nigeria, Niger, Burkina Faso, Benin); y OMVG/OMVS Power System Development Sub-programme (The Gambia, Guinea, Guinea Bissau, Mali, Senegal); y Côte d’Ivoire-Liberia-Sierra Leone-Guinea Power System Re-development Sub-programme (Côte d’Ivoire, Liberia, Sierra Leone, Guinea); and y WAPP Strategic Generation Sub-programme (Emergency Power Supply Security Plan).
Based on data obtained from the WAPP, the status of the priority projects is as indicated in Appendix 2.
WAPP has to overcome a number of challenges, including:
y Demand continues to outgrow production capacity implying load shedding is becoming more prominent; y The energy crisis in the sub-region has led to ECOWAS Member states adopting non-optimal solutions that have deviated from the ECOWAS vision for an integrated, sustainable and vibrant electricity market in West Africa; and y Institutional frameworks of national electricity sub-sectors and the technical, financial and operational performances of utilities need to strengthened.
The demand is projected to increase fivefold by 2030, to 250 TWh, based on the ECOWAS Master Plan. Currently 87% of demand comes from urban users, with almost all of the rest from industry. Rural demand is currently insignificant but this mix is projected to change by 2030, with urban demand dropping to 48%, industrial demand rising to 45% and rural demand climbing to 7%. The overall investment needs in the region during this period amount to US$ 170 billion, with domestic transmission and distribution (T&D) costs and cross-border transmission lines comprising about 37% of the total.
3.7.8 Challenges ahead
3.7.9 Trends
Country National Urban RuralBenin 29 57 9Burkina Faso 17 56 1Côte d'Ivoire 26 42 8Gambia 36 60 2Ghana 72 92 50Guinea 26 53 11Guinea-Bissau 21 37 6Liberia 10 17 3Mali 26 53 9Niger 15 62 4Nigeria 45 55 37Senegal 55 90 28Sierra Leone 5 11 1Togo 27 35 21
Source: Primary data from WAPP
Table15:Electrification(%)rates-2015
22
The Vision of SAPP is to:
y Facilitate the development of a competitive electricity market in the Southern African region; y Give the end user a choice of electricity supply; y Ensure that the Southern African region is the region of choice for investments by energy-intensive users; and y Ensure sustainable energy developments through sound economic, environmental and social practices.
The objectives of the SAPP are to:
y Co-ordinate and co-operate in the planning and operation of electricity power systems to minimise costs, while maintaining reliability, autonomy and self-sufficiency; y Increase interconnectivity between SADC countries so as to increase the reliability of power supplies; y Harmonise relationships between member utilities so as to facilitate cross-border electricity trading; y Provide a forum for the development of a
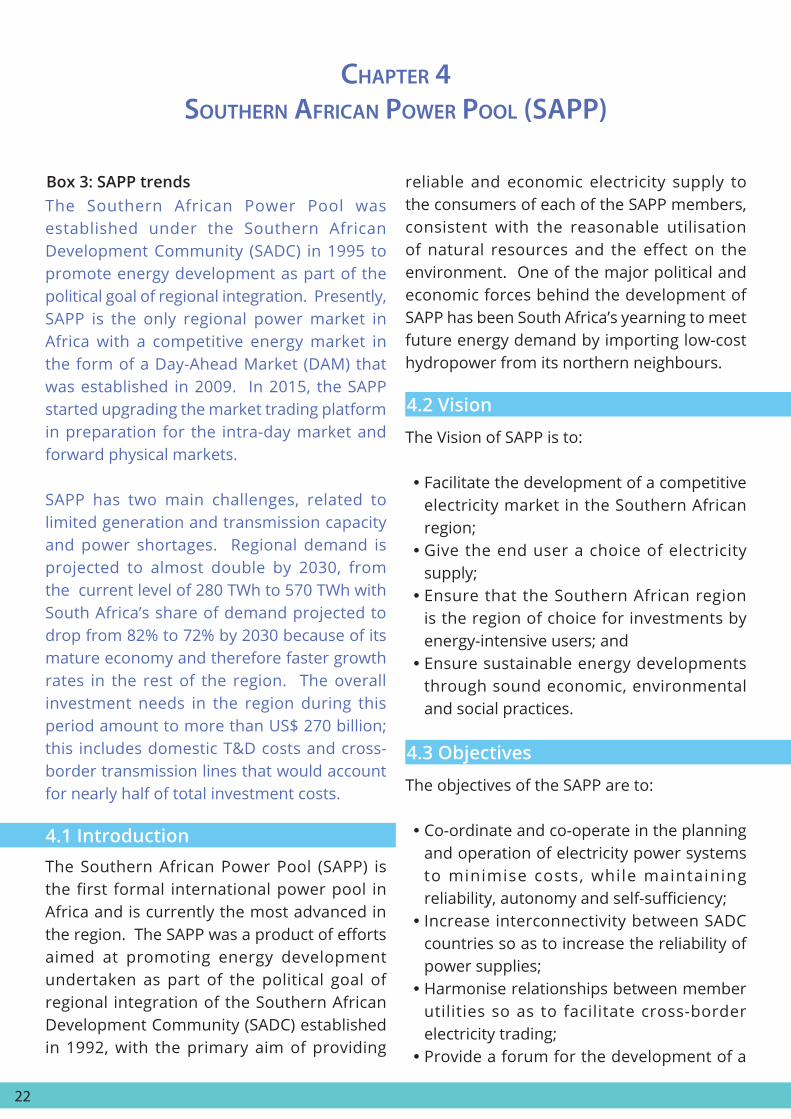
The Southern African Power Pool (SAPP) is the first formal international power pool in Africa and is currently the most advanced in the region. The SAPP was a product of efforts aimed at promoting energy development undertaken as part of the political goal of regional integration of the Southern African Development Community (SADC) established in 1992, with the primary aim of providing
chapter 4 southern afrIcan power pool (sapp)
The Southern African Power Pool was established under the Southern African Development Community (SADC) in 1995 to promote energy development as part of the political goal of regional integration. Presently, SAPP is the only regional power market in Africa with a competitive energy market in the form of a Day-Ahead Market (DAM) that was established in 2009. In 2015, the SAPP started upgrading the market trading platform in preparation for the intra-day market and forward physical markets.
SAPP has two main challenges, related to limited generation and transmission capacity and power shortages. Regional demand is projected to almost double by 2030, from the current level of 280 TWh to 570 TWh with South Africa’s share of demand projected to drop from 82% to 72% by 2030 because of its mature economy and therefore faster growth rates in the rest of the region. The overall investment needs in the region during this period amount to more than US$ 270 billion; this includes domestic T&D costs and cross-border transmission lines that would account for nearly half of total investment costs.
Box 3: SAPP trends
4.1 Introduction
4.2 Vision
4.3 Objectives
reliable and economic electricity supply to the consumers of each of the SAPP members, consistent with the reasonable utilisation of natural resources and the effect on the environment. One of the major political and economic forces behind the development of SAPP has been South Africa’s yearning to meet future energy demand by importing low-cost hydropower from its northern neighbours.

23
SAPP membership is made up of the following countries Angola, Botswana, DRC, Lesotho, Malawi, Mozambique, Namibia, South Africa, Swaziland, Tanzania, Zambia and Zimbabwe.
The SAPP is governed by the following instruments:
y The Inter-Governmental Memorandum of Understanding; y T h e I n t e r - U t i l i t y M e m o r a n d u m o f Understanding; y Agreement between operating members; and y Operating guidelines.
South Africa is the most dominant economic giant in the region as illustrated in Table 16 below and this tally with the energy consumption as shown in the Table 19.
Country Year 2010 Year 2015GDP Popula-
tionGDP Popula-
tion
Angola 85 19 103 25Botswa-na
13 1.8 14 2.1
DRC 21 67.8 35 73.3Lesotho 2 1.9 2 1.9Malawi 7 15.4 7 17.2Mozam-bique
10 23.4 15 25.7
Namibia 11 2.2 12 2.5South Africa
375 49.9 313 55
Swazi-land
4 1.2 4 1.3
Tanzania 31 45 45 52.3Zambia 20 13.3 21 15.5Zimba-bwe
9 12.6 14 17.4
Planning Sub-Committee
Co-ordination Centre
Environmental Sub-Committee
Executive Committee
CoordinationCentre Board
Operating Sub- Committee
Markets Sub-Committee
Management Committee
SADC Directorate of Infrastructure and
Services
4.4 Membership
4.5 Governance
4.6 Socio-economic background
world-class, robust, safe, efficient, reliable and stable interconnected electrical system in the Southern African region; y Co-ordinate and enforce common regional standards of quality of supply, measurement and monitoring of systems performance; y Facilitate the development of regional expertise through training programmes and research; y Increase power accessibi l i ty in rural communities; y Implement strategies in support of sustainable development priorities; and y Recover costs of operations and equitably share benefits, including reductions in generating capacity and fuel costs, and improving use of hydroelectric energy.
Source: SAPP Annual Report, 2015
Source: The World Bank, 2015; www.prb.org 2010, 2015
Figure 3: SAPP Management Structure
Table 16: Socio – economic data of SAPP member countries

24
Power consumption by SAPP member countries has grown from 260,081GWh in 2010 (with South Africa alone representing an average of 84% of total consumption) to 269,375GWh in 2015. Notwithstanding this there have been modest increments in other countries, as show in Table 19. The consumption would have been
The consumption per capita like in other regions is positively correlated with the GDP; with South Africa as expected far ahead; see Table 20.
There has been a modest increment in the production of the countries, from about 270,000 GWh to about 277,000GWh over the period 2008 to 2015, as shown in the Table 18, partly due to more efficient usage through aggressive demand side management techniques deployed and shortage of capacity attributed to the severe drought.
4.7.3 Consumption
4.7.4 Consumption per Capita
4.7.2 Production
Country 2010 2015Angola 1,155 2,210Botswana 152 892DRC 2,476 2,442Lesotho 80 74Malawi 502 352Mozam-bique
2,428 2,724
Namibia 467 501South Africa 43,738 46,963Swaziland 70 70Tanzania 1,008 1,380Zambia 1,770 2,206Zimbabwe 2,102 2,045Total 55,948 61,859
Country 2008 2015Angola 4,900 5,613Botswana 445 372DRC 7,641 8,185Lesotho 486 486Malawi 1,543 1,809Mozambique 341 390Namibia 1,305 1,305South Africa 232,812 237,430Swaziland 288 288Tanzania 4,371 3,034Zambia 10,156 11,381Zimbabwe 6,951 6,951Total 271,239 277,244
Country 2010 2015Angola 3,498 3,427Botswana 2,936 3,118DRC 6,323 7,548Lesotho 488 488Malawi 1,439 1,476Mozambique 1,748 2,380Namibia 3,648 3,648South Africa 218,591 224,446Swaziland 1,019 1,019Tanzania 3,393 3,770Zambia 9,631 10,688Zimbabwe 7,367 7,367Total 260,081 269,375
In 2001 total installed capacity stood at 56,000MW with South Africa contributing about 78.2%; this has now increased to 61,859MW with 52,589MW available; see Table 17 below; though it is not adequate to meet the demand.
4.7.1 Installed capacity
4.7 Overview of the energy sector
Source: SAPP Annual Report, 2016
Source: SAPP Annual Report, 2016
Source: SAPP Annual Report, 2016
Table 17: Installed capacity (MW)
Table 18: Generation (GWh)
Table 19: Consumption (GWh)
much higher if demand side management techniques had not been deployed owing to shortage of available capacity.
25
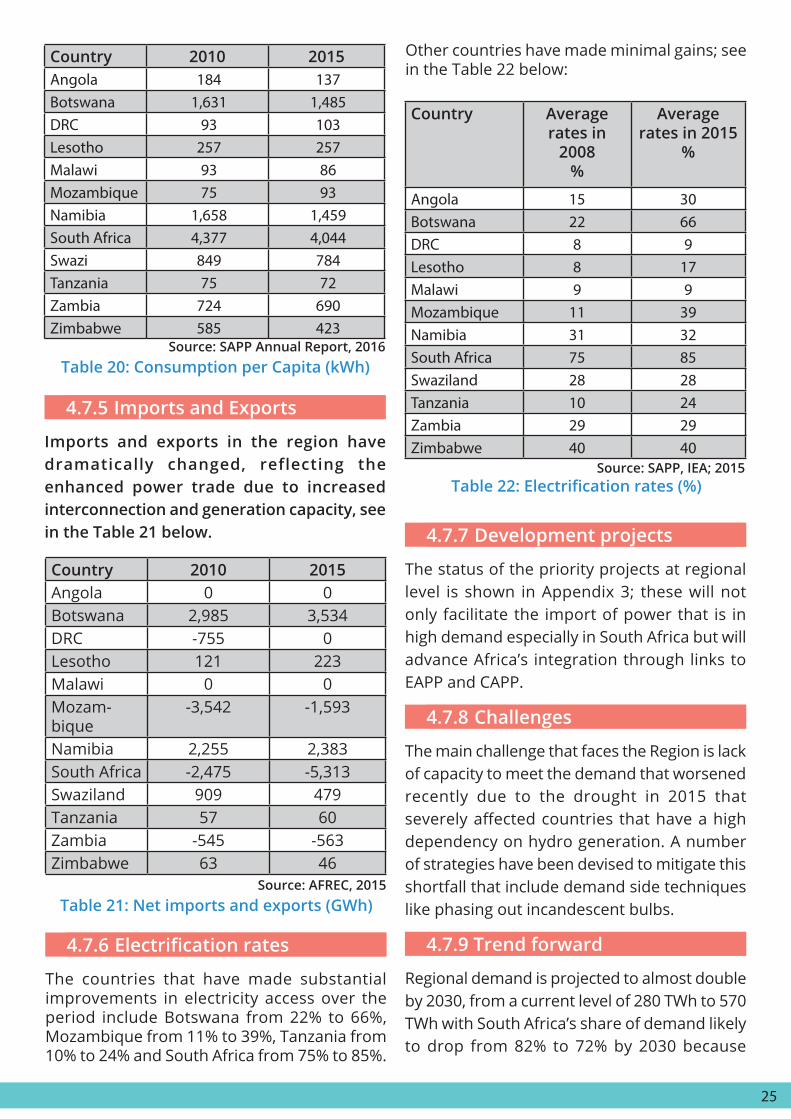
The countries that have made substantial improvements in electricity access over the period include Botswana from 22% to 66%, Mozambique from 11% to 39%, Tanzania from 10% to 24% and South Africa from 75% to 85%.
Imports and exports in the region have dramatically changed, reflecting the enhanced power trade due to increased interconnection and generation capacity, see in the Table 21 below.
The status of the priority projects at regional level is shown in Appendix 3; these will not only facilitate the import of power that is in high demand especially in South Africa but will advance Africa’s integration through links to EAPP and CAPP.
The main challenge that faces the Region is lack of capacity to meet the demand that worsened recently due to the drought in 2015 that severely affected countries that have a high dependency on hydro generation. A number of strategies have been devised to mitigate this shortfall that include demand side techniques like phasing out incandescent bulbs.
Regional demand is projected to almost double by 2030, from a current level of 280 TWh to 570 TWh with South Africa’s share of demand likely to drop from 82% to 72% by 2030 because
4.7.6Electrificationrates
4.7.5 Imports and Exports
4.7.7 Development projects
4.7.8 Challenges
4.7.9 Trend forward
Country 2010 2015Angola 184 137 Botswana 1,631 1,485 DRC 93 103 Lesotho 257 257 Malawi 93 86 Mozambique 75 93 Namibia 1,658 1,459 South Africa 4,377 4,044 Swazi 849 784 Tanzania 75 72 Zambia 724 690 Zimbabwe 585 423
Country Average rates in
2008 %
Average rates in 2015
%
Angola 15 30Botswana 22 66DRC 8 9Lesotho 8 17Malawi 9 9Mozambique 11 39Namibia 31 32South Africa 75 85Swaziland 28 28Tanzania 10 24Zambia 29 29Zimbabwe 40 40
Country 2010 2015Angola 0 0Botswana 2,985 3,534DRC -755 0Lesotho 121 223Malawi 0 0Mozam-bique
-3,542 -1,593
Namibia 2,255 2,383South Africa -2,475 -5,313Swaziland 909 479Tanzania 57 60Zambia -545 -563Zimbabwe 63 46
Source: SAPP Annual Report, 2016
Source: SAPP, IEA; 2015
Source: AFREC, 2015
Table 20: Consumption per Capita (kWh)
Table22:Electrificationrates(%)
Table 21: Net imports and exports (GWh)
Other countries have made minimal gains; see in the Table 22 below:
26
of its mature economy and therefore faster growth rates in the rest of the region. Industrial demand is projected to decrease from the current level of 66% to 57%, whereas urban demand is seen rising from 32% to 38%, while rural demand is projected to move from 2% to 4%. Overall investment needs in the region during this period amount to more than US$ 270 billion; this includes domestic T&D costs and cross-border transmission lines that would account for nearly half of total investment.
In the meantime, given developments in generation and transmission interconnections taking place in the region, it is expected that more member counties will be operational members by the end of 2018. There is also a planned interconnection between EAPP and SAPP.

27
The Central African Power Pool (CAPP) was created on 12 April 2003 as a specialised agency of the Economic Community for Central African States (ECCAS) through the:
y Inter-Governmental MOU s igned by ministers responsible for electricity in ECCAS; and y Inter-utility MOU signed by CEOs of the national utilities; both were signed in April 2003.
The mission of PEAC is:
To contribute to the establishment of a regional electricity market to meet the electricity needs of its industries and populations, while ensuring a reliable supply of cheap electricity, in support of economic and social development and respect for the environment.
Countries include: Angola, Burundi, Cameroon, Central Africa Republic, Chad, Congo, DRC, Equatorial Guinea, Gabon, Sao Tome and Principe.
The present institutional framework was established by the two MOUs signed in 2003 that led to the establishment of the offices in Brazzaville, Congo; as illustrated in the Figure 7 below.
The objectives include: y Increasing the reliability of electricity supply in different ECCAS countries; y Expanding the population’s access to electricity and reducing poverty; y I m p r o v i n g t h e e l e c t r i c i t y s y s t e m ’ s performance and quality of supply in the region; y Creating a regional forum for discussion of energy sector problems and searching for appropriate solutions within the framework of the defined policies and with due attention to the environmental impacts and; y Establishing a liberalised energy market place.
5.2 Mission
5.4 Membership
5.5 Governance
5.3 Objectives
5.1 Introduction
Chapter 5 central afrIcan power pool (capp) / pool energé que de l’af-
rIque centrale (peac)
The Central African Power Pool (CAPP); a specialised agency of the Economic Community for Central African States (ECCAS) was established in 2003 to promote power development in the region, which is dominated by isolated national networks despite the enormous hydro potential.
CAPP has the following main challenges:
1. Limited power trade among countries due to lack of interconnections;
2. Weak incent ives for pr ivate sector participation; and
3. Lack of adequate reliable data.
Electricity demand is expected to increase to about 90 TWh in 2030 with a total investment requirement of more than US$ 60 billion (undiscounted), of which one third would go to T&D. About US$ 3 billion in revenues would come from exports to the WAPP and SAPP regions from 2023, assuming the Grand Inga project proceeds as planned.
Box 3: CAPP trends

28
Country 2008 2013Angola 1,155 1,530Burundi 33 42Cameroon 937 1,049CAR 44 44Chad 41 41Congo 238 400DRC 2,476 2,506Equatorial Guinea
41 41
Gabon 366 627Sao Tome 14 19Total 5,345 6,299
Regulatory Agency (Experts of
Public energy administrations)
Steering Committee (Heads of Utilities)
Permanent Secretariat (Permanent Manager
at Head O�ce)
Settlement Board (Experts of public enadministrations
and Utilities)
Committee of Experts(Experts of Utilities and
Ministries of Energy)
Exploitation Sub-committee
(Experts of Utilities)
Coordination Center(Experts of Utilities
operating grid)
Planning Sub-committee
(Experts of Utilities)
Environmental Sub-committee
(Experts of Utilities)
Council of Ministers (Ministers of Energy)
Executive Committee(Heads of public
energy administration)
Source: PEAC, 2016
*Source: http://www.un.data.org ; 2014
Source: The World Bank, 2015; PRB, 2013
Figure 4: CAPP management structure
Table 24: Installed capacity (MW)
Table 23: Socio-economic data of CAPP member countries
Angola stands out economically as the strongest country in the region, while DRC and Cameroon come second and third respectively. Chad, Congo, Gabon and Guinea the follows in that order; see in the Table 23 below; however the over reliance on oil exports makes these countries very vulnerable, as evidenced by the impact during the last oil crisis.
5.6 Socio-economic background
Country Year 2010 Year 2013GDP ($Bn)
Popu-lation
GDP ($Bn)
Popu-lation
Angola 85 19 103 21.6Burundi 2 8.5 3 10.9Cameroon 24 20 29 21.5CAR 2 4.8 2 4.7Chad 11 11.5 11 12.2Congo 12 3.9 9 4.4DRC 21 67.8 35 71.1Eq. Guinea 13 0.7 9 0.8Gabon 14 1.5 14 1.6Sao Tome 0 0.2 0 0.2
The installed capacity in this Region is very low compared with the huge potential that exists and consists of mainly national isolated systems; this pattern is changing with the increased appreciation of regional power trade opportunities and the increased investments in the Region; see Table 24.
Total generation in the CAPP in 2010 (excluding self-generation, which represent a significant share of thermal power plants in countries like Cameroon, Chad and DRC) was 22,499GWh has grown to 25,842GWh in 2013 – details are in the Table 25:
In 2010, power consumption by CAPP member countries was estimated at 19,669 GWh as compared to 24,744GWh in 2013 as tabulated in Table 26 below; this also correlates with the GDP like in other areas:
5.7 Overview of the energy sector
5.7.1 Installed capacity
5.7.2 Production
5.7.3 Power consumption (GWh)

29
Country 2010 2013Angola 5,448 6,370Burundi 241 184Cameroon 5,958 6,523CAR 160 144Chad 100 269Congo 781 1,407DRC 7,600 8,391Equatorial Guinea
410 413
Gabon 1,776 2,113Sao Tome 25 28Total 22,499 25,842
Country 2010 2013Angola 4822 6,236Burundi 221 271Cameroon 5319 6,119CAR 149 105Chad 91 236Congo 600 1,488DRC 6,757 7,876Equatorial Guinea
90 421
Gabon 1592 1,966Sao Tome 28 26Total 19,669 24,744
Country 2010 2013
Angolaw 0 0Burundi 84 92Cameroon 0 0CAR 0 0Chad 0 0Congo 281 37DRC -755 -8Equatorial Guinea 0 0Gabon 0 0Sao Tome & Principe 0 0
Country 2010 2013Angola 196 289 Burundi 24 25 Cameroon 204 285 CAR 15 22 Chad 13 19 Congo 72 338 DRC 72 111 Equatorial Guinea 314 526 Gabon 957 1,229 Sao Tome & Principe 110 130
Source: AFREC, 2015
Source: AFREC, 2015
Source: AFREC, 2015
Source: AFREC, 2015; PRB, 2013
Table 25: Generation in CAPP (GWh)
Table 26: Consumption (GWh)
Table 28: Net imports and export (GWh)
Table 27: Consumption per capita (kWh)
According to the ICA’s 2011 Report, wide disparities existed among the countries regarding electricity consumption per capita; varying from 1,326kWh in Gabon, to 532kWh in Equatorial Guinea and down to 9kWh in Chad. In 2013, the wide disparities still exist but there have been very slight changes in the quantities, as shown in Table 27 below:
According to the ICA’s 2011 Report, in 2008 exports from DRC had reached 1,230GWh,
5.7.4 Consumption per capita
5.7.5 Imports and exports
as compared to 660 GWh imported during the same year, and a limited regional power trade was taking place among a few countries through interconnections between:
y DRC and Congo (60MW capacity); y D R C a n d Z a m b i a t o S A P P ( 1 5 0 M W capacity); and y DRC to Burundi, CAR, Rwanda and Angola with medium-voltage cross-borders sales.
I t was further reported that the commissioning of the Imboulou hydropower plant in Congo had substantially decreased its imports from DRC. According to AFREC, in 2015 the net importers in the region were Burundi (92GWh), Congo (37GWh) and DRC with a net export of 8GWh in 2013.

30
There have been some improvements in the connection rates especially in Gabon and Cameroon; details are as shown in the Table 29 below.
A number of priority projects identified in the ICA’s 2011 Report aimed at boosting the region’s generation capacity and interconnections are still at the feasibility stage. The status in 2015 is as provided in Appendix 4.
The main challenge that faces the Region is the low interconnection amongst member countries; the present national isolated systems cannot raise enough resources or demand to make the development of the big projects viable. It is hoped that CAPP will be facilitated to play its pivotal role and guide the regional developments.
Electricity demand is expected to increase to about 90TWh in 2030; with urban, industrial and rural demand projected to account for 57%, 39% and 4% respectively. The total investment amount required is in excess of
5.7.6Electrificationaccess
5.7.7 Priority projects
5.7.8 Challenges
5.7.9 Trends
Country National 2009 National 2013 Urban 2013 Rural 2013
Angola 26 30 30 18Burundi 2 5 5 2
Cameroon 28 55 55 17CAR 2 3 3 1Chad 4 4 4 1Congo 29 42 42 5DRC 8 9 9 2Eq. Guinea 28 66 66 48Gabon 38 89 89 38Sao Tome 49 59 59 40
Source: IEA, 2015Table29:Electrificationrates(%)inCAPP
US$ 60 billion (undiscounted), of which one third would go to T&D. About US$ 3 billion in revenues would come from exports to WAPP and SAPP from 2023, assuming the Grand Inga project proceeds as planned.
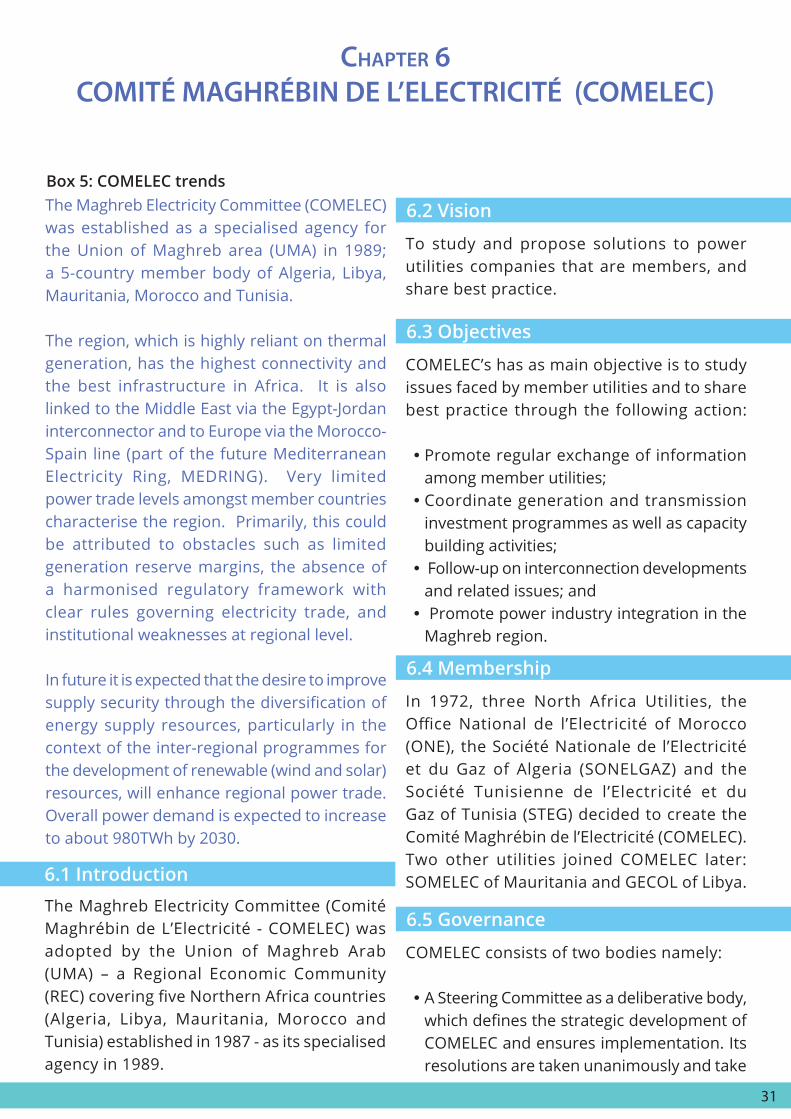
31
chapter 6coMIté MaghréBIn de l’electrIcIté (coMelec)
The Maghreb Electricity Committee (COMELEC) was established as a specialised agency for the Union of Maghreb area (UMA) in 1989; a 5-country member body of Algeria, Libya, Mauritania, Morocco and Tunisia.
The region, which is highly reliant on thermal generation, has the highest connectivity and the best infrastructure in Africa. It is also linked to the Middle East via the Egypt-Jordan interconnector and to Europe via the Morocco-Spain line (part of the future Mediterranean Electricity Ring, MEDRING). Very limited power trade levels amongst member countries characterise the region. Primarily, this could be attributed to obstacles such as limited generation reserve margins, the absence of a harmonised regulatory framework with clear rules governing electricity trade, and institutional weaknesses at regional level.
In future it is expected that the desire to improve supply security through the diversification of energy supply resources, particularly in the context of the inter-regional programmes for the development of renewable (wind and solar) resources, will enhance regional power trade. Overall power demand is expected to increase to about 980TWh by 2030.
Box 5: COMELEC trends
The Maghreb Electricity Committee (Comité Maghrébin de L’Electricité - COMELEC) was adopted by the Union of Maghreb Arab (UMA) – a Regional Economic Community (REC) covering five Northern Africa countries (Algeria, Libya, Mauritania, Morocco and Tunisia) established in 1987 - as its specialised agency in 1989.
To study and propose solutions to power utilities companies that are members, and share best practice.
In 1972, three North Africa Utilities, the Office National de l’Electricité of Morocco (ONE), the Société Nationale de l’Electricité et du Gaz of Algeria (SONELGAZ) and the Société Tunisienne de l’Electricité et du Gaz of Tunisia (STEG) decided to create the Comité Maghrébin de l’Electricité (COMELEC). Two other utilities joined COMELEC later: SOMELEC of Mauritania and GECOL of Libya.
COMELEC consists of two bodies namely:
y A Steering Committee as a deliberative body, which defines the strategic development of COMELEC and ensures implementation. Its resolutions are taken unanimously and take
COMELEC’s has as main objective is to study issues faced by member utilities and to share best practice through the following action:
y Promote regular exchange of information among member utilities; y Coordinate generation and transmission investment programmes as well as capacity building activities; y Follow-up on interconnection developments and related issues; and y Promote power industry integration in the Maghreb region.
6.1 Introduction
6.2 Vision
6.4 Membership
6.5 Governance
6.3 Objectives

32
6.7.1 Installed capacity
into consideration existing international standards; and a
y General Secretariat provided by the Headquarters of COMELEC (in Algiers) t h a t p r e p a r e s t h e w o r k o f t h e Committee, disseminates its decisions a n d r e c o m m e n d a t i o n s , r e p r e s e n t s COMELEC in international organisations and ensures the implementat ion of the work programmes. The General Secretariat also organises the ordinary and extraordinary sessions of the Committee
HR & Governance Committee
WAPP Executive Board
Distribution & Commercialization
Committee
Finance Committee
Planning Interconnection Committee
Steering Committee
Source: COMELEC, 2003
Figure 5: Organisation structure for COMELEC
The countries have registered growth in their GDP except Libya that had a fall due to the political strife, as indicated in the Table 29 below:
6.6 Socio-economic background
6.7 Overview of the energy sector
in liaison with the host organisations.
COMELEC relies on six committees, namely:
yMaghreb Interconnection Commission (CIM) is the operational organisation of COMELEC and supervises the operation of the Maghreb interconnections. It ensures the mastery of the interactions of the Maghreb electrical system with the other networks. The CIM is the representative of COMELEC vis-à-vis other organizations on all technical issues relating to electrical interconnections; y Commission for Planning and Studies (CPE), which is responsible for the interconnection study, the establishment of a framework for the coherence of the master plans for the development of the Maghreb networks, and the establishment of a system of tariffs; y Technical Commission (CT), which is responsible for the electrification of the border villages, studying the possibility for reducing costs of the structures and the
study of normalisation and integration in the Maghreb; y The Commission for Management and Human Resources (HRM) is responsible for carrying out actions to promote exchanges of experts and experiences, particularly by encouraging training; y The Commission for New and Renewable Energies (CENR) (without nuclear power) of the COMELEC; it constitutes opening the organisation to new technologies and to unconventional electricity generation. It aims to master these technologies in order to integrate them into the electrical system in the best techno/economic conditions; and
finally
y The COMELEC Trade Commission (CC),
which was created by decision of the
Steering Committee, at its meeting in Tripoli
on 09 December 2009.
Year 2010 Year 2013GDP - $Bn
Pop. (106)
GDP -$Bn
Pop. (106)
Algeria 161 36 167 38.3
Egypt 219 80.4 331 84.7Libya 75 6.5 29 6.5Mauritania 4 3.4 5 3.7Morocco 93 31.9 100 33Tunisia 44 10.5 43 10.9
Source: World Bank, 2015Table 30: Socio-economic data of
COMELEC member countries
The installed generation capacity in the
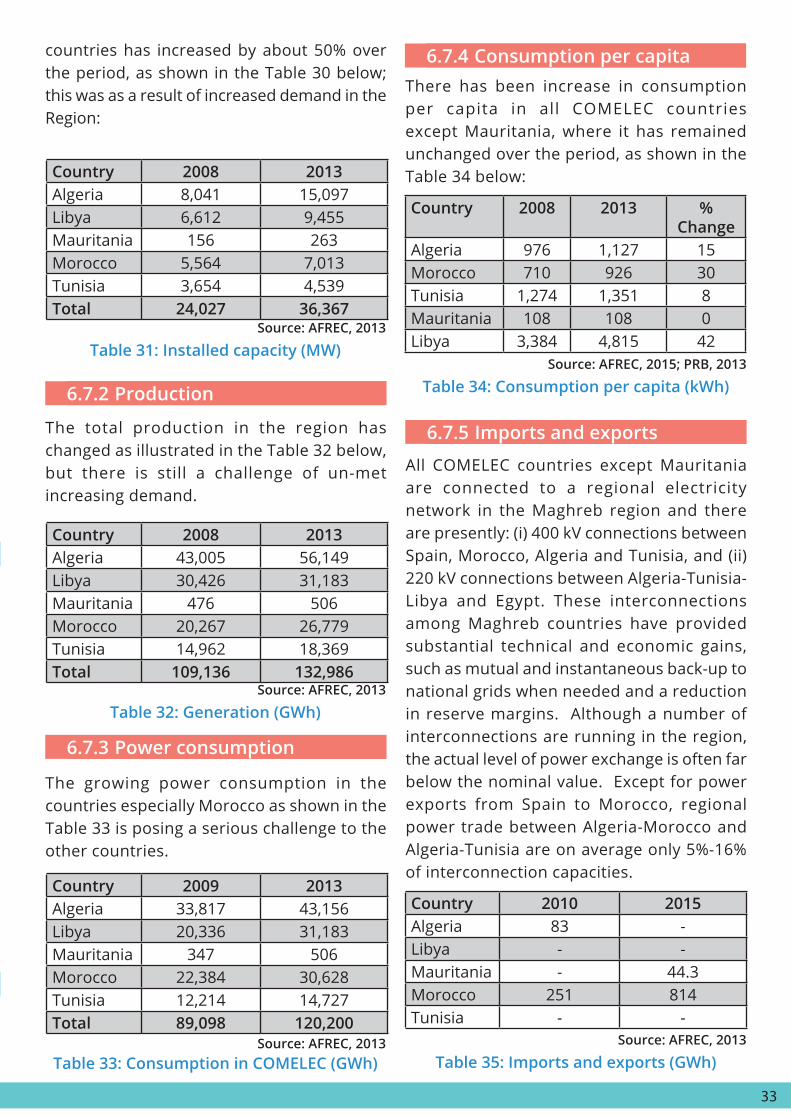
33
6.7.3 Power consumption
6.7.2 Production
6.7.4 Consumption per capita
6.7.5 Imports and exports
Country 2008 2013Algeria 8,041 15,097Libya 6,612 9,455Mauritania 156 263Morocco 5,564 7,013Tunisia 3,654 4,539Total 24,027 36,367
Country 2008 2013 % Change
Algeria 976 1,127 15Morocco 710 926 30Tunisia 1,274 1,351 8Mauritania 108 108 0Libya 3,384 4,815 42
Country 2008 2013Algeria 43,005 56,149Libya 30,426 31,183Mauritania 476 506Morocco 20,267 26,779Tunisia 14,962 18,369Total 109,136 132,986
Country 2009 2013Algeria 33,817 43,156Libya 20,336 31,183Mauritania 347 506Morocco 22,384 30,628Tunisia 12,214 14,727Total 89,098 120,200
Country 2010 2015Algeria 83 -Libya - -Mauritania - 44.3Morocco 251 814Tunisia - -
The total production in the region has changed as illustrated in the Table 32 below, but there is still a challenge of un-met increasing demand.
The growing power consumption in the countries especially Morocco as shown in the Table 33 is posing a serious challenge to the other countries.
All COMELEC countries except Mauritania are connected to a regional electricity network in the Maghreb region and there are presently: (i) 400 kV connections between Spain, Morocco, Algeria and Tunisia, and (ii) 220 kV connections between Algeria-Tunisia-Libya and Egypt. These interconnections among Maghreb countries have provided substantial technical and economic gains, such as mutual and instantaneous back-up to national grids when needed and a reduction in reserve margins. Although a number of interconnections are running in the region, the actual level of power exchange is often far below the nominal value. Except for power exports from Spain to Morocco, regional power trade between Algeria-Morocco and Algeria-Tunisia are on average only 5%-16% of interconnection capacities.
Source: AFREC, 2013
Source: AFREC, 2015; PRB, 2013
Source: AFREC, 2013
Source: AFREC, 2013 Source: AFREC, 2013
Table 31: Installed capacity (MW)
Table 34: Consumption per capita (kWh)
Table 32: Generation (GWh)
Table 33: Consumption in COMELEC (GWh) Table 35: Imports and exports (GWh)
There has been increase in consumption per capita in all COMELEC countries except Mauritania, where it has remained unchanged over the period, as shown in the Table 34 below:
countries has increased by about 50% over the period, as shown in the Table 30 below; this was as a result of increased demand in the Region:

34
6.7.6Electrificationrates
6.7.7 Development projects
6.7.8 Challenges
6.7.9 Trends
Essentially, this is a saturated market except for Mauritania and, according to 2013 data, electrification is nearly 100% in the rest of the countries; see Table 36 below:
A number of projects have been under consideration for some time, details are provided in Appendix 5; but their viability will be enhanced and easier to seek resources if handled under COMELEC.
Soaring electricity demand, caused by economic growth, demographic changes and progressing urbanization are the key challenges in the Region. The regional approach to deal with this challenge through interconnections is a much more viable option compared to investment
With respect to urban and rural access, the findings indicate access rates as below in the Table 37:
Country 2008 2013Algeria 97 99Libya 100 100Mauritania 24 28Morocco 97 99Tunisia 99.5 100
Country National Electri-fication
2013
Urban Access 2013
Rural Ac-cess 2013
Algeria 99 100 97Libya 100 100 99Maurita-nia
28 47 2
Morocco 99 100 97Tunisia 100 100 100
Source: IEA, 2015
Source: IEA, 2015
Table36:Electrificationrates(%)
Table37:Nationalelectrificationrates(%)
Electricity demand is expected to increase to about 980 TWh in 2030, and Egypt will remain the largest source of demand in the region, while Libya, Morocco, and Tunisia also will experience a significant increase. Urban, industrial and rural demand currently account for 42%, 47% and 11% respectively of final electricity demand in 2010, and this split is not expected to change dramatically. The total investment needs are expected to amount to US$ 450 billion (undiscounted), of which about 40% would be for national transmission and distribution. There are three key drivers that are accelerating the development of more capacity:
y Renewable electricity generation will help offset gas-fired generation in the region, allowing more surplus gas to be exported to Europe; this could help Europe to diversify its gas import sources; y The existence of large volumes of low-marginal cost electricity in North Africa could finally provide the security required to invest in high-voltage interconnectors under the Mediterranean. These would serve both to import surplus renewable electricity into Europe as well as to help use European excess capacity to support increasing demand for electricity in North Africa; and y North African countries have to sustain necessary economic growth especially after the “Arab Spring”.
While the enhanced growth of the electricity market appears as a good business case, there are two main hurdles that have to be overcome; these include:
y High capital investments are required to
in additional generation and operational costs for each country in isolation but this is still encumbered by the prevailing market structures, and thus the creation of COMELEC is a step in the right direction.

35
establish the networks; and y Legal and regulatory reforms have to be undertaken to establish the necessary energy market laws.

36
7.2.1 EAPP
Following the heightened realisation that power development in Africa will be best managed through Power Pools, the roadmap to enhancing regional power trade in the various Power Pools is as outlined below:
Based on the proposed roadmap, the attainment of a centralised trading regime may occur between 2020 and 2025; see details in the Table 38.
chapter 7analysIs of power pools data
Due to the diversity of Africa’s natural resources – e.g. solar and wind power bases in the North, hydropower in the Central and solar in the Southern regions of Africa – there is a business case for the establishment of an interconnected network across the continent. And African nations have recognised the many benefits of power pooling.
The simplest type of pooling arrangement is the interconnection of electricity systems where national utilities rely on an interconnected network and define an arrangement in which they agree to support a neighbouring utility, country, or region during an emergency. This gives them the opportunity to improve the reliability of their power systems and system efficiency through sharing generation and reserve margins. In a “loose” pool, power is exchanged continuously and this requires contractual arrangements for power purchases and a coordinated system for dispatch. Under the more complex “tight” pool, dispatch is centralised and utilities follow a least-cost merit order of dispatch. This arrangement requires substantial investments for IT systems and the harmonisation of regulatory frameworks. The most sophisticated type of pooling is the “new pool” in which dispatching is based on the bid price of each generator rather than costs; here the wholesale price of electricity is based on competition in the market rather than being determined by a regulator.
There are 3 necessary building blocks:
y A common legal and regulatory framework which includes an inter-governmental and
7.1 Introduction
7.2 Power market development status and trends
inter-utility memoranda of understanding, regional electricity framework laws and independent national regulators; y A durable framework for systems planning and operat ion, which encompasses power pool organisation structure and interconnection planning, and system operations frameworks; and y Finally, the most advanced is an equitable c o m m e r c i a l f r a m e w o r k f o r e n e r g y exchanges, which covers commercial rules of practice, internal dispute resolution mechanisms and minimum capabilities of system operation.
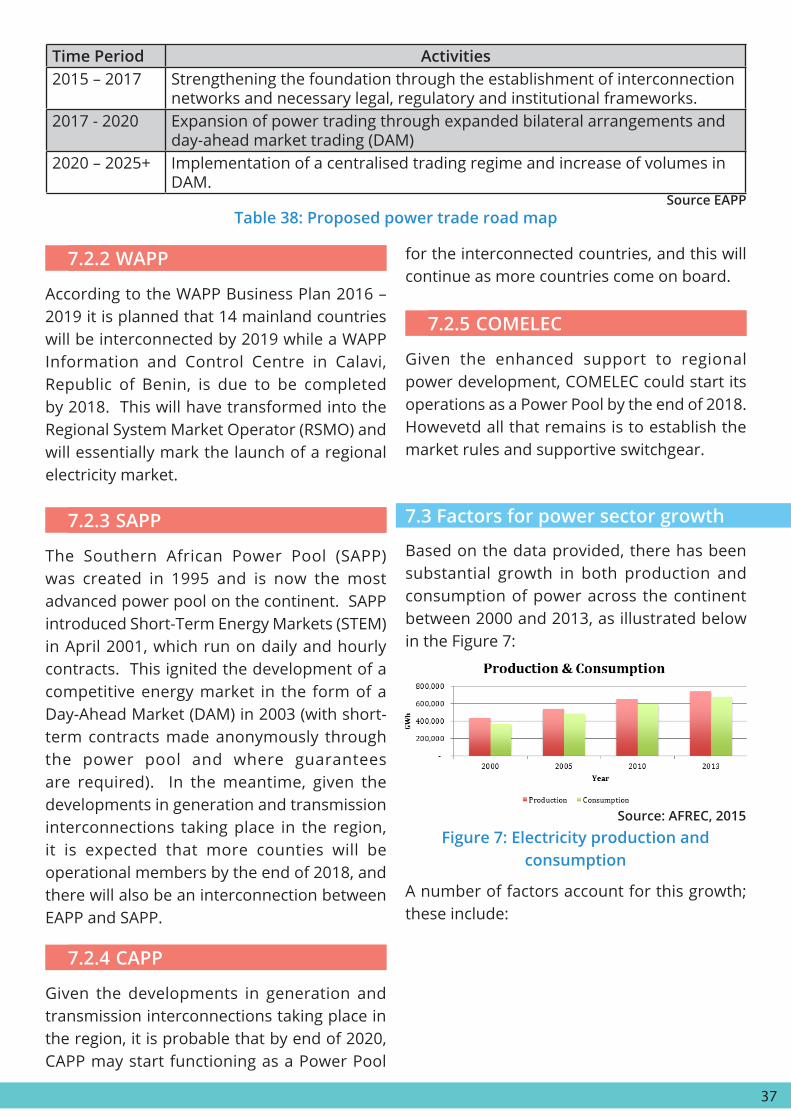
37
Time Period Activities2015 – 2017 Strengthening the foundation through the establishment of interconnection
networks and necessary legal, regulatory and institutional frameworks.2017 - 2020 Expansion of power trading through expanded bilateral arrangements and
day-ahead market trading (DAM)2020 – 2025+ Implementation of a centralised trading regime and increase of volumes in
DAM.Source EAPP
Source: AFREC, 2015
Table 38: Proposed power trade road map
Figure 7: Electricity production and consumption
7.2.2 WAPP
7.2.5 COMELEC
7.2.3 SAPP
7.2.4 CAPP
According to the WAPP Business Plan 2016 – 2019 it is planned that 14 mainland countries will be interconnected by 2019 while a WAPP Information and Control Centre in Calavi, Republic of Benin, is due to be completed by 2018. This will have transformed into the Regional System Market Operator (RSMO) and will essentially mark the launch of a regional electricity market.
Given the enhanced support to regional power development, COMELEC could start its operations as a Power Pool by the end of 2018. Howevetd all that remains is to establish the market rules and supportive switchgear.
Based on the data provided, there has been substantial growth in both production and consumption of power across the continent between 2000 and 2013, as illustrated below in the Figure 7:
The Southern African Power Pool (SAPP) was created in 1995 and is now the most advanced power pool on the continent. SAPP introduced Short-Term Energy Markets (STEM) in April 2001, which run on daily and hourly contracts. This ignited the development of a competitive energy market in the form of a Day-Ahead Market (DAM) in 2003 (with short-term contracts made anonymously through the power pool and where guarantees are required). In the meantime, given the developments in generation and transmission interconnections taking place in the region, it is expected that more counties will be operational members by the end of 2018, and there will also be an interconnection between EAPP and SAPP.
Given the developments in generation and transmission interconnections taking place in the region, it is probable that by end of 2020, CAPP may start functioning as a Power Pool
A number of factors account for this growth; these include:
for the interconnected countries, and this will continue as more countries come on board.
7.3 Factors for power sector growth

38
Source: Turok, 2016
Source: Africa Economic Outlook, 2015
Source: Economist, 2014
Figure 10: Urbanisation growth in Africa
Figure 8: Africa’s economic growth
Figure 9: Projected population growth in Africa
7.3.1 Economic growth
7.3.3 Urbanisation
7.3.2 Demographics
Sub-Saharan Africa is seen as a new frontier of growth, and economic growth rates have shown immense potential during the last decade. This is strongly correlated with power sector growth
Economic growth, a rise in incomes and increasing urbanisation in most countries in Africa will lead to an increase in demand for power; according to UN data, Africa’s urban population is likely to grow from the present 400 million to 1.3 billion by 2050, see in the Figure 10.
International experience shows that urbanisation has the potential to transform living standards for households, communities and nations. With the right institutions, infrastructure and policies in place, cities can contribute to accelerated economic development, increased private investment and job creation. Policy priorities need to shift from trying to contain and eliminate the growth of informal settlements, to harnessing the benefits of concentrated economic activity in higher productivity and entrepreneurial dynamism. Ordinary people must be enabled to access emerging opportunities and find their position in urban labour markets, education systems and social networks.
Population changes underway in sub-Saharan Africa will have major implications for the development of the energy sector. Growth is rapid, having increased by 270 million people since 2000 to around 940 million in 2013, and it is expected to reach one billion well before the end of this decade. This huge increase, concentrated mainly in West and East Africa, brings new opportunities, such as a rising working-age population, but also magnifies many existing challenges, such as the quest to achieve universal access to quality, sustainable energy. According to the Economist 2014, if current demographic patterns continue Africa may have 4.2 billion people by 2100, against 1.1 billion today, with the highest growth rates in Western and Eastern parts of the region, see in the Figure 9.

39
Innovations like the mobile phone, affordable agro-processing equipment and an increasingly enlightened rural population have compelled the energy sector to increase access in order to meet the required power needs of the population – electricity is no longer a privilege for the urban elite.
China is investing significantly in the continent. According to African Economic Outlook 2015, foreign direct investment from China rose dramatically from US$1.5 billion in 2005 to US$15 billion in 2011; about 65 percent of this is in sub-Saharan Africa, of which just over a third goes directly into the energy sector. According to the IEA, between 2010 and 2015 Chinese contractors constructed and connected more than 7 GW of generation capacity additions; these completed power plants represent 30% of sub-Saharan African capacity additions in this five-year period and 46% if South Africa is excluded.
A number of global initiatives are engaged in the promotion of increased prosperity and economic development in Africa by improving electricity security, they include:
1. Power Africa: Launched by former US President Barack Obama in June 2013,
7.3.4 Technology
7.3.5 China
7.3.6 International frameworks
Source: ITU, 2016
Figure 11: Smart phone growth in selected African countries
Power Africa aims to add more than 10,000 megawatts of clean, efficient electricity generation capacity and provide access for more than 20 million people and commercial entities through expansion of mini-grid and off-grid solutions in addition to enhancing energy resource management capabilities, allowing partner countries to meet their critical energy needs and achieve sustainable, long-term energy security.
2. Sustainable Energy for All (SE4ALL): A partnership between the UN and the World Bank, SE4ALL has three objectives:
y Ensure universal access to modern energy services; y Double the global rate of improvement in energy efficiency; and y Double the share of renewable energy in the global energy mix.
3. Africa-EU Millennium Development Goals initiative: Launched at a summit of the UN General Assembly in New York in 2010, the EU’s Millennium Development Goals initiative is helping African, Caribbean and Pacific (ACP) nations to reach the Millennium Development Goals (MDGs) with funding of about €1 billion of funds from the 10th European Development Fund (EDF). By the end of 2013, the MDG initiative funded 69 projects implemented by non-governmental organisations, member state agencies and international organisations in 46 countries of Africa, the Caribbean and the Pacific;
4. Tokyo International Conference on African Development (TICAD): Launched in 1993 by the Government of Japan, TICAD promotes Africa’s development, peace and security through the strengthening of relations in multilateral cooperation and partnership. TICAD contributes to the facilitation and promotion of high-level
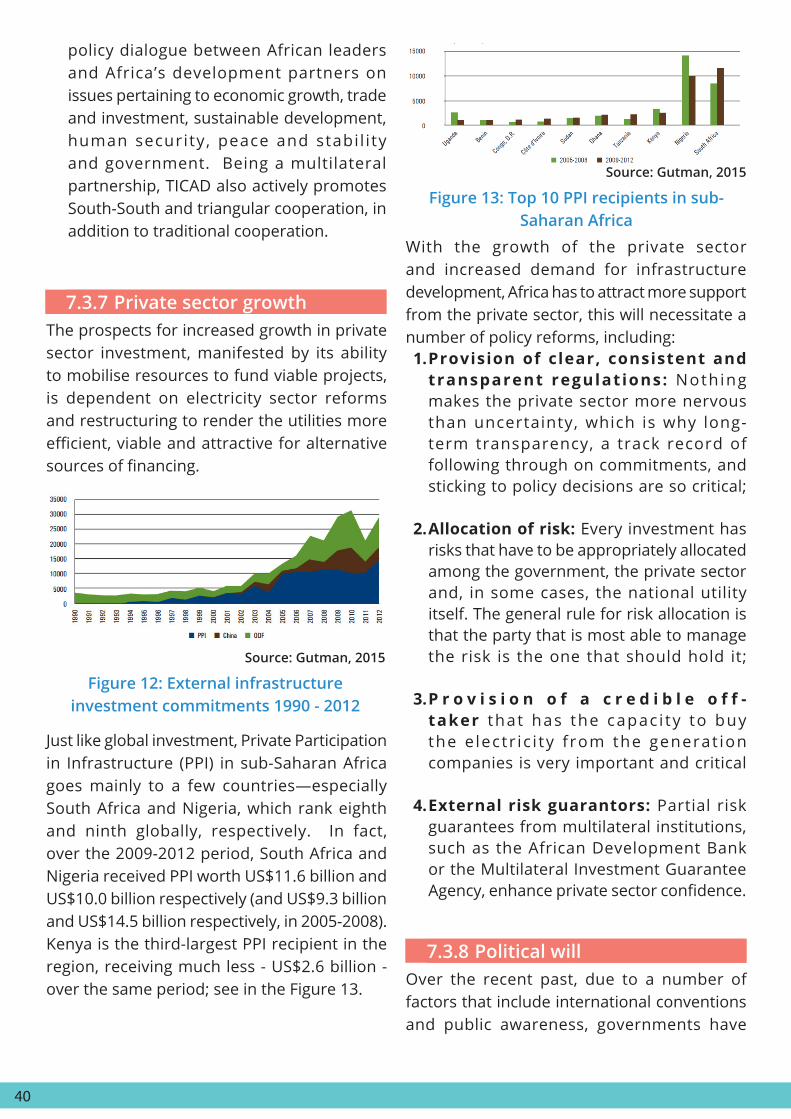
40
Over the recent past, due to a number of factors that include international conventions and public awareness, governments have
The prospects for increased growth in private sector investment, manifested by its ability to mobilise resources to fund viable projects, is dependent on electricity sector reforms and restructuring to render the utilities more efficient, viable and attractive for alternative sources of financing.
With the growth of the private sector and increased demand for infrastructure development, Africa has to attract more support from the private sector, this will necessitate a number of policy reforms, including:1. Provision of clear, consistent and
transparent regulations: Nothing makes the private sector more nervous than uncertainty, which is why long-term transparency, a track record of following through on commitments, and sticking to policy decisions are so critical;
2. Allocation of risk: Every investment has risks that have to be appropriately allocated among the government, the private sector and, in some cases, the national utility itself. The general rule for risk allocation is that the party that is most able to manage the risk is the one that should hold it;
3. P r o v i s i o n o f a c r e d i b l e o f f -taker that has the capac i ty to buy the e lectr ic i ty f rom the generat ion companies is very important and critical
4. External risk guarantors: Partial risk guarantees from multilateral institutions, such as the African Development Bank or the Multilateral Investment Guarantee Agency, enhance private sector confidence.
Just like global investment, Private Participation in Infrastructure (PPI) in sub-Saharan Africa goes mainly to a few countries—especially South Africa and Nigeria, which rank eighth and ninth globally, respectively. In fact, over the 2009-2012 period, South Africa and Nigeria received PPI worth US$11.6 billion and US$10.0 billion respectively (and US$9.3 billion and US$14.5 billion respectively, in 2005-2008). Kenya is the third-largest PPI recipient in the region, receiving much less - US$2.6 billion - over the same period; see in the Figure 13.
6.2.9 Increased public awareness7.3.8 Political will
7.3.7 Private sector growth
Source: Gutman, 2015
Source: Gutman, 2015
Figure 12: External infrastructure investment commitments 1990 - 2012
Figure 13: Top 10 PPI recipients in sub-Saharan Africa
policy dialogue between African leaders and Africa’s development partners on issues pertaining to economic growth, trade and investment, sustainable development, human security, peace and stabi l i ty and government. Being a multilateral partnership, TICAD also actively promotes South-South and triangular cooperation, in addition to traditional cooperation.
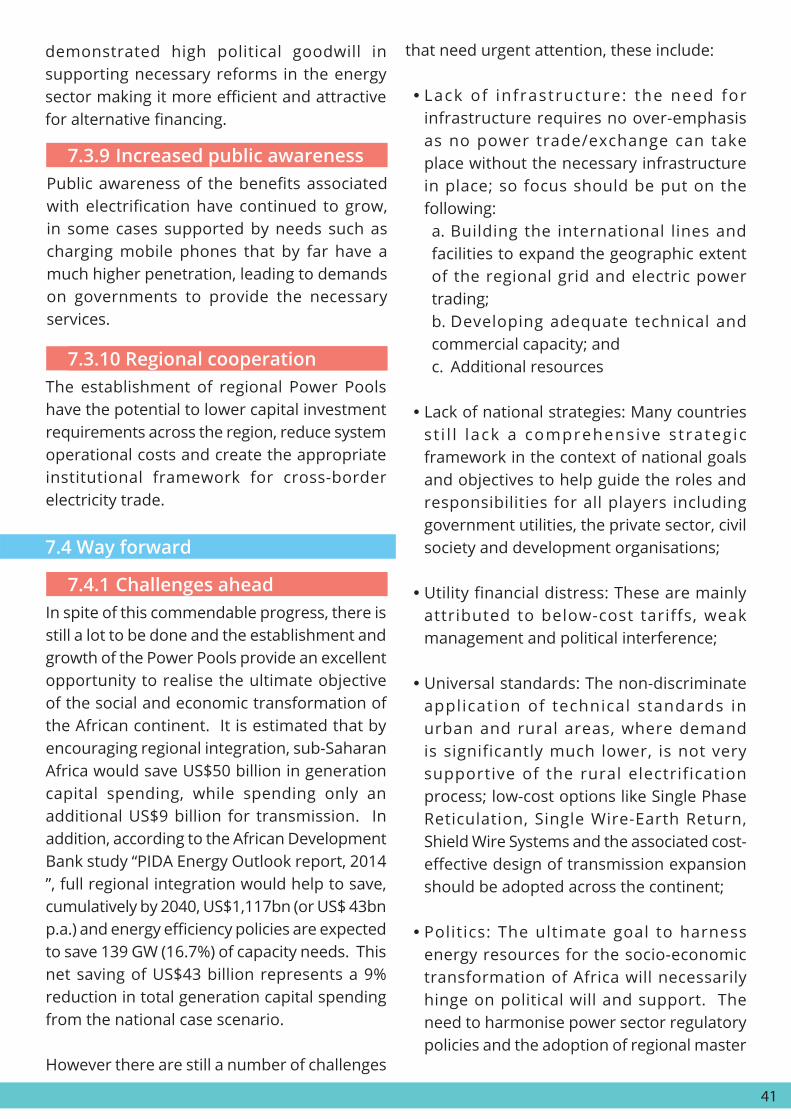
41
demonstrated high political goodwill in supporting necessary reforms in the energy sector making it more efficient and attractive for alternative financing.
Public awareness of the benefits associated with electrification have continued to grow, in some cases supported by needs such as charging mobile phones that by far have a much higher penetration, leading to demands on governments to provide the necessary services.
The establishment of regional Power Pools have the potential to lower capital investment requirements across the region, reduce system operational costs and create the appropriate institutional framework for cross-border electricity trade.
In spite of this commendable progress, there is still a lot to be done and the establishment and growth of the Power Pools provide an excellent opportunity to realise the ultimate objective of the social and economic transformation of the African continent. It is estimated that by encouraging regional integration, sub-Saharan Africa would save US$50 billion in generation capital spending, while spending only an additional US$9 billion for transmission. In addition, according to the African Development Bank study “PIDA Energy Outlook report, 2014 ”, full regional integration would help to save, cumulatively by 2040, US$1,117bn (or US$ 43bn p.a.) and energy efficiency policies are expected to save 139 GW (16.7%) of capacity needs. This net saving of US$43 billion represents a 9% reduction in total generation capital spending from the national case scenario.
However there are still a number of challenges
7.3.9 Increased public awareness
7.3.10 Regional cooperation
7.4.1 Challenges ahead
7.4 Way forward
that need urgent attention, these include:
y Lack of infrastructure: the need for infrastructure requires no over-emphasis as no power trade/exchange can take place without the necessary infrastructure in place; so focus should be put on the following:a. Building the international lines and facilities to expand the geographic extent of the regional grid and electric power trading;b. Developing adequate technical and commercial capacity; andc. Additional resources
y Lack of national strategies: Many countries st i l l lack a comprehensive strategic framework in the context of national goals and objectives to help guide the roles and responsibilities for all players including government utilities, the private sector, civil society and development organisations;
y Utility financial distress: These are mainly attributed to below-cost tariffs, weak management and political interference;
y Universal standards: The non-discriminate application of technical standards in urban and rural areas, where demand is significantly much lower, is not very supportive of the rural electrification process; low-cost options like Single Phase Reticulation, Single Wire-Earth Return, Shield Wire Systems and the associated cost-effective design of transmission expansion should be adopted across the continent;
y Politics: The ultimate goal to harness energy resources for the socio-economic transformation of Africa will necessarily hinge on political will and support. The need to harmonise power sector regulatory policies and the adoption of regional master
42
y Mobi l i se investments for phys ica l intra-regional infrastructure: This would include a strategy to mobil ise m a j o r d o m e s t i c r e s o u r c e s s u c h a s pension funds or infrastructure bonds;
y Conducive legal and regulatory framework for private sector participation: This would include legally empowering the Power Pools to act on behalf of RECs (and governments), particularly on power deals. In this way a private sector entity wanting to invest in a regional project would have to deal with one entity instead of a complicated deal-structure with many countries;
y Continued strengthening of the institutional capacity and skills of the Power Pools and directorates in charge of energy in the RECs: A certain focus should be paid to enhancing the capacity and skills for structuring and negotiating power deals with the private sector, e.g. PPA (Power Purchase Agreements).
7.4.2 Recommendations
plans to guide national development plans cannot be compromised;
y Afro-pessimistic perceptions: Unfortunately Africa is still perceived as a single country or bloc often framed by decades-old stories and images of civil strife, terrorism, corruption, famine, disease and poor infrastructure; these afro-pessimist myths and negative perceptions may be deal breakers for potential investors.

43
1. Appendices
Ruzizi 3 – 145MW Feasibility stageRuzizi 4 – 287MW Feasibility stageKivu I – 100MW Feasibility stageKivu II – 200MW Feasibility stageGibe IV – 1468 MW Under construction Karuma – 700MW Under constructionIsimba - 180MW Under constructionGrand Renaissance dam 6,000 MW Under constructionEthiopia – Kenya 500kV Under constructionEthiopia – Sudan 500kV Feasibility stageTanzania – Uganda 220kV Feasibility stage
Name of Project Year of operationProjects Under Implementation330 kV Volta (Ghana) – Lome “C” (Togo) – Sakete (Benin) 2017225 kV Bolgatanga (Ghana) – Ouagadougou (Burkina Faso) 2018330kV Aboadze – Prestea – Kumasi – Bolgatanga 2018/2020140MW Gouina Hydropower Project under OMVS 2019OMVG (Senegal, Gambia, Guinea, Guinea Bissau) 2019/2020Cote d’Ivoire – Liberia – Sierra Leone – Guinea Interconnection Project (CLSG)
2018
64 MW WAPP Mount Coffee Hydropower 2017450MW Maria Gletta Hydropower Project (Benin) 2020450MW Domunli Hydropower Project (Ghana) 2020Rehabilitation of 760MW Kainji and 540MW Jebba Hydropower sta-tions in Nigeria
2016
220MW Tiboto Hydropower Project (Ivory Coast and Liberia) 2021Resource mobilisation330kV Ivory Coast – Ghana interconnection 2019330 kV Nigeria – Niger – Togo/Benin - Burkina Interconnection Project 2020225kV Ghana – Burkina Faso – Mali Interconnection Project 2020225 kV Guinea – Mali Interconnection 2020Under review, development (studies, etc)760kV Nigeria Super Grid -330kV Nigeria – Niger – Burkina – Togo/Benin (Northcore) 2020128MW Kassa Hydropower Project in Guinea -86MW Bikongor Hydropower Project in Sierra Leone -150 – 450MW Hydropower projects in OMVS zone 2020147MW Adjarala Hydropower Project (Benin/ Togo) 2019515MW Souapiti Hydropower Project in Guinea 202130MW Solar Park in Mali -
1.1 Appendix 1: Priority projects in EAPP
1.2 Appendix 2: Priority projects in WAPP
Source: WAPP
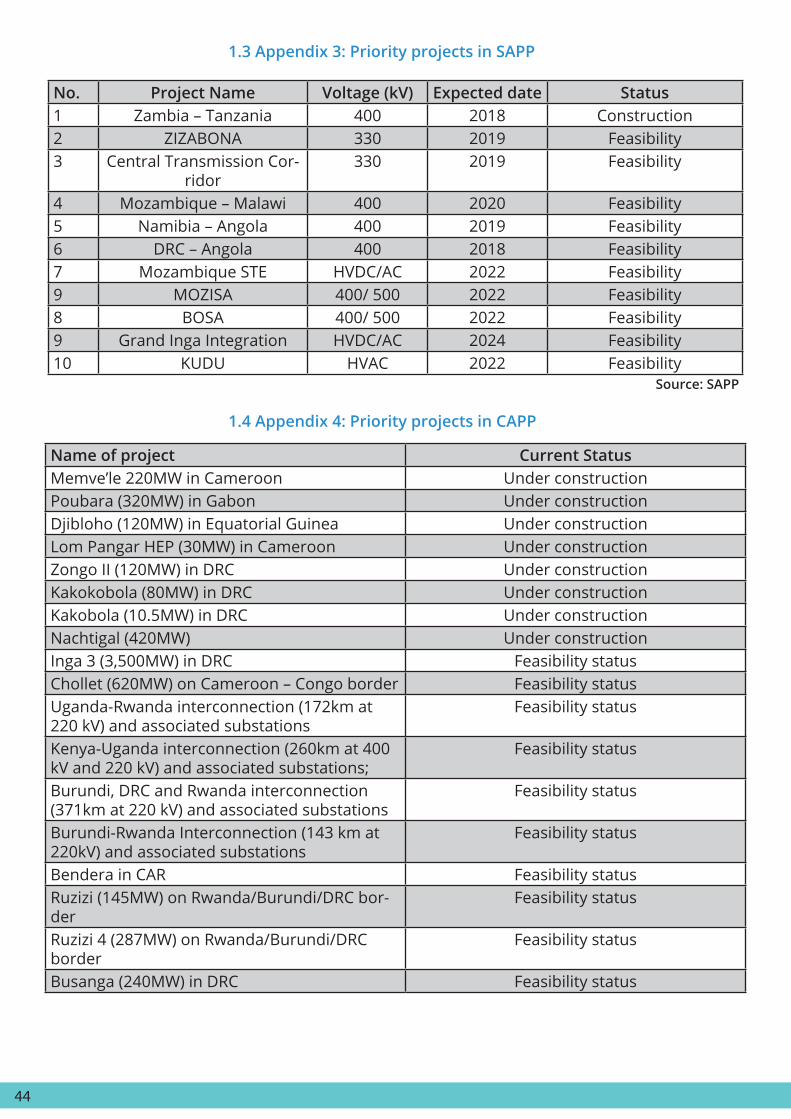
44
Name of project Current Status Memve’le 220MW in Cameroon Under constructionPoubara (320MW) in Gabon Under constructionDjibloho (120MW) in Equatorial Guinea Under constructionLom Pangar HEP (30MW) in Cameroon Under constructionZongo II (120MW) in DRC Under constructionKakokobola (80MW) in DRC Under constructionKakobola (10.5MW) in DRC Under constructionNachtigal (420MW) Under constructionInga 3 (3,500MW) in DRC Feasibility statusChollet (620MW) on Cameroon – Congo border Feasibility statusUganda-Rwanda interconnection (172km at 220 kV) and associated substations
Feasibility status
Kenya-Uganda interconnection (260km at 400 kV and 220 kV) and associated substations;
Feasibility status
Burundi, DRC and Rwanda interconnection (371km at 220 kV) and associated substations
Feasibility status
Burundi-Rwanda Interconnection (143 km at 220kV) and associated substations
Feasibility status
Bendera in CAR Feasibility statusRuzizi (145MW) on Rwanda/Burundi/DRC bor-der
Feasibility status
Ruzizi 4 (287MW) on Rwanda/Burundi/DRC border
Feasibility status
Busanga (240MW) in DRC Feasibility status
No. Project Name Voltage (kV) Expected date Status1 Zambia – Tanzania 400 2018 Construction2 ZIZABONA 330 2019 Feasibility 3 Central Transmission Cor-
ridor330 2019 Feasibility
4 Mozambique – Malawi 400 2020 Feasibility 5 Namibia – Angola 400 2019 Feasibility6 DRC – Angola 400 2018 Feasibility7 Mozambique STE HVDC/AC 2022 Feasibility9 MOZISA 400/ 500 2022 Feasibility8 BOSA 400/ 500 2022 Feasibility9 Grand Inga Integration HVDC/AC 2024 Feasibility10 KUDU HVAC 2022 Feasibility
1.3 Appendix 3: Priority projects in SAPP
1.4 Appendix 4: Priority projects in CAPP
Source: SAPP
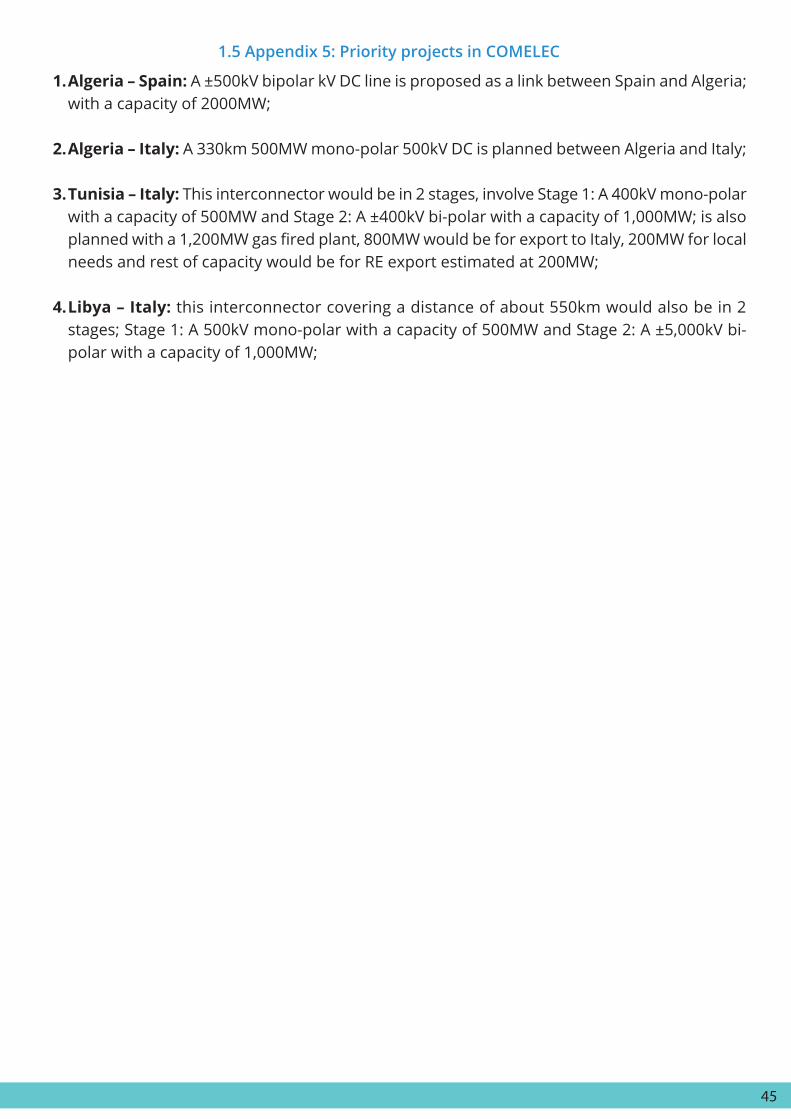
45
1.5 Appendix 5: Priority projects in COMELEC
1. Algeria – Spain: A ±500kV bipolar kV DC line is proposed as a link between Spain and Algeria; with a capacity of 2000MW;
2. Algeria – Italy: A 330km 500MW mono-polar 500kV DC is planned between Algeria and Italy;
3. Tunisia – Italy: This interconnector would be in 2 stages, involve Stage 1: A 400kV mono-polar with a capacity of 500MW and Stage 2: A ±400kV bi-polar with a capacity of 1,000MW; is also planned with a 1,200MW gas fired plant, 800MW would be for export to Italy, 200MW for local needs and rest of capacity would be for RE export estimated at 200MW;
4. Libya – Italy: this interconnector covering a distance of about 550km would also be in 2 stages; Stage 1: A 500kV mono-polar with a capacity of 500MW and Stage 2: A ±5,000kV bi-polar with a capacity of 1,000MW;

46
2. References1. EAPP, Presentation to the EAC Power Working Group Meeting, 2016;2. EAPP, EAPP Power Master Plan, December 20143. ICA, Regional Power Status in African Power Pools Report, November 2011;4. Deloitte, The Roadmap to a fully integrated and operational Eastern Africa Power Pool, 20155. COMELEC, The African Experiences in institutional reforms and in independent producers of
Electricity, 20036. UNECA, The Renewable Energy Sector in North Africa, Current situation and Prospects, 2012;7. Musiliu O. Oseni and Michael Pollitt, Institutional arrangements for the promotion of regional
integration of electricity markets, EPRG Working Paper 1408, University of Cambridge, 2014;8. World Bank database: http://data.worldbank.org; accessed in November 2016;9. AFREC database: http://afrec-energy.org/En/bds.html; accessed in November 2016 10. IEA Website: http://www.iea.org/newsroom/news/2015/november/world-energy-
outlook-2015.html; accessed in November 201611. Ki S, Towards a viable and robust energy market in the ECOWAS region, WAPP, 2016;12. WAPP, Strategic Plan 2016 – 2019; 13. IRENA, Africa Power Sector, Planning and prospects for renewable energy, 2015;14. Chikova A; Overview of the SAPP, SAPP, 201615. SAPP, SAPP Annual Report, 2016;16. SAPP, SAPP Annual Report, 2009;17. UNECA, The Renewable Energy Sector in North Africa, Current situation and Prospects, 2012;18. M. Benini, et al; Electricity interconnection projects between North Africa and Europe –
challenges and opportunities, 2010;19. Castellino et al, The growth potential of the sub-Saharan electricity sector, McKinsey & Co,
201520. OECD/IEA, Boosting the Power Sector in sub-Saharan Africa – China’s involvement, 201621. J. Gutman, et al; Financing African Infrastructure – can the World deliver, Brookings, 201522. C. Kambanda, Unlocking regional energy infrastructure development through market
integration, Capital Markets Africa, 2016;23. The Economist, Africa’s population - Can it survive such speedy growth, August 2014;24. GEIDCO, Africa Interconnection, 2016.25. EAPP, Short to Medium Term Roadmap for Eastern African Power Systems Integration, 201626. UN data base: http://data.un.org/Data.aspx?d=EDATA&f=cmID%3AEC; accessed in November
2016;27. 2008 Population datasheet: http://www.prb.org/pdf08/08WPDS_Eng.pdf accessed 201628. 2010 Population Datasheet: http://www.prb.org/pdf10/10wpds_eng.pdf; accessed in
November 201629. 2015 Population data Sheet : http://www.prb.org/pdf15/2015-world-population-data-sheet_
eng.pdf ; accessed in November 201630. 2013 Population data sheet 2013: http://www.prb.org/pdf13/2013-population-data-sheet_
eng.pdf ; accessed in November 2016;31. IED, Document de Stratégie de Poli que Énergé que Régionale du Pool Energé que de
l’Afrique Centrale, 2015 32. http://www.worldenergyoutlook.org/resources/energydevelopment/
energyaccessdatabase/; accessed 201633. IEA database: http://www.worldenergyoutlook.org/resources/energydevelopment/
energyaccessdatabase/; accessed November 2016

47
34. ITU http://www.itu.int/en/ITU-D/Statistics/Pages/stat/default.aspx ; accessed in November 2016;
35. Turok I, Linking growing African Economies and Mushrooming Cities” HSRC, 2016


