37
Updates on Global Harmonization of Bioanalytical Guidance/Guidelines Dr. Fabio Garofolo Vice President Bioanalytical Services Algorithme Pharma, Laval (Montreal), Canada

Updates on Global Harmonization of Bioanalytical
Guidance/Guidelines
Dr. Fabio GarofoloVice President Bioanalytical Services
Algorithme Pharma, Laval (Montreal), Canada

Source of Information• The 6th Workshop on Recent Issues in Bioanalysis (6th
WRIB) – “Where Regulators and the Industry Convene” hosted in San Antonio, Texas, USA on March 26 – 29, 2012.
• Over 400 professionals representing multiple regulatory agencies, pharmaceutical industries and CROs participated a two-day open forum for discussing, sharing perspectives, and providing potential solutions on the most recent issues in the bioanalytical field.
• One of the major focuses of the 6th WRIB was the updates from multiple regulatory agency representatives on the status of their bioanalytical guidance/guidelines and related regulations
Global Harmonization of Bioanalytical Guidance
• The global harmonization of bioanalytical guidance was at the forefront of the 2010 edition of the WRIB, where the initiative to create the Global Bioanalysis Consortium (GBC) was put in place
• Several publications were issued on the necessity of harmonization in a global context in 2010.
• Savoie N, Garofolo F, van Amsterdam P, et al. 2010 White Paper on Recent Issues in Regulated Bioanalysis and Global Harmonization of Bioanalytical Guidance. Bioanalysis2(12), 1945-1960 (2010).
• van Amsterdam P, Arnold M, Bansal S et al. Global Bioanalysis Consortium – Working towards a functional globally acceptable and harmonized guideline on bioanalyticalmethod validation. Bioanalysis 2(11), 1801-1803 (2010).
• Timmerman P, Lowes S, Fast DM et al. Request for Global Harmonization of the Guidance for Bioanalytical Method Validation and Sample Analysis. Bioanalysis 2(4), 683-683 (2010).
• Bansal S, Arnold M, Garofolo F. International harmonization of bioanalytical guidance. Bioanalysis 2(4), 685-687 (2010).
• van Amsterdam P, Lausecker B, Luedtke S et al. Towards harmonized regulations for bioanalysis: moving forward! Bioanalysis 2(4), 689-691 (2010).

Global Harmonization of Bioanalytical Guidance
• The 2012 WRIB section entitled “Year of the New Guidance/Guidelines in Bioanalysis” was, therefore, a good opportunity, after two years efforts made by the industry and the regulatory agencies, to revisit and evaluate the progress of the harmonization process. • ANVISA (Brazil)• MHLW (Japan)• TPD (Canada)• EMA (Europe)• SFDA (China)• FDA (US)

Brazil ANVISA• Resolution RDC 899 on BMV (2003) was reviewed.• The new ANVISA draft guidance was published for public
consultation during the summer of 2011 (06/30-08/29)• Minimum requirement• Chromatographic method should be the first choice
• Many aspects of the draft ANVISA guidance are similar to those of the EMA
• ISR was not mentioned in the draft guidance as ANVISA believes that too many primary questions about reproducibility in BE trials still remain unanswered.
Impact for LM by LBA• ANVISA BMV Guidance should be applied to LBA if possible• International well established recommendations can be used
for LBA

Japan MHLW• Following the 1st Asia Pacific Bioanalytical Conference (1st
APBC) Shanghai Jan. 2011, the Japan BioanalysisForum (JBF) was inaugurated in early 2011.
• JBF is participating in the MHLW BMV Study Group to draft the Japanese guidelines for BMV.
• 1st draft guideline about chromatographic small molecule analysis is expected to be published in the first half of 2012
• It will not be significantly different from the FDA and EMA guidance/guidelines.
Impact for LM by LBA• A draft guideline on large molecules LBA is scheduled to be
issued towards the end of the year.

Canada TPD• Upcoming new guidance: “Conduct and Analysis of
Comparative Bioavailability Studies” • One of the major changes in this new guidance consists in
the adoption of the EMA guideline on BMV; • The Canadian authorities did not want to create an
additional guidance for bioanalytical laboratories to follow. • TPD shared its interpretation of some requirements found
in the EMA guideline, and reiterated that the guideline is not the law; alternate means may adequately meets what is being asked for.
• Common sense and good science should always prevail. Impact for LM by LBA• Canada follows EMA

China SFDA• Present guideline: China Pharmacopoeia 2010 Simplified
guidelines (4 pages) - Essential requirements for bioanalytical methods
• Draft version for the Guidance on Bioanalysis in China Pharmacopoeia, 2015 Edition was published in Drug Evaluation Research 第 34 卷 第 6 期 2011 年 12 月
• Similar to the new EMA guideline. • The draft guidance is presently under discussion in China.
Impact for LM by LBA• LBA are not discussed in the draft

EU-EMA• Guideline came into effect Feb. 2012• Clarifications on textual interpretation
• Terms such as ‘should be performed’, ‘must be demonstrated’ as clear (or ‘hard’) criteria,
• whereas wording like ‘it is recommended/advised’, ‘may be used’ represent open (or ‘soft’) criteria.
• Clear criteria are quite easy to incorporate into laboratory SOPs
• Open criteria require an adequate documentation on the procedures and criteria to use, thus having a more substantial impact on SOPs.• Open door to the new FDA Guidance

EU-EMA Impact for LM by LBA• Comparatively to the draft EMA Guideline, the requirements
specific to LBA were considerably expanded in the final version, where this topic appears in section 7 with several sub-sections.
• GCC Recommendations No. 15)reference standards, 16)matrix effect 17)matrix selection, 18)parallelism, 19)stability and 20)reagents
• Under discussion within GCC: matrix effect for hemolysis, hyperlipidemia and excipients and the GLP conduct of validations.• Boterman M., Doig M., Breda M. et al.- ”Recommendations on the
interpretation of the new EMA Guideline on BMV by Global CRO Council for Bioanalysis (GCC)”. Bioanalysis 4(6), 651-660 (2012).

US-FDA• Draft guidance expected Summer 2012 • Although a new draft of the FDA guidance on BMV is not
published yet, there is evidence from the presentations given during the 6th WRIB that the voice of the bioanalyticalindustry, through active groups such as the GBC and the GCC, is well heard by regulatory bodies and is influencing them towards an international consensus.
• Most issues are very similar to EMA document: Based on White Papers
• Additional Areas - New Issues Impact for LM by LBA• LBAs and Biomarkers will be discussed

Conclusions• The key outcome of the 6th WRIB was the noticeable clear
effort from major regulatory agencies to align their respective bioanalytical guidance/guidelines.
• This effort represents a concrete main step forward in the achievement of bioanalytical global harmonization by having
“Multiple but Harmonized BioanalyticalGuidance/Guidelines”
• Agencies’ tangible progress in global harmonization is an important achievement for the whole industry to facilitate global submissions of studies.
• In parallel, GBC will continue the effort to create one unified consensus document that can be presented to the different health authorities in the future

AcknowledgementsDeSilva B., Garofolo F., Rocci M. et al. – “ 2012 White Paper on Recent
Issues in Bioanalysis and Regulatory Agencies’ Alignment towards Multiple Harmonized Bioanalytical Guidance/Guidelines” - Bioanalysisin press (Sept. 2012)
Brazil-ANVISA• Joao Tavares Neto (Head of Bioequivalence from General Office of Drugs)Canada-TPD• Eric Ormsby (Manager, Office of Science)China-SFDA• Jin Ju Li (Director, Office of GLP and GCP Accreditation) • Dafang Zhong (Director, Shanghai Institute of Materia Medica, China)EU-EMA• Jan Welink (Senior Pharmacokinetic Assessor, MEB, The Netherlands)• Olivier Le Blaye (Inspector, AFSSAPS, France) Japan-MHLW• Toshinari Mitsuoka (Senior Analyst, Evaluation and Licensing Division)US-FDA• Brian Booth (Deputy Director, Office of Clinical Pharmacology)• Sam Haidar (Chief, Bioequivalence Investigations Office of Compliance)

Impact of Hemolysis on Drug Stability
Dr. Fabio Garofolo
Vice President, Bioanalytical Services
Algorithme Pharma, Laval (Montreal), Canada

Introduction
• Hemolyzed plasma samples may have to be analyzed during the course of pre-clinical and clinical studies.
• The effect of hemolysis on bioanalytical methods accuracy & precision has been already discussed in literature.
• In general, simple modifications to the bioanalytical method usually resolve the effect of hemolysis:• Extraction and/or Chromatography

Introduction
• However, when the effect of hemolysis impacts drug stability, the solution can be more complicated:
• Processed Reconstituted Stability (PRS) of morphine extracted from hemolyzed plasma
• Impact evaluation of the heme group due to hemolyzed plasma on the stability certains compounds

The Issue
• During morphine matrix effect evaluation, a lower peakarea response (15% lower) was observed for morphineand its deuterated internal standard for the hemolysedplasma samples when compared to non-hemolysedplasma
• When re-injected after a PRS of 16 hours, the differencein peak area response was more significative (50%lower) when comparing the extracted hemolysed sampleto extracted plasma.
• However, the peak area ratio was accurate for bothexperiments (Matrix effect & PRS).
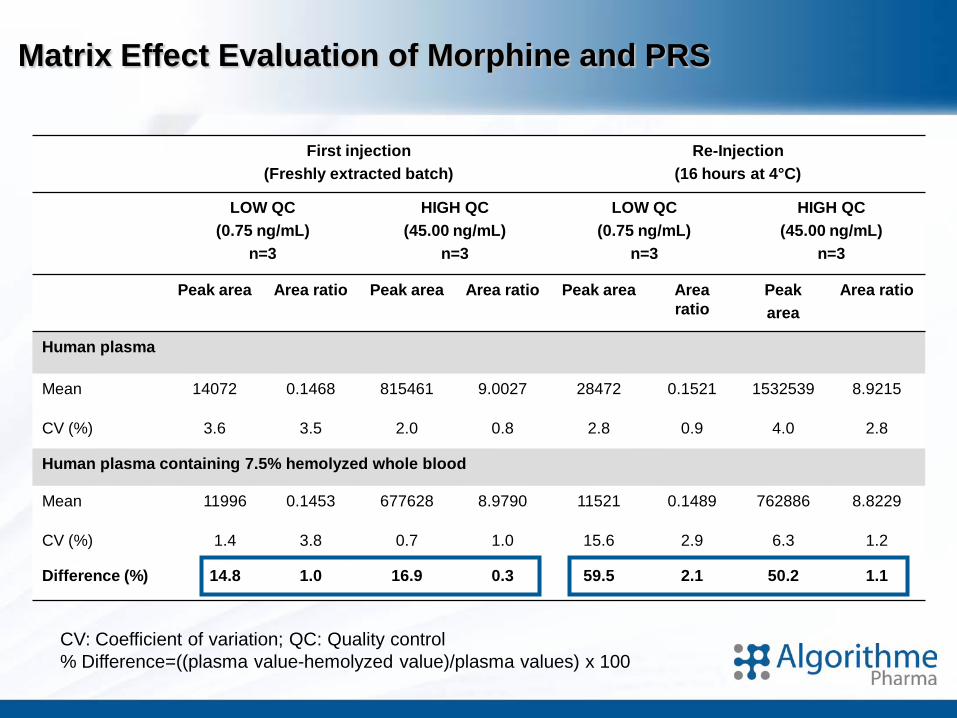
Matrix Effect Evaluation of Morphine and PRS
First injection (Freshly extracted batch)
Re-Injection(16 hours at 4°C)
LOW QC (0.75 ng/mL)
n=3
HIGH QC(45.00 ng/mL)
n=3
LOW QC (0.75 ng/mL)
n=3
HIGH QC (45.00 ng/mL)
n=3
Peak area Area ratio Peak area Area ratio Peak area Area ratio
Peak area
Area ratio
Human plasma
Mean 14072 0.1468 815461 9.0027 28472 0.1521 1532539 8.9215
CV (%) 3.6 3.5 2.0 0.8 2.8 0.9 4.0 2.8
Human plasma containing 7.5% hemolyzed whole blood
Mean 11996 0.1453 677628 8.9790 11521 0.1489 762886 8.8229
CV (%) 1.4 3.8 0.7 1.0 15.6 2.9 6.3 1.2
Difference (%) 14.8 1.0 16.9 0.3 59.5 2.1 50.2 1.1
CV: Coefficient of variation; QC: Quality control% Difference=((plasma value-hemolyzed value)/plasma values) x 100

• Is it a matrix effect / ion suppression?
• Post-column infusion profile performed with freshlyextracted hemolyzed blank samples revealed that no ionsuppression cause the decrease of analyte and ISresponse.
• Possible appearance over time of a suppressor in thereconstitution solution was evaluated following 50 hoursof storage.
• The ionization profile of the extracted blank plasma andblank hemolyzed plasma sample were similar andshowed no suppression.
Matrix Effect Evaluation of Morphine

A Control plasma
B Hemolyzed plasma
0.5 1.0 1.5 2.0 2.5 3.0 3.5Time, min
0.0
5000.0
1.0e4
1.5e4
2.0e4
2.5e4
3.0e4
3.5e4
4.0e4
4.5e44.8e4
0.5 1.0 1.5 2.0 2.5 3.0 3.5Time, min
0.0
5000.0
1.0e4
1.5e4
2.0e4
2.5e4
3.0e4
3.5e4
4.0e44.3e4
Matrix Effect Evaluation of Morphine
Elution zone
Elution zone

Initial Investigation
• Ionization suppression hypothesis was eliminated
• PRS issue of morphine occurring only in extracted hemolyzedsamples was considered.
• Human plasma samples prepared at different levels of hemolysis(0%,1%, 2% and 5%)
• Since the reconstitution solution could promote degradation, twodifferent solutions were evaluated.• MeOH / Water• MeOH / 20mM ammonium bicarbonate pH 10
• To confirm the degradation trend in the hemolyzed sample,extracted blank and hemolyzed blank plasma samples werereconstituted with a pure solution of morphine prepared in bothreconstitution solutions and injected over time.

% Degradation in peak area
Reconstitution 1MeOH/H2O solution
Reconstitution 2MeOH/High pH Buffer solution
Time(Hours)
% Hemolysis
0% 1% 2% 5% 0% 1% 2% 5%
0 0.0 0.0 0.0 0.0 0.0 0.0 0.0 0.0
5 -0.3 -1.1 -2.0 -3.6 -4.1 -15.6 -11.0 -10.8
10 4.4 -4.0 -3.8 -2.7 -5.0 -13.0 -16.2 -19.3
15 -5.8 -0.7 -4.3 -6.5 -7.0 -28.2 -32.6 -36.5
20 -8.8 -11.4 -6.7 -7.5 -12.0 -39.4 -41.1 -51.3
25 -6.8 -12.9 -8.5 -7.0 -13.6 -54.4 -69.9 -73.0
30 -4.9 -13.7 -14.0 -16.5 -13.7 -60.7 -67.8 -81.0
35 -4.9 -13.7 -14.0 -16.5 -17.1 -72.6 -92.7 -93.9
40 -15.0 -12.4 -15.2 -15.1 -18.4 -85.5 -100.0 -99.7
PRS of Morphine in MeOH/Water or MeOH/High pH Buffer Solutions
• Hemolyzed samples reconstituted with the high pH solution showed a loss of more than 50% of the original peak area of morphine within the 25h
• Hemolysed samples reconstituted with the MeOH/water mixture remained stable.

0
20
40
60
80
100
120
0 5 10 15 20 25 30 35 40 45
Time (Hours)
Perc
enta
ge o
f mor
phin
e (%
)
0% Hemolysed
1% Hemolysed
2% Hemolysed
5% Hemolysed
Morphine PRS at Different Hemolysis % Extracted Blank Reconstituted with a Pure Morphine Solution
0.0
20.0
40.0
60.0
80.0
100.0
120.0
0 5 10 15 20 25 30 35 40 45
Time (hours)
Perc
enta
ge o
f mor
phin
e (%
)
0% Hemolysed
1% Hemolysed
2%Hemolysed
5% Hemolysed
A) MeOH/20 mM Ammonium Carbonate Solution
B) MeOH/Water Solution
•The morphine peak response drastically decreased in hemolysedsamples in the high pH reconstitution solution over time
• In the MeOH/water mixture, the peak area response was constant regardless of the hemolysis %

Further Investigation: LTS & F/T
• QCs prepared in 0% and 2% hemolyzed plasma• LTS: QC stored for 20 days at -20°C• F/T: QC sumitted to 3 Freeze-Thaw cycles• Freshly prepared QCs in both matrices (0% & 2%).
• QCs were reconstituted• MeOH/water or• MeOH/High pH buffer solution

0
20
40
60
80
100
120
0 5 10 15 20 25 30 35 40 45 50
Time (Hours)
Perc
enta
ge o
f Mor
phin
e
Comparison
Long-Term of 20 days at -20°C3 Freeze-Thaw cycles
0
20
40
60
80
100
120
0 5 10 15 20 25 30 35 40 45 50
Time (Hours)
Perc
entag
e of M
orph
ine
Comparison
Long-Term of 20 days at -20°C3 Freeze-Thaw cycles
0
20
40
60
80
100
120
0 5 10 15 20 25 30 35 40 45 50
Time (Hours)
Perc
entag
e of M
orph
ine Comparison
Long-Term of 20 days at -20°C3 Freeze-Thaw cycles
Further Investigation: LTS & F/T↓ Morphine PRS in 2% hemolyzed
plasma reconstituted in MeOH/Water ↓ Morphine PRS in 0% hemolyzedplasma reconstituted in
MeOH/High pH buffer solution
← Morphine PRS in 2% hemolyzedplasma reconstituted in
MeOH/High pH buffer solution

Hypothesis• During plasma generation, hemolysis may occur and produce the
presence of free hemoglobin and heme in plasma
• Hemoglobin can be converted to methemoglobin. Normally 2% of hemoglobin is methemoglobin. However, this % can increase in presence of oxidants. Iron in the heme group methemoglobin is in the Fe3+ (ferric) state, rather than in the Fe2+ (ferrous) of normal hemoglobin
• When iron is the ferric (Fe3+) state can react phenols to form a colored complex.
• Hypothesis: “Presence of methemoglobin in hemolyzedplasma can produce the degradation of compounds containing phenol groups”

Impact evaluation of Hemoglobin & Methemoglobin presence on PRS
• Blank plasma samples were extracted• 7.5% Hemolysed human plasma • 0% Hemolyzed human plasma • 0% Hemolyzed human plasma spiked with 1µM Hemoglobin • 0% Hemolyzed human plasma spiked with 2 µM of Hemin
• Extracted plasma blanks were reconstituted with a pure solution of• Morphine, raloxifene (phenol group)• Codeine (methoxy group) • Etodolac, ketoprofen (Carboxylic acids )
• Test compounds dissolved in a mixture of • MeOH/ammonium formate pH 3 or• MeOH/Phosphate buffer pH 7.4 or• MeOH/Ammonium bicarbonate pH 10
Heme containing a ferric iron ion with a
chloride ligand

PRS of morphine in different pH buffer
0.0
20.0
40.0
60.0
80.0
100.0
120.0
0 10 20 30 40 50 60 70
Time (hours)
% o
f m
orp
hin
e
0.0
20.0
40.0
60.0
80.0
100.0
120.0
0 10 20 30 40 50 60 70
Time (hours)
% o
f mor
phin
e
0.0
20.0
40.0
60.0
80.0
100.0
120.0
0 10 20 30 40 50 60 70
Time (hours)
% o
f mor
phin
e
PRS of morphine in Ammonium formate pH 3.0/MeOH 80:20% v/v.
PRS of morphine in phosphate buffer pH 7.4/MeOH 80:20% v/v.
PRS of morphine in ammonium carbonate pH 10.0/MeOH 80:20% v/v.
HO
O
NHHO
H
Structure of morphine
Negatively charged at high pH

PRS Raloxifene in different pH buffer
SHO
OH
O ON
Structure of raloxifene
Negatively charged at high pH
0.020.040.060.080.0
100.0120.0140.0160.0
0 10 20 30 40 50 60 70
Time (hours)
% o
f ra
loxi
fen
e
0.0
20.0
40.0
60.0
80.0
100.0
120.0
140.0
160.0
0 10 20 30 40 50 60 70
Time (hours)
% o
f ral
oxife
ne
0.0
20.0
40.0
60.0
80.0
100.0
120.0
140.0
160.0
0 10 20 30 40 50 60 70
Time (hours)
% o
f ral
oxife
ne
PRS of raloxifene in Ammonium formatepH 3.0/MeOH 80:20% v/v.
PRS of raloxifene in phosphate buffer pH 7.4/MeOH 80:20% v/v.
PRS of raloxifene in ammonium carbonate pH 10.0/MeOH 80:20% v/v.

PRS of Codeine in different pH buffer
O
O
NHHO
H
Structure of codeine
Same structure of morphine but the phenol is methylated
0.020.040.060.080.0
100.0120.0
0 10 20 30 40 50 60 70
Time (hours)
% o
f co
dei
ne
0.0
20.0
40.0
60.0
80.0
100.0
120.0
0 10 20 30 40 50 60 70
Time (hours)
% o
f cod
eine
0.0
20.0
40.0
60.0
80.0
100.0
120.0
0 10 20 30 40 50 60 70
Time (hours)
% o
f cod
eine
PRS of codeine Ammonium formate pH 3.0/MeOH 80:20% v/v.
PRS of codeine in phosphate buffer pH 7.4/MeOH 80:20% v/v.
PRS of codeine in ammonium carbonate pH 10.0/MeOH80:20% v/v.

PRS of etodolac in different pH buffer
HN
O
OH
O
Structure of etodolac
0.0
20.0
40.0
60.0
80.0
100.0
120.0
0 10 20 30 40 50 60 70
Time (hours)
% o
f eto
dola
c
0.0
20.0
40.0
60.0
80.0
100.0
120.0
0 10 20 30 40 50 60 70
Time (hours)
% o
f et
od
ola
c
0.0
20.0
40.0
60.0
80.0
100.0
120.0
0 10 20 30 40 50 60 70
Time (hours)
% o
f et
od
ola
c
PRS of etodolac in Ammonium formate pH 3.0/MeOH 80:20% v/v.
PRS of etodolac in phosphate buffer pH 7.4/MeOH 80:20% v/v.
PRS of etodolac in ammonium carbonate pH 10.0/MeOH80:20% v/v.

PRS of ketoprofen in different pH buffer
O
HO O
Structure of ketoprofen
0.020.040.060.080.0
100.0120.0140.0160.0
0 10 20 30 40 50 60 70
Time (hours)
% o
f ket
opro
fen
0.020.040.060.080.0
100.0120.0140.0160.0180.0
0 10 20 30 40 50 60 70
Time (hours)
% o
f ket
opro
fen
0.020.040.060.080.0
100.0120.0140.0160.0
0 10 20 30 40 50 60 70
Time (hours)
% o
f ket
opro
fen
PRS of ketoprofen in Ammonium formate pH 3.0/MeOH80:20% v/v.
PRS of ketoprofen in phosphate buffer pH 7.4:MeOH 80:20% v/v.
PRS of ketoprofen in ammonium carbonate pH 10.0/MeOH80:20% v/v.

Results• These results suggest that the phenol group needs
to be negatively charged to be affected by thepresence of hemolytic components
• Codeine, which is similar to morphine but with thehydroxy group methylated, was not affected byhemolysis.• No degradation or codeine for any of the conditions
tested.
• Furthermore, the compounds with a carboxylic acidfunctional groups (ketoprofen and etodolac) were notaffected by the presence of hemolysis or its componentsat any of the pH tested.

HO
O
NHHO
H
morphineMw. 285.14
OHO
N
HOHO
O
N
OH
pseudomorphineMw. 568.66
Final investigation• MS analysis performed on plasma fortified with hemin,
reconstituted with morphine (MRN) in MeOH/High pH buffer after 50hours, showed a mass of 570 m/z, which corresponded topseudomorphine (PEN), a dimer of morphine.
• The formation of pseudomorphine can be directly attributed to thepresence of the hemin.

Pseudomorphine formation in extracted sample reconstituted with morphine in MeOH/High pH buffer
0.0
20.0
40.0
60.0
80.0
100.0
0 9 18 27 36 44 53 58 64
Time (hours)
% o
f MRN
0.000
0.100
0.200
0.300
0.400
0.500
PEN/
MRN
ratio
0.0
20.0
40.0
60.0
80.0
100.0
0 9 18 27 36 44 53 58 64
Time (hours)
% o
f MRN
0.000
0.100
0.200
0.300
0.400
0.500
PEN/
MRN
ratio
0.0
20.0
40.0
60.0
80.0
100.0
0 9 18 27 36 44 53 58 64
Time (hours)
% o
f MRN
0.000
0.100
0.200
0.300
0.400
0.500
PEN/
MRN
ratio
0.0
20.0
40.0
60.0
80.0
100.0
0 9 18 27 36 44 53 58 64
Time (hours)
% o
f MRN
0.000
0.100
0.200
0.300
0.400
0.500
PEN/
MRN
ratio
PEN formation against MRN in reconstituted extracted 0% hemolyzedplasma
PEN formation against MRN in reconstituted extracted plasma fortified with 1µM hemoglobin .
PEN formation against MRN in reconsituted extracted 7.5% hemolysedplasma.
PEN formation against MRN in reconstituted extracted plasma fortified with 2µM hemin .

Conclusions
• In the present work, we have clearly demonstrated that sample hemolysis can impact the stability of pharmaceuticals compounds.
• Therefore, to ensure the integrity of hemolyzed incurred samples, the evaluation of the stability of the analyte in this particular matrix must be investigated.
• The post-extract stability of phenolic compounds can be pro-actively overcome by having a reconstitution solution at a pH below the pKa of the functional group.
The potential impact of hemolysis on drug stability should be evaluated and resolved at an early stage of the method
development to avoid the generation of inaccurate data during incurred sample analysis.

Acknowledgements• A very special thank to Eugénie-Raphaëlle Bérubé for preparing
this presentation and performing the experimental part.
• And to the rest of Method Development group at Algorithme Pharma
Milton Furtado; Jean-Nicholas Mess; Josée Michon; France Landry; Catherine Dicaire; Annik Bergeron; Daniel Villeneuve; Cynthia Coté; Melanie Bergeron; Mathieu Lahaie; Nikolay Youhnovski; Sylvain Latour; James Jean; Louis-Philippe Morin and Richard Lavallée
for their stimulating discussions and for their helpful comments, criticisms and suggestions.
“Impact of sample hemolysis on drug stability in regulated bioanalysis”Eugénie-Raphaëlle Bérubé, Marie-Pierre Taillon, Milton Furtado, Fabio Garofolo
Bioanalysis, Sep 2011, Vol. 3, No. 18, Pages 2097-2105.


