Page 1
Upgrade and Performance Evaluation of REPS Facility
Scott James Mokrzycki
Renewable Energy and Power System facility
School of Engineering and Information Technology
Murdoch University
November 2015
A thesis submitted for the fulfilment of the double degree of Engineering and
Commerce
Page 2
ii
Declaration
The following dissertation is based on the author’s own research and findings. The research
and work performed throughout the report relied on others of whom acknowledgment is
given.
Page 3
Acknowledgements
I would like to thank my supervisors Dr Martina Calais and Dr Jonathan Whale for their
continuous time, patients and guidance in my completion of this thesis. Without their help
this paper would not be possible.
I would like to thank Daniel Jones from Pure Engineering with allowing me to document the
maintenance of the Fortis Wind Turbine on campus.
I would also like to thank Simon Glenister for his assistance in the physical aspects of
connecting the SOMA dump load, his skills were necessary and much appreciated in this
aspect of my project.
Page 4
iv
Abstract
Murdoch University’s Renewable Energy Power Systems (REPS) Facility is designed to give
students a practical understanding of how a stand-alone power system operates. The facility
allows students and faculty to monitor, adjust and observe a range of system components in
the energy generation process.
The facility is designed to manage the power generation of two wind turbines with the
option of isolation through a switch located on the main wall of the facility. The Soma 1kW
wind turbine has been erected and placed on top of the previous Ginlong WT tower and
requires integration into the facility. This involved the current WB inverter to be checked for
compatibility as well as its existing parameters to be changed to allow for the new turbine
to be compatible.
The SOMA turbine’s controller and dump load location inside the facility needed to be
connected (Fig 3). The housing for the controller remained in its position on the main wall of
the facility whilst the dump load was removed from the controller and secured inside the
previous Ginlong dump load housing on the outside wall of the building. The separation of
the dump resistor was needed for it posed a safety concern in its previous location. The
controller and dump load were then connected via 2.5mm diameter wires to the main wall
and turbine.
The Fortis Passaat turbine located to the West of the SOMA required various wind data for
the creation of a power curve. The Wind Monitoring tower (WMT) located north of the
turbine was recording data on the system however was not logging information over the
Page 5
v
required intervals needed to perform an adequate test which adhered to International
Standards. The LabVIEW system that monitored the wind data was modified and adjusted to
allow the data to be recorded to the needed specification to perform the test.
This report delves into the work required in integrating a new turbine into an existing
system and the steps taken in the upgrade of the existing system. The system now allows for
monitoring data to be collected in a user friendly table based on ten minute averages. A risk
assessment document was compiled suggesting the possible improvements to the current
maintenance of the wind turbines. The changes made to the system and investigation into
the integration of a new turbine are shown in detail throughout this paper.
Page 7
vii
Contents Introduction ....................................................................................................................... 2
Statement of the Problem........................................................................................... 2
Aim of the research work ...................................................................................................... 3
Research Objectives and Methodologies .................................................................... 3
Outline of Thesis .......................................................................................................... 5
Renewable Energy Power System Evaluation and Condition .................................................. 7
Background ........................................................................................................................... 7
An Overview of Hybrid Renewable Energy Systems ............................................................. 7
AC- Coupled Hybrid Energy Systems ................................................................................. 8
Renewable Energy Power System Facility Murdoch University Campus.................. 10
Integration of SOMA 1KW Turbine into the System ............................................................... 14
Introduction ......................................................................................................................... 14
Literature Review ................................................................................................................ 14
SOMA Components and Current System ............................................................................. 15
Turbine Characteristics .................................................................................................... 15
SOMA Controller and Dump Load ....................................................................................... 18
Activities and Changes performed ....................................................................................... 19
Windy Boy Inverter Proposed Changes ............................................................................... 21
Discussion............................................................................................................................. 22
Wiring Diagram Changes .......................................................................................................... 24
Page 8
viii
Fortis Passaat 1.4KW Turbine Evaluation & Wind Monitoring Tower Analysis ...................... 25
Background .......................................................................................................................... 25
Maintenance Procedure and Documentation ..................................................................... 28
Fortis Passaat Turbine Maintenance and Inspection .......................................................... 29
Fortis Passaat Maintenance & Inspection Report Improvements ................................... 29
Risk Assessment ....................................................................................................................... 41
Wind Monitoring Tower .......................................................................................................... 45
Measurement Devices and System Literature Review ........................................................ 46
Previous Work Performed ................................................................................................... 48
Wind Data assessment for Soma. ........................................................................................ 51
Logging and Monitoring Changes ............................................................................................ 52
Measurement Sampling and Data collection ...................................................................... 52
Recording and Monitoring Intervals .................................................................................... 53
.LabVIEW Changes Incorporating Data Collection Design- System Set Up ......................... 54
Fortis Passaat Testing Procedure ............................................................................................. 56
Test Design ........................................................................................................................... 56
Discussion............................................................................................................................. 57
References ............................................................................................................................... 58
Appendix A ............................................................................................................................... 59
Appendix B ............................................................................................................................... 59
Page 9
ix
Appendix C ............................................................................................................................... 60
Appendix D ............................................................................................................................... 69
Page 10
x
Figure 1-Hybrid RAPS System .................................................................................................... 8
Figure 2- REPS System .............................................................................................................. 11
Figure 3-Soma Controller ......................................................................................................... 12
Figure 4-SMA Sunny Webbox .................................................................................................. 12
Figure 5- Furling Turbine .......................................................................................................... 16
Figure 6-Soma Wind Turbine ................................................................................................... 18
Figure 7- REPS Main wall.......................................................................................................... 19
Figure 8- Controller Connections ............................................................................................. 19
Figure 9-Bracket Made to Hold Dump Resistor ....................................................................... 20
Figure 10- Bracket Bolted onto Facility Wall ........................................................................... 20
Figure 11- Protection Housing for Resistor .............................................................................. 21
Figure 12-Wiring to Controller Box .......................................................................................... 21
Figure 13-Dump Load Changes ................................................................................................ 25
Figure 14- Wiring Connection .................................................................................................. 25
Figure 15- FP 1.4KW Wind Turbine .......................................................................................... 26
Figure 16- FP Slip Rings ............................................................................................................ 27
Figure 17- Blade Check ............................................................................................................. 28
Figure 18- FP Turbine Upright position .................................................................................... 31
Figure 19- Attached Pullies and cable to gin pole ................................................................... 31
Figure 20-Apply grease to the cable ........................................................................................ 32
Figure 21-Support Cable .......................................................................................................... 32
Figure 22-Side guys and Gin pole side stray wires always have slack ..................................... 34
Figure 23-Pully Connection ...................................................................................................... 34
Figure 24-4WD Rope ................................................................................................................ 35
Page 11
xi
Figure 25-Lowered on Bracket ................................................................................................. 36
Figure 26- Turbine Inspection .................................................................................................. 36
Figure 27-Blade Inspection ...................................................................................................... 37
Figure 28- Tail Fin ..................................................................................................................... 38
Figure 29- Opening to check slip rings ..................................................................................... 39
Figure 30- slip rings .................................................................................................................. 39
Figure 31 .................................................................................................................................. 40
Figure 32 .................................................................................................................................. 40
Figure 33-Wind Tower ............................................................................................................. 46
Figure 34- Anemometer ........................................................................................................... 47
Figure 35- Wind Vane .............................................................................................................. 48
Figure 36-Environmental Reading Window ............................................................................. 50
Figure 37-System Display Window .......................................................................................... 51
Figure 38- Voltage and Current Waveform from Fortis .......................................................... 51
Figure 39- Ten Minute Average of Wind Speed ....................................................................... 55
Figure 40- Frequency Addition ................................................................................................ 55
Figure 41-FP System Validation Layout ................................................................................... 57
Page 14
2
1. Introduction
1.1 Statement of the Problem
The world currently is being confronted with various issues in the traditional methods for
power generation. Fossils fuels, environmental factors and high costs are allowing for
attention to alternative non-conventional energy generation sources. Renewable energy
resources such as wind, solar, micro-hydro, ocean wave and fuel cells are becoming the
focus of a viable alternative for power generation. One scheme that is being used is the
hybrid Remote Area Power Supply (RAPS) system. RAPS systems are usually used because
the remote area is off the grid. This system usually involves off grid applications depending
on the available technologies. Generally a hybrid RAPS system is equipped with a primary
energy source (wind or solar), secondary energy source (diesel generator) and an auxiliary
components (battery storage, flywheel, dump load)[1].
The selection of specific components for use in different stand-alone situations is crucial in
creating the most efficient system. The primary energy sources usually wind and solar
devices need to be selected carefully with power rating and capacity factors imperative in
constructing an appropriate system. In stand-alone systems the usual wind energy source
selected is a variable speed wind turbine generator. Their ability to provide adequate
frequency and voltage regulation is more appealing when compared to constant speed
generators. This suggest a Permanent Magnet Synchronous Generator (PMSG) as the logical
choice of wind energy sources.
Page 15
3
1.2 Aim of the research work
The purpose of this research is performed to show how stand-alone power systems operate
and perform under specific conditions relating to the individual environment. The inclusion
of a new primary energy source and the related tasks involved are provided to give a more
realistic point of view regarding these systems. The performance and improvement of the
Murdoch Renewable Energy Power Systems Facility (REPS) is investigated for improvement
in the future for students and faculty involved in the stand-alone system. This paper
ultimately shows a real world example of an stand-alone hybrid power system and
documents in detail the specific steps involved when trying to alter the existing system.
The turbines investigated consist of the SOMA 1KW and the Fortis Passaat (FP) 1.4kw wind
turbine. Only one turbine is connected at any one time (via individual protection boxes with
rectifiers and dump load controllers). The work performed in this thesis concerns the
integration of the SOMA turbine into the system and the issues involved in the process. The
FP turbine is presented highlighting the changes and system parameters affected in the test
procedure. The two turbines and specific components like the wind monitoring tower
(WMT), windy boy inverter and LabVIEW program are investigated in detail in this stand-
alone application.
1.3 Research Objectives and Methodologies
The main objective of the thesis is to perform and evaluate the current REPS facility on the
Murdoch Campus with particular attention on the performance of the current wind
turbines. To achieve this it is necessary to present and discuss the results of measurements
from specific components of the REPS system concerning the wind system, energy produced
Page 16
4
from the FP turbine, inverter system changes, LabVIEW control system interface and
monitoring system. The following are presented as the main research objectives:
1. Murdoch Renewable Power System Evaluation and Condition
This objective focuses on describing the current system and evaluating its
performance for off-grid applications involving a learning perspective. The
literature will focus on hybrid systems described in studies such as PV/Wind only
and PV/Wind/Battery both experimentally and numerically. This selection
process involved for analysis of an AC hybrid power source at a site is dependent
upon various factors from IEC Standards, component operations, data collection
and control system connections.
2. Integration of the SOMA 1KW Wind Turbine into the REPS facility.
This objective is focused on the new SOMA wind turbine being connected to the
current system. This objective presents a guideline to the steps taken in the
integration process of a 1KW wind turbine in a hybrid stand-alone system. This is
achieved by documenting the process taken in this procedure.
3. Fortis Passaat Upkeep and Wind Monitoring System.
This objective focused on the Fortis Passaat turbine upkeep and maintenance as
Page 17
5
well as the wind data being shown through the LabVIEW program. This involved
documenting the current system and implementing various changes in regards to
the data recording program which will help in the data collection process for
future testing. This was done by averaging the data into timed averages following
information by the International Electrical Commission (IEC) and Australian
testing standards. The FP maintenance and inspection was documented and
photographed allowing for a risk assessment to be compiled suggesting
improvements to the current process.
1.4 Outline of Thesis
This thesis is comprised of 3 sections. In each section a background, literature review,
results/discussion and conclusion are presented. This structure allows the relevant
objectives to be described in detail in which the reader can understand the experimental
process involved.
Page 19
7
2 Renewable Energy Power System Evaluation and Condition
2.1 Background
The REPS has been previously evaluated for its performance in different weather conditions.
The last performance evaluation was conducted in Semester 2 2014 as a research project[2]
which outlined the systems efficiency and capabilities in regards to the different renewable
energy sources and devices.
In the previous project some of the tasks performed included overview of equipment, FP
turbine power curve and monitoring system breakdown. This evaluation is expanded and
compared to in this paper in specific regards to upkeep of the facility on the system.
2.2 An Overview of Hybrid Renewable Energy Systems
With the increase in the global population and energy consumption the use of RAPS are
becoming more common. These systems are used for energy production in areas that have
no access to the grid or for long-term economic gain. The typical hybrid RAPS system
consists of various energy generation sources for example wind, solar, hydro, battery and
diesel.
When designing a suitable RAPS system the energy sources and components chosen are
dependant on the specific location investigated. An example of typical hybrid stand-alone
system dominated by a wind power source is shown in Figure 1. It consists of a wind
turbine, battery bank or energy storage system, inverter, dump load, diesel generator, AC
bus and relevant load.
Page 20
8
Figure 1-Hybrid RAPS System
2.2.1AC- Coupled Hybrid Energy Systems
An AC-coupled hybrid system consists of different energy sources which are
integrated through their own power electronic circuits to an AC bus. This
arrangement requires coupling inductors between the power electronic interfacing
circuits and power frequency AC bus to achieve the desired power flow
management[3].
With the presence of DC energy sources and loads combined with the long existing
AC power systems, an interest on hybrid ac/dc systems is growing. One of the
advantages of having a hybrid system is the control strategy and power management
scheme allowing for efficient operation in stand-alone and grid-connected operation
modes. In ac-coupled systems the control strategy and power production schemes is
Dump load located before inverter
Page 21
9
mostly concerned with power generation/consumption balance and the ac bus
voltage/frequency control, especially concerning stand- alone systems[4].
In stand-alone systems power management and control schemes focus is on the ac
bus voltage and frequency control. The droop method is the most common method
used in this system where the voltage and frequency vary with the output real and
reactive power of a generator.
Page 22
10
2.3 Renewable Energy Power System Facility Murdoch University Campus
The Renewable Energy Power System Training Facility (REPS) is a single phase hybrid
generator system consisting of a battery bank, inverter, photovoltaic panals, wind and diesel
generator system with programmable loads. This facility is located in the Renewable
Outdoor Testing Area (ROTA) of Murdoch University. The REPS facility is a stand-alone
hybrid system which uses different renewable energy technologies to generate power for
different components within the housing of the facility e.g. Refrigerator. This system is
incorporated into the (RAPS) systems within the ROTA test area. The facilities main function
is to provide students an opportunity to work on a real off-grid power system as well as the
opportunity to simulate different conditions for a wide range of testing conditions in a safe
environment.
Page 23
11
Figure 2- REPS System
The main control wall of the facility shown in Figure 2 shows the system easily visiable and
accessible. The wall holds the following components[5]:
A SMA ‘Sunny Boy’ SB1100 inverter which is used to convert the DC power given
from the PV array to AC power. This inverter has a PV start up voltage of 180V with
an input current and power of 10A and 1210W respectively
A SMA ‘Windy Boy’ SB1700 inverter for the wind component. Only one turbine is
connected at any one time (via individual protection boxes with rectifiers and dump
Page 24
12
load controllers).This inverter has a maximum input DC voltage of 400V and current
of 12.6A
The Sunny Island 5048 inverter.This inverter has an input power of 12.8kW and an
output power of 7200W at 25 degrees Celsius
SOMA Controller Box
Figure 3-Soma Controller
Data monitoring and logging system consisting of a SMA Sunny Webbox and
Sensorbox
Figure 4-SMA Sunny Webbox
The load bank which is located inside the REPS facility, can apply various ac loads of any
multiples of 5W.
Page 26
14
3 Integration of SOMA 1KW Turbine into the System
3.1 Introduction
The introduction of a new SOMA 1KW wind turbine has been included into the REPS facility.
The integration of the SOMA turbine into the REPS was needed in order to replace the
previous Ginlong WT which had burnt out its generator windings. The integration process
performed documents the process and issues faced when adding a new component to a
stand-alone system. 3.2 Literature Review
3.2 Literature Review
The connection of the Soma system to the grid is motivated by the Murdoch interest in
securing a fully functional wind grid connect system. This procedure involves various steps
and needs to adhere to the IEC 61400-2 standards for grid connection. The Murdoch system
required information to be gathered as to the processes in which the University must take in
completing this task. The system is currently connected to an isolated grid.
A wind turbine to be connected to the grid must comply with the IEC 61400.2 Standards
specifically the requirements in sections 10.7.3.2-10.7.3.3 Appendix (A). This task involves
a detailed analysis of the wind turbines structure, power output, connections, foundation,
load requirements, support structure and installation. The standard also provides a general
safety requirement for the power system. A power performance test of the FP turbine must
also be performed according to the IEC 61400-12-2 requirements before grid connection.
IEC61400-2 standard classifies a small wind turbine (SWIND TURBINE) as having a swept
area of less than 200m2 with a power capacity >50kw. The international standard relevant
Page 27
15
to power performance testing of wind turbines is IEC61400-12-1. Annex H deals specifically
with the power performance testing of SWIND TURBINEs, and states that 1-minute averaged
power and wind speed data are to be logged and binned to form the wind turbine power
performance curve. The wind speed data are measured at a height within ±2.5% of the
turbine hub height and, for grid-connected SWT, the A.C. turbine power data are measured
at the connection to the load after the inverter. For the binning of data, wind speed bins are
created with width 0.5 m s-1, centred on integer multiples of 0.5 m s-1.
3.3 SOMA Components and Current System
The Soma WT is a 2 –bladed, horizontal-axis, furling wind turbine. It has wind at a rated
speed of 10m/s at a rated instantaneous power of 1000 W and a peak output of 1200 W
according to the manufacturer’s power curve [6]
Turbine Characteristics
Generator
The WT for the Soma system is a brushless, directly-driven, alternating current generator
which utilises a rotating permanent magnet field [6]. Permanent magnet machines are self-
excited operating at a high power factor and efficiency. The use of permanent magnet
excitation requires the use of a full-scale power converter to adjust the voltage and
frequency of generation to the transmission. The permanent magnet synchronous
generator (PMSG) has a wound stator with the rotor having a 14-pole system. The use of
Permanent Magnets (PM) mean there is no need for slip rings or brushes and the rare earth
Page 28
16
magnets are very high strength generally ferrite. The PM are located on the inside of the
rotating drum.
The SOMA turbine is directly driven which generates ‘wild’ AC. It produces a variable voltage
and frequency [7]. This allows for the generator to have no gearbox. The SOMA turbine also
has a protection/ control which involves passive furling. This is an over-speeding protection
method used to avoid the generator burning out. Furling involves offsetting the pressure on
the rotor from the axis of rotation of the nacelle creating movement which reduces the
angle between rotor axis and tail fin axis. This reduces the projected area of the rotor and
limits power [7].
Figure 5- Furling Turbine
Blade Characteristics
The blade is made up of a combination of high tensile glass fibres and marine grade resins
resulting in a modulus. The blade is designed in one piece and is placed over the rotor hub.
Page 29
17
Table 1- SOMA Blade Characteristics
Tilt-up Feathering Method
This method limits the rotor speeds in excess of 15m/s. This is another over-speed
protection method to reduce blade wear and generator loads [6]. When the wind speeds
exceed the rated wind speed (15m/s) power output can be regulated by ‘feathering the
blades in order to control the power output [8]. The SOMA turbine has its rotor above the
pivot point of the stator which causes the wind pressure to tilt-up. The stronger winds cause
the rotor to tilt back further, with speed is controlled by a stainless steel hydraulic
dampener reducing gyrational action [6].
Tower
The Soma 2-bladed turbine is positioned on top a galvanised pipe winch-tilt tower at 19.5m
which was used as an adaption from the previous Ginlong tower. The tower sits on a
concrete foundation and can pivot at the base allowing it to be lowered. The tower tilts
down to the ground using a pulley winch mechanism which can be attached to the gin pole
for leverage.
Page 30
18
Figure 6-Soma Wind Turbine
SOMA Controller and Dump Load
The Soma WT controller is located on the wall of the REPS facility shown in Figure 7.
Page 31
19
Figure 7- REPS Main wall
Figure 8- Controller Connections
The Soma WT controller is essentially a voltage regulator, the purpose of which is to provide
protection to the inverter from over-voltage from the WT. The SOMA controller is located
on the REPS facility on the main wall. The controller has a dump load attached to the top of
the main casing. The dump load contains a resistor measured at 50Ω and is set to operate at
300V. The dump loads purpose is to prevent the power output from the WIND TURBINE
rising too high while the inverter attempts synchronisation with the grid or if grid
connection is lost. This results in the dump load becoming very hot due to the resistor
absorption of voltage. The dump load needed to be removed from inside the facility where
heat from the resistor could affect the electrical components and people.
Activities and Changes performed
The following changes to the SOMA system were performed and documented.
Controller and dump load re-Location
The dump load was removed from the controller housing and the resistor was attached to a
specially designed bracket. This bracket allowed the dump load resistor to be secured to the
Page 32
20
facility wall while remaining within the protection casing. The casing for the dump load was
re-used from the previous Ginlong turbine and required holes to be screwed into the metal
base allowing the bracket to be firmly secure.
Figure 9-Bracket Made to Hold Dump Resistor
Figure 10- Bracket Bolted onto Facility Wall
Page 33
21
Figure 11- Protection Housing for Resistor
The dump load was then wired through a junction box and into the main wall of the REPS
facility. The wires were then connected to the controller box using 2.5mm wires.
Figure 12-Wiring to Controller Box
Windy Boy Inverter Proposed Changes
In order to change the parameters of the inverter to the new turbine the inverter must be
changed to OFF-Grid via the default operation. The next step involves programming the
power curve depending on the DC input voltage. The following parameters need to be
changed on the PC with the windy boy setup tool:
1. Vpv—Start
2. UdcWind Start
3. Wind a0... Wind a3
4. Pmax
5. P-Wind –Ramp
6. KP-Wind-Reg
7. KI-Wind-REg
8. T-Stop
The manufacturers programming parameter for safe operation with the SOMA 1000 turbine
are shown in Table 2.
Page 34
22
Soma Inverter Parameters Manufacturers Values
UdcWind Start 150V
Tstop 120seconds
V pv Start 150V
Wind a0 6576.971
Wind a1 -107.054
Wind a2 530.22 E-3
Wind a3 -732.68 E-6
Table 2- Windy Boy 1700 Settings for SOMA Turbine
Discussion
The integration of the SOMA WIND TURBINE encountered many issues relating to
positioning the controller/dump load and compliance of the WB inverter in accordance to
Clean Energy Council CEC standards. These issues halted the project temporarily until a
resolution can be finalised.
The controller positioning inside the facility shown in Figure (7) was deemed inadequate.
The main safety issue with its location is the dump resistors above the controller. They get
very hot and pose a fire risk. The manufacturer recommends it should be located at least 1
metre below any horizontal surface such as a ceiling or cabinet top. Sideways clearance to
left and right should be 300mm from any other object. It should not be fastened to a
flammable surface such as wood. The enclosure should be adequately ventilated to allow
Page 35
23
the heat from the dump resistors to escape. Where a separate dump resistor box is
supplied, the same installation requirements apply to it[6].
The WB 1700 inverter was found to not be approved by the CEC as of the 31st of July 2015.
The CEC presented its list of approved inverters on the 11th of July and the WB 1700 inverter
not was found to be included. This caused a halt to project while a solution was finalised
regarding this issue.
The solution that was decided was to grid-connect the SOMA 1KW turbine by raising its
connectivity. We met with Gary Higgins the Murdoch University facilities manager in charge
of electrical supply demand. He responded by having no issues in the grid-connect of this
turbine. This solution is now in the process of being finalised with relevant personal.
The ABB Power One Inverter was selected as a replacement being on the CEC approved list
and it has up to 400VAC from the turbine, Rectified 400VDC, as well as the 240VAC from the
grid.
This prompted a grid-connection plan to be investigated in regards to the REPS building. The
new connection allowed for:
1. Grid-connection of the SOMA 1KW WIND TURBINE for teaching and research
purposes
2. Grid power for computer/data acquisition infrastructure and engineering lab
experiments (air conditioner power)
The inverter replacement is yet to be finalised and will not be purchased until the current
project has been completed and the new system agreed upon by the appropriate personal.
Page 36
24
The current system RAPS system is connected to an isolated grid on the grounds of Murdoch
University.
Wiring Diagram Changes
The wiring diagrams that were previously available needed to be changed in order to
incorporate the relevant changes to the system that had been implemented. The previous
wiring diagram was located in the Engineering Shared folder which was on most computers
found in the Engineering areas at Murdoch Campus.
The diagram was then upgraded to incorporate the changes made to the system shown in
Figure 13. The wires that were used to incorporate the dump load were 2.5mm2 in size. This
wiring size was used based on the manufacturer’s maximum diameter recommendations in
the Soma manual.
Page 37
25
Figure 13-Dump Load Changes
Figure 14- Wiring Connection
These new wiring alterations then were uploaded to the SOMA project file located in the
Eng-Shared desktop short cut.
Fortis Passaat 1.4kW Turbine Evaluation & Wind Monitoring Tower Analysis
Wind turbine power curves or simulation programs as well as the sites wind data may be
used to determine the power output from a wind turbine. Different data analysis options
require different types of data. Once the techniques have been selected, the types of wind
data needed and the most convenient form for the data can be determined. If the data uses
are clearly specified, time and expense in the data analysis can be reduced[9].
Background
Fortis Passaat Wind Turbine
Page 38
26
The FP 1.5kW turbine is currently the only wind energy source that is connected in the REPS
facility. The FP is a controlled horizontal axis, furling wind turbine consisting of 3 blades. It is
positioned on top an 18m high tower with a cut-in speed of 2.5m/s. According to the
manufacturers data it has a nominal output power of 1400W at rated wind speed of 16m/s.
Figure 15- FP 1.4KW Wind Turbine
Generator
The FP turbine has a 12-pole brushless permanent magnet synchronous generator. The
PMSG uses a rotating magnetic field around the stator to eliminate the need for brushes. It
operates between 180-775 RPM with a frequency between 0-70Hz.
Page 39
27
Figure 16- FP Slip Rings
Blades
Rotor Blades
Number 3
Diameter 3.12m
Area 7.64m2
Air foil E387
Tip Speed Ratio 6.9
Material Glass-fibre reinforced epoxy
Page 40
28
Table 3
Figure 17- Blade Check
Tower
The tower for the FP is guyed steel tubular at height of 18m.
Maintenance Procedure and Documentation
The manufacturer maintenance report, used in previous inspections, and provided by Fortis
Wind Energy is shown in Appendix (B). After documenting the Daniel Jones maintenance
inspection an alternative report has been designed to help visually show the procedure.
Page 41
29
Fortis Passaat Turbine Maintenance and Inspection
The Fortis Passaat WT maintenance was conducted on the ROTA premises on Thursday the
29th of October at 12.30pm. The inspection was carried out by Daniel Jones from Pure
Engineering.
The maintenance procedure was carried out incorporating an ENG 352 Laboratory where
students were allowed a firsthand look at how a WT is serviced and inspected. Student
involvement in this laboratory/maintenance, although very beneficial, did raise some safety
concerns that will be mentioned later.
The maintenance procedure was documented in detail from start to finish with photos
highlighting the steps and procedure involved, in order to provide input into a risk
assessment of the procedure.
3.3.1Fortis Passaat Maintenance & Inspection Report Improvements
1. Safety Induction and Planning
The safety induction was conducted by Martina Calais and Daniel Jones inside the REPS
facility. Both instructors went over the importance of safety in this laboratory also the
potential risks associated with the lowering of the turbine. Martina then ensured the
students were wearing Personal Protective Equipment (PPE) which included foot protection,
eye protection, head protection and sun protection.
If any students did not have any of the appropriate protection items they were supplied one
for the purpose of the laboratory. A brief background was then given on the relevant
equipment and facilities.
Page 42
30
2. Shutting down the Turbine
Daniel Jones then shut down the turbine by shorting it out at its base therefore not allowing
it to still generate power. This shut down causes a danger when the wind speed is too high
so it is recommended that this is only done during times of low wind speed.
3. Pre-Lowering Checks and Application
The following steps were checked by Daniel Jones and deemed acceptable if a green tick is
indicated:
Page 43
31
Firstly observe the turbine in operation and take note of any unfamiliar noises and
vibrations
Figure 18- FP Turbine Upright position
All four sheaves/pins greased and both grip clips fitted. Sheaves must turn freely;
Figure 19- Attached Pullies and cable to gin pole
Page 44
32
Figure 20-Apply grease to the cable
Tower hinge pin has grip clips(s) fitted;
Check conditions of tow-up cable and associated rigging. Coat with corrosion
inhibitor if necessary;
Check tow-up cable is correctly routed through sheaves and safely attached to
foundation block;
Check all turnbuckles have safety splint pins or locknuts fitted;
Check condition of gin-pole stay wires, and;
Figure 21-Support Cable
Page 45
33
Ensure gin pole stay wires are correctly fitted and do have visible slack
Check condition of guy wires. Coat guys with corrosion inhibitor if necessary;
Check condition of tower galvanizing. Touch-up any corrosion with zinc rich plant;
Check condition of earthing cables/stakes- if installed, and; check tower fasteners
(lock nuts tight) and condition. (Note if any bolts have come loose).
Check electrical connections in tower base
Check electrical connections in tower upper terminal box for condition and tightness;
Check that tower cable suspension strap is in good condition and supporting cable
Page 46
34
Figure 22-Side guys and Gin pole side stray wires always have slack
Note: All side guys and gin pole side stray wires always have some slack while
lowering the tower.
Figure 23-Pully Connection
The procedure shown in figures (19-23) displays the shutdown and system check before the
lowering of the tower. This procedure shows Daniel Jones shortening the generator,
attaching pullies and cable to gin pole, attaching pulley to guy wire in dropping direction,
Page 47
35
attaching cable to the 4 wheel drive, releasing fasteners restraining the tower erect
position, loosening gin pole and slowly driving 4WD forward).
Daniel then made sure the 4WD pulley is connected correctly. After all the pre-checks and
cables are fastened the turbine is then ready for lowering.
4. Lowering of turbine
The 4WD is then reversed pulling the turbine while the connection and pulley rope was held
by a student.
Figure 24-4WD Rope
The turbine is lowered slowly onto a metal bracket, which the turbine is rested upon using
thick area of the pole. Pictures shown in figure (25) clearly indicate how the turbine is rested
on the metal bracket.
Page 48
36
Figure 25-Lowered on Bracket
5. Checking of blades and repairs
After turbine is lowered and secured on the bracket the following checks are performed.
Figure 26- Turbine Inspection
Check overall condition of blades, in particular the mounting area and leading edge;
Page 49
37
Figure 27-Blade Inspection
Check blade bolt/nut torque;
Check condition of leading edge tape and replace if necessary;
Check condition of blade fasteners, and;
Nose cone installed.
Remove cover and inspect slip rings and brushes, clean if necessary;
6. Bolt check of MAINFRAME/TAILBOOM/TAILFIN and Turbine
The bolts are then all checked to see if they are corroded or damaged and need
replacement. The bolts are all tightened and checked to make sure the threading is not
damaged which allows for secure bolt connection.
Check tail boom dampers for condition and operation;
Check for overall condition of tail boom, and;
Check for overall condition of tail fin.
Page 50
38
Figure 28- Tail Fin
7. Checking & Servicing of the Slip rings and Brushes
Page 51
39
Figure 29- Opening to check slip rings
Figure 30- slip rings
Remove any build-up of brush dust under brushes;
Check electrical connections for condition and tightness;
Check operation of brushes;
Page 52
40
Check for overall condition of mainframe/generator;
Figure 31
Figure 32
checking the junction box for any problems
8. Raising the tower
9. Reconnection check of the tower
Guy tensions correct and tower straight and vertical;
Chain or gin pole tie-bar fitted correctly below gin pole and shackle tight and wired;
Turnbuckles wired together to prevent unscrewing and locknuts tightened on
adjustment threads, and;
Remove tow-up cable, sheaves, gin pole strays in a dry place if possible.
Operational tests
Page 53
41
Wind turbine spins smoothly both off-line and under load (if enough wind)
Notes;
Wind strength approximately 2-4m/s. Turbine rotating smoothly;
Blade condition is good, the addition of leading edge tape may be included in the
next service to extend the life of the blades;
All fixings were found to be tight and secure;
Tail boom bushes show a little wear, their condition will be monitored, considerable
life remains, and;
Slip rings in good order, the nuts on the top of the slip ring assembly have been
rubbing on the top inside edge of the enclosure. This is due to wear of the thrust
washer in the yaw bearing assembly. Preventative measures undertaken at the
previous maintenance service have proven sufficient to prevent further wear of the
thrust washer and so further action was not required.
The thimble and wire rope grips for this tower tow up cable are still a missing
component.
Risk Assessment Turbine Maintenance Laboratory
New Ideas to be implemented:
1. During induction students sign a form acknowledging the risks and hazards that
they will be exposed to during this activity.
2. The designated cordoned off areas are more strictly adhered to in regards to
students not crossing the tape barrier.
3. A trained person (not student) is required to lower the tower via the pulley rope
4. If a student/s misses this safety induction, held at the start of the maintenance
work, they will be excluded from participating in the laboratory.
Page 54
42
5. The unit co-ordinator or relevant person expresses via LMS that students who are
not present at the start of the laboratory will be excluded from participating in the
maintenance laboratory.
6. The area where the turbine is to be lowered needs to be cleared for hazards prior
to commencing the procedure.
7. Dangerous items around the clearance zone need to be noted or eliminated prior
to commencement. This applies to metal parts exposed from near buildings or trip
hazards on the ground around the clearance area.
Table altered from Pure Engineering Safe Work Method Statement[10]
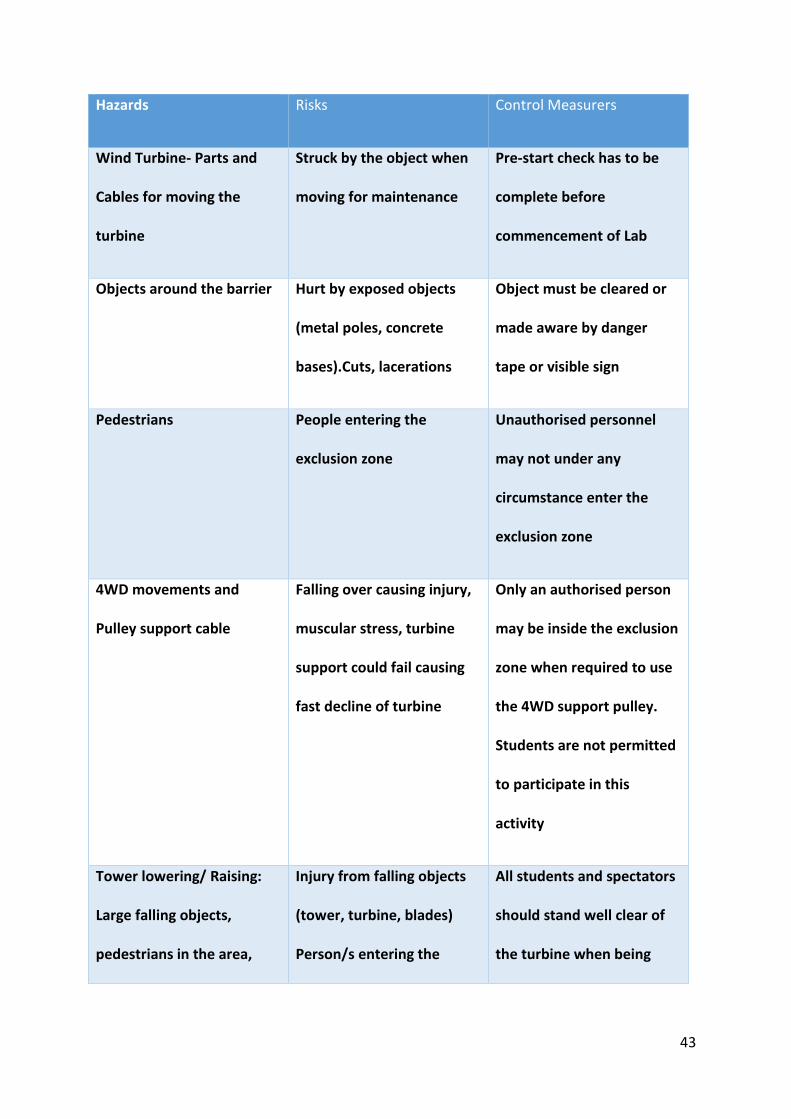
Laboratory Perspective:
Page 55
43
Hazards Risks Control Measurers
Wind Turbine- Parts and
Cables for moving the
turbine
Struck by the object when
moving for maintenance
Pre-start check has to be
complete before
commencement of Lab
Objects around the barrier Hurt by exposed objects
(metal poles, concrete
bases).Cuts, lacerations
Object must be cleared or
made aware by danger
tape or visible sign
Pedestrians People entering the
exclusion zone
Unauthorised personnel
may not under any
circumstance enter the
exclusion zone
4WD movements and
Pulley support cable
Falling over causing injury,
muscular stress, turbine
support could fail causing
fast decline of turbine
Only an authorised person
may be inside the exclusion
zone when required to use
the 4WD support pulley.
Students are not permitted
to participate in this
activity
Tower lowering/ Raising:
Large falling objects,
pedestrians in the area,
Injury from falling objects
(tower, turbine, blades)
Person/s entering the
All students and spectators
should stand well clear of
the turbine when being
Page 56
44
slippery terrain or exposed
objects
exclusion zone while
turbine is being lowered
causing serious injury.
Entanglement from turbine
support cables causing cuts,
bruising or lacerations
lowered with no person
being inside the exclusion
zone. The bracket (Figure 2)
or turbine support shall be
positioned by the
authorised personal before
lowering commences.
Exposed Metal Hazard
Page 57
45
Turbine Bracket
Wind Monitoring Tower
The wind monitoring tower (WMT) is a 30m high tower consisting of sensors and
anemometers with which the wind speed, wind direction and ambient temperature are
monitored. This tower is located within the REPS compound and has sensors positioned at
heights of 3m, 10m, 18m, 24m and 30m.
Page 58
46
Figure 33-Wind Tower
For the selected data sets wind speeds shall be corrected for flow distortion from site
calibration and air pressure shall be corrected if measured at a height other than close to
hub height.
Measurement Devices and System Literature Review
An adequate wind measurement system is needed in order for accurate and reliable data is
recorded for test use. The current wind monitoring system (WMT) is located within the REPS
facility consisting of various sensing devices located at heights 3, 10, 18, 24 and 30m this
allows the determination of wind shear characteristics. These devices include wind direction
sensors, temperature sensors, anemometers and air pressure sensors. The tower is
approximately 30m high with the wind sensor located at 18m which correspond with the 2
wind turbine towers.
Wind measurement systems usually comprise of 3 primary parts [9]:
1. Sensors-measures the wind parameter and produces a signal that is directly related
to the wind characteristic.
2. Signal Conditioning-Converts signal from sensor that can be used in the
recorder/display.
3. Recorders / Displays-provides information in a useable form.
Meteorological Sensors
The WMT displays the information from the following [9]:
Page 59
47
1. anemometers to measure wind speeds;
2. wind vanes to measure wind direction;
When testing the site for its wind resource it requires all four information values. The WMT
has all the values needed for a wind test to take place.
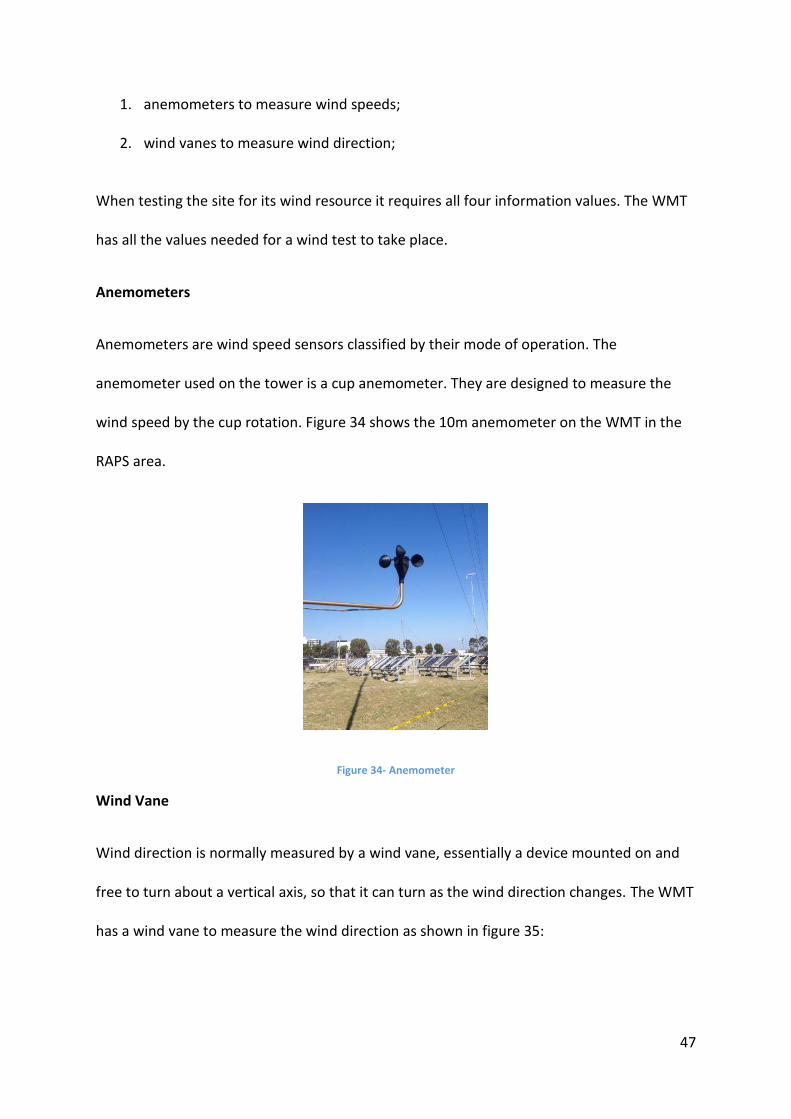
Anemometers
Anemometers are wind speed sensors classified by their mode of operation. The
anemometer used on the tower is a cup anemometer. They are designed to measure the
wind speed by the cup rotation. Figure 34 shows the 10m anemometer on the WMT in the
RAPS area.
Figure 34- Anemometer
Wind Vane
Wind direction is normally measured by a wind vane, essentially a device mounted on and
free to turn about a vertical axis, so that it can turn as the wind direction changes. The WMT
has a wind vane to measure the wind direction as shown in figure 35:
Page 60
48
Figure 35- Wind Vane
The device is mounted on a vertical axis which is free to turn allowing it to point in the
direction from which the wind is coming [11]. During gusty winds, the wind vane may lag
behind the direction as it changes, but the average direction should be correct.
Data Loggers
Generally an electronic device compatible with all sensors. The REPS facility is connected
with remote data transfer. The data is collected by either data logger-initiated action or by
user-initiated action[7].
Previous Work Performed
When starting the project the WMT had sensors that were not working or recording
accurate data. The status of the previous system is shown below:
Sensor Height(m) Status
Pressure 0 Working
Page 61
49
Temperature 3 Working
10 Working
18 Not Working
24 Working
30 Wrong Temperature Displayed
Relative Humidity 30 Not Working
Wind Speed 10 Working
18 Working
24 Working
30 Working
Wind Direction 10 Not Working
18 Connected but not accurate data
24 Connected but not accurate data
30 Working
Table 4
Table 5
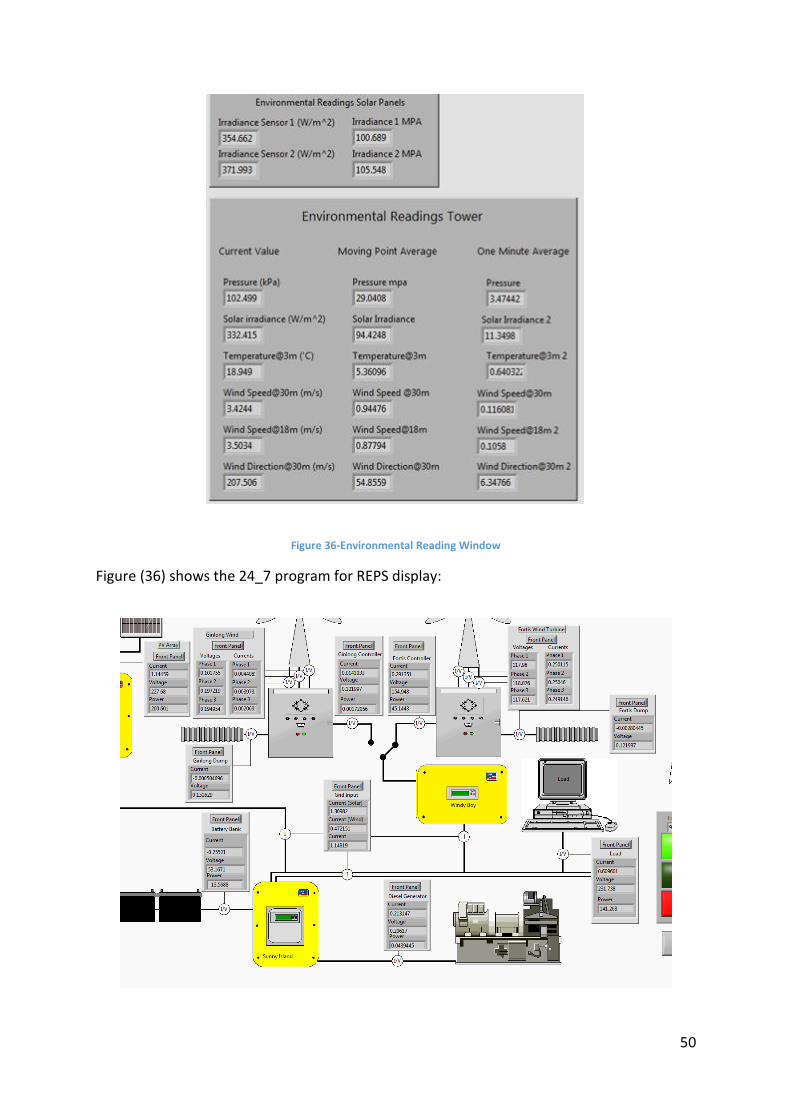
The figure 37 shows the configuration of the REPS system. It represents the points at which
the voltage dividers and current shunts are placed to acquire the reading for the DAQ.
Figure (36) shows the current environmental display of the values calculated from the WMT.
Page 62
50
Figure 36-Environmental Reading Window
Figure (36) shows the 24_7 program for REPS display:
Page 63
51
Figure 37-System Display Window
Figure 38- Voltage and Current Waveform from Fortis
Wind turbine power curves or simulation programs may be used to determine the power
output from a wind turbine. Different data analysis options require different types of data.
Once the techniques have been selected, the types of wind data needed and the most
convenient form for the data can be determined. If the data uses are clearly specified, time
and expense in the data analysis can be reduced [10].
Wind Data assessment
The WMT nearby was used for nearby accurate measurements from 10-30m. The
assessment of errors by compounding errors in wind speed, presumably the impact of wind
speed error on estimate of power output from turbine or the approximate wind speed
distribution using a statistical probability function (Weibull Distribution).
Page 64
52
The general System checks[11] include the iintegrity of data records (does each row have
the requisite number of measurements?) and time sequence (is the data continuous in
time? Are there any missing times/dates?)
Logging and Monitoring Changes
Measurement Sampling and Data collection
The data acquisition system needs to store data sets as follows:
Mean value
Standard Deviation
Maximum value
Minimum value
The recording interval shall be based on 10 minute periods derived from contiguous
measured data.
The maximum sampling interval for all averaged parameters should be set at 1s.The data
then can be logged over the 10 min. If the power measurements are calculated from voltage
and currents the sampling interval needs to be significantly shorter than 1 second.
The data should include ten minute average, standard deviation, maximum and minimum
values per time stamp and recorded the following parameters; power (kW), power factor
(%), rotor speed (rpm),temperature (°C), primary and secondary wind speeds (m/s), turbine
voltage (V), pressure (kPa), dry or wet weather conditions (dry or wet), wind direction (°),
turbines brake condition (on or off), controller (on or off) and current (A).
Page 65
53
Recording and Monitoring Intervals
All parameters should be continuously sampled at the sample interval rate during the
specified recording interval. The sampled data for each measured parameter should be
processed into time-weighted averages.
Average- The average value should be calculated for all parameters on a ten-minute basis,
which is now the international standard period for wind measurement. Except for wind
direction, the average is defined as the mean of all samples. For wind direction, the average
should be a unit vector (resultant) value. Average data are Basic and Optional Parameters
used in reporting wind speed variability, as well as wind speed and direction frequency
distributions.
Standard Deviation- The standard deviation should be determined for both wind speed and
wind direction and is defined as the true population standard deviation (σ) for all one or two
second samples within each averaging interval. The standard deviations of wind speed and
wind direction are indicators of the turbulence level and atmospheric stability. Standard
deviation is also useful in detecting suspect or erroneous data when validating average
values.
Max and Min- Maximum and minimum values should be determined for wind speed and
temperature at least daily. The maximum (minimum) value is defined as the greatest
(lowest) one or two second reading observed within the preferred period. The coincident
direction corresponding to the maximum (minimum) wind speed should also be recorded.
Page 66
54
.LabVIEW Changes Incorporating Data Collection Design- System Set Up
The following changes were updated from the previous program to log the wind data
calculated from the WMT. The new program compiles the wind speed from all heights and,
temperature into 10 minute averages. Figure 39 shows the new environmental and system
display windows.
Page 67
55
Figure 39- Ten Minute Average of Wind Speed
Figure 40- Frequency Addition
In figure (40) shows the frequency was added to the display which allows for more variety of
tests that can be performed.
From the values being recorded into the environmental display a new logging system was
programmed allowing for the 10 minute averages to be inputted into a table. This new
alteration has some constraints such as restriction of access and continuous operation. In its
current state the table of data values can only be accessed and logged from inside the REPS
facility by running the main 24_7, environmental window, front panel display and data
logging LabVIEW programs. The SQL Management server also has to be running and opened
to gain access into the logged results. This server is restricted certain to personal. Refer to
Appendix C for logging into the system steps.
Page 68
56
Fortis Passaat Testing Procedure
The FP testing of power output against wind speed was the test that was to be conducted.
The test did not take place due to time constraints and logging system issues in regards to
data collection.
The logging results that were displayed in a table could not be accessed on my individual
user name. In order to gain access I had to use the ENG 550 student’s user name and
password on the REPS computer to gain access to the logged results. This logging program
was also completed in the last week before this paper was due so could not be completely
explored.
Test Design
The parameters that are needed to accurately test the FP system for validation are the wind
speed, air temperature and power output. The power would also need to be examined in
the dump load. The parameters therefore that need to be examined are output power as a
function of time, power to dump load, power to load and output power of turbine. Figure 40
shows the display of the power parameters on the screen shot.
Page 69
57
Figure 41-FP System Validation Layout
Discussion
This simulation program data validation procedure for the REPS Facility was not conducted
due to the time restrictions held on this project.
Page 70
58
References
1. Mendis, N., Design of Wind Dominated Hybrid Remote Area Power Systems, in Electrical, computer and Telecommunications Engineering. 2012, University of Wollongong: Wollongong. p. 291.
2. Almureeh, M., Renewable Energy Power System Performance Monitoring, in School of Engineering and Energy. 2014, Murdoch University: Perth. p. 85.
3. Haruni, A.M.O., A Stand-Alone Hybrid Power System with Energy Storage, in Bentre of Renewable Energy and Power Systems. 2013, University of Tasmania: Tasmania. p. 157.
4. Li, F.N.a.Y.W., Overview of Power Management Strategies of Hybrid AC/DC Microgrid. IEEE Transsactions on power electronics, 2015. 30(12): p. 18.
5. Calais, M., Small Wind Turbine Maintenence. 2015: Murdoch University. p. 4. 6. SOMA. SOMA 1KW Manual. 2015 26/5/15 [cited 2015 29/3/15]; 1:[Available from:
www.somawindgenerators.com.au. 7. Whale, J., Design of Wind Systems. 2014, Renewable Energy: Murdoch University. p.
27. 8. Ackermann, T., Wind Power in Power Systems, ed. Ackermann. Vol. 2. 2012,
Chichester: John Wiley & Sons. 745. 9. Pryor, T., Wind Measurement Systems. 2014: Murdoch University. 10. Engineering, P., Safe Work Method Statement, in Wind Turbine 1KW- Installation/
Inspection. 2015, Pure Engineering. p. 15. 11. Whale, J. Wind Energy- Wind Measurement Systems. 2014 [cited 2015 26/5/2015];
Lecture Slide].
Page 71
59
Appendix A
IEC 61400.2 Standards – Grid Connection of Wind Turbine
Appendix B
Maintenance / checklist
In principle, FORTIS wind turbines do not require any maintenance at all. On the other hand,
it would be unwise not to check the wind turbine occasionally. FORTIS advises that you
should check the wind turbine at least twice a year. The following points should be checked:
1. Check noises; the noise level should not have increased and should sound normal
2. Check nuts and bolts; they might have worked themselves loose
- 3. Check the bearings and labyrinth seal; there should be no play in the bearings
Page 72
60
4. Check the yaw bearing and the bearings of the tail blade, they must be able to move
smoothly; if they do not, apply some grease to the bearings
- 5. Check the electrical wires that are hanging through the inside of the mast; the tension
must not be too high; this can occur if the wires have been wound too far.
- 6. Check the leading edge of the blades, small damages can be caused by small objects
carried by the wind; such damages will speed up the process of wear and tear and should be
repaired
- 7. Apply grease to the two grease nipples on the generator support chassis with a
grease-gun at least twice a year.
Appendix C
Logging In
Due to security issues in order to log into the server an authorised persons credentials must
be used in the REPS facility.
Page 73
61
1. SQL server management was accessed using the connection using the combined user
name password- eng-icl1,51055
2. Access the C drive then ENG 454 REPS then current LabVIEW code v4. This will bring
up the current LabVIEW programs.
3. Now we run the REPS project and inside this program we need to run the 24_7
program. You will get this display shown below
Page 74
62
4. Run the environmental monitoring and system display panel shown in the figure
below
5. Run the system display VI shown in figure below
Page 76
64
6. Access the data logging while the other programs are still running.
Page 77
65
7. When all programs are running access the SQL server and type in username and
password shown.
Page 78
66
8. Choose the provider highlighted
9.
10. Choose REPS connection
Page 79
67
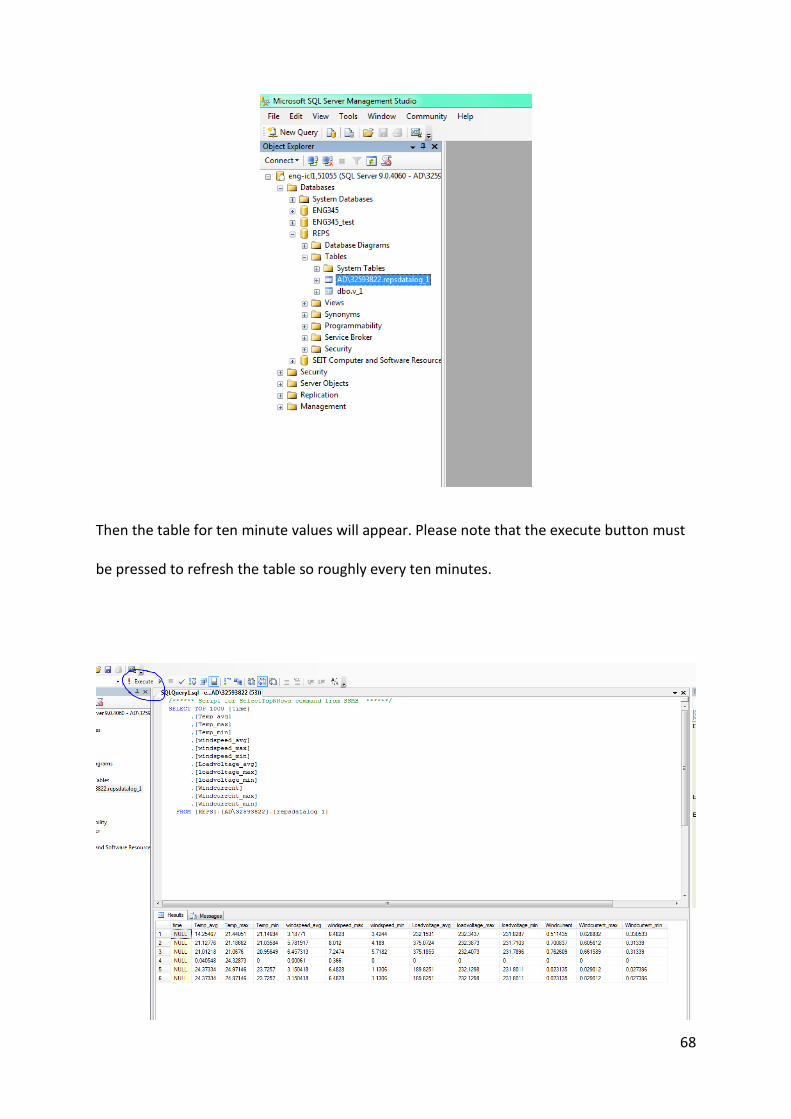
From the selection need to right click and select top 1000 rows
Page 80
68
Then the table for ten minute values will appear. Please note that the execute button must
be pressed to refresh the table so roughly every ten minutes.