1 These items were deferred from FY11 and are not considered to as part of the normal FY12 SOW or its normal funding. Page 1 of 64 Upper Mississippi River Restoration–Environmental Management Program Long Term Resource Monitoring FY2012 Scope of Work Outcome 1 Aquatic Vegetation Component ......................................................................................................... 2 Fisheries Component .......................................................................................................................... 5 Water Quality Component ................................................................................................................ 12 Land Cover/Land Use with GIS Support ............................................................................................ 17 Development of 2010–2011 Land Cover/Land Use GIS Database and Aerial Photo Mosaics .......... 19 Thematic accuracy assessment and validation for the Upper Mississippi River System floodplain from 2010/2011 land cover/land use data 1 ...................................................................................... 22 LiDAR and Bathymetry 1 ..................................................................................................................... 31 Bathymetry Component ................................................................................................................... 32 Outcome 2 Statistical Evaluation ......................................................................................................................... 33 Data Management ............................................................................................................................ 35 Landscape Pattern Research and Application 1 ................................................................................. 37 Development of vital rates to assess the relative health of UMRS mussel resources 1 .................... 39 Continuing existing work on survival of mussels using PIT tagging .................................................. 42 LTRM Staff Contributions to an External Research Framework on Lateral Connectivity for the Upper Mississippi River System ........................................................................................................ 43 Outcome 3 Development of Initial Strategies for LTRM/HREP Integration ........................................................ 44 Outcome 4 Quarterly Activities ........................................................................................................................... 45 LTRM Fact Sheets .............................................................................................................................. 46 A-Team and EMPCC Participation ..................................................................................................... 47 AFS Symposia .................................................................................................................................... 48 Strategies 1 &2 Equipment Refreshment 2012 Allotment 1 1 ..................................................................................... 50 Equipment Refreshment 2012 Allotment 2 ...................................................................................... 51 On-line Tracking Form for Equipment Refreshment ........................................................................ 52 Maintenance of the Water Quality Laboratory Information Management System: Part I 1 ............. 53 LTRM Team Meeting 1 ........................................................................................................................ 54 USACOE Technical Support ............................................................................................................... 55 Geospatial Data Upgrades ................................................................................................................ 59 Maintenance of the Water Quality Laboratory Information Management System: Part II 1 ............ 60 Maintenance and Calibration of Equipment..................................................................................... 61 LTRM FY12 Budget Summary ............................................................................................................ 63 Report Definitions ............................................................................................................................. 64
Transcript
1These items were deferred from FY11 and are not considered to as part of the normal FY12 SOW or its normal funding. Page 1 of 64
Upper Mississippi River Restoration–Environmental Management Program Long Term Resource Monitoring
FY2012 Scope of Work
Outcome 1 Aquatic Vegetation Component ......................................................................................................... 2 Fisheries Component .......................................................................................................................... 5 Water Quality Component ................................................................................................................ 12 Land Cover/Land Use with GIS Support ............................................................................................ 17 Development of 2010–2011 Land Cover/Land Use GIS Database and Aerial Photo Mosaics .......... 19 Thematic accuracy assessment and validation for the Upper Mississippi River System floodplain from 2010/2011 land cover/land use data1 ...................................................................................... 22 LiDAR and Bathymetry1 ..................................................................................................................... 31 Bathymetry Component ................................................................................................................... 32 Outcome 2 Statistical Evaluation ......................................................................................................................... 33 Data Management ............................................................................................................................ 35 Landscape Pattern Research and Application1 ................................................................................. 37 Development of vital rates to assess the relative health of UMRS mussel resources1 .................... 39 Continuing existing work on survival of mussels using PIT tagging .................................................. 42 LTRM Staff Contributions to an External Research Framework on Lateral Connectivity for the Upper Mississippi River System ........................................................................................................ 43 Outcome 3 Development of Initial Strategies for LTRM/HREP Integration ........................................................ 44 Outcome 4 Quarterly Activities ........................................................................................................................... 45 LTRM Fact Sheets .............................................................................................................................. 46 A-Team and EMPCC Participation ..................................................................................................... 47 AFS Symposia .................................................................................................................................... 48 Strategies 1 &2 Equipment Refreshment 2012 Allotment 11..................................................................................... 50 Equipment Refreshment 2012 Allotment 2 ...................................................................................... 51 On-line Tracking Form for Equipment Refreshment ........................................................................ 52 Maintenance of the Water Quality Laboratory Information Management System: Part I1 ............. 53 LTRM Team Meeting1 ........................................................................................................................ 54 USACOE Technical Support ............................................................................................................... 55 Geospatial Data Upgrades ................................................................................................................ 59 Maintenance of the Water Quality Laboratory Information Management System: Part II1 ............ 60 Maintenance and Calibration of Equipment ..................................................................................... 61 LTRM FY12 Budget Summary ............................................................................................................ 63 Report Definitions ............................................................................................................................. 64
1These items were deferred from FY11 and are not considered to as part of the normal FY12 SOW or its normal funding. Page 3 of 64
well as federal agencies such as the US FWS and US EPA. This report will help meet the goals of Strategic Plan Outputs 1.1, 2.2, and inform decisions necessary for Outputs 3.1 and 4.1. 2012A7: Rewriting of aquatic vegetation annual summary statistics computer code 2012A8: Modify code for vegetation graphical browser The Savanna Army Depot, located on the eastern bank of the Mississippi River (Navigation Pool 13), was a 13,062-acre (53 km2) installation. It was opened in 1917 as a proving and testing facility for weapons developed at Rock Island Arsenal. Unfortunately, some unexploded ordinances from the Depot are still being found in that area of the river that is currently being sampled for aquatic vegetation. This is an unacceptable safety hazard for LTRM sampling crews at the Bellevue Field Station. Therefore, the Pool 13 base map of strata showing areas available for the sampling has been adjusted to remove about 58 hectares from potential sampling locations and avoid this safety hazard. This adjustment in sampling strata requires rewriting and recalculating the statistics served on the web for previous years so all years are comparable. This effort will include re-writing of complex statistical computer code and the code that generates displays for the vegetation graphical browser (2012A8). 2012A9: Sampling the impaired reach of the UMR (Pools 2 and 3) for submersed aquatic vegetation using LTRM methods. Submersed aquatic vegetation information will be collected and analyzed from Pools 2 and 3 of the Upper Mississippi River by LTRM staff located at the Lake City field station. Information collected will be distributed to interested LTRM Partners; but specifically to river managers in Minnesota Pollution Control Agency, Minnesota Department of Natural Resources (MDNR) and Wisconsin Department of Natural Resources as summary graphics showing aquatic vegetation frequencies over-time. The data will be used to test a macrophyte index impairment threshold model (Moore et al. 2012) and to monitor whether the new TMDL-related SAV standard for the impaired reach is being met. This work is fully supported by funding from the MDNR and provides an example of leveraging LTRM expertise to provide wider benefits to the Program.
Products and Milestones
Tracking number
Products Staff
Milestones
2012A1 Complete data entry and QA/QC of 2011 data; 1250 observations.
a. Data entry completed and submission of data to USGS
Popp, Fischer, Bierman
30 November 2011
b. Data loaded on level 2 browsers Schlifer 15 December 2011 c. QA/QC scripts run and data corrections sent to Field Stations
Sauer 28 December 2011
d. Field Station QA/QC with corrections to USGS
Popp, Fischer, Bierman
15 January 2012
e. Corrections made and data moved to public Web Browser
Sauer, Schlifer, Caucutt
30 January 2012
2012A2 WEB-based annual Aquatic Vegetation Component Update with 2011 data on Public Web Server.
a. Develop first draft Sauer 30 March 2012 b. Reviews completed Popp, Fischer,
Bierman, Sauer, Yin 15 April 2012
c. Submit final update Sauer 30 June 2012 d. Placement on Web with PDF Sauer, Caucutt 31 July 2012
2012A3 Complete aquatic vegetation sampling for Pools 4, 8, and 13 (Table 1)
Yin, Popp, Fischer, Bierman
31 August 2012
2012A4 Web-based: Creating surface distribution maps for aquatic plant species in Pools 4, 8, and 13; 2011 data
Yin, Rogala, Schlifer 31 July 2012
1These items were deferred from FY11 and are not considered to as part of the normal FY12 SOW or its normal funding. Page 4 of 64
2012A5 Final draft LTRM completion report: FY05-07 data--Analysis and support of aquatic vegetation sampling data in Pools 6, 9, 18, and 19 (2008APE4a)
Yin 30 September 2012
2012A6 Draft LTRM completion report: Thirteen years (1998 – 2011) of aquatic vegetation in Pool 4 of the Upper Mississippi River.
Moore 30 June 2012
2012A7 Rewriting of aquatic vegetation annual summary statistics computer code
Yin 31 August 2012
2012A8 Modify aquatic vegetation graphical browser code Schlifer 30 September 2012 2012A9 Summary graphs: Sampling the impaired reach of the
UMR (Pools 2 and 3) for submersed aquatic vegetation using LTRM methods.
Moore 30 September 2012
On-Going 2009APE1a Draft manuscript: Have the recent increases in
aquatic vegetation in Pools 5 and 8 been the result of water level management drawdowns, HREPs, or natural fluctuations? (2009APE1a)
Yin 28 February 2012
2011A5 Final Draft LTRM Report: Ecological Assessment of High Quality UMRS Floodplain Forests (2007APE12)
Guyon, Battaglia, Chick
30 December 2011
Intended for distribution Completion report: LTRM Aquatic Vegetation Program Review (Heglund; 2007A9) Manuscript: Importance of the Upper Mississippi River Forest Corridor to Neotropical Migratory Birds (Kirsch, 2007APE1) LTRM Report: Ecological Assessment of High Quality UMRS Floodplain Forests (Chick, Guyon, Battaglia; 2007APE12) LTRM Technical Report; Experimental and Comparative Approaches to Determine Factors Supporting or Limiting Submersed Aquatic Vegetation in the Illinois River and its Backwaters (2008APE5, Sass)
Literature Cited Hirst, S. M. 1983. Ecological and institutional bases for long-term monitoring of fish and wildlife
populations. Pages 175–178 in John F. Bell and Toby Atterbury, editors. Renewable Resource Inventories for Monitoring Changes and Trends. Proceedings of an International Conference, August 15–19, 1983, Corvallis, Oregon. College of Forestry, Oregon State University. 737 pp.
Ickes, B. S., and R. W. Burkhardt. 2002. Evaluation and proposed refinement of the sampling design for the Long Term Resource Monitoring Program’s fish component. U.S. Geological Survey, Upper Midwest Environmental Sciences Center, La Crosse, Wisconsin, October 2002. LTRMP 2002-T001. 17 pp. + Appendixes A–E. CD-ROM included. (NTIS PB2003-500042)
McDonald L., T. McDonald, and D. Robertson. 1998. Review of the Denali National Park and Preserve (DENA) Long-Term Ecological Monitoring Program (LTEM). Report to the Alaska Biological Science Center Biological Resources Division, USGS. WEST Technical Report 98–7. 19 pp.
Moore, M., H. Langrehr, and T. Angradi. 2012. A submersed macrophyte index of condition for the Upper Mississippi River. Ecological Indicators 13:196–205.
Strayer, D., Glitzenstein, J. S., Jones, C. G., Kolasoi, J., Likens, G. E., McDonnell, M. J., Parker, G. G. and Pickett, S. T. A. 1986. Longterm ecological studies: an illustrated account of their design, operation, and importance to ecology. Occasional Publication of the Institute of Ecosystem Studies, No.2. Millbrook, New York.
Yin, Y., J. S. Winkelman, and H. A. Langrehr. 2000. Long Term Resource Monitoring Program procedures: Aquatic vegetation monitoring. U.S. Geological Survey, Upper Midwest Environmental Sciences Center, La Crosse, Wisconsin. April 2000. LTRMP 95-P002-7. 8 pp. + Appendixes A–C.
1These items were deferred from FY11 and are not considered to as part of the normal FY12 SOW or its normal funding. Page 5 of 64
Fisheries Component
The objective of the LTRM Fisheries Component is to collect quantitative data on the distribution and abundance of fish species and communities in the UMRS for the purpose of understanding resource status and trends, ecological functions, and response to natural disturbances and anthropogenic activities. Data are collected within six LTRM study reaches in the UMRS (Pools 4, 8, 13, and 26 and Open River Reach on the Upper Mississippi River and La Grange Pool on the Illinois River). Data entry, quality assurance, data summaries, standard analyses, data serving, and report preparation occur under standardized protocols (Gutreuter et al. 1995; Ickes and Burkhardt 2002). (Strategic Plan Outcome 1; Output 1.1, Outcome 2, Output 2.1 and Outcome 4)
Methods Fish sampling will be conducted following the LTRM study plan and standard protocols (Gutreuter et al. 1995), as modified in 2002 (Ickes and Burkhardt 2002). Species abundance, size structure, and community composition and structure will be measured over time. Between 250 and 400 samples will be collected in each study area (Table 1). Sample allocation will be based on a stratified random design, where strata include contiguous backwaters, main channel borders, main channel wingdams, impounded areas, and secondary channel borders. Tailwaters in the impounded reaches and tributary mouths in the Open River will be sampled under a fixed site design. Sampling effort will be allocated independently and equally across 3 sampling periods (June 15–July 31; August 1–September 15; September 16–October 31) to minimize risks of annual data loss during flood periods and to characterize seasonal patterns in abundance and habitat use. Pool-wide estimates of abundance will be derived by pooling data over all strata. Product Descriptions 2012B5: Sturgeon Life History on the Upper Mississippi River Important management topics of sturgeon related to the Upper Mississippi River and beyond include evaluating reproductive ecology, early-life history, and population demographics. We will continue to collaborate with the USACE and Southern Illinois University to evaluate habitat needs and early-life history of young-of-the-year sturgeon. In collaboration with other Missouri Department of Conservation (MDC) biologists we have collected shovelnose sturgeon demographic information throughout the UMR to provide information that will help managers develop regulations to ensure sustainability for both recreational and commercial fisherman. Several manuscripts authored by Open River and Wetlands field station staff have been published using these data in recent years and additional products are in preparation or have been submitted. This framework follows Output 2.1 of the LTRM’s Strategic Plan to provide insights about river structure, and composition, and Outcome 4, to provide enhanced ecological understanding to inform management decisions. 2012B6: Flooding of the New Madrid floodway and Duck Creek Conservation Area During June 2011, catastrophic flooding occurred throughout the Mississippi River floodplain. Because of this, multiple projects ensued to further our understanding of floodplain ecology. Two primary areas of focus were the New Madrid floodway and Duck Creek Conservation Area. The project at Duck Creek CA was to evaluate fish, amphibian, and reptile usage during high water events that restore connectivity to the floodplain and between pools that are usually isolated. A similar but more comprehensive approach was undertaken at the New Madrid Floodway encompassing fish, invertebrates, and water quality characteristics. Several private ponds were flooded during this event allowing Asian Carp to invade these locations so we have collected young-of-year fishes (Asian Carp, Gizzard Shad, and Buffalo
1These items were deferred from FY11 and are not considered to as part of the normal FY12 SOW or its normal funding. Page 6 of 64
spp.) to evaluate their influence on native fishes and plankton. The development of a database with data collected through this effort is on-going and will be available through the Open Rivers and Wetlands Field Station. This framework follows Output 2.2 of the LTRM’s Strategic Plan to provide enhanced knowledge about system process by investigating effects of increased floodplain connectivity. 2012B7: Population characteristics and habitat use of American eel American eels are the only catadromous fish species in North America. A manuscript authored by Open River and Wetlands field station staff evaluating population characteristics and habitat use of American eel throughout the Upper Mississippi River using LTRM data is currently under review in North American Journal of Fisheries Management. In addition, American eel distributional data throughout the state of Missouri have been collected with collaboration from other MDC biologists providing needed information to the USFWS (for potential listing; see September 2011 Federal Register). We will continue to sample at key locations in the Upper Mississippi River to gather information including spawning migration routes and diet of adult American eel. We have removed otoliths from each American eel captured for microchemistry analysis/aging (funded by MDC) and stomachs to determine gut content. Results will be submitted to a peer-reviewed publication and will be the first microchemistry work ever done on Mississippi River eels. Preliminary data suggests that most of the adult eels captured in the Middle Mississippi have never made it up to the Upper Mississippi and that gut content by biomass is overwhelmingly crawfish. This framework follows Output 2.1 of the LTRM’s Strategic Plan to provide insights about river structure, and composition, and Outcome 4, to provide enhanced ecological understanding to inform management decisions. 2012B8: Influence of Asian carp on planktivorous fish LTRM data from the open river is being analyzed to assess influence of Asian carp on other planktivorous fishes (i.e., gizzard shad and bigmouth buffalo). These data have been analyzed and presented at the Annual American Fisheries Society Conference and the Upper Mississippi River Conservation Committee fall fish technical meeting. We are in the preliminary stages of developing a peer-reviewed manuscript from these data to help managers and policy makers develop informed decisions regarding Asian carp. This framework follows Output 2.1 of LTRM’s Strategic Plan to provide insights about river structure, and composition, and Outcome 4, to provide enhanced ecological understanding to inform management decisions. 2012B9: Fish Habitat Availability Huron Island Complex Habitat Rehabilitation and Enhancement Project. The USACE Rock Island District has proposed a Habitat Rehabilitation & Enhancement Project (HREP) at the Huron Island Complex in Pool 18 of the UMRS. Most the backwater areas within the Complex lack habitat diversity. They mainly consist of shallow sand/silt flats, which are devoid of macrophytes but scattered with large woody debris. Data on fish are scarce for all of Pool 18. Limited electrofishing samples and fishing tournament catches indicate centrarchids use the area, but the quantity and quality of fish habitat available, or being utilized by different life stages of the fish community, is uncertain. Before any habitat objectives can be determined for the Huron Island HREP, habitat availability, use, and limitations must be better understood. The goal of this study is to describe and delineate fish habitat (i.e., spawning, rearing, pre-winter staging, and overwintering) available and potentially being used by the fish communities in Pool 18. Results of the study will be used to describe the existing conditions of fish habitat in Pool 18 for the Huron Island HREP and will be the basis for the development of a pre- and post-project fish monitoring plan. Using the LTRM’s fish monitoring data and associated environmental characteristics we will describe the preferred habitat exhibited by specific functional feeding and/or reproductive guilds in Pools 13 and 26 (separately) during the spawning season (Period 1),
1These items were deferred from FY11 and are not considered to as part of the normal FY12 SOW or its normal funding. Page 7 of 64
rearing/nursery stage (Period 2), and pre-winter staging/feeding timeframe (Period 3). We will deliver an internal report by 31 January 2012 and a manuscript for publication upon approval by the Corps. This framework follows Output 2.1 of the LTRM’s Strategic Plan by developing insights about river structure, and composition based on long-term data sets, and 3.1, using LTRM infrastructure, data sets, and expertise to help formulate ecological restoration projects. 2012B10: Asian carp age and growth Illinois River Biological Station (IRBS) staff began collecting Asian carp cleithral bones (the major bony component of the pectoral girdle of carp) from LTRM and other projects for future age and growth research. These collections will continue in FY2012. To ensure that a representative sample of the bighead and silver carp populations is obtained from the La Grange Reach, cleithrums are removed from Asian carp captured from all the major habitat strata within this reach of the Illinois River: main channel border (MCB), side channel border (SCB), and backwaters (BW). These collections will be supplemented by information from other ongoing projects at the IRBS funded by the Illinois Department of Natural Resources. We will opportunistically seek funding to process the collections and analyze these data in future years, either through funding sources outside of LTRM or through a defined project under LTRM. Preliminary analyses of a limited number of cleithrum samples will be conducted in FY2012 with the goal of identifying and defining the logistics of laboratory processing efforts needed to age Asian carp with these structures. 2012B11: Asian carp control LTRM staff at IRBS will continue to provide fisheries field sampling assistance in collaboration with John Amberg, of the USGS-UMESC, for collecting Asian carp for use in laboratory research. LTRM staff will continue to provide fisheries field sampling assistance. Dr. Amberg is currently conducting research to develop new methods for the control of Asian Carp, or to mitigate the effects Asian Carp through chemical, biological, or physical means. This work supports Outcome 4 of the LTRM’s Strategic Plan to enhance ecological understanding to inform management decisions, including using LTRM infrastructure to assist with development of new management options. 2012B12: Asian carp reduction
LTRM staff at IRBS will assist with the ongoing Asian Carp Reduction project led by Dr. Jim Garvey, Southern Illinois University Carbondale. LTRM-funded staff will provide LTRM fisheries and water quality data to assist in investigations conducted by Dr. Garvey to assess changes in the fish community associated with reduced Asian carp populations in the Illinois River. Initiation and completion of these analyses will depend on when and if the Asian carp reduction goals are achieved. Furthermore, it will take time for the native fish community to respond to reductions in Asian carp populations, so we only anticipate assisting with preliminary analyses during FY2012. This work supports Outcome 2.1 of the LTRM’s Strategic Plan to use LTRM data to provide insights about river process, function, and structure. 2012B13: Rehabilitation of backwater habitat in select Pool 12 backwaters
The USACE Rock Island District has proposed a Habitat Rehabilitation and Enhancement Project (HREP) in several backwater areas in Pool 12 of the UMRS. Project construction is scheduled to begin in FY13-14. Beginning in FY07, the Bellevue Long Term Resource Monitoring station, in conjunction with Iowa DNR’s Bellevue Fisheries Management station, began collecting pre-project fisheries monitoring data from Pool 12. This work is fully supported by HREP funding from the USACE Rock Island District. The Bellevue LTRM field station’s proximity to the project area allows this work to be conducted at relatively
1These items were deferred from FY11 and are not considered to as part of the normal FY12 SOW or its normal funding. Page 8 of 64
low cost, and uses existing equipment purchased by the LTRM. We will collect another annual increment of pre-project data in FY2012. The primary objective of the proposed HREP is to rehabilitate backwater habitat in selected Pool 12 backwaters and improve the fishery resource by increasing overwintering habitat. The “Pool 12 Overwintering” HREP provides an ideal opportunity to assess the effectiveness of overwintering habitat for improving UMR fishery resources. Despite the documented success of HREPs at improving local fish habitat conditions, resource managers on the UMR still seek scientifically quantified information that overwintering HREPs increase the abundance of desirable fish populations at the local and pool scale. This monitoring will provide several years of “pre-project” fisheries data from Pool 12, and will be carried on for an equal number of years “post-project” (after completion). This work represents a uniquely intensive assessment of the local (individual backwater), backwater aquatic area (all backwaters within a navigation pool), and pool-scale (all aquatic area within a navigation pool) effects of off-channel fish habitat improvement in a UMR pool. We intend to test the following hypothesis: Backwater rehabilitation as implemented through HREP projects on the UMR improves centrarchid population abundance, biomass, and fish available to the recreational creel at the individual-backwater, backwater aquatic area, and pool scale. This work will directly address the subject of availability of overwintering habitat as a limiting factor for UMR fish populations. This will provide river managers with science-based results of the application of habitat management, which is critical to the optimal use of available fiscal resources, and will subsequently benefit the UMR and UMR users. The sampling design used for the assessment incorporates use of Pool 13 fisheries data collected under standard LTRM protocols as a “control,” with hierarchically structured sampling and assessment of treatment effects in Pool 12 (i.e., assessment at the pool, backwater habitat, and individual backwater scales). This work supports Outcome 3.1 of the LTRM’s Strategic Plan to use LTRM infrastructure, data sets, and expertise to help formulate, design, and evaluate ecological restoration projects. 2012B14: Fisheries Monitoring in Pool 13, Upper Mississippi River This report contains summaries and analyses of selected features of fish communities and fish populations from data collected since the LTRM fish component was initiated on Pool 13. This report will focus on: 1) the relative abundance of commonly collected species; 2) trends in catch-per-unit-effort (CPUE) of selected game and prey species; and, 3) the detection of uncommon or rare species. This work supports Outcome 1 of the LTRM’s Strategic Plan: Enhanced knowledge about system status and trends. 2012B15: Fish Component Hoop net study feasibility assessment Our supplier of mechanically extracted and compressed soybean meal (beancake) for the past 20 years, West Bend Elevator in Iowa, has stated when its machinery breaks they will cease production of this product. No other manufacturer of this product has been found. Mechanically processed soymeal, such as beancake, has 38% protein, 10% fat, and 5% residual oil content. More modern processors use chemical solvent (hexane) methods to extract the oil and are nearly 100% effective at doing so. Thus, our primary source of baits for hoop net sampling in the LTRM fisheries component is in danger of not being available in the near future (1-3 years), and compositionally comparable substitutes are not readily apparent. We need to either initiate a study to find a reasonable substitute or simply abandon hoop netting as a standard LTRM method. This feasibility report seeks to determine whether a replacement bait study is possible. This work supports Outcome 1 of the LTRM’s Strategic Plan: Enhanced knowledge about system status and trends.
1These items were deferred from FY11 and are not considered to as part of the normal FY12 SOW or its normal funding. Page 9 of 64
2012B16: Fish Component Hoop net study The supplier of mechanically extracted and compressed soybean meal (beancake) used for fish sampling for the past 20 years has stated when its machinery breaks they will cease production of this product. Thus, our primary source of baits for hoop net sampling in the LTRM fisheries component is in danger of not being available in the near future (1-3 years). This study looks to find a reasonable substitute to use as standard LTRM bait. Open River Reach (Cape Girardeau, MO) and Pool 8 (La Crosse, WI) field stations were selected to perform a full annual allocation for each of our standard bait and the alternative bait, based on minimizing sample size requirements to detect the consensus acceptable error response (20%) at 95% confidence. Because we chose two study reaches, our study design encompasses the full range of physical differences within the sampling environment that may interact with differences in the physical composition of the two baits to affect catches. Our goal is a posterity report (FY13) demonstrating responsible and considered changes in a standardized element of our sampling program. Design-based poolwide annual means will be calculated for each full allocation of (1) standard bait sets, and (2) alternative bait sets (see Gutreuter et al. 1995; Ickes et al. 2005). Differences between the means calculated from each bait type will be tested with a simple two-way student’s t-test, using +/- 20% deviation from the standard bait mean with 95% confidence as the criteria for rejecting a null hypothesis of no difference between bait types. 2012B17: Database addition; Special Project—Stratified random day electrofishing samples collected in Pools 16–19
The Iowa DNR’s Fairport Fisheries Management Station has six years of what we to perceive to be the equivalent of LTRM “outpool sampling” data (2006–2011 and presently planned to continue indefinitely) This data will potentially bridge the gap of the fundamental lack of consistent and standardized fisheries information between key LTRM pools—Pools 13 and 26, in this case. Species richness and relative abundance are among some the fisheries metrics that can be gleaned from this data, and they can be directly compared to similar metrics in the LTRM key pools. This data may also serve as a control to assess natural variation when evaluating fisheries responses to HREP projects. This is something that the larger contingencies of river managers have asked for a long time. This work supports Outcome 1 of the LTRM’s Strategic Plan: Enhanced knowledge about system status and trends. 2012B18: Database addition, Special project—Fisheries HREP Monitoring; Huron Island (Pool 18)
The Iowa DNR’s Fairport Fisheries Management Station has collected two years of pre-HREP randomized fisheries data within Huron Island in Pool 18 of the UMR. Incorporating this data into our database would potentially allow us the opportunity and mechanism to evaluate fisheries responses (within the HREP and at a pool-scale) to backwater rehabilitation, much like the Pool 12 HREP monitoring that is currently being evaluated. This work supports Outcome 3 of the LTRM’s Strategic Plan: Enhanced use of scientific knowledge for implementation of ecosystem restoration programs and projects.
Products and Milestones
Tracking number
Products Staff
Milestones
2012B1 Complete data entry, QA/QC of 2011 fish data; ~1,590 observations
a. Data entry completed and submission of Popp, Fischer, Bierman, 31 January 2012
1These items were deferred from FY11 and are not considered to as part of the normal FY12 SOW or its normal funding. Page 10 of 64
data to USGS Chick, Sass, Hrabik b. Data loaded on level 2 browsers; QA/QC scripts run and data corrections sent to Field Stations
Schlifer 15 February 2012
c. Field Station QA/QC with corrections to USGS
Popp, Fischer, Bierman, Chick, Sass, Hrabik
15 March 2012
d. Corrections made and data moved to public Web Browser
Sauer and Schlifer 30 March 2012
2012B2
Update Graphical Browser with 2011 data on Public Web Server.
Sauer, Popp, Fischer, Bierman, Chick, Sass,
Hrabik
31 May 2012
2012B3 Complete fisheries sampling for Pools 4, 8, 13, 26, the Open River, and La Grange Pool (Table 1)
Ickes, Popp, Fischer, Bierman, Chick, Sass,
Hrabik
31 October 2012
2012B4 Final draft completion report, compilation of 3 years of sampling: Fisheries (2009R1Fish)
Chick et al. 30 September 2012
2012B5 Draft manuscript: Sturgeon Life History on the UMR
Hrabik, Phelps 30 September 2012
2012B6 Database development: Flooding of the New Madrid floodway and Duck Creek Conservation Area
Hrabik, Phelps 30 September 2012
2012B7 Fisheries sampling and database increment: Population characteristics and habitat use of American eel
Hrabik Ridings, Phelps 30 September 2012
2012B8 Draft Manuscript: Influence of Asian carp on planktivorous fish
Hrabik, Phelps 30 September 2012
2012B9 COE Internal Report: Fish Habitat Availability Huron Island Complex Habitat Rehabilitation and Enhancement Project.
Hrabik, Phelps 31 January 2012
2012B10 Database increment: Asian carp age and growth Sass, Ruebush, Solomon 30 September 2012 2012B11 Fisheries sampling: Asian carp control Sass, Ruebush, Solomon 30 September 2012 2012B12 Preliminary analysis: Asian carp reduction Sass, Ruebush, Solomon 30 September 2012 2012B13 Database increment: Rehabilitation of
backwater habitat in select Pool 12 backwaters Bierman, Bowler 30 September 2012
2012B14 IDNR Fisheries Management Completion Report: Fisheries Monitoring in Pool 13, Upper Mississippi River, 2011
Bierman, Bowler 30 April 2012
2012B15 Fish Component Hoop net study feasibility assessment, internal document
Ickes, DeLain, Bartels, Bowler, Ratcliff,
Gittinger, Ridings, Ruebush, Solomon
2 March 2012
2012B16 Fish Component Hoop net study: Field sampling Bartels, Ridings, Ickes, Schlifer
15 October 2012
2012B17 Database increment: Stratified random day electrofishing samples collected in Pools 16–19
Bierman, Bowler, Schlifer
30 September 2012
2012B18 Database increment: Fisheries HREP Monitoring; Huron Island (Pool 18)
Bierman, Bowler, Schlifer
30 September 2012
On-Going 2006B6 Draft manuscript: Spatial structure and
temporal variation of fish communities in the Upper Mississippi River. (Dependent on 2008B9 acceptance into journal)
Chick TBD
2007APE3 Draft LTRM report: Testing the Fundamental Assumption underlying the use of LTRM fish data: Does variation in LTRM catch-per-unit-effort data reflect variation in the abundance of fishes?
Chick 30 December 2012
2007B4 Draft completion report: Proportional biomass contributions of Non-native fish to UMRS fish communities
Ickes 30 June 2012
1These items were deferred from FY11 and are not considered to as part of the normal FY12 SOW or its normal funding. Page 11 of 64
2008B9 Draft manuscript: Standardized CPUE data from multiple gears for community level analysis (a previous manuscript was submitted and rejected by the journal, 2006B5; 2008B9 is a revised manuscript)
Chick 30 March 2012
2008APE1a Draft completion report: Developing an empirical framework for reconstructing and modeling UMRS floodplain disturbance histories: Year 1, historic data extraction and summaries.
Ickes 30 March 2012
2010B4 Draft revision and update of the LTRM fisheries component procedures manual
Ratcliff, Gittinger 30 May 2012
Intended for distribution Manuscript: Evaluation of a Catch and Release Regulation for Largemouth Bass in Brown’s Lake, Pool 13, Upper Mississippi River (2007B7; Bowler) Completion report: LTRM Fisheries Component collection of six darter species from 1989–2004. (2006B13; Ridings) LTRM Report: An Evaluation of Macroinvertebrate Sampling Methods For Use In The Open River Reach of The Upper Mississippi River; Kathryn N. S. McCain, Robert A. Hrabik, Valerie A. Barko, Brian R. Gray, and Joseph R. Bidwell (2005C2) LTRM report: Relationship of juvenile abundance of select fish species to aquatic vegetation in Navigation Pools 4, 8, and 13 of the Upper Mississippi River, 1998-2007 (2007B5; 2009B5; Popp and DeLain) Completion Report: A Proposal to restore Specific Monitoring Elements to the LTRM (Year 1 of restored monitoring; 2007APE8) LTRM technical report; Setting quantitative fish management targets for LTRM monitoring (2008APE2; Sass) Literature Cited Gutreuter, S., R. Burkhardt, and K. Lubinski. 1995. Long Term Resource Monitoring Program
procedures: Fish monitoring. National Biological Service, Environmental Management Technical Center, Onalaska, Wisconsin, July 1995. LTRMP 95-P002-1. 42 pp. + Appendixes A–J
Ickes, B. S. and R. W. Burkhardt. 2002. Evaluation and proposed refinement of the sampling design for the Long Term Resource Monitoring Program’s fish component. U.S. Geological Survey, Upper Midwest Environmental Sciences Center, La Crosse, Wisconsin, October 2002. LTRMP 2002-T001. 17 pp. + Appendixes A–E. CD-ROM included. (NTIS #PB2003-500042)
Ickes, B. S., M. C. Bowler, A. D. Bartels, D. J. Kirby, S. DeLain, J. H. Chick, V. A. Barko, K. S. Irons, and M. A. Pegg. 2005. Multiyear synthesis of the fish component from 1993 to 2002 for the Long Term Resource Monitoring Program. U.S. Geological Survey, Upper Midwest Environmental Sciences Center, La Crosse, Wisconsin. LTRMP 2005-T005. 60 pp. + CD-ROM (Appendixes A–E). (NTIS PB2005-107572)
1These items were deferred from FY11 and are not considered to as part of the normal FY12 SOW or its normal funding. Page 12 of 64
Water Quality Component The objective of the LTRM’s water quality component is to obtain basic limnological information required to (1) increase understanding of the ecological structure and functioning of the UMRS, (2) document the status and trends of ecological conditions in the UMRS, and (3) contribute to the evaluation of management alternatives and actions in the UMRS. Data are collected within six LTRM study reaches in the UMRS (Pools 4, 8, 13, 26, and Open River Reach on the Upper Mississippi River and La Grange Pool on the Illinois River). Data entry, quality assurance, data summaries, standard analyses, data serving, and report preparation occur under standardized protocols (Soballe and Fischer 2004). (Strategic Plan Outcome 1; Output 1.1, Outcome 2, Output 2.1 and Outcome 4) Methods
Limnological variables (physicochemical characteristics, suspended solids, chlorophyll a, phytoplankton [archived], and major plant nutrients) will be monitored at both stratified random sites (SRS) and at fixed sampling sites (FSS) according to LTRM protocols.
Fixed site sampling Fixed site sampling will be conducted as in FY2006 with addition of 14 sites in Pool 4 and 4 historic and 2 new sites in Pool 8 (Table 1).
Stratified random sampling Stratified random sampling will be conducted at full effort levels (same as FY2006) for fall, winter, spring, and summer episodes (Table 1).
In situ data collection For both FSS and SRS in situ data will be collected on physicochemical characteristics per the standard protocols (Soballe and Fischer 2004).
Laboratory analyses Samples for chemical analysis (nitrogen (total N, nitrate/nitrite N, ammonia N), phosphorus (Total P, SRP), and silica) will be collected at all fixed sites and at approximately 35% of all stratified random sampling locations as specified in the sampling design. Samples for chlorophyll and suspended solids (total and volatile) will be collected at all SRS and Fixed sites. We will not collect data on major cations and anions in water samples in FY2012. Sampling and laboratory analyses will be performed following LTRM protocols (Soballe and Fischer 2004) and Standard Methods (American Public Health Association 1992). Product Descriptions 2012D10: Nutrients, chlorophyll, and suspended sediments in channel and off-channel areas of the Upper Mississippi River (UMR) The UMR exhibits considerable spatial variability in WQ. The LTRM WQ component has been designed to facilitate quantification and description of that variability. Both longitudinal (differences among pools) and lateral (differences among aquatic areas w/in pools) are important. Longitudinal differences have been documented in a peer-reviewed scientific publication (Houser et al. 2010), but lateral differences have not (though they can be viewed using, for example, the online graphical data browser). The lateral differences are currently an important issue as the UMRBA works with states to establish
1These items were deferred from FY11 and are not considered to as part of the normal FY12 SOW or its normal funding. Page 13 of 64
water quality criteria for the UMR (see this report for details: www.umrba.org/publications/wq/umr-wq-science-needs3-3-11.pdf). As a result there is a need for a rigorous, peer-reviewed analysis of where and when there are differences in WQ that are of biological significance. The draft manuscript addresses that need and directly addresses Outcome 1 (Output 1.1) and Outcome 2 (Output 2.1) of the 2010-2014 Strategic Plan. 2012D11: Spatial and temporal dynamics of phytoplankton assemblages in selected reaches of the UMR: Navigation Pools 8, 13, and 26 Relatively few studies have examined large-scale phytoplankton community composition in the UMR. Phytoplankton community composition can serve as an indicator of water quality and may affect the quality of food available at the base of the food web. This study will focus on community composition and the factors that influence it. Specifically this study will examine the spatial and temporal dynamics of phytoplankton community composition within three habitat types of the UMR—main channel, backwater, and impounded areas and their relationship to covariates such as water clarity and nutrient concentration. The results will be submitted as a Master's thesis to the University of Wisconsin La Crosse. These will results will improve our understanding of when and where undesirable algal blooms are likely to occur and in doing so may provide important information for consideration in the management of channel and backwater areas of the UMR. Thus this project will provide information relevant to Outcome 1 (Output 1.1 and 1.2), and Outcome 2 (Output 2.1). 2012D12: Temporal evaluation of factors influencing metaphyton biomass, distribution and composition within UMR backwaters Metaphyton is comprised of duckweed and filamentous algae species and is common in aquatic ecosystems. However, excessive metaphyton production can interfere with public recreation, provides minimal benefits for invertebrates, fish and wildlife, and can cause reductions in submersed aquatic vegetation. Additionally, metaphyton mats can cause reductions in underwater light, dissolved oxygen concentration, phytoplankton growth and abundance, zooplankton growth and abundance, increased sediment oxygen demand, and increased internal nutrient loading. The information produced by this research will help to determine: (1) The hydrological, weather and water quality conditions that coincide with the emergence of metaphyton in late spring - early summer, (2) How metaphyton tissue nutrient ratios (N:P, C:P, C:N) and metaphyton biomass respond to changing water column nutrient availability through the growing season, (3) Whether particular nutrient concentration thresholds are necessary to sustain metaphyton biomass throughout the growing season, (4) Whether different nutrients (N and P) limit metaphyton abundance at different times during the growing season? This work builds on prior observational studies (2010out2a) by estimating metaphyton biomass and examining metaphyton tissue for indication of nutrients that may be limiting growth. The results of this report can be used to inform the debate regarding the development of numeric nutrient concentration goals for the UMR. It also provides physical targets (i.e. water velocity and water depth) to consider in future projects to reduce influence of excessive metaphyton in future habitat improvement projects. Much of the research regarding the effects of excessive nutrient input to the UMR has focused on hypoxia in the Gulf of Mexico rather than local eutrophication effects. In recent years there has been a perceived increase in surface mats of metaphyton in the UMR among the public and popular press. The increase in metaphyton has been blamed for decreases in both economic activity and perceived value of the aquatic resource. It is important to determine the chemical and physical factors driving the production of metaphyton biomass within the UMR and to develop management strategies to reduce
1These items were deferred from FY11 and are not considered to as part of the normal FY12 SOW or its normal funding. Page 14 of 64
metaphyton overabundance. This effort addresses will provide information relevant to Outcome 1 (Output 1.1 and 1.2), and Outcome 2 (Output 2.1). A summary document of this work is planned for FY13. 2012D13: Manipulation of DNR Biology Lab zooplankton data Zooplankton are an important link in the food web of most aquatic ecosystems. Surprisingly little information is available about zooplankton in the Upper Mississippi River System (UMRS). Analysis of a long term zooplankton data set from Lake Pepin will provide a greater understanding of the factors controlling zooplankton abundance and composition in this unique habitat on the UMRS. This effort will provide baseline data and more detailed analysis of previous work (2006D7) by using non-metric multidimensional scaling to investigate the relationship between water quality attributes and the zooplankton community. Information gained from this effort will be available for future modeling and management decisions on the UMRS. This effort is in the early stages of data manipulation which involves manually transforming an Excel spreadsheet for each sample into a form that is capable of being uploaded into SAS. The results and products of this effort will eventually contribute to outcomes 1 through 4 identified in the Strategic and Operational Plan for the Long Term Resource Monitoring and specifically to outputs 1.3, 1.4, 2.1, 3.1, and 4.1. This data may become especially relevant as planktivorous Asian carps continue to spread throughout the UMRS. The impact caused by these invasive species to zooplankton communities and native fishes is largely unknown. A summary document of this work is planned for FY13. 2012D14: A Decade of Monitoring on Pool 26 of the Upper Mississippi River
LTRM staff (located at the National Great Rivers Research and Education Center) recently submitted for publication the article “A Decade of Monitoring on Pool 26 of the Upper Mississippi River: Water Quality and Fish Data with Cross Component Analyses” to the peer reviewed journal “Bulletin of the Illinois Natural History Survey.” Revisions to this manuscript will occur when reviews are received in FY12. See page 42 www.umesc.usgs.gov/documents/reports/2005/fy05 ltrmp sow final 4march2005.pdf. This framework follows Output 1.1 and 2.1 of the LTRM’s Strategic Plan. 2012D15: Technical review of a YSI Optical sensor
In a collaborative effort with the National Great Rivers Research and Education Center (NGRREC), LTRM staff will be involved with the installation and maintenance of a YSI Optical sensor (NGRREC purchase) for real-time water quality sampling. LTRM staff will ground truth the data using standard LTRM water quality samples. This framework follows Output 1.1 and 2.1 of the LTRM’s Strategic Plan, including leveraging LTRM’s infrastructure to assess new monitoring technologies.
1These items were deferred from FY11 and are not considered to as part of the normal FY12 SOW or its normal funding. Page 15 of 64
Products and Milestones
Tracking number
Products Staff
Milestones
2012D1 Complete calendar year 2011 fixed-site and SRS water quality sampling
Houser, Popp, Fischer, Bierman, Chick, Sass,
Hrabik
31 December 2011
2012D2 Complete laboratory sample analysis of 2011 fixed site and SRS data; Laboratory data loaded to Oracle data base.
Yuan, Schlifer 15 March 2012
2012D3 1st Quarter of laboratory sample analysis (~12,600) Yuan, Kreiling, Manier, Burdis, Giblin, Kueter, L. Gittinger, Cook, Crites
30 December 2011
2012D4 2nd Quarter of laboratory sample analysis (~12,600) Yuan, Kreiling, Manier, Burdis, Giblin, Kueter, L. Gittinger, Cook, Crites
30 March 2012
2012D5 3rd Quarter of laboratory sample analysis (~12,600) Yuan, Kreiling, Manier, Burdis, Giblin, Kueter, L. Gittinger, Cook, Crites
29 June 2012
2012D6 4th Quarter of laboratory sample analysis (~12,600) Yuan, Kreiling, Manier, Burdis, Giblin, Kueter, L. Gittinger, Cook, Crites
28 September 2012
2012D7 Complete QA/QC of calendar year 2011 fixed-site and SRS data.
a. Data loaded on level 2 browsers; QA/QC scripts run; SAS QA/QC programs updated and sent to Field Stations with data.
Schlifer, Rogala 30 March 2012
b. Field Station QA/QC; USGS QA/QC. Rogala, Popp, Fischer, Bierman, Chick, Sass,
Hrabik
15 April 2012
c. Corrections made and data moved to public Web Browser
Rogala and Schlifer 30 April 2012
2012D8 Complete FY12 fixed site and SRS sampling for Pools 4, 8, 13, 26, Open River, and La Grange Pool (Table 1)
Houser, Popp, Fischer, Bierman, Chick, Sass,
Hrabik
30 September 2012
2012D9 WEB-based annual Water Quality Component Update with 2011 data on Public Web Server.
Rogala 30 May 2012
2012D10
Draft manuscript: Nutrients, chlorophyll, and suspended sediments in channel and off-channel areas of the Upper Mississippi River
Houser 1 September 2012
2012D11 Thesis submission: Spatial and temporal dynamics of phytoplankton assemblages in selected reaches of the UMR: Navigation Pools 8, 13, and 26 (2010OUT2c)
Manier, Houser 30 July 2012
2012D12 Draft Manuscript: Temporal evaluation of factors influencing metaphyton biomass, distribution and composition within UMR backwaters (Continued analysis from 2010out2a)
Giblin et al. 30 September 2012
2012D13 Data preparation: manipulation of DNR Biology Lab zooplankton data (Final product will be a manuscript in FY13 similar to 2006D7)
Burdis 30 September 2012
2012D14 Draft Manuscript: A Decade of Monitoring on Pool 26 of the Upper Mississippi River
Chick et. al 30 September 2012
2012D15 Technical review of a YSI Optical sensor Chick, L. Gittinger, Lubinski 30 September 2012 2012D16 Final draft completion report, compilation of 3 years
of sampling: Water Quality (2009R1WQ) Giblin, Burdis 30 September 2012
2012D17 Final draft completion report: Temporal evaluation of factors influencing metaphyton biomass,
Giblin et al. 30 September 2012
1These items were deferred from FY11 and are not considered to as part of the normal FY12 SOW or its normal funding. Page 16 of 64
distribution and composition within UMR backwaters (2010OUT2a)
On-Going 2010D6 Draft LTRM Completion Report: Changes in
substrate, water quality, aquatic vegetation, zooplankton, and fish community from Geomorphic Reach 1 (above Lake Pepin) to Geomorphic Reach 3 (below Lake Pepin).
Popp, De Lain, Burdis, Moore
30 June 2012
Intended for distribution Completion report: Examining nitrogen and phosphorus ratios N:P in the unimpounded portion of the Upper Mississippi River (2006D9; Hrabik & Crites) LTRM report: retrospective, cross-component analysis for Pool 26. (2005APE26; Chick) LTRM report: Main channel/side channel report for the Open River Reach. (2005D7; Hrabik) Manuscript: Primary production, and dissolved oxygen dynamics in UMRS backwater lakes and main channel. (2008D8; Houser) LTRM report: A Decade of Monitoring on Pool 26 of the Upper Mississippi River: Water Quality and Fish Data with Cross Component Analyses Chick et al.; 2005APE26) Manuscript: Causes and consequences of metaphyton abundance in backwater lakes of the UMR near La Crosse, Wisconsin. (2009APE3, Houser)
Literature Cited American Public Health Association, American Water Works Association, and Water Environment
Federation. 1992. Standard methods for the examination of water and wastewater. 18th edition, American Public Health Association, Washington, D.C. 981 pp. + 6 color plates
Houser, J.N., D.W. Bierman, R.M. Burdis, and L.A. Soeken-Gittinger. 2010. Longitudinal trends and discontinuities in nutrients, chlorophyll and suspended solids in the Upper Mississippi River: implications for transport, processing, and export by large rivers. Hydrobiologia 651:127–144.
Soballe, D. M., and J. R. Fischer. 2004. Long Term Resource Monitoring Program Procedures: Water quality monitoring. U.S. Geological Survey, Upper Midwest Environmental Sciences Center, La Crosse, Wisconsin, March 2004. LTRMP 2004-T002-1 (Ref. 95-P002-5). 73 pp. + Appendixes A-J.
Upper Mississippi River Basin Water Quality-Related Science Needs (March 3, 2011). Provided to U.S. EPA Region 7 from the Upper Mississippi River Basin Association Water Quality Executive Committee. http://www.umrba.org/publications/wq/umr-wq-science-needs3-3-11.pdf
1These items were deferred from FY11 and are not considered to as part of the normal FY12 SOW or its normal funding. Page 17 of 64
Land Cover/Land Use with GIS Support
In FY2010-11, systemic digital aerial photography was collected in cooperation with USFWS Region 3. The main task under Land Cover/Land Use will be in processing these data (See Development of 2010/11 Land Cover/Land Use GIS Database and Aerial Photo Mosaics). (Strategic Plan Outcome 1; Output 1.1) However, we will continue to provide on demand GIS technical assistance, expertise, and data production to the Environmental Management Program partnership including, but not limited to:
• Aerial photo interpretation • Interpretation automation into a digital coverage • Flight planning and acquisition of aerial photography • Change detection and habitat modeling • Georeferenced aerial photo mosaics (pool wide, Habitat Rehabilitation and Enhancement
Projects (HREPs), land acquisition areas) • Georeferenced archival map/plat mosaics (Brown Survey, Mississippi River Commission data,
Government Land Office data) • Produce graphics and summary tables for partnership publications, posters, and presentations • Conversion of ASCII coordinate data from a GPS to a spatial dataset • Conversion of all georeferenced data to a common projection and datum for ease of use in a GIS • Conversion of GIS data to KML and KMZ (Google Earth) formats for ease of viewing and sharing
(as requested). • Maintain, update, and oversee the aerial photo library of over 50,000 print and digital images. • Maintain, update, and enhance over 20 million acres of land cover/land use and aquatic areas
data spanning the late 1800s through the year 2000. This includes improving existing or developing new crosswalks for comparison of existing datasets, cropping datasets to common extents, and ensuring that all datasets are in a common coordinate system.
• Assist in the maintenance and updating of the USGS-Upper Midwest Environmental Sciences Center's (UMESC) web based geospatial data repository.
• Provide hardware and software technical support to UMESC staff and partners, as needed. • Continue to assess advances in computer technology (hardware and software) for accurate and
efficient GIS data production.
Product Descriptions Although the primary focus of this component is to provide technical assistance and maintain existing databases, as time allows work may occur on the following LTRM projects:
• Generate GIS-ready (.xml format) metadata for spatial data being served over the internet. The data being served have metadata included but is in either text format (.txt) or web format (.html). Converting these metadata files to .xml will provide access from within the GIS.
• Continue to update the detailed spreadsheet of all LTRM aerial photography currently housed at UMESC, including date, pool location, format (color infrared, natural color, black-and-white), scan status (yes/no, dots per inch), interpreted status, photo scale, and extent of coverage (partial or complete). This document will be updated as necessary.
1These items were deferred from FY11 and are not considered to as part of the normal FY12 SOW or its normal funding. Page 18 of 64
Products and Milestones
Tracking number
Products Staff
Milestones
Intended for distribution Completion Report: Assessment of high-resolution digital imagery for UMRS vegetation mapping and software-based vegetation classification (2007APE13; Robinson) Completion report: Aerial Imagery Processing and Classification Training for 2010 LCU (2009LCU1; Robinson)
1These items were deferred from FY11 and are not considered to as part of the normal FY12 SOW or its normal funding. Page 19 of 64
Development of 2010–2011 Land Cover/Land Use GIS Database and Aerial Photo Mosaics Development of the 2010/2011 Land Cover/Land Use (LCU) Geographic Information System (GIS) database will provide a third systemic dataset to compare the 1989 and the 2000 systemic coverages. Though a crosswalk was needed to compare 1989 and 2000 since different vegetation classification systems were used, the 2000 and 2010/11 LCU datasets will use the same classification and classifiers, making them directly comparable. Once completed, the 2010–2011 dataset will be invaluable in assessing and evaluating long-term vegetation trends and habitat changes over the past 20 years, and in assessing the current state of floodplain vegetation. (Strategic Plan Outcome 1; Output 1.1 and Outcome 4) Objectives Develop a 2010/11 LCU GIS database for Pools 1-26, the Open River Reach, the entire Illinois River, and the navigable portions of Minnesota, St. Croix, and Kaskaskia Rivers of the UMRS. Note: Extensive flooding on the Middle Mississippi River below the Quad Cities required aerial photography on Pools 14-Open River to be postponed until the late-summer of 2011. The upper pools of the Illinois River (Lockport, Brandon, and Dresden Pools) were reflown in 2011 due to heavy cloud cover in 2010. Methods Aerial photographs Pools 1-13, Upper Mississippi River and the Pools Alton-Marseilles, Illinois River were collected in color infrared (CIR) in August of 2010 at 8”/pixel and 16”/pixel respectively using a mapping-grade Applanix DSS 439 digital aerial camera. In August 2011, CIR aerial photographs for Pools 14-Open River South, Upper Mississippi River and Pools Dresden-Lockport, Illinois River were collected at 16”/pixel with the same camera. These CIR aerial photos will be orthorectified, mosaicked, compressed, and served via the UMESC Internet site. The CIR aerial photos will be interpreted and automated using a 31-class LTRM vegetation classification (see Attachment A). The 2010/11 LCU databases will be prepared by or under the supervision of competent and trained professional staff using documented standard operated procedures and will be subject to rigorous quality control (QC) assurances (NBS, 1995). The LTRM trend pools (Pools, 4, 8, 13, and the La Grange Pool of the Illinois River) will be processed first. The trend pools whose imagery was collected in late summer 2011 (Pool 26 and Open River South) along with Pools 6, 9, 14, 18, and 19 will be completed in FY2012. - The completion order of the remaining pools will be determined at a later date.
• Systemic Flight of UMRS - Fly the entire UMRS in CIR at 8”/pixel for Pools 1-13 and at 16”/pixel for Pools 14-26 and the Illinois River.
• Orthorectify, Mosaic, and Serve the 2010 CIR Aerial Photography - UMESC has the capability to compress and mosaic high-resolution scans of the 2010 imagery. These georeferenced photos would provide a base map on which existing LCU data and future LCU data could be overlaid. These photos also offer the ability to do visual-based land use or habitat analysis. These photos would be made available, by pool or reach, through UMESC's internet home page.
• Trend Pool Automation of 2010/11 Systemic Aerial Photography – Trend pools (Pools 4, 8, 13, 26, the Open River South, and the La Grange Pool of the Illinois River) will be interpreted first using the same 31-class vegetation classification system used to classify the 2000 systemic aerial photography (see Attachments A). Year 2010/11 LCU databases will be prepared by or under the supervision of competent and trained professional staff using documented standard operated procedures and will be subject to rigorous quality control (QC) assurances (NBS, 1995). The LTRM study areas will be processed first, beginning with Pools 4, 8, 13, and the La Grange Pool of the Illinois River. Pool 26 and the Open River South reach will follow once the 2011 aerial photography is complete.
1These items were deferred from FY11 and are not considered to as part of the normal FY12 SOW or its normal funding. Page 20 of 64
Products and Milestones
Tracking number
Products Staff
Milestones
2012V1 Complete orthorectified photo mosaics of all imagery collected in 2010 using OrthoVista
Robinson, Ruhser 31 December 2011
2012V2 Complete orthorectified photo mosaics of all imagery collected in 2011 using OrthoVista
Robinson, Ruhser 30 June 2012
2012V3 Complete 2010/11 LCU databases for UMR Pool 26 and Open River South
Robinson, Hoy, Hanson, Langrehr
29 February 2012
2012V4 Complete 2010/11 LCU database for UMR Pool 9
Robinson, Hoy, Hanson, Langrehr
30 April 2012
2012V5 Complete 2010/11 LCU database for UMR Pool 18
Robinson, Hoy, Hanson, Langrehr
31 May 2012
2012V6 Complete 2010/11 LCU database for UMR Pool 14
Robinson, Hoy, Hanson, Langrehr
30 June 2012
2012V7 Complete 2010/11 LCU databases for UMR Pools 6 and 19
Robinson, Hoy, Hanson, Langrehr
31 August 2012
1These items were deferred from FY11 and are not considered to as part of the normal FY12 SOW or its normal funding. Page 21 of 64
ATTACHMENT A LTRM 31-Class General Vegetation Classification, Version 1.0 CODE CODE DESCRIPTION HYDROLOGY DESCRIPTION DESCRIPTION OW Open Water Permanently Flooded Non-Forest Open Water; Default to Anderson Classification
UF Upland Forest Infrequently Flooded Forest Lowland or submontane cold-deciduous closed tree canopy
AG Agriculture Infrequently Flooded Non-Forest Annual row-crop forbs or grasses DV Developed Infrequently Flooded Non-Forest Developed; Default to Anderson Classification GR Grassland Infrequently Flooded Non-Forest Tall sod temperate grassland LV Levee Infrequently Flooded Non-Forest Levee; Default to Anderson Classification PS Pasture Infrequently Flooded Non-Forest Perennial Grass Crops
RD Roadside Grass/Forbs Infrequently Flooded Non-Forest Roadside Grass/Forb; Default to Anderson Classification
SB Sand Bar Temporarily Flooded Non-Forest Temporarily flooded sand flats SD Sand Infrequently Flooded Non-Forest Dunes with sparse herbaceous vegetation NPC No Photo Coverage n/a No Photo Coverage; n/a
VEGETATION MODIFIERS Density A = 10-33% B = 33-66% C = 66-90% D = > 90% Height* 1 = 0-20 ft. 2 = 20-50 ft. 3 = > 50 ft. *Trees only
1These items were deferred from FY11 and are not considered to as part of the normal FY12 SOW or its normal funding. Page 22 of 64
Thematic accuracy assessment and validation for the Upper Mississippi River System floodplain from 2010/2011 land cover/land use data1
The USGS-Upper Midwest Environmental Sciences Center (UMESC) has been responsible for development of several land cover/land use (LCU) systemic data sets of the Upper Mississippi River System (UMRS) floodplain (1989, 2000). These efforts were funded by the UMRR–EMP LTRM. Development of systemic data sets include the acquisition, processing, and serving of high resolution aerial photography and land cover/land use spatial data sets (www.umesc.usgs.gov/data_library/land_cover_use/land_cover_use_data.html). In 2008, the UMRR–EMP reached a collaborative agreement with the U.S. Fish and Wildlife Service’s Region 3 Office to collect high-resolution digital imagery of the entire UMRS floodplain in 2010/2011 for the LTRM. The UMESC will help acquire, process, and serve this imagery, as well as produce and serve the 2010/2011 LCU systemic data set of the UMRS floodplain. While the 1989 and 2000 LCU systemic data sets have not gone through a traditional thematic accuracy assessment in the past, the end products have been of high quality. For each systemic data set produced (1989, 2000, 2010/11), extensive field reconnaissance/groundtruthing is performed before photointerpretation to learn, test, and verify image signatures as they relate to the vegetation types. Questionable areas on the imagery are visited and the plants or land features observed in the area are recorded for reference. This procedure verifies vegetation signatures on the photographs with those on the ground. In addition, once the photointerpretation is complete, the final LCU data set undergoes extensive quality assurance/quality control to ensure the imagery is mapped correctly. Since the last LCU systemic data set was developed, there has been a growing interest in completing thematic accuracy assessments (AA) for the LTRM LCU spatial data sets. The objective of an AA is to measure the probability that a particular location has been assigned its correct vegetation class. An AA estimates thematic (map class) errors in the data, giving users information needed to determine data suitability for a particular application. At the same time, data producers are able to learn more about the nature of errors in the data. Thus, the two views of an AA are “producers’ accuracy,” which is the probability that an AA point has been mapped correctly (also referred to as an error of omission), and “users’ accuracy,” which is the probability that the map actually represents what was found on the ground (also referred to as error of commission). Producers’ and users’ accuracies can be obtained from the same set of data by using different analyses. A pilot thematic accuracy assessment study was completed on an UMRS 2001 LCU spatial data set of Pool 8 (May 2002). At the genus level, results of this study calculated the overall accuracy produced with a kappa index to be 83.8%. At the General Wetland Vegetation Map Class (Dieck and Robinson 2004) level, the overall accuracy was calculated with a kappa index to be 88.5%. Currently, the goal is to expand on this work and complete a thematic accuracy assessment on select pools throughout the UMRS using LCU data from the 2010/2011 LCU spatial data sets of the UMRS. (Strategic Plan Outcome 1; Output 1.1, Outcome 2, Output 2.1 and Outcome 4) Study Area and General Work Plan This Scope of Work describes an AA for Pools 13 and La Grange. During a thematic accuracy assessment, random points are generated based on area of each natural/semi-natural map class. Field crews are sent into the field to record the vegetation type at each of the selected sites. (Note that there will be issues with accessing private property.) This data would then be brought back to the office, entered into a database, and compared to the map by two individuals not involved with the mapping of the LCU
1These items were deferred from FY11 and are not considered to as part of the normal FY12 SOW or its normal funding. Page 23 of 64
spatial data set. The types of errors are then identified and a contingency table is produced showing the map class errors and what they were missed to. Validation is not a true verification of map class type in the field, however can provide the user of the map with useful information that is very similar to a field accuracy assessment. Validation would involve generating random points based on area for all map classes. Two individuals not involved with the mapping would review each of the points onscreen and record an agreed upon map class. This data would then would be entered into a database and compared to the map. The types of errors are then identified and a contingency table is produced showing the map class errors and the map classes they were missed to. Accuracy Assessment Project study areas identified for a field accuracy assessment are Pools 13 and La Grange, UMRS. These are LTRM focal pools and LTRM field station staff associated with these pools have the appropriate skills to conduct the field portion of the accuracy assessment. By targeting these pools, travel costs can be minimized. Once a pool’s LCU spatial data set is finalized, a thematic accuracy assessment will be performed on that pool to determine the accuracy of the map classes. All General Wetland Vegetation Map Classes (Dieck and Robinson 2004) representing National Vegetation Classification Standard (NVCS) natural/semi-natural types (Table 1) (FGDC 2008) will be assessed using the stratified random sampling scheme described in the Thematic Accuracy Assessment Procedures: Version 2.0 (Lea 2010). UMESC staff will use these guidelines to determine the appropriate buffer and the number of sites for each map class in each pool.
1These items were deferred from FY11 and are not considered to as part of the normal FY12 SOW or its normal funding. Page 25 of 64
where R is the radius distance of the observation area, F is the expected (e.g., 90th percentile) field positioning (GPS) error distance, and M is the standard requirement (maximum positional error distance in the map) for positional accuracy. The minimum mapping unit (MMU) for the 2010/2011 LCU spatial data sets north of Lock & Dam 13, UMRS is 0.4 ha (1 acre). Given this MMU, the radius length of a circular 0.4 ha area is 36 meters, representing the value of R. The value of F is generalized to 15 meters, and the value of M is generalized to 12 meters. Therefore, a buffer distance of 41 meters will be applied to the interior polygon boundaries north of Lock & Dam 13. The minimum mapping unit (MMU) for the 2010/2011 LCU spatial data sets south of Lock & Dam 13, UMRS and the Illinois River is 1.0 ha (2.47 acre). Given this MMU, the radius length of a circular 1.0 ha area is 56 meters, representing the value of R. The value of F is generalized to 15 meters, and the value of M is generalized to 12 meters. Therefore, a buffer distance of 59 meters will be applied to the interior polygon boundaries south of Lock & Dam 13, UMRS and the Illinois River. Once the number of sites is determined and the buffer is applied, random AA points will be generated for each map class using Hawth’s Tools for ArcGIS (Beyer, H.L. 2004), or equivalent tool. These AA-site coordinates (UTM projection, Zone 15 or Zone 16, using NAD83) will be provided to the field crews to upload into GPS receivers to navigate. UMESC will provide the field crews with 1:12,000-scale hard-copy maps displaying the locations of the accuracy assessment sites, land stewardship, and the pools boundary overlaid on the CIR imagery. Field observation data will be collected by field station staff. At the start of the project, UMESC staff will support the collection of accuracy assessment points, assist in planning and liaison with field station staff, and lead the training for the field crews. In addition, UMESC will complete a mid-season field visit with the field crews to ensure data collection standards are being maintained. Field crews will navigate to the pre-selected AA sites using GPS and the hard-copy maps. Using a field key, the field crews will determine the appropriate General Wetland Vegetation Class. Field crews will assess a circular area approximately the size of the minimum mapping unit. It is important for the crews to do this assessment in a single vegetation community (i.e., not crossing into another vegetation type). In instances where the point selection process is not able to select points with an adequate distance from other vegetation polygons because the vegetation type was in a very small or linear polygon, the hard-copy maps with AA points will include lines that mark the interpreted boundaries between two map classes. Within the target assessment area, crews will record GPS coordinate location in the field, dominant species, environmental data, and pertinent comments on the LTRM Accuracy Assessment Field Form . The field key will direct the crew to the General Wetland Vegetation Class that best fits the site, and the map class will also be recorded. If the area was not homogeneous (containing more than one General Wetland Vegetation Class), a second General Wetland Vegetation Class can also be listed on the data sheet. Lastly, problems encountered while keying out the AA point will also be recorded. Throughout the field season, the LTRM Accuracy Assessment Field Forms will be sent to UMESC where data entry will be done by students. The data will be entered into an Access database, developed by UMESC staff. The database will subsequently be reviewed by a second individual for data entry errors. Once the data entry is complete, UMESC staff will complete a spatial join of the AA data with the LCU shapefile layer, and two individuals not involved with the initial mapping process will complete analyses of the map’s accuracy. During this process, the class determined in the field is compared to the designation on the map for each point. If map and field determinations are conflicting, then an attempt is made to reconcile the difference. Differences may occur when points fall in transition zones between
1These items were deferred from FY11 and are not considered to as part of the normal FY12 SOW or its normal funding. Page 26 of 64
map class types or in areas that are too small to map. GPS errors also account for some discrepancies. These kinds of errors, termed false errors, are corrected, reconciling the land cover map with the field determinations. After false errors have been identified and reconciled, a contingency table is generated (Table 2). The contingency table shows the accuracy of each map class (along with 90% confidence intervals), with the users’ accuracy reflecting errors of inclusion (commission errors) and producers’ accuracy reflecting errors of exclusion (omission errors) for each map class. The width of each confidence interval is affected by the sample size used to derive the point estimate. The contingency table also shows the frequency of agreement and placement of disagreements among map classes, as well as the overall accuracy of the map. The goal is to meet the standard of 80% accuracy set by the National Park Service (Environmental Systems Research Institute et al. 1994; Lea 2010) across all assessed map classes. Validation Project study areas identified for a validation are Pools 13, 26, and Open River South. Note that Pool 13 is targeted for both a thematic accuracy assessment and a validation. Completing both methods on one LCU spatial data set will give a direct comparison between the two methods. If methods prove to be similar in results, the more cost effective option of validation can be used in land cover mapping conducted in future assessments. Once a pool’s LCU spatial data set is finalized, a validation will be performed on the selected pools to determine the accuracy of the map classes. All General Wetland Vegetation Map Classes (Dieck and Robinson 2004) (Table 3) will be assessed using the stratified random sampling scheme described in the Thematic Accuracy Assessment Procedures: Version 2.0 (Lea 2010). UMESC staff will use these guidelines to determine the appropriate number of sites for each map class in each pool. The number of samples needed for each map class will be determined for each pool, in the same manner as for the accuracy assessment. UMESC will buffer each sampling site 14 meters from the polygon boundary to eliminate the possibility that the observed area is of mixed map class identity due to allowable positional error in the map data. The National Map Accuracy Standard requirement for positional accuracy of 1:24,000 scale products is 12.2 meters (FGDC, 1998). Once the number of sites is determined and the buffer is applied, random validation points (UTM projection, Zone 15 or Zone 16, using NAD83) will be generated for each map class using Hawth’s Tools for ArcGIS (Beyer, H.L. 2004), or equivalent tool. A team of two individuals not involved with the initial mapping process will complete the validation of the map’s accuracy. This team will use the ‘General classification handbook for floodplain vegetation in large river systems’ by Dieck and Robinson (2004) to determine the appropriate General Wetland Vegetation Class. The team will assess an area around the validation point approximately the size of the minimum mapping unit. The agreed upon General Wetland Vegetation Class that best fits the area will be recorded in an Access database. If the two individuals cannot agree on the appropriate map class or the area assessed was not homogeneous (containing more than one General Wetland Vegetation Class), a second General Wetland Vegetation Class can be listed in the
1These items were deferred from FY11 and are not considered to as part of the normal FY12 SOW or its normal funding. Page 27 of 64
Table 2. Example of an accuracy assessment contingency table. Columns tabulate the producer’s accuracy by showing errors of exclusion (omission errors) present in the map. Rows tabulate the users’ accuracy by showing errors of inclusion (commission errors) present in the map. The overall accuracy of the map is also reported.
FIELD SAMPLES - REFERENCE DATA COMISSION
MAP CODES SV RFA DMP SMA SMP SM WM DMS SMS WMS SS FF PC SC LF UF GR PS TOTAL


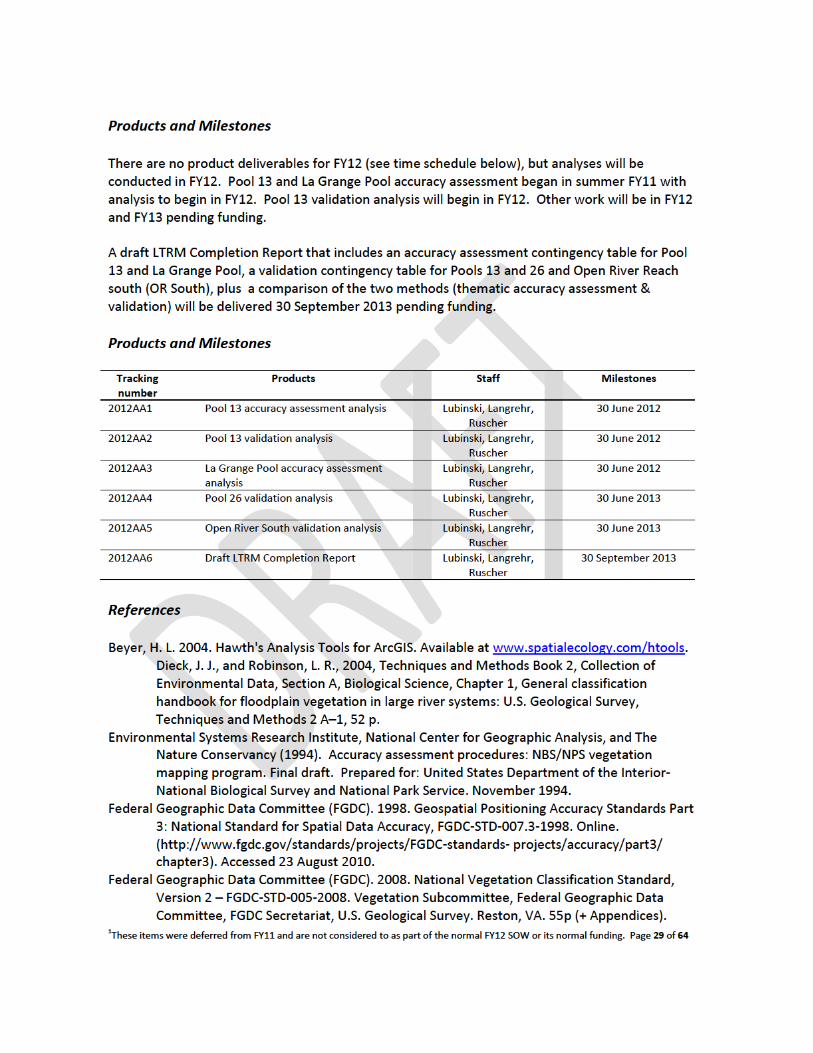


![Fy05 07 Strategic Plan[1]](https://static.documents.pub/doc/80x56/558a9d49d8b42ad4108b467b/fy05-07-strategic-plan1.jpg)


