Page 1
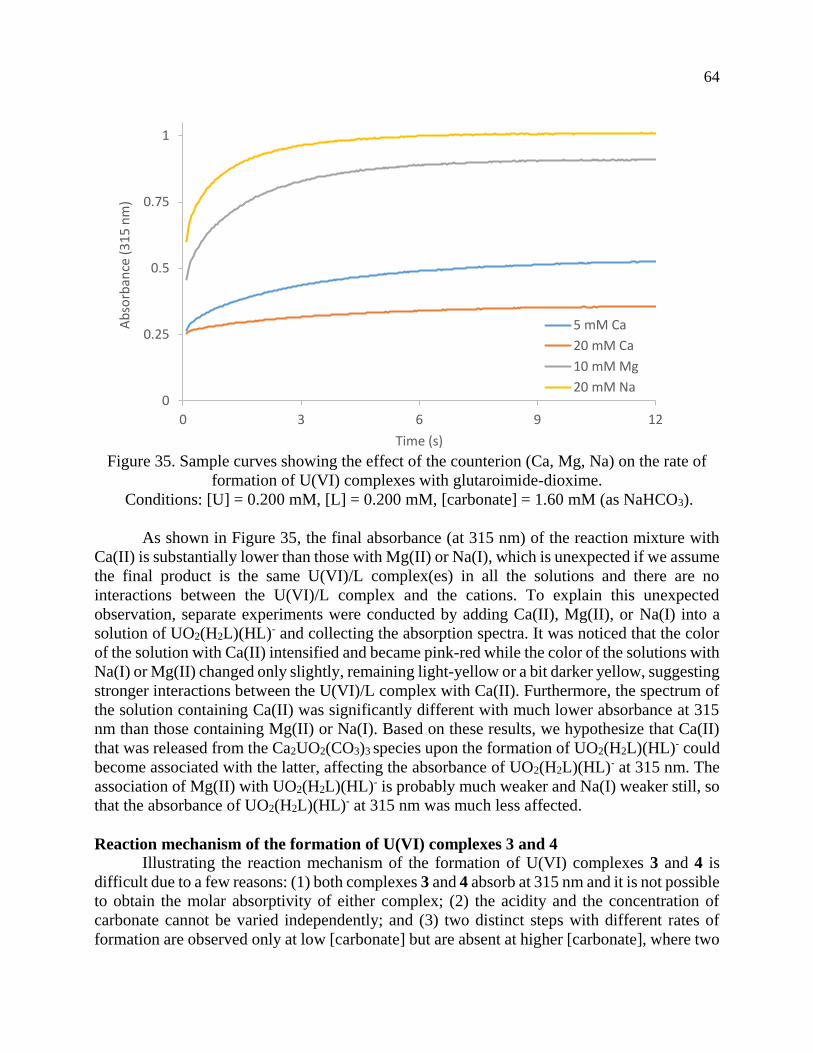
Uranium and vanadium binding studies for the
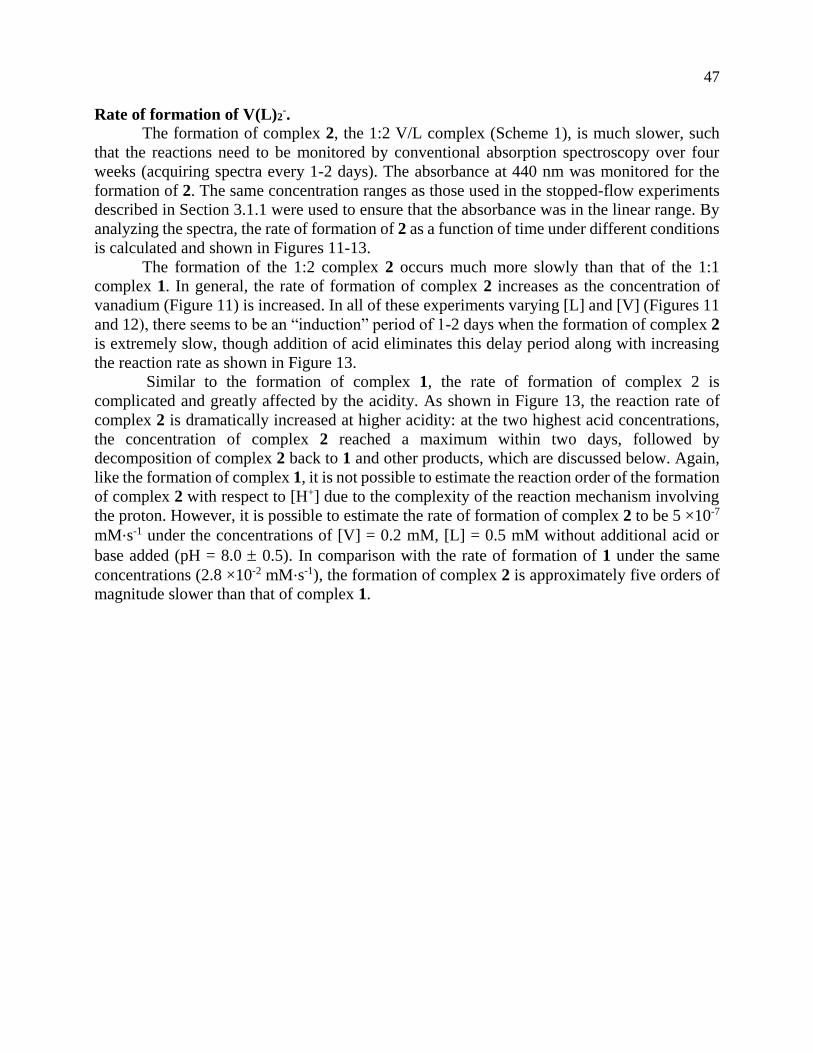
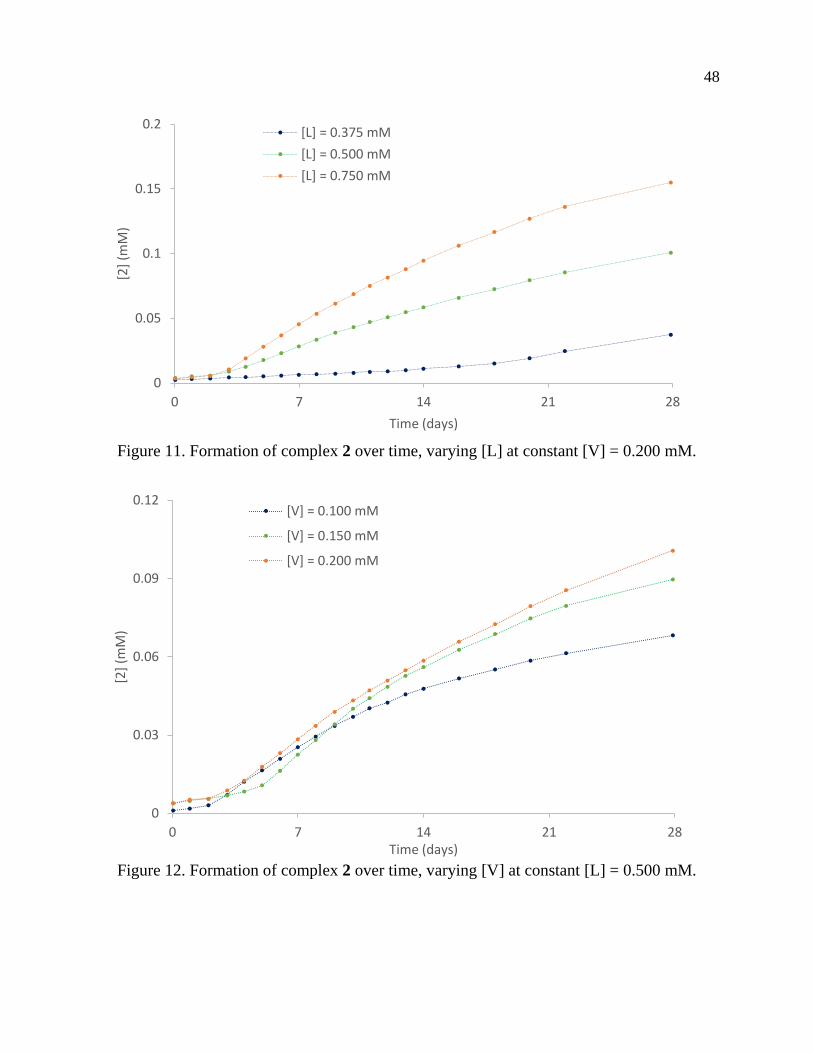
selective extraction of uranium from seawater
By
Bernard Frederick Parker
A dissertation submitted in partial satisfaction of the
requirements for the degree of
Doctor of Philosophy
in
Chemistry
in the
Graduate Division
of the
University of California, Berkeley
Committee in charge:
Professor John Arnold, Chair
Professor T. Don Tilley
Professor Alexander Katz
Summer 2017
Page 3
1
Abstract Uranium and vanadium binding studies for the selective extraction of uranium from seawater
by
Bernard Frederick Parker
Doctor of Philosophy in Chemistry
University of California, Berkeley
Professor John Arnold, Chair
Chapter 1
An introduction to the uranium from seawater project.
Chapter 2
A non-oxo V(V) complex with glutaroimide-dioxime (H3L), a ligand for recovering uranium
from seawater, was synthesized from aqueous solution as Na[V(L)2]2H2O, and the structure
determined by x-ray diffraction. It is the first non-oxo V(V) complex that has been directly
synthesized in and crystallized from aqueous solution. The distorted octahedral structure
contains two fully deprotonated ligands (L3-) coordinating to V5+, each in a tridentate mode.
Using 17O-labelled vanadate, concurrent 17O/51V/1H/13C NMR, in conjunction with ESI-MS,
unprecedentedly demonstrated the stepwise displacement of the oxo V=O bonds by
glutaroimide-dioxime and verified the existence of the “bare” V5+/glutaroimide-dioxime
complex, [V(L)2]-, in aqueous solution. In addition, the crystal structure of an intermediate 1:1
V(V)/glutaroimide-dioxime complex, [VO2(HL)]-, in which the oxo bonds of vanadate are only
partially displaced, corroborates the observations by NMR and ESI-MS. Results from this work
provide important insights into the strong sorption of vanadium on poly(amidoxime) sorbents
in the recovery of uranium from seawater. Because vanadium plays important roles in
biological systems, the direct synthesis of the non-oxo V5+ complex and the unprecedented
demonstration of the displacement of the oxo V=O bonds may also help with the ongoing
efforts to develop vanadium compounds that could be of importance in biological applications.
Chapter 3
The kinetics of the binding of uranium, vanadium, and iron with glutaroimide-dioxime as a
molecular analogue of polymer sorbents has been studied using stopped-flow and conventional
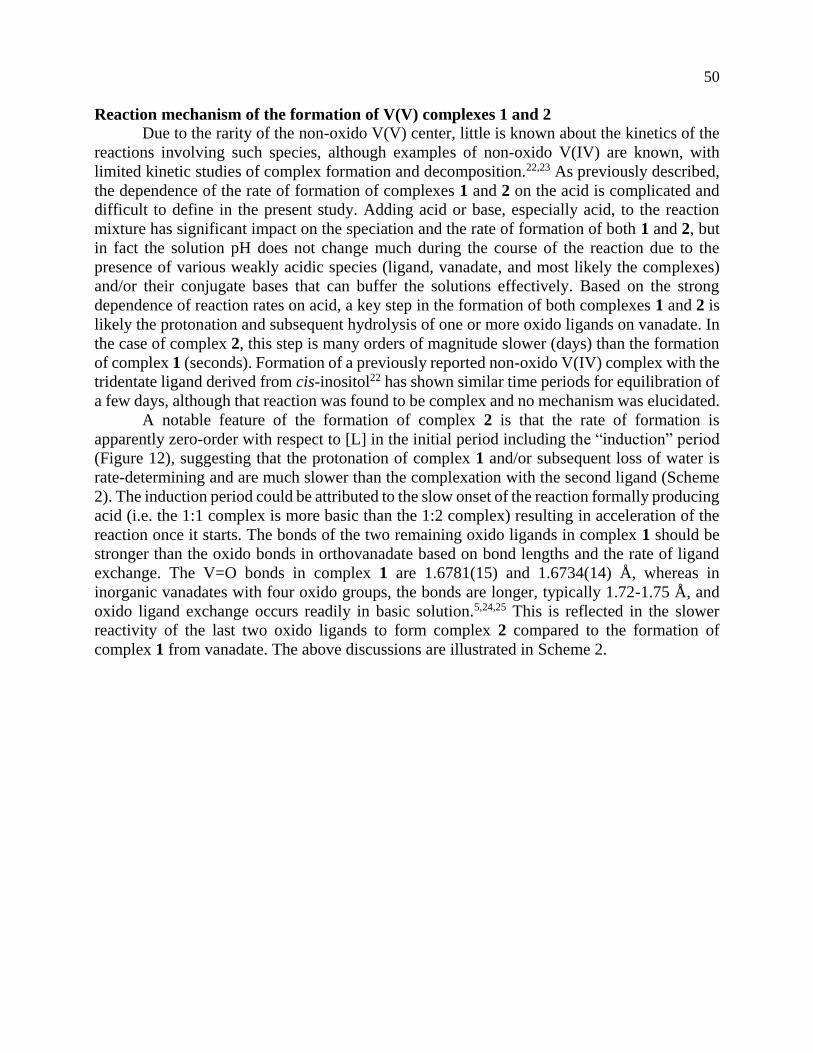
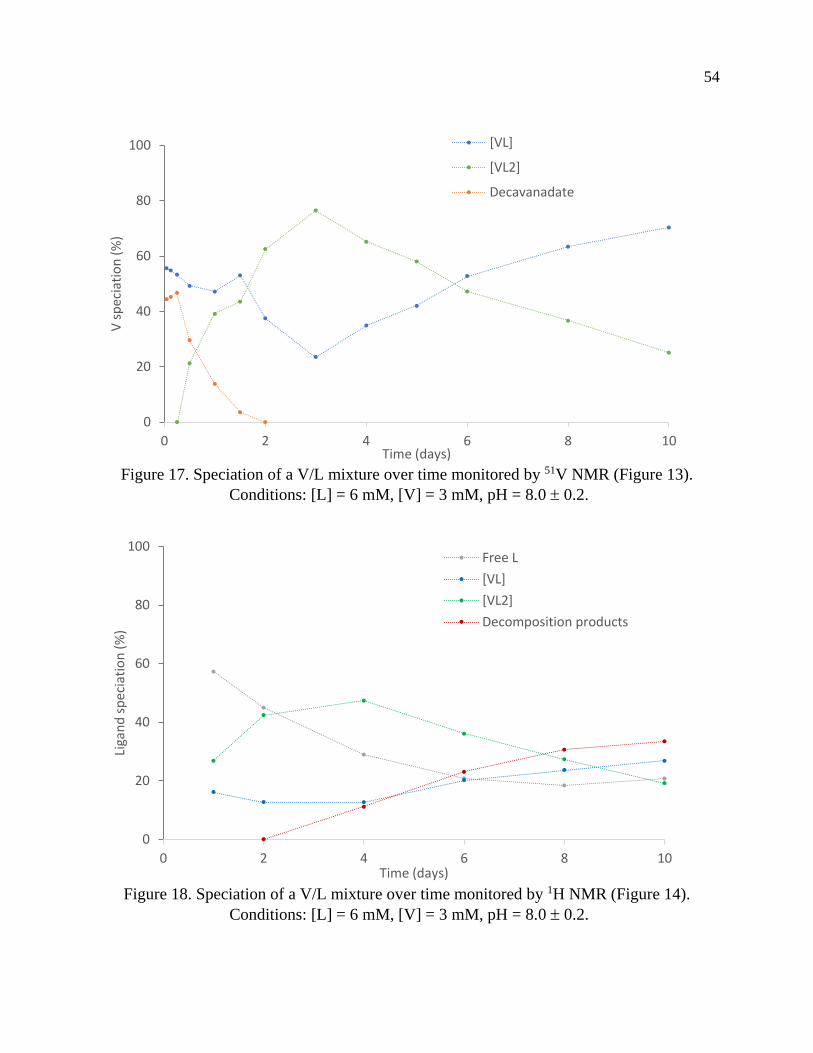
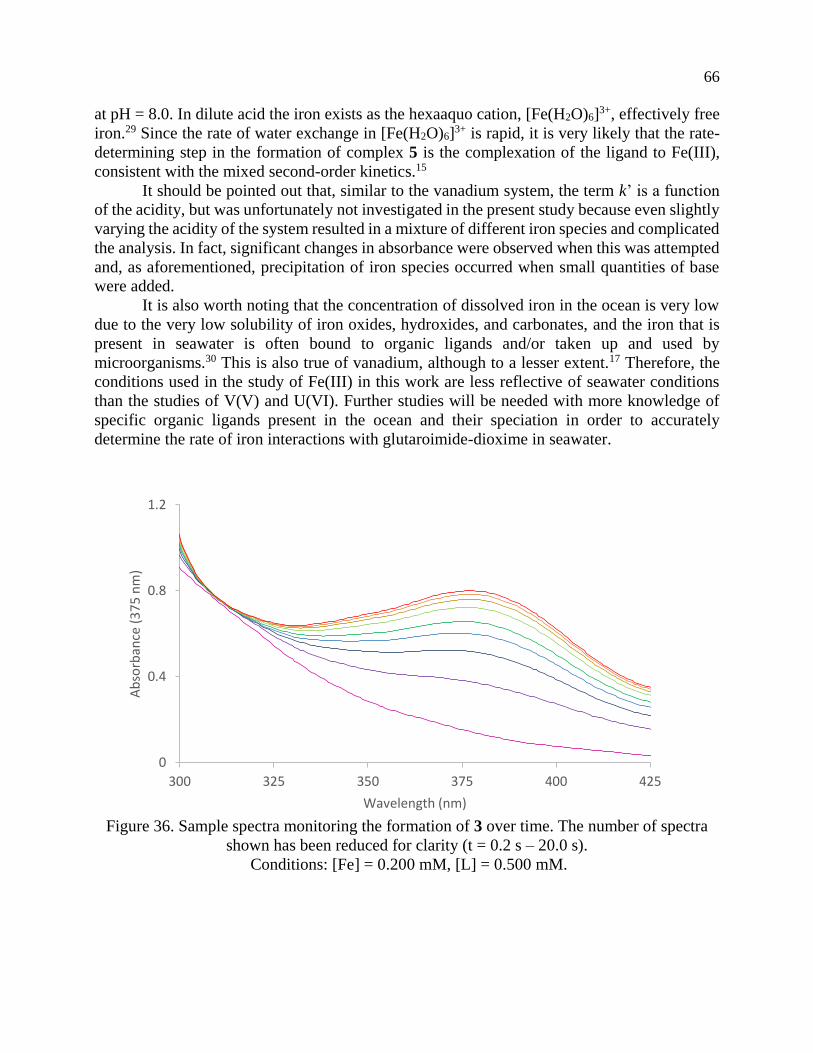
UV-visible absorption spectroscopy to monitor the reactions over a range of time scales.
Qualitatively, vanadium reacts the slowest of the three metals despite being able to form a very
strong complex, with the 1:2 vanadium/ligand complex forming over weeks, likely due to the
slow hydrolysis of the strong oxido ligands, while iron reacts fast and uranyl faster still, despite
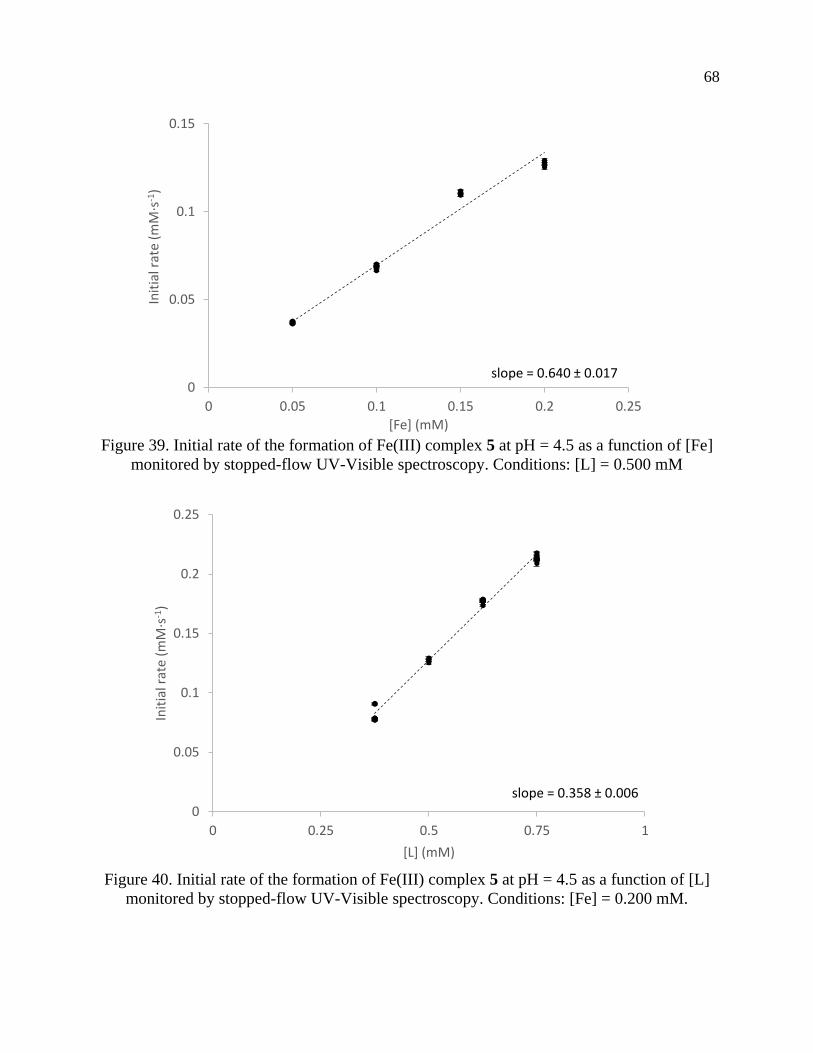
the presence of carbonate in the uranyl species. Conditional rate constants were determined for
the formation of 1:1 glutaroimide-dioxime complexes with the three metal ions. In a narrow
and near neutral pH region, a rate equation for the formation of the 1:1 vanadium/glutaroimide-
dioxime complex was developed, showing the reaction is the first order with respect to [V],
[ligand], and [H+]. These observations, some qualitative and others quantitative, are consistent
Page 4
2
with previous marine tests of polymer adsorbents, and give mechanistic insight into how
glutaroimide-dioxime forms complexes with uranium, iron, and vanadium.
Chapter 4
Interactions of vanadium(IV) with amidoximes and similar ligands as molecular analogues of
polymer sorbents used to extract uranium from seawater is explored. Vanadium is one of the
main competing ions for uranium sorption as V(V) species, however, vanadium is also present
as V(IV) in seawater so this reaction is of interest to U/V selectivity and polymer stability. The
synthesis of V(IV) complexes of glutaroimide-dioxime was attempted under a wide variety of
conditions, however, V(IV) was found to react irreversibly with glutaroimide-dioxime and
other oxime groups which oxidize vanadium to the V(V) oxidation state by transferring an
oxygen atom from the ligand or substrate. A mechanism has been proposed for this type of
reactivity, and the redox behavior of the vanadium-glutaroimide-dioxime complex has been
characterized.
Chapter 5
A triazine hydroxylamine ligand, H2bihyat, has been investigated for its potential application
to selective uranyl binding for extraction from seawater. The vanadium chemistry of this ligand
is known; compared to glutaroimide-dioxime the binding is significantly weaker and it does
not form a 2:1 non-oxido V(V) complex. This ligand has a very similar binding group
configuration as glutaroimide-dioxime, and through potentoimetry it was found to be
comparable in binding ability. NMR techniques were used to confirm the stoichiometry and
species proposed by potentiometry over a wide pH range. Additionally, the 1:1 complex
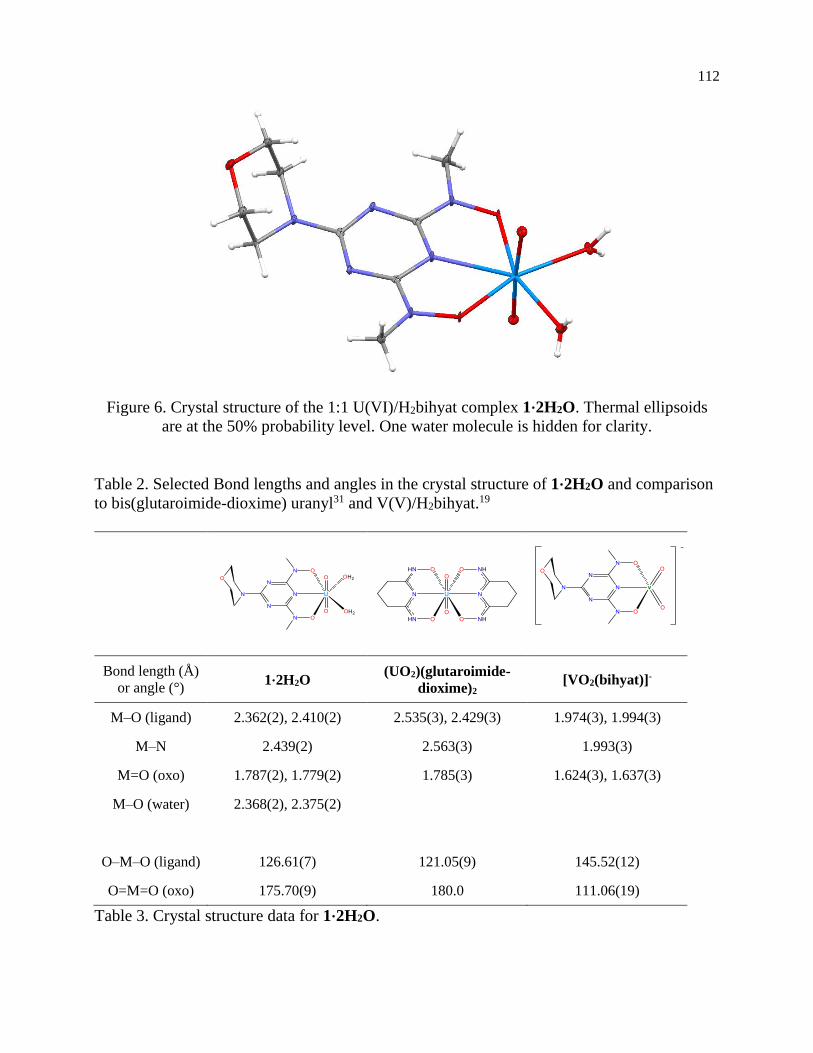
UO2(bihyat) was isolated and the crystal structure obtained. Solid-state binding is also similar
to glutaroimide-dioxime, further suggesting that this ligand may be a feasible alternative to
glutaroimide-dioxime, but with much improved selectivity over vanadium.
Chapter 6
As a new strategy to discover new ligands for the selective binding of uranyl, a combinatorially
synthesized peptoid library (N-substituted glycine oligomers) was screened for uranyl binding
with the goal of identifying high-affinity ligands for use in polymer sorbents. Qualitative
screening techniques using a dye, arsenazo III, identified three uranyl-binding sequences, all
of which contained only carboxylic acids as the active binding groups. Fluorescence
spectroscopy was used to determine a dissociation constant for one of the identified peptoids
by monitoring the decrease in peptoid fluorescence upon uranyl binding. Density functional
theory calculations were used to model the solution-state binding of these sequences to
understand favored binding modes and geometries.
Page 5
i
Table of Contents
Chapter 1
Introduction to the uranium from seawater project
1
References
8
Chapter 2
Synthesis and characterization of a rare non-oxido V(V) complex
from aqueous solution Introduction 12
Experimental 15
Results and discussion 17
Summary and conclusions 31
References
32
Chapter 3
Kinetic studies of glutaroimide-dioxime binding to V(V), U(VI),
and Fe(III) Introduction 35
Experimental 38
Results and discussion 40
Summary and conclusions 72
References
73
Chapter 4
Redox activity of vanadium complexes of glutaroimide-dioxime
Introduction 76
Experimental 78
Results and discussion 80
Summary and conclusions 97
References 98
Chapter 5
Uranyl binding studies with a 1,3,5-triazine hydroxylamine ligand
Introduction 101
Experimental 104
Results and discussion 106
Summary and conclusions 117
References
118
Page 6
ii
Chapter 6
An alternative approach to selective U(VI) extraction from
seawater using a combinatorial peptoid ligand system
Introduction 121
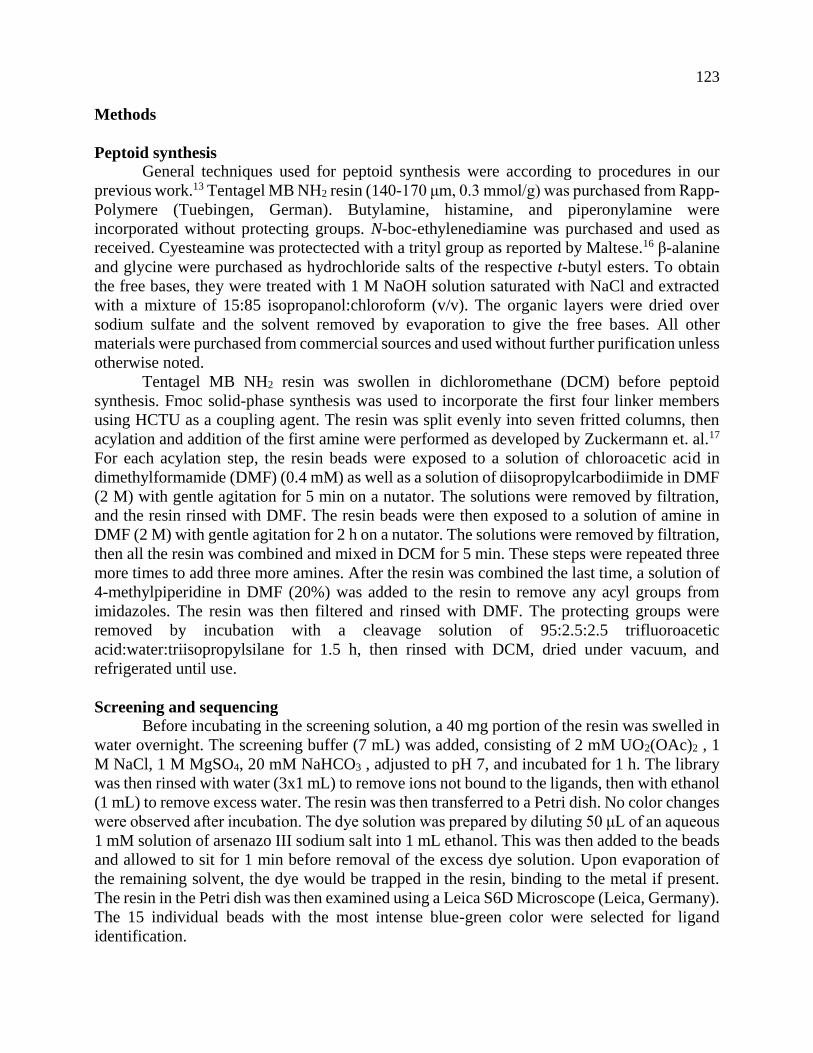
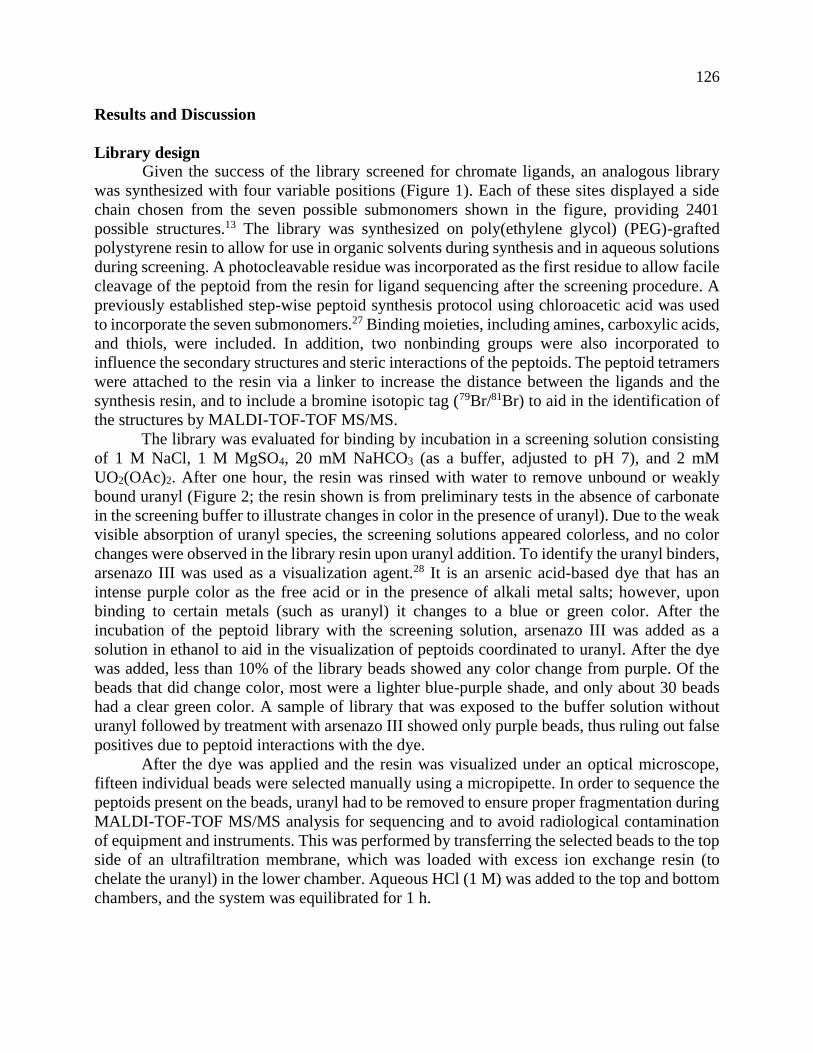
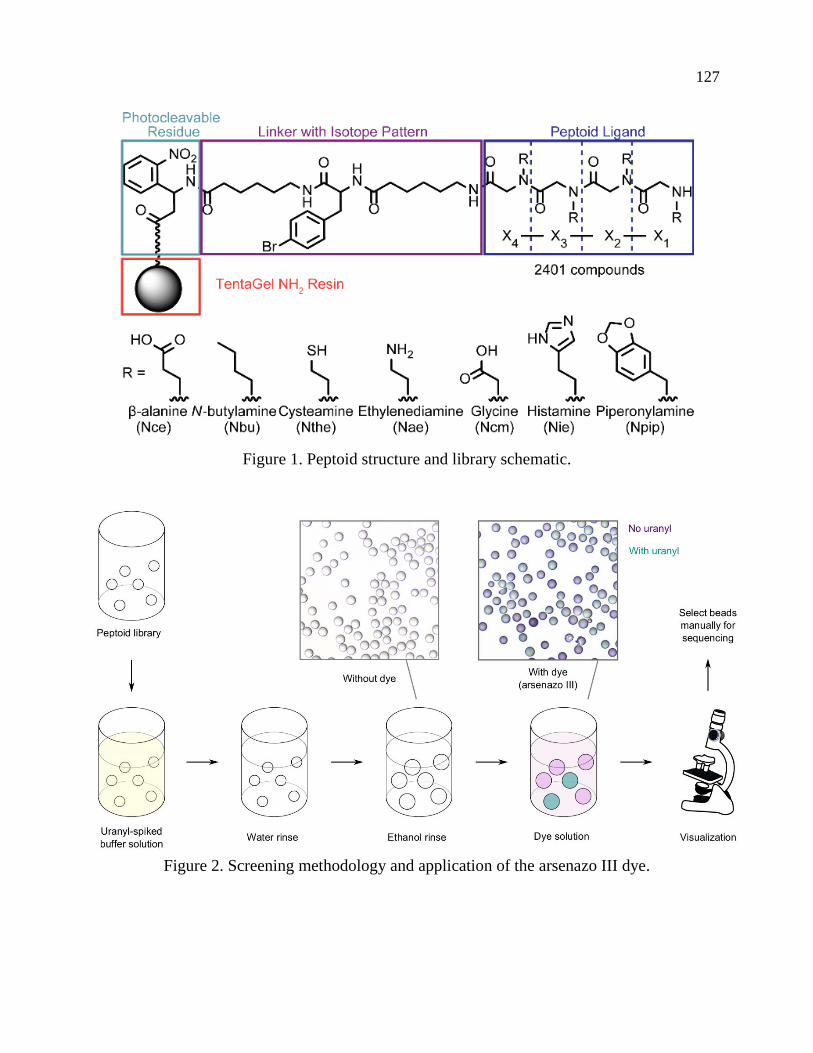
Experimental 123
Results and Discussion 126
Summary and conclusions 136
References 137
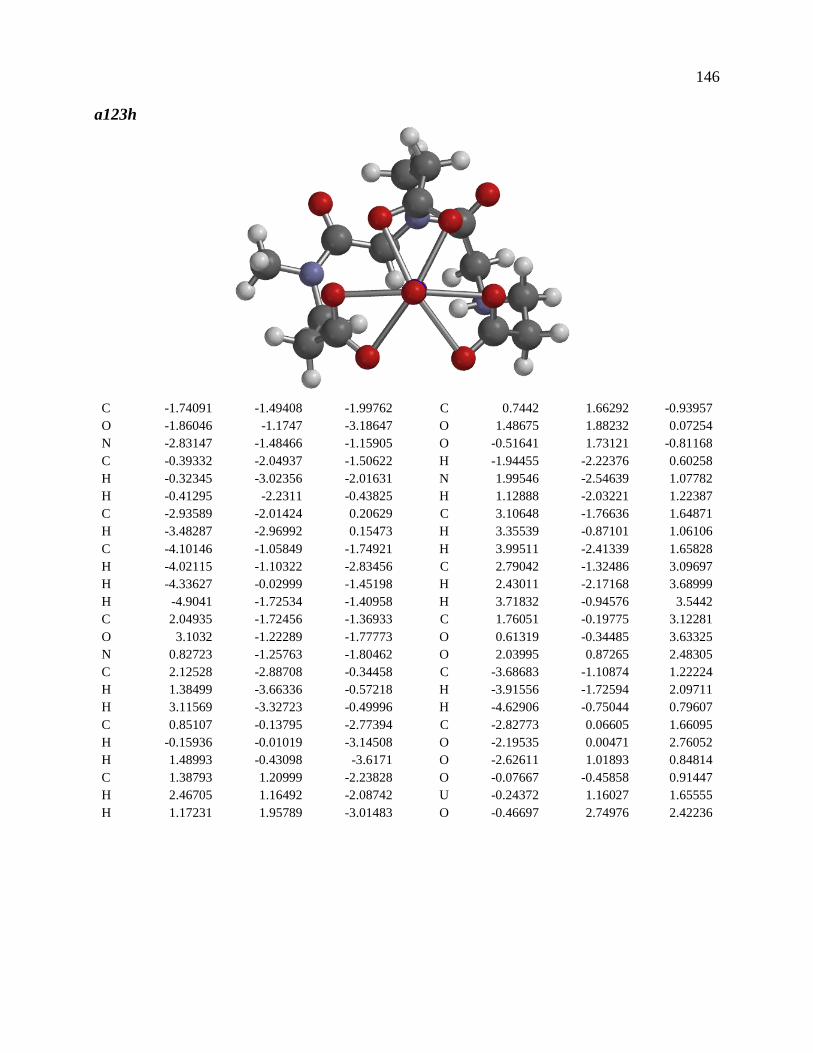
Full DFT coordinates for calculated structures
139
Page 7
iii
Curriculum Vitae
Education
University of California, Berkeley, Berkeley CA
Doctor of Philosophy in Chemistry August 2017
Carnegie-Mellon University, Pittsburgh PA
Bachelor of Science in Chemistry May 2012
Publications
Parker, B. F., Hohloch, S., Pankhurst, J. R., Zhang, Z., Love, J. B., Arnold, J., Rao, L.
Vanadium redox reactivity with amidoxime ligands
Manuscript in preparation
Parker, B. F., Zhang, Z., Arnold, J., Rao, L.
Iron, vanadium, and copper complexation with amidoxime ligands
Manuscript in preparation
Garner, M. E., Parker, B. F., Hohloch, S., Bergman, R. G., Arnold, J.
Catalytic hydrophosphination by a thorium-NHC metallacycle
Manuscript submitted
Hohloch, S., Pankhurst, J. R., Jaekel, E. E., Parker, B. F., Lussier, D. J., Garner, M. E.,
Booth, C. H., Lukens, W. W., Love, J. B., Arnold, J.
Benzoquinonoid-bridged dinuclear actinide complexes
Manuscript submitted
Hohloch, S., Garner, M. E., Parker, B. F., Arnold, J.
New supporting ligands in actinide chemistry: Tetramethyltetraazaannulene complexes with
thorium and uranium
Manuscript submitted
Ivanov, I. S., Leggett, C. J., Parker, B. F., Zhang, Z., Arnold, J., Dai, S., Abney, C. W.,
Bryantsev, V. S., Rao, L.
Origin of the unusually strong and selective binding of vanadium by polyamidoximes in
seawater
Manuscript submitted
Page 8
iv
Parker, B. F., Leggett, C. J., Zhang, Z., Arnold, J., Rao, L.
Kinetics of complexation of V(V), U(VI), and Fe(III) with glutaroimide-dioxime: studies by
stopped-flow and conventional absorption spectroscopy
Dalton Transactions, 2017, DOI: 10.1039/C7DT01597F
Boreen, M. A., Parker, B. F., Lohrey, T. D., Arnold, J.
A Homoleptic Uranium(III) Tris(aryl) Complex
Journal of the American Chemical Society, 2016, 138 (49), 15865-15868
Parker, B. F., Knight, A. S., Vukovic, S., Arnold, J., Francis, M. B.
A Peptoid-Based Combinatorial and Computational Approach to Developing Ligands for
Uranyl Sequestration from Seawater
Industrial & Engineering Chemistry Research, 2016, 55 (15), 4187-4194
Leggett, C. J., Parker, B. F., Teat, S. J., Zhang, Z., Dau, P. D., Lukens, W. W., Peterson, S.
M., Cardenas, A. J. P., Warner, M. G., Gibson, J. K., Arnold, J., Rao, L.
Structural and spectroscopic studies of a rare non-oxido V(V) complex crystallized from
aqueous solution
Chemical Science, 2016, 7 (4), 2775-2786
Wang, Y., Zhang, Y., Parker, B., Matyjaszewski, K.
ATRP of MMA with ppm Levels of Iron Catalyst
Macromolecules, 2011, 44 (11), 4022–4025
Presentations
"Binding modes and thermodynamics of iron and vanadium with amidoximes"
Parker, B. F., Zhang, Z., Arnold, J., Rao, L.
243rd ACS National Meeting and Exposition, San Francisco CA, April 2017
"Aqueous vanadium complexation with imide-dioxime ligands"
Parker, B. F., Zhang, Z., Arnold, J., Rao, L.
242nd ACS National Meeting and Exposition, Philadelphia PA, August 2016
"Combinatorial peptoid ligand screening for uranyl binding"
Parker, B. F., Knight, A. S., Vukovic, S., Arnold, J., Francis, M. B.
249th ACS National Meeting and Exposition, Denver CO, March 2015
Page 9
v
Dedicated to
Frederick Arthur Gowen
my grandfather,
in loving memory
Page 10
1
Chapter 1
Introduction to the uranium from seawater project
Page 11
2
The recovery of uranium from seawater has received considerable attention in the last
few years due to the size of this yet-untapped source, containing 4.5 billion tons of uranium,
over a thousand times more than the entire known terrestrial supply.1,2 Development of an
efficient and economical technology for recovering uranium from seawater could therefore
make the world’s oceans a nearly limitless source of fuel for nuclear reactors. The
concentration of uranium in the ocean is low, at approximately 3.3 parts per billion;
additionally, seawater contains trace amounts of almost every naturally-occurring element, so
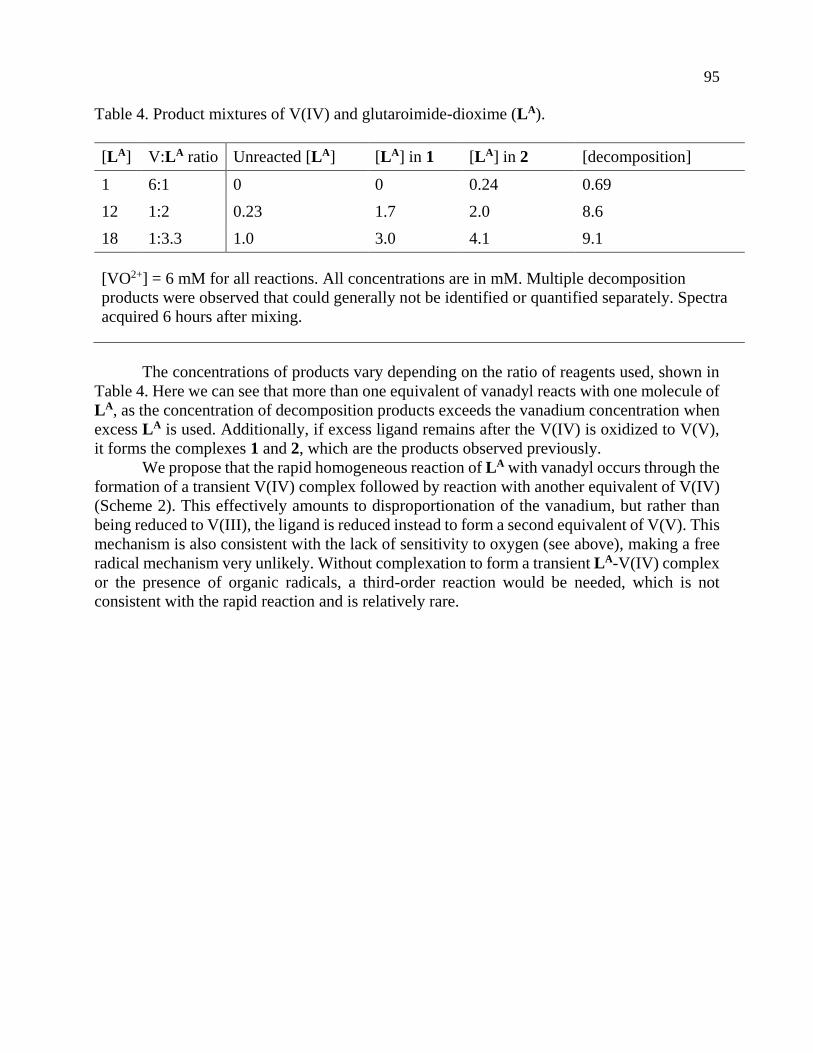
high selectivity is necessary for efficient extraction. Table 1 lists the concentrations of selected
metals in seawater for comparison.
Table 1. Abundance of selected ions in seawater1
Metal Concentration Notes
Na 1.08 % (w/w) 0.456 M at 3.5% salinity
K 392 ppm 9.7 mM
Ca 411 ppm 40 mM
Li 0.17 ppm 24 μM
Fe 3.4 ppb 59 nM
Cu 0.9 ppb 14 nM
U 3.3 ppb 13 nM as Ca(UO2)(CO3)3 3
V 1.9 ppb 36 nM 80-90% V(V), balance V(IV)4
Au 11 ppt 50 pM
The chemistry of seawater plays a major role in extraction, both in chemical speciation
of metals as well as necessitating working within relatively narrow constraints on extraction
conditions, mainly regarding pH, salinity, and biological activity.1 As a result of pH and other
ions present, the chemical form of uranium in seawater is almost exclusively in the form of
ternary uranium calcium carbonate complexes.3,5 These complexes prove to be problematic for
extraction, as the calcium and carbonate ions all need to be displaced, which is a challenge,
especially considering the high concentrations of each of these ions in seawater. Vanadium is
another element with complicated solution chemistry, both with polynuclear V(V) species as
well as redox chemistry between V(V) and V(IV), which is a minor component of vanadium
in seawater.4,6,7 In general, elements that are taken up and used by marine organisms vary by
season, oceanic depth, temperature, and location, which further complicate optimization of
polymer selectivity.4,8
Of all the trace elements dissolved in seawater, only uranium and lithium are proposed
to be economical to extract.9–11 Base metals such as iron and vanadium are abundant and readily
obtained from the earth's surface, while precious metals such as gold are present in such small
amounts that extraction is not feasible. Indeed, extracting gold has been attempted historically,
notably by Fritz Haber and has invariably lead to huge financial losses.12,13 Lithium is of interest
due to high demand for use in lithium batteries, although extraction technology has not been
developed to the extent of uranium extraction.11
Page 12
3
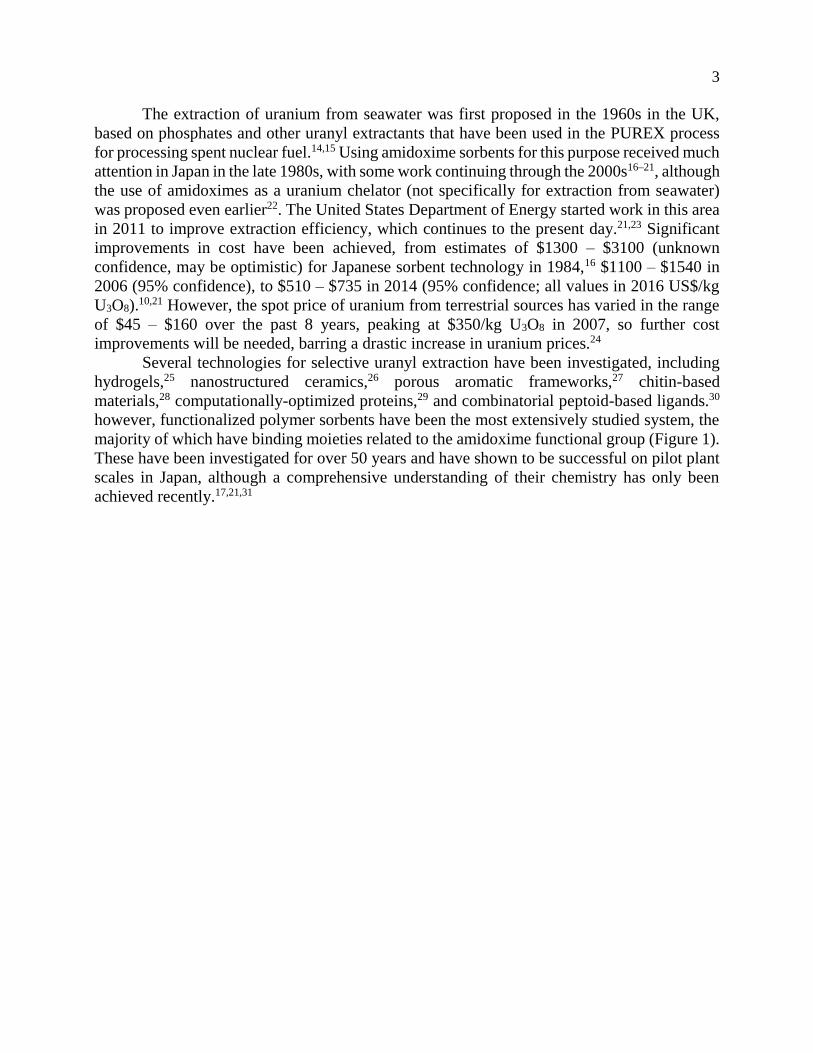
The extraction of uranium from seawater was first proposed in the 1960s in the UK,
based on phosphates and other uranyl extractants that have been used in the PUREX process
for processing spent nuclear fuel.14,15 Using amidoxime sorbents for this purpose received much
attention in Japan in the late 1980s, with some work continuing through the 2000s16–21, although
the use of amidoximes as a uranium chelator (not specifically for extraction from seawater)
was proposed even earlier22. The United States Department of Energy started work in this area
in 2011 to improve extraction efficiency, which continues to the present day.21,23 Significant
improvements in cost have been achieved, from estimates of $1300 – $3100 (unknown
confidence, may be optimistic) for Japanese sorbent technology in 1984,16 $1100 – $1540 in
2006 (95% confidence), to $510 – $735 in 2014 (95% confidence; all values in 2016 US$/kg
U3O8).10,21 However, the spot price of uranium from terrestrial sources has varied in the range
of $45 – $160 over the past 8 years, peaking at $350/kg U3O8 in 2007, so further cost
improvements will be needed, barring a drastic increase in uranium prices.24
Several technologies for selective uranyl extraction have been investigated, including
hydrogels,25 nanostructured ceramics,26 porous aromatic frameworks,27 chitin-based
materials,28 computationally-optimized proteins,29 and combinatorial peptoid-based ligands.30
however, functionalized polymer sorbents have been the most extensively studied system, the
majority of which have binding moieties related to the amidoxime functional group (Figure 1).
These have been investigated for over 50 years and have shown to be successful on pilot plant
scales in Japan, although a comprehensive understanding of their chemistry has only been
achieved recently.17,21,31
Page 13
4
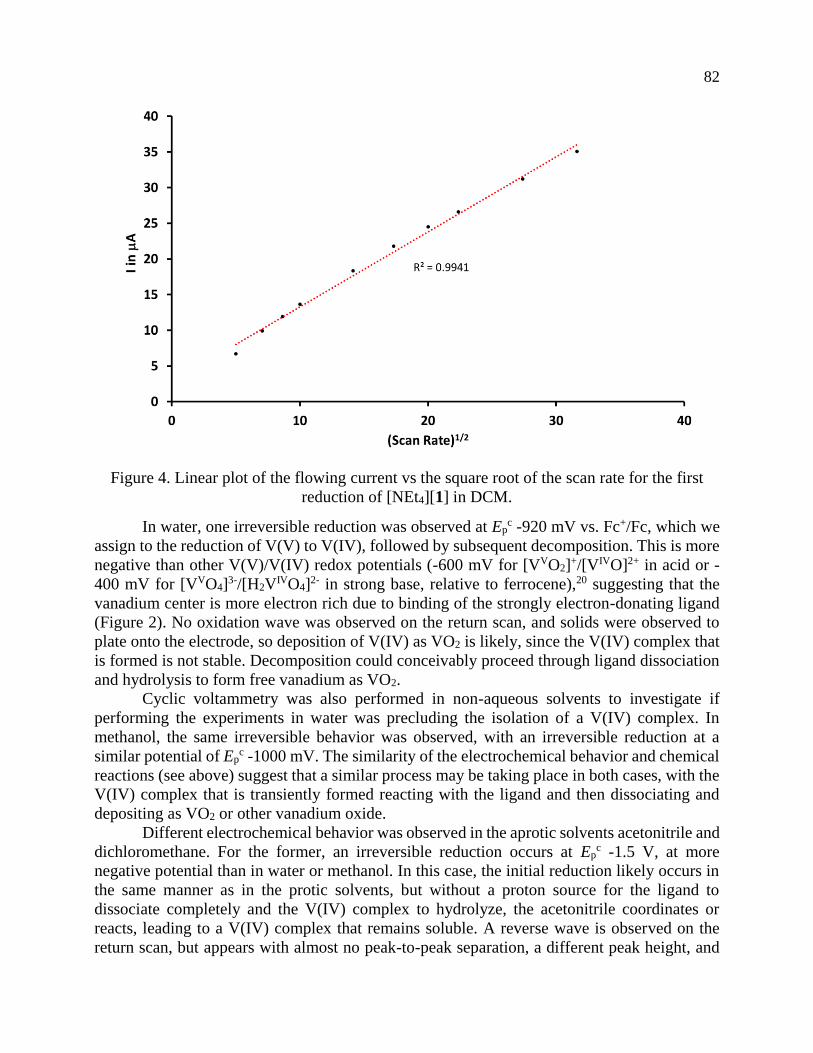
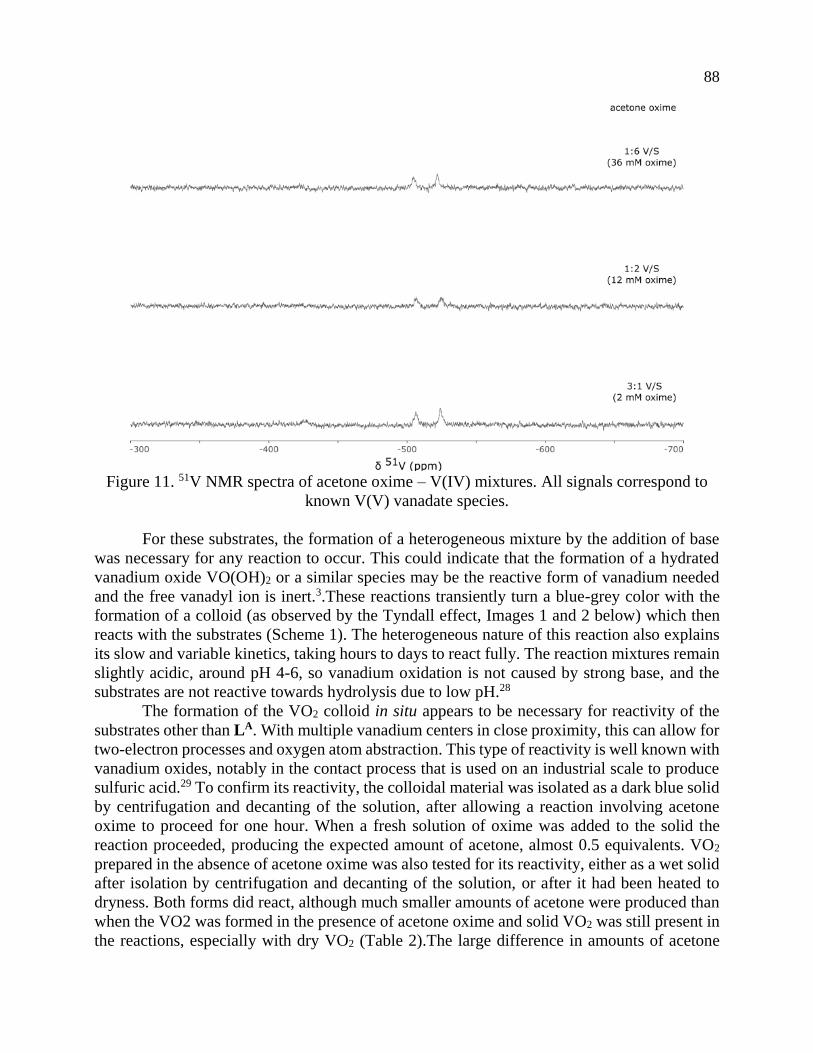
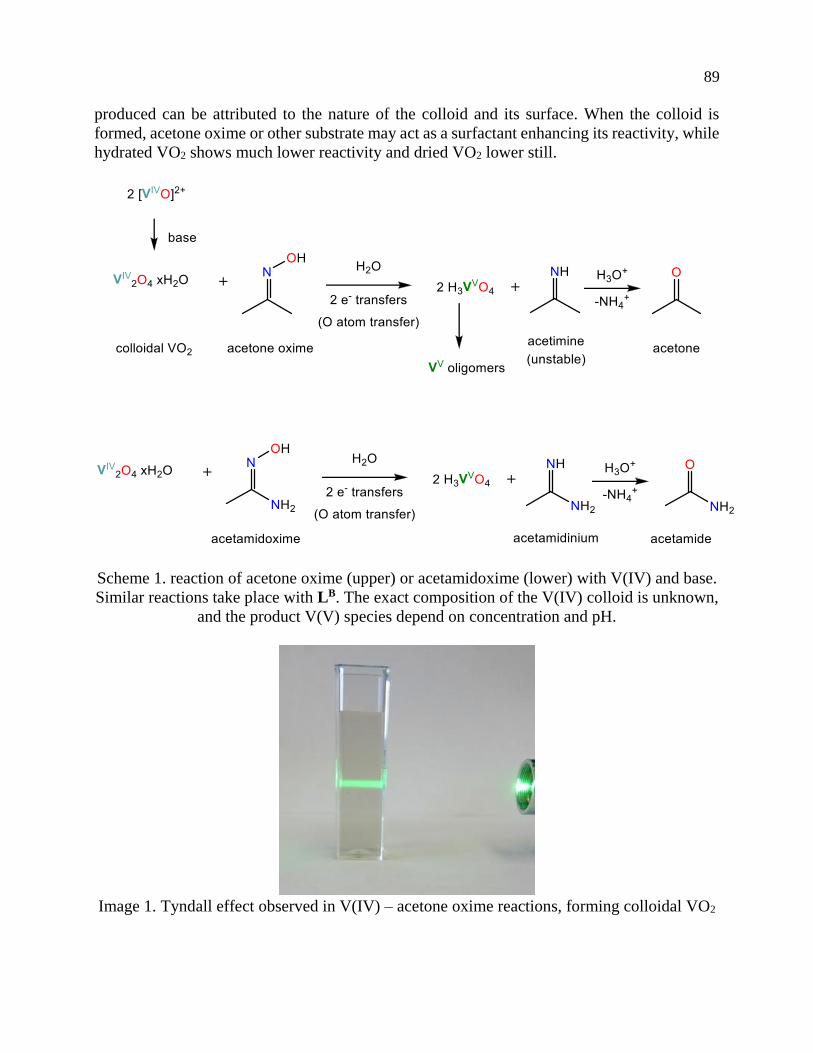
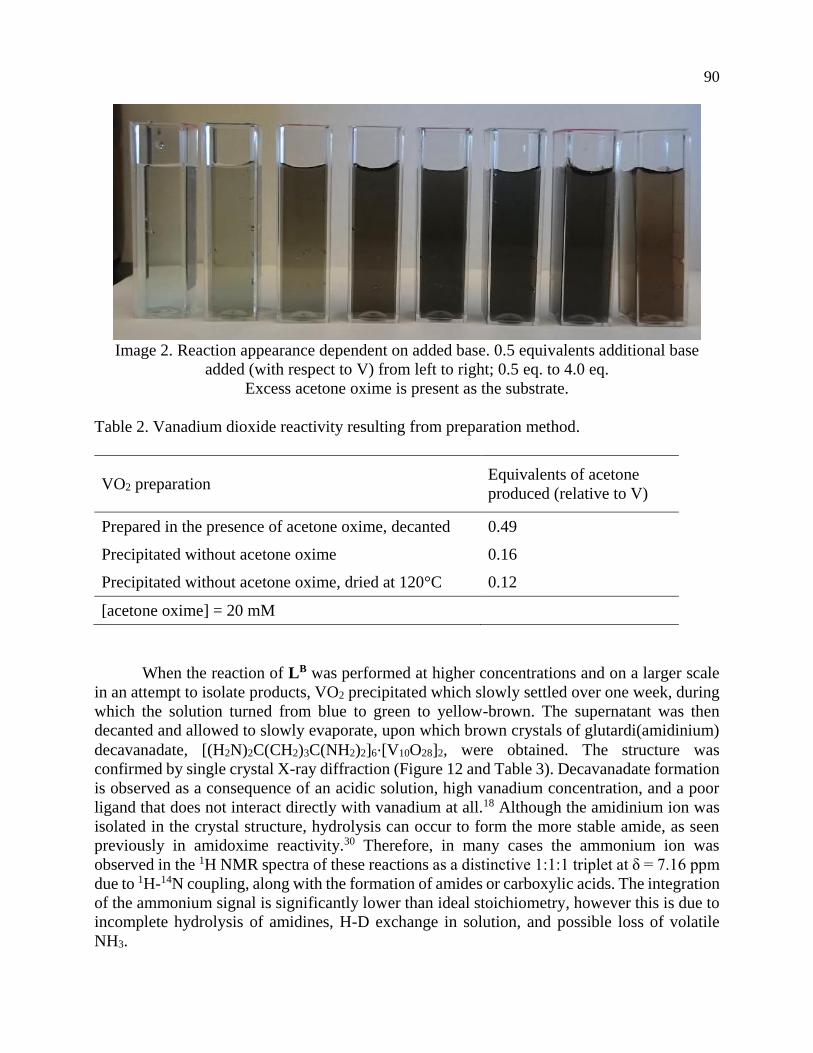
Figure 1. Top: synthesis and structure of polymer sorbents used for uranium extraction from
seawater. Middle: small molecule analogues used as ligands for solution studies, notably
glutaroimide-dioxime. Bottom: metal complexes of glutaroimide-dioxime32–34.
Page 14
5
In efforts to improve sorbent efficiency and ultimately reduce costs, many different
aspects of this technology can be improved. Key areas of study for improvements include
material preparation and characterization2,35–38, polymerization and functionalization39–41,
thermodynamic, kinetic, and structural characterization32,33,42–45, and ligand design30,46,47,
supported by economic assessments10, computational work48–50 and marine testing31,51. These
recent efforts by the Unites States Department of Energy have led to significant increases in
efficiency. Marine test results have been reported in Japan over a decade ago in which the
uranium uptake was 1.5 g U/kg sorbent after 30 days17,21 while more recently, marine tests
conducted in the United States showed that up to 3.9 g U/kg sorbent was obtained after 8
weeks2,38.
Most materials consist of polyacrylonitrile grafted from polyethylene or other support,
followed by treatment with hydroxylamine to form amidoximes, followed by further
conditioning.23,52 Small molecule amidoximes are synthesized almost exclusively by the
analogous reaction of hydroxylamine on organic nitriles (Figure 2).53,54 The amidoxime
functional group typically has one acidic site (OH) and one basic site (NH2), with two pKa
values of approximately 12 and 6, respectively.50,55,56 As ligands, multiple coordination modes
are possible, with metals either interacting with one or two donor atoms (Figure 3). The first
three modes listed are all fairly common, with the last η2 N,O binding mode being relatively
rare, although uranyl is a notable exception.48 Multiple donor atoms also means that suitably-
designed amidoximes readily form clusters and multinuclear complexes. A comprehensive
review of the coordination chemistry of amidoximes has been published recently.54 Although
much of the coordination chemistry of amidoximes, glutaroimide-dioxime and
glutarobis(amidoxime) is relatively recent, these molecules and other similar amidoximes have
been known since at least 1889,57 and their metal binding properties have been applied as
analytical reagents for many metals, including uranium(VI).58–61 The reactivity of these
molecules and other amidoximes has also been explored, which include multiple hydrolysis
pathways, reduction, cyclization to oxazoles, O-alkylation, and numerous other substitution
reactions.53,62
Figure 2. Typical synthesis of amidoximes and acidity of the amidoxime group
Page 15
6
Figure 3. Common coordination modes of amidoximes
In addition to amidoximes, the glutaroimide-dioxime ligand – a condensation product
of two adjacent amidoximes – is a proposed molecular analogue of one of the dominant
functional groups on polymer adsorbents (Figure 1).63,64 In addition to these functional groups,
several other moieties are also present, either through adventitious hydrolysis or intentional
inclusion. Minor functional groups on amidoxime polymers include partially hydrolyzed
imide-oximes43,65, 2,6-diiminopiperidin-1-ol66, as well as amides and carboxylic acids67 (Figure
4). These are generally poorer ligands for uranium binding than the functional groups discussed
above, although the latter two are beneficial in another way by improving the hydrophilicity of
the polymer for more effective and rapid sorption.67–69
Figure 4. Minor functional groups present on amidoxime-based polymer sorbents
One of the major challenges with current amidoxime-functionalized polymer adsorbents
is the relatively low selectivity of these functional groups for uranium over other metals,
vanadium and iron in particular.33,34 For example, 56-day marine tests have shown that the
relative abundance of metal elements absorbed by amidoxime-functionalized polymer
adsorbents (in molar percent) follows the order: vanadium (14.9%) >> iron (1.6%) > uranium
(1.0%), with vanadium occupying nearly 20 times as many sites as uranyl, though the
concentrations of the three elements in seawater are comparable.31 In addition, the stripping
conditions required to elute the sorbed V(V) from the sorbent for reuse are much harsher than
those used to elute uranium and other cations and ultimately destroy the sorbent.65,70
Understanding the coordination chemistry of competing metals, including iron, copper, lead33,
and especially vanadium34,45,71 with glutaroimide-dioxime has been the focus of recent work in
order to overcome selectivity problems of sorbents.
Page 16
7
Within the uranium from seawater project, my work has been in fields of ligand design
as well as characterization of metal coordination to small molecule ligands. Much of the work
has focused on vanadium chemistry due to the previously mentioned problem of selectivity,
understanding its coordination chemistry with amidoximes which had been previously
unknown. Chapter 2 discusses the discovery of a rare non-oxido vanadium(V) complex with
glutaroimide-dioxime, with extensive solution characterization and confirmation of this
binding mode. Chapter 3 compares the kinetics of complexation of uranium as well as iron and
vanadium, the two main competitors for uranium binding, and gaining mechanistic insights
into these systems from kinetic results. Chapter 4 explores the redox activity of the vanadium-
glutaroimide-dioxime complex, both attempting to prepare the analogous vanadium(IV)
compound and investigating the reactions discovered between amidoximes and vanadium(IV).
Chapter 5 characterizes the binding of a 1,3,5-triazine hydroxylamine ligand to uranyl,
examining both solid-state and solution interactions and the ligand's affinity and selectivity for
potential application in polymer sorbents. Finally, Chapter 6 uses an alternate approach to
ligand discovery, using a combinatorial screening technique of peptoid-based ligands to find
new binding moieties rather than direct ligand design.
Page 17
8
References
(1) Turekian, K. K. Oceans; Prentice-Hall: Englewood Cliffs, N. J., 1968.
(2) Kim, J.; Tsouris, C.; Mayes, R. T.; Oyola, Y.; Saito, T.; Janke, C. J.; Dai, S.;
Schneider, E.; Sachde, D. Sep. Sci. Technol. 2013, 48, 367–387.
(3) Endrizzi, F.; Rao, L. Chem. - A Eur. J. 2014, 20, 14499–14506.
(4) Wang, D.; Sañudo Wilhelmy, S. A. Mar. Chem. 2009, 117, 52–58.
(5) Endrizzi, F.; Leggett, C. J.; Rao, L. Ind. Eng. Chem. Res. 2016, 55, 4249–4256.
(6) Emerson, S. R.; Huested, S. S. Mar. Chem. 1991, 34, 177–196.
(7) Heath, E.; Howarth, O. W. J. Chem. Soc. Dalt. Trans. 1981, 1105.
(8) Vraspir, J. M.; Butler, A. Annu. Rev. Mar. Sci. 2009, 1, 43–63.
(9) Sholl, D. S.; Lively, R. P. Nature 2016, 532, 435–437.
(10) Kim, J.; Tsouris, C.; Oyola, Y.; Janke, C. J.; Mayes, R. T.; Dai, S.; Gill, G.; Kuo, L. J.;
Wood, J.; Choe, K. Y.; Schneider, E.; Lindner, H. Ind. Eng. Chem. Res. 2014, 53,
6076–6083.
(11) Hoshino, T. Desalination 2013, 317, 11–16.
(12) Haber, F. Zeitschrift für Angew. Chemie 1927, 40, 303–314.
(13) Kenison Falkner, K.; Edmond, J. M. Earth Planet. Sci. Lett. 1990, 98, 208–221.
(14) Davies, R. V.; Kennedy, J.; McIlroy, R. W.; Spence, R.; Hill, K. M. Nature 1964, 203,
1110–1115.
(15) Anderson, H. H.; Asprey, L. B. Solvent extraction process for plutonium. US Patent
2924506 A, 1960.
(16) Kanno, M. J. Nucl. Sci. Technol. 1984, 21, 1–9.
(17) Saito, K.; Uezu, K.; Hori, T.; Furusaki, S.; Sugo, T.; Okamoto, J. AIChE J. 1988, 34,
411–416.
(18) Egawa, H.; Harada, H. Nippon Kagaku Kaishi 1979, 958–959.
(19) Schenk, H. J.; Astheimer, L.; Witte, E. G.; Schwochau, K. Sep. Sci. Technol. 1982, 17,
1293–1308.
(20) Egawa, H.; Nonaka, T.; Nakayama, M. 1990, 2273–2277.
(21) Rao, L. Recent International R & D Activities in the Extraction of Uranium from
Seawater, LBNL Paper LBNL-4034E; 2011.
(22) Soloway, S. Use of amidoximes in solvent extraction of metal ions from solution. US
Patent 2909542 A, 1959.
(23) Kim, J.; Tsouris, C.; Mayes, R. T.; Oyola, Y.; Saito, T.; Janke, C. J.; Dai, S.;
Schneider, E.; Sachde, D. Sep. Sci. Technol. 2013, 48, 367–387.
(24) Ux Consulting Company http://www.uxc.com (accessed Jul 20, 2017).
(25) Li, W. P.; Han, X. Y.; Wang, X. Y.; Wang, Y. Q.; Wang, W. X.; Xu, H.; Tan, T. S.;
Wu, W. S.; Zhang, H. X. Chem. Eng. J. 2015, 279, 735–746.
(26) Chouyyok, W.; Pittman, J. W.; Warner, M. G.; Nell, K. M.; Clubb, D. C.; Gill, G. A.;
Addleman, R. S. Dalton Trans. 2016, 45, 11312–11325.
(27) Yue, Y.; Zhang, C.; Tang, Q.; Mayes, R. T.; Liao, W.-P.; Liao, C.; Tsouris, C.;
Stankovich, J. J.; Chen, J.; Hensley, D. K.; Abney, C. W.; Jiang, D.; Brown, S.; Dai, S.
Ind. Eng. Chem. Res. 2016, 55, 4125–4129.
(28) Barber, P. S.; Kelley, S. P.; Griggs, C. S.; Wallace, S.; Rogers, R. D. Green Chem.
Page 18
9
2014, 1828–1836.
(29) Zhou, L.; Bosscher, M.; Zhang, C.; Özçubukçu, S.; Zhang, L.; Zhang, W.; Li, C. J.;
Liu, J.; Jensen, M. P.; Lai, L.; He, C. Nat. Chem. 2014, 6, 236–241.
(30) Parker, B. F.; Knight, A. S.; Vukovic, S.; Arnold, J.; Francis, M. B. Ind. Eng. Chem.
Res. 2016, 55, 4187–4194.
(31) Gill, G. A.; Kuo, L.-J.; Janke, C. J.; Park, J.; Jeters, R. T.; Bonheyo, G. T.; Pan, H.-B.;
Wai, C.; Khangaonkar, T.; Bianucci, L.; Wood, J. R.; Warner, M. G.; Peterson, S.;
Abrecht, D. G.; Mayes, R. T.; Tsouris, C.; Oyola, Y.; Strivens, J. E.; Schlafer, N. J.;
Addleman, R. S.; Chouyyok, W.; Das, S.; Kim, J.; Buesseler, K.; Breier, C.;
D’Alessandro, E. Ind. Eng. Chem. Res. 2016, 55, 4264–4277.
(32) Tian, G.; Teat, S. J.; Zhang, Z.; Rao, L. Dalton Trans. 2012, 41, 11579.
(33) Sun, X.; Xu, C.; Tian, G.; Rao, L. Dalton Trans. 2013, 42, 14621–14627.
(34) Leggett, C. J.; Parker, B. F.; Teat, S. J.; Zhang, Z.; Dau, P. D.; Lukens, W. W.;
Peterson, S. J. M.; Cardenas, A. J. P.; Warner, M. G.; Gibson, J. K.; Arnold, J.; Rao, L.
Chem. Sci. 2016, 7, 2775–2786.
(35) Ladshaw, A. P.; Das, S.; Liao, W.-P. W.-P.; Yiacoumi, S.; Janke, C. J.; Mayes, R. T.;
Dai, S.; Tsouris, C. Ind. Eng. Chem. Res. 2015, acs.iecr.5b03456.
(36) Das, S.; Oyola, Y.; Mayes, R. T.; Janke, C. J.; Kuo, L. J.; Gill, G.; Wood, J. R.; Dai, S.
Ind. Eng. Chem. Res. 2016, 55, 4103–4109.
(37) Kuo, L. J.; Janke, C. J.; Wood, J. R.; Strivens, J. E.; Das, S.; Oyola, Y.; Mayes, R. T.;
Gill, G. A. Ind. Eng. Chem. Res. 2015, 55, 4285–4293.
(38) Das, S.; Oyola, Y.; Mayes, R. T.; Janke, C. J.; Kuo, L.-J.; Gill, G.; Wood, J. R.; Dai, S.
Ind. Eng. Chem. Res. 2016, 55, 4110–4117.
(39) Lashley, M. A.; Mehio, N.; Nugent, J. W.; Holguin, E.; Do-Thanh, C.-L.; Bryantsev,
V. S.; Dai, S.; Hancock, R. D. Polyhedron 2016, 109, 81–91.
(40) Alexandratos, S.; Kung, S.; Dai, S. Recovery of Uranium from Seawater : Preparation
and Development of Polymer-Supported Extractants.
(41) Brown, S.; Yue, Y.; Kuo, L. J.; Mehio, N.; Li, M.; Gill, G.; Tsouris, C.; Mayes, R. T.;
Saito, T.; Dai, S. Ind. Eng. Chem. Res. 2016, 55, 4139–4148.
(42) Sun, X.; Tian, G.; Xu, C.; Rao, L.; Vukovic, S.; Kang, S. O.; Hay, B. P. Dalton Trans.
2014, 43, 551–557.
(43) Endrizzi, F.; Melchior, A.; Tolazzi, M.; Rao, L. Dalton Trans. 2015, 44, 13835–13844.
(44) Abney, C. W.; Mayes, R. T.; Piechowicz, M.; Lin, Z.; Bryantsev, V. S.; Veith, G. M.;
Dai, S.; Lin, W. Energy Environ. Sci. 2016, 9, 448–453.
(45) Parker, B. F.; Zhang, Z.; Leggett, C. J.; Arnold, J.; Rao, L. Dalton Trans. 2017, DOI:
10.1039/C7DT01597F.
(46) Kelley, S. P.; Barber, P. S.; Mullins, P. H. K.; Rogers, R. D. Chem. Commun. 2014, 50,
12504–12507.
(47) Lashley, M. A.; Ivanov, A. S.; Bryantsev, V. S.; Dai, S.; Hancock, R. D. Inorg. Chem.
2016.
(48) Vukovic, S.; Watson, L. a; Kang, S. O.; Custelcean, R.; Hay, B. P. Inorg. Chem. 2012,
51, 3855–3859.
(49) Vukovic, S.; Hay, B. P. Inorg. Chem. 2013, 0, 7805–7810.
(50) Mehio, N.; Lashely, M. A.; Nugent, J. W.; Tucker, L.; Correia, B.; Do-Thanh, C.-L.;
Page 19
10
Dai, S.; Hancock, R. D.; Bryantsev, V. S. J. Phys. Chem. B 2015, 119, 3567–3576.
(51) Park, J.; Jeters, R. T.; Kuo, L.-J.; Strivens, J. E.; Gill, G. A.; Schlafer, N. J.; Bonheyo,
G. T. Ind. Eng. Chem. Res. 2016, 55, 4278–4284.
(52) Kabay, N.; Katakai, A.; Sugo, T. In Radiation Physics and Chemistry; 1995; Vol. 46,
pp. 833–836.
(53) Eloy, F.; Lenaers, R. Chem. Rev. 1962, 62, 155–183.
(54) Bolotin, D. S.; Bokach, N. A.; Kukushkin, V. Y. Coord. Chem. Rev. 2016, 313, 62–93.
(55) Mehio, N.; Williamson, B.; Oyola, Y.; Mayes, R. T.; Janke, C.; Brown, S.; Dai, S. Ind.
Eng. Chem. Res. 2015, 55, 4217–4223.
(56) Endrizzi, F.; Leggett, C. J.; Rao, L. Ind. Eng. Chem. Res. 2016, 55, 4249–4256.
(57) Biedermann, J. Berichte der Dtsch. Chem. Gesellschaft 1889, 22, 2967–2973.
(58) Bernal, J. L.; Del Nozal, M. J.; Debán, L.; Nuñez, B.; Cerdá, V.; Estela, J. M.
Thermochim. Acta 1986, 103, 259–266.
(59) Jara, R.; Cerdà, V. Thermochim. Acta 1989, 142, 135–141.
(60) Jara, R.; Estela, J. M.; Cerdá, V. Thermochim. Acta 1991, 177, 229–237.
(61) Grases, F.; Forteza, R.; March, J. G.; Cerda, V. Anal. Chim. Acta 1983, 155, 299–303.
(62) Elvidge, J. A.; Linstead, R. P.; Salaman, A. M. J. Chem. Soc. 1959, 208–215.
(63) Endrizzi, F.; Melchior, A.; Tolazzi, M.; Rao, L. Dalton Trans. 2015, 44, 13835–13844.
(64) Yue, Y.; Mayes, R. T.; Kim, J.; Fulvio, P. F.; Sun, X. G.; Tsouris, C.; Chen, J.; Brown,
S.; Dai, S. Angew. Chemie - Int. Ed. 2013, 52, 13458–13462.
(65) Kang, S. O.; Vukovic, S.; Custelcean, R.; Hay, B. P. Ind. Eng. Chem. Res. 2012, 51,
6619–6624.
(66) Kennedy, Z. C.; Cardenas, A. J. P.; Corbey, J. F.; Warner, M. G. Chem. Commun.
2016, 52, 8802–8805.
(67) Pan, H.-B.; Kuo, L.-J.; Wai, C. M.; Miyamoto, N.; Joshi, R.; Wood, J. R.; Strivens, J.
E.; Janke, C. J.; Oyola, Y.; Das, S.; Mayes, R. T.; Gill, G. A. Ind. Eng. Chem. Res.
2016, 55, 4313–4320.
(68) Alexandratos, S. D.; Zhu, X.; Florent, M.; Sellin, R. Ind. Eng. Chem. Res. 2016, 55,
4208–4216.
(69) Oyola, Y.; Dai, S. Dalton Trans. 2016, 45, 8824–8834.
(70) Pan, H.-B.; Liao, W.; Wai, C. M.; Oyola, Y.; Janke, C. J.; Tian, G.; Rao, L. Dalton
Trans. 2014, 43, 10713–10718.
(71) Ivanov, A. S.; Leggett, C. J.; Parker, B. F.; Zhang, Z.; Arnold, J.; Dai, S.; Abney, C.
W.; Bryantsev, V. S.; Rao, L. Manuscript Submitted 2017.
Page 20
11
Chapter 2
Synthesis and characterization of a rare non-oxido V(V)
complex from aqueous solution
Page 21
12
Introduction*
Selectivity for uranium over other ions is a key factor in its efficient extraction from
seawater and all the other components within. Great improvements have been made in the
capacity of amidoxime-based uranium sorbents, more than doubling uranium capacity over 10
years, however, selectivity remains a challenge.1,2 Studies indicate that the sorption efficiency
of vanadium(V), which is the stable valence state under the conditions of seawater Eh and pH3,
by poly(amidoxime) sorbents is much higher than those for Fe(III) and U(VI), following the
order: vanadium(V) >> iron(III) > uranium(VI).4 Though the concentrations of vanadium (1.9
μg/kg)3,5 and uranium in seawater are comparable, vanadium in fact occupies nearly 20 times
as many sorption sites as uranium on the poly(amidoxime) sorbents,4,6 essentially limiting the
sorption capacity for uranium. In addition, the stripping conditions required to elute the sorbed
V(V) from the sorbent for reuse are much harsher than those used to elute uranium and other
cations and ultimately destroy the sorbent.6,7 Since vanadium is a particularly problematic
element in the extraction of uranium from seawater using poly(amidoxime) sorbents, a
fundamental understanding of vanadium coordination to amidoxime-type sorbents could help
optimize this extraction technology.
Structural studies can be used to provide valuable insights into the coordination
behavior of vanadium and other metal cations with amidoxime ligands and can also help
explain their subsequent sorption behavior with poly(amidoxime) sorbents. For example, the
crystal structures and thermodynamic stability constants have been reported for U(VI) and
Fe(III) complexes with glutaroimide-dioxime (Figure 1), a cyclic imide-dioxime moiety that
can form during the synthesis of the poly(amidoxime) sorbent and is reputedly responsible for
the extraction of uranium from seawater.8,9 For both cations, two glutaroimide-dioxime ligands
bind in a tridentate mode to the metal center. However, the ligands were found to bind Fe(III)
much more strongly than U(VI) as manifested by the shorter Fe-O and Fe-N bond lengths
relative to the corresponding U-O and U-N bond lengths (even after taking into consideration
the difference in ionic radii between Fe3+ and UO22+). The shorter bond lengths in the Fe(III)
complex were attributed to the higher charge density of Fe(III) as well as its larger orbital
participation in bonding relative to uranium. The higher thermodynamic stability and shorter
bond lengths of the Fe3+/glutaroimide-dioxime complexes were postulated to be responsible
for the higher sorption of Fe3+ compared to UO22+ in marine tests.
The contents of this chapter have been previously published in "Structural and spectroscopic
studies of a rare non-oxido V(v) complex crystallized from aqueous solution"; Christina J.
Leggett, Bernard F. Parker, Simon J. Teat, Zhicheng Zhang, Phuong D. Dau, Wayne W.
Lukens, Sonja J. M. Peterson, Allan Jay P. Cardenas, Marvin G. Warner, John K. Gibson, John
Arnold, Linfeng Rao; Chemical Science; 2016, 7 (4), p. 2775-2786.
Page 22
13
Figure 1 Glutaroimide-dioxime (LH3)
Though the crystal structure of V(V) with glutaroimide-dioxime has not been previously
reported, reasonable speculations about its structure can be made using information obtained
from the known V(V) crystal structures. Based on the reported structures of V(V) complexes
with organic ligands prepared from aqueous solutions (or ionic liquid equilibrated with water),
it is known that the VO2+ moiety with two short oxo V=O bonds (RV=O = 1.60 – 1.63 Å) usually
remains intact.10–12 Therefore, unlike the UO22+ cation which possesses a linear trans dioxo
configuration that allows two tridentate ligands to bind in the equatorial plane to form a strong
1:2 U(VI)/L complex,8 the VO2+ cation with its bent cis dioxo configuration cannot
accommodate two such ligands due to steric hindrance and insufficient coordination sites.
These observations raise questions about why V(V) is sorbed much more strongly than
U(VI) by the amidoxime sorbents. One hypothesis that could explain the much stronger
complexation of V(V) is that V(V) exists in the glutaroimide-dioxime complex as a non-oxo,
“bare” V5+ ion coordinated with the ligand(s). A non-oxo V5+ cation could have a very high
affinity for O and N donor ligands due to its high charge density and could easily accommodate
two tridentate ligands in a mode similar to that in the Fe3+/glutaroimide-dioxime complex.9
However, crystal structure data in the Cambridge Structural Database (CSD)13 indicate that,
while limited numbers of structures are known that contain non-oxo V4+ (Figure 2), complexes
with ligands such as cis-inositol14, N-hydroxy-iminodiacetate15, or catecholate16 obtained from
aqueous solutions, crystals of non-oxo V5+ complexes from aqueous solutions are extremely
rare. One non-oxo V5+ complex, [PPh4][-V((S,S)-HIDPA)2]·H2O (HIDPA = 2,2’-
(hydroxyimino)dipropionic acid), was crystallized as the oxidized analogue of the naturally-
existing Amavadin17,18 from aqueous solution through the oxidation of a V(IV) complex by
Ce(IV). To the best of our knowledge, there have been no “bare” V5+ complexes directly
synthesized from oxo V(V) species (pervanadyl or vanadates) and crystallized from aqueous
solution. In addition, the formation of non-oxo V5+ complexes in aqueous solutions via the
displacement of the oxo V=O bonds by chelating ligands (e.g., the hydroxamate derivative
deferoxamine19) was only postulated but has not been demonstrated.
In an effort to provide structural insights into vanadium complexation with amidoxime
ligands, the present work has been conducted to synthesize crystals of V(V)/glutaroimide-
dioxime complexes and characterize their crystal- and solution structures by single-crystal X-
ray diffraction (XRD), multinuclear (51V, 17O, 1H, and 13C) nuclear magnetic resonance (NMR),
and electrospray ionization mass spectrometry (ESI-MS). This work represents the synthesis
and identification of the first non-oxo V(V) complex that was directly synthesized from an oxo
V(V) species and crystallized from aqueous solution. The displacement of oxo V=O bonds by
chelating ligands that leads to the formation of a non-oxo V(V) complex in aqueous solution
has been unprecedentedly demonstrated by concurrent 51V/17O NMR experiments. Results
Page 23
14
from this work provide important insights into the strong sorption of vanadium on
poly(amidoxime) sorbents in the recovery of uranium from seawater.
(a)
(b) (c)
Figure 2. Selected previously reported non-oxo vanadium complexes that are stable
in aqueous solution: (a) Amavadin17, naturally occurring in the V(IV) oxidation
state but it also can be oxidized and crystallized as the V(V) analogue. Substituted
derivatives are also known; (b) cis-inositol V(IV) (with bridging cations)14;
(c) tris(catecholato) V(IV)16
Page 24
15
Experimental
Synthesis and single crystal XRD of Na[V(L)2]2H2O
The glutaroimide-dioxime ligand was synthesized as described previously.20 A 2 mL
aliquot of an aqueous stock solution at pH 8 containing NaVO3 (0.2 mmol), NaCl (12 mmol),
and glutaroimide-dioxime (0.5 mmol) was slowly evaporated over the course of a week to
generate shiny, dark brown/black acicular crystals. The crystals are very soluble in water, fairly
soluble in ethanol and methanol, and insoluble in low-polarity solvents. Prolonged heating of
the dissolved complex results in its decomposition as evidenced by the fading color.
A single crystal was selected, removed from Paratone oil with a MiTiGen microloop,
and mounted on to a Bruker goniometer equipped with a PHOTON100 CMOS detector and
Oxford Systems Cryostream 800 series on beamline 11.3.1 of the Advanced Light Source at
LBNL. The data were collected at 100K using the Bruker APEX2 software21 in shutterless
mode using ω rotations at a wavelength of 0.7749 Å. The intensity data were integrated using
SAINT v.8.34A and the absorption and other corrections were applied using SADABS 2014/5.
The appropriate dispersion corrections for C, H, N, O, and V at = 0.7749 Å were calculated
using the Brennan method in XDISP run through WinGX22. The structure was solved with
intrinsic phasing using SHELXT 2014/4 and refined using SHELXL 2014/722. All non-
hydrogen atoms were refined anisotropically. Hydrogen atoms were found in the difference
map and allowed to refine freely.
Synthesis and single-crystal XRD of Na[VO2(HL)]
Glutaroimide-dioxime (30 mg, 0.21 mmol) was suspended in deionized water (1 mL).
NaVO3 (25 mg; 0.21 mmol) was added, resulting in a dark brown solution immediately. After
stirring for 5 h, the solution was filtered and the solvent was removed. The residue was re-
dissolved in ethanol and filtered. Orange crystals were obtained from vapor diffusion of hexane
into the ethanol solution.
A Bruker-AXS Kappa Apex II CCD diffractometer with 0.71073 Å Mo Kα radiation
was used for data collection. Crystals were mounted on a MiTeGen MicroMounts pin using
Paratone-N oil. Data were collected at 100 K. The software used for data analysis includes
Bruker APEX II21 to retrieve cell parameters, SAINTPlus for raw data integration, and
SADABS to apply the absorption correction. The structures were solved using either direct
methods, charge flipping methods or the Patterson method and refined by a least-squares
method on F2 using the SHELXTL program package. Space groups were chosen by analysis
of systematic absences and intensity statistics.
17O labelling of vanadate for 51V, 17O, 1H, and 13C NMR
17O-enriched water (10% 17O, 25% 18O, balance 16O) was purchased from Cambridge
Isotope Laboratories, Inc. (Lot # I1-3969). 3.67 mg (0.296 mmol) NaVO3 was dissolved in 2.0
mL 17O-enriched H2O, followed by adding 50.7 mg 40% NaOD (in D2O) solution. The
colorless solution was agitated and set aside for 2 - 3 days at room temperature to allow 16O/17O
exchange. The solution was checked by 17O NMR after 2 and 3 days to confirm the oxo ligand
exchange. Additionally, the free ligand was dissolved in the isotopically enriched water to
check for 16O/17O exchange, and no exchange was observed over 4 days.
Page 25
16
Preparation of vanadium/glutaroimide-dioxime solutions
The above-described vanadate solution was equally divided into four solutions (a, b, c,
and d) for multinuclear NMR experiments. Different quantities of glutaroimide-dioxime were
added into solutions b, c, and d to obtain an [L]/[V] ratio of 1, 2 and 3 for solutions b, c, and d,
respectively. At this time, solution a (with vanadate only) remained colorless, but solutions b,
c, and d (with vanadate and glutaroimide-dioxime) became pale yellow. A total of 0.12 mL
0.980 M HCl was added in two portions into each of solutions b, c, and d to adjust the pH of
the solutions to around 8. Because the small volume (0.5 mL) of the H217O solutions precluded
accurate pH measurements, the pH of the solutions were determined to be 7.5 (b), 8.5 (c) and
8.7 (d) by using H2O solutions of a larger volume (4.0 mL) containing the same concentrations
of vanadate and glutaroimide-dioxime as the H217O solutions. These solutions were allowed to
equilibrate for one day after acid additions before acquisition of NMR spectra. The final colors
of solutions b, c, and d were amber, brown, and dark brown, respectively. In addition to the
four H217O solutions of V(V)/glutaroimide-dioxime described above (a, b, c, and d), one D2O
solution of pure glutaroimide-dioxime (a’) and one D2O solution of the Na[V(L)2]·2H2O crystal
(e) were also prepared for 1H/13C and 51V NMR experiments.
NMR data collection
All NMR spectra were acquired at 20 - 22°C. The 51V spectrum of the D2O solution of
Na[V(L)2]·2H2O was acquired on a Bruker AV-300 spectrometer referenced to an external
standard of VOCl3 in C6D6. All other 17O, 51V, and 13C NMR spectra were acquired on a Bruker
DRX-500 spectrometer equipped with a Z-gradient broadband probe. The 1H spectra were
acquired on a Bruker AV-500 spectrometer equipped with a Z-gradient triple broadband
inverse detection probe using WATERGATE solvent suppression. The 1H, 13C, and 51V spectra
were referenced to an external standard of VOCl3 in C6D6 and the 17O spectra were referenced
to the H217O water resonance.
Electrospray Ionization – Mass Spectrometry
ESI-MS experiments were performed with a methanol spray on a Finnigan LTQ FT
mass spectrometer (Thermo) at the QB3/Chemistry Mass Spectrometry Facility (UCB).
Aliquots of the 1:1 and 2:1 [L]/[V] samples were taken and diluted in methanol. The samples
were injected directly via a syringe at a flow rate of 5 µL·min-1 with a spray voltage of 3.5 kV.
Page 26
17
Results and discussion
Crystal structure of Na[V(L)2]2H2O.
The asymmetric unit of Na[V(L)2]2H2O consists of a “bare” V5+ center bound to two
fully deprotonated glutaroimide-dioxime ligands (L3-), through one nitrogen and two oxygen
atoms of each ligand, along with a sodium ion and two water molecules (Figure 3a). The
binding of the ligands around the vanadium center results in a highly distorted octahedral
coordination environment in the triclinic space group P-1 (Figure 3b). The bond lengths for the
V-N bonds are 1.9557(8) and 1.9551(8) Å while those for the V-O bonds are 1.8667(8),
1.8741(7), 1.9039(6), and 1.9024(8) Å. The extended crystal structure can be considered as
successive VL2- complexes bridged by sodium atoms via N(2) and N(5) to form a one
dimensional chain. The chains are then linked via bridging water molecules (O(1W)) between
the sodium atoms to form a ribbon (Figure 3c). The ribbons are connected by hydrogen bonding
interactions between the water molecules and the ligands for O(1W)-O(3)*, O(1W)-N(3)*,
O(2W)-O(2)*, and O(2W)-N(6)*, where the superscript * denotes symmetry related positions.
The V-O bond distances in Na[V(L)2]·2H2O are within the range of V-O bond distances
reported for other non-oxo V5+ compounds obtained from non-aqueous solutions (1.8 - 2.0 Å),13
and much longer than those of the V=O double bonds (~ 1.6 Å).10,12,13
Page 27
18
(a)
(b)
(c)
Figure 3. Crystal structure of the 1:2 vanadium/glutaroimide-dioxime complex,
Na[V(L)2]2H2O. (a) The asymmetric unit and numbering scheme, with the
hydrogen atoms except those on water omitted for clarity; (b) the distorted
octahedral environment around the vanadium atom; (c) the sodium ions bridge
between the complexes to form a chain and the water molecules link the sodium ion
to form a ribbon. Thermal ellipsoids are shown at the 50% probability level.
Page 28
19
Table 1. Crystal structure data for Na[L2V]⋅2H2O and Na[(HL)VO2]
Na[L2V]⋅2H2O Na[(HL)VO2]
Empirical formula C10 H16 N6 Na O6 V C5 H7 N3 Na O4 V
Formula weight 390.22 247.07
Temperature (K) 100(2) 100.15
Radiation Synchrotron MoKα
Wavelength (Å) 0.7749 0.71073
Crystal system Triclinic Monoclinic
Space group P-1 P21/c
a (Å) 7.9375(3) 15.0543(8)
b (Å) 8.7365(4) 5.5070(3)
c (Å) 12.1972(5) 10.1794(5)
α (°) 102.684(2) 90.00
β (°) 107.187(2) 101.569(3)
γ (°) 103.796(2) 90.00
Volume (Å3) 745.41(5) 826.77(7)
Z 2 4
ρcalc (g/cm3) 1.739 1.985
μ (mm-1) 0.931 1.242
F(000) 400 496.0
Crystal size 0.110 x 0.090 x 0.030 mm3 0.5 × 0.47 × 0.2
2θ range (°) 2.756 to 40.263 2.76 to 62.44
Index ranges -13<=h<=13, -14<=k<=14, -20<=l<=20 -21 ≤ h ≤ 17, -8 ≤ k ≤ 7, -11 ≤ l ≤ 14
Reflections collected 13779 8438
Independent reflections 7062 [R(int) = 0.0192] 2662 [Rint = 0.0347]
Data / restraints / parameters 7062 / 0 / 281 2662/0/131
Goodness-of-fit on F2 1.034 0.963
Final R indices [I>2sigma(I)] R1 = 0.0263, wR2 = 0.0707 R1 = 0.0330, wR2 = 0.0955
R indices (all data) R1 = 0.0301, wR2 = 0.0729 R1 = 0.0485, wR2 = 0.1112
Largest diff. peak/hole (e⋅Å-3) 0.628 / -0.549 0.63/-0.56
Page 29
20
Crystal structure of Na[VO2(HL)]
The 1:1 V(V)/glutaroimide-dioxime complex (Figure 4) possesses a distorted square
pyramidal structure with τ = 0.35 in the monoclinic space group P21/c: a = 15.543(8) Å, b =
5.5070(3) Å, c = 10.1794(5) Å, α = 90.0°, β = 101.569(3)°, and γ = 90.0°. The doubly
deprotonated ligand (HL2-) coordinates to the V center through a κ3 binding motif via the imide
N atom (RV-N6 = 1.9885(17) Å) and the oxime O atoms (RV-O2, V-O5 = 1.8931(14), 2.0054(13)
Å). Notably, the 1:1 complex (Figure 3) is not a “bare” V5+ complex unlike the 1:2 complex
(Figure 3). Instead, the 1:1 complex has the VO2+ moiety with two short oxo bonds (V-O3 and
V-O14) with bond distances of 1.6781(15) and 1.6374(14) Å, respectively, which are typical
of V=O double bonds. The O3=V=O14 angle is 109.67°, close to that in a tetrahedral VO43-
species.
Figure 4. Crystal structure of the 1:1 vanadium/glutaroimide-dioxime complex,
Na[VO2(HL)]. Hydrogen atoms except H1 are omitted for clarity. Thermal ellipsoids are
shown at the 50% probability level.
Multinuclear NMR
The successful synthesis of Na[V(L)2]2H2O shows that, using an oxo vanadate species
as the starting material, a non-oxo V(V) complex with glutaroimide-dioxime can be
synthesized and crystallized from aqueous solution. In other words, the glutaroimide-dioxime
ligand can displace the oxo V=O bonds in vanadate and form a “bare” V5+ complex. In addition,
the crystallization of Na[VO2(HL)] suggests that an intermediate 1:1 complex, in which the
oxo V=O bonds in vanadate are only partially displaced by glutaroimide-dioxime, may also
exist in aqueous solution. To verify the structure of the unusual non-oxo V5+ complex and
demonstrate the stepwise displacement of the oxo V=O bonds in aqueous solutions, we
hypothesized a reaction scheme (Scheme 1) and designed concurrent 51V/17O/1H/13C NMR
experiments, coupled with ESI-MS, in 17O-enriched H2O to test the hypothesis. The 1:1
intermediate complex hypothesized in Scheme 1, [V(O)(OH)L]-, has the same stoichiometry
as [VO2(HL)]- in the crystal structure (Figure 3), but differs in the location of one proton. In
the crystal, the proton (H1) is located on the nitrogen (N1), probably due to the lattice
interaction with Na+. Nevertheless, whether the 1:1 complex is in the form of [V(O)(OH)L]- or
[VO2(HL)]- does not alter the validity of the discussions below.
Page 30
21
51V NMR (I = 7/2) is frequently used for structural characterization of V(V) complexes in
solution due to its wide chemical shift range, high sensitivity, and high natural abundance.23–25
On the other hand, oxygen-17, with I = 5/2, is an NMR-active isotope of oxygen with a very
low natural abundance and low NMR sensitivity, so isotopic enrichment is usually necessary
for its detection and study. Indirect scalar spin-spin coupling between 17O and 51V can also be
observed by 17O and 51V NMR if both atoms are bound directly.26,27
Scheme 1. Proposed reaction scheme of the formation of the non-oxido V5+ –
glutaroimide-dioxime complex.
As shown in Scheme 1, starting with 17O labelled vanadate in solution, the vanadate
signal should show V-O coupling in both 17O and 51V NMR spectra. If the complexation
reaction proceeds to the 1:2 complex as Scheme 1 suggests, no 17O NMR signal(s) should be
observed at the end when the [V(L)2]- complex is the only vanadium species present. At this
point, all of the V=17O bonds of the starting vanadate would be displaced by the donor atoms
of glutaroimide-dioxime and there would be no 17O atoms in the [V(L)2]- complex.
Concurrently, the 51V NMR signal for the vanadate (with V-O coupling) should disappear and
a new 51V NMR signal for the [V(L)2]- complex with no V-O coupling would appear.
The 51V/17O NMR spectra of a series of solutions with [L]/[V] ratios ranging from 0 to
3 are shown in Figure 4. Additionally, the 51V NMR spectrum of a D2O solution of crystallized
Na[V(L)2]·2H2O was collected to help confirm the assignment of the vanadium signal and is
also shown in Figure 4 (spectrum e). As Figure 4 shows, the 51V NMR spectrum of the initial
solution (a) in the absence of glutaroimide-dioxime shows the peaks for the vanadates (VO43-
and HVO42-) at δ = -537, -561 ppm. The vanadate peak () has broad shoulders indicating the
spin-spin coupling with 17O (see the inset for spectrum a in Figure 4). Concurrently, the 17O
NMR spectrum of the initial solution (a) shows a broad peak at ~ 560 ppm for the vanadate
species (), with an apparent linewidth of 5250 Hz due to coupling with the spin-7/2 51V
nucleus. These 17O/51V spin-spin coupling features agree with those reported for 17O-labelled
NaVO3 in the literature.27
Page 31
22
Fig
ure 5
. 51V
and 1
7O
NM
R o
f L –
van
adate m
ixtu
res dem
onstratin
g th
e form
ation
of
V(V
)/glu
taroim
ide-d
ioxim
e com
plex
es in H
21
7O v
ia the d
isplacem
ent o
f oxo V
=O
bonds. S
olu
tions: (a
)
van
adate o
nly
, no L
; (b) 1
:1 [L
]/[V]; (c) 2
:1 [L
]/[V]; (d
) 3:1
[L]/[V
]; (e) Na[V
(L)
2 ]·2H
2 O. P
eak
assignm
ents: (
) V
O4
3-/H
VO
42
-; (
) 1:1
V/L
com
plex
, [V(O
)(OH
)L]
-; (
) 1:2
V/L
com
plex
, [VL
2 ]-.
The in
set on th
e 51V
spectru
m a
is an o
verlay
of th
e 51V
peak
in 1
7O-en
riched
water an
d n
atural w
ater
show
ing th
e 17O
/ 51V
couplin
g. D
etailed co
nditio
ns o
f the so
lutio
ns are p
rovid
ed in
Tab
le 2)
Page 32
23
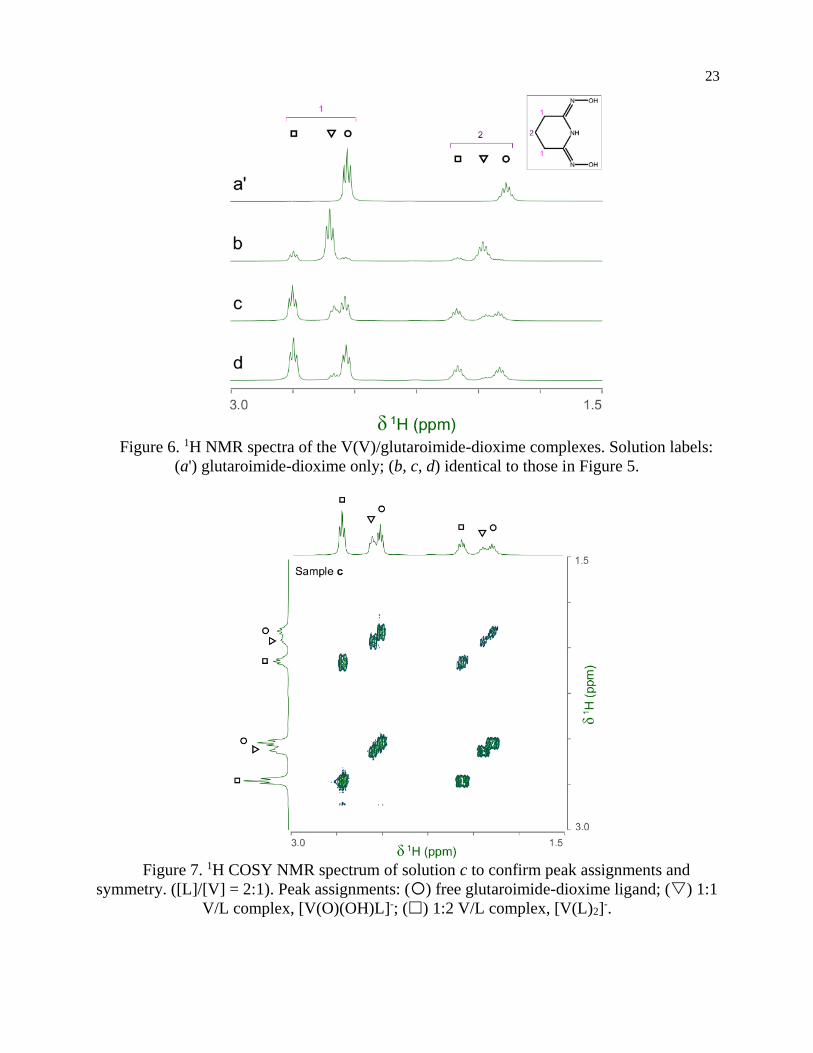
Figure 6. 1H NMR spectra of the V(V)/glutaroimide-dioxime complexes. Solution labels:
(a') glutaroimide-dioxime only; (b, c, d) identical to those in Figure 5.
Figure 7. 1H COSY NMR spectrum of solution c to confirm peak assignments and
symmetry. ([L]/[V] = 2:1). Peak assignments: () free glutaroimide-dioxime ligand; () 1:1
V/L complex, [V(O)(OH)L]-; () 1:2 V/L complex, [V(L)2]-.
Page 33
24
Fig
ure 8
. 13C
NM
R sp
ectra of L
– v
anad
ate mix
tures in
H2
17O
. Solu
tion lab
els: (a') glu
taroim
ide-
dio
xim
e ligan
d; (b
) 1:1
[L]/[V
]; (c) 2:1
[L]/[V
]; (d) 3
:1 [L
]/[V]. P
eak assig
nm
ents:
(
) free glu
taroim
ide-d
ioxim
e ligan
d, (
) 1:1
V/L
com
plex
, [VL
(O)(O
H)]
-,
(
) 1:2
V/L
com
plex
, [V(L
)2 ]
-, (
) extern
al standard
(C6 D
6 ).
Page 34
25
Table 2. Concentrations of the solution samples for NMR experiments;
L stands for glutaroimide-dioxime.
Solution NMR expts. [V], mM [L], mM pH Notes
a' 1H/13C 0 ~15 12-13 in D2O
a 17O/51V 14.8 0 12-13 in H217O
b 17O/51V/1H/13C 14.8 14.8 7.5 in H217O
c 17O/51V/1H/13C
/1H COSY 14.8 29.6 8.5 in H2
17O
d 17O/51V/1H/13C 14.8 44.4 8.7 in H217O
e 51V ~ 5 ~ 10 D2O solution of 1 mg
Na[V(L)2]·2H2O
As different equivalents (1, 2, and 3) of glutaroimide-dioxime were added to the
vanadate solution, both the 51V and 17O signals for vanadates () disappeared. In addition, a
new 51V signal in the 51V spectra began to appear at δ = -410 ppm () and achieved maximum
intensity at [L]/[V] = 1 (51V spectrum b), diminished as [L]/[V] was increased to 2 (51V
spectrum c), and nearly disappeared as [L]/[V] was further increased to 3 (51V spectrum d).
Concurrently, a new peak appeared in the 17O spectra around δ = 905 ppm () and achieved
maximum intensity at [L]/[V] = 1 (17O spectrum b), diminished at [L]/[V] = 2 (17O spectrum
c), and completely disappeared at [L]/[V] = 3 (17O spectrum d).
Based on the changes in the peak intensities with the increase of [L]/[V] and the
occurrence of the maximum intensity at [L]/[V] = 1, it is reasonable to assign these peaks ()
to a 1:1 intermediate complex, such as [V(O)(OH)L]-, that is hypothesized in Scheme 1. The
observation of the 17O signal for the intermediate 1:1 V/L complex () suggests that, in this
complex, the glutaroimide-dioxime ligand only partially displaces the oxo V=O bond(s) from
the initial 17O-labelled vanadate, which is consistent with Scheme 1 and the crystal structure of
the 1:1 complex, Na[VO2(HL)] (Figure 3). The 17O chemical shifts for the 1:1 V/L complex at
[L]/[V] = 1 (17O spectrum b) and 2 (17O spectrum c) were noted to be slightly different. The
difference probably results from different degrees of protonation in the [V(O)(OH)L]- species
due to slight differences in pH between the two solutions (pH 7.5 and 8.5 for [L]/[V] = 1 and
2, respectively).
Accompanying the appearance and disappearance of the peaks () for the 1:1 V/L
complex, a new and extremely shifted 51V peak at δ = 740 ppm () appears at [L]/[V] = 1 (51V
spectrum b), intensifies at [L]/[V] =2 (51V spectrum c), and achieves maximum intensity at
[L]/[V] > 2 (51V spectrum d). The chemical shift is identical to that of the 51V peak in spectrum
e for the solution of Na[V(L)2]·2H2O, implying that this peak () can be assigned to the 1:2
V/L complex, [V(L)2]-, hypothesized in Scheme 1. The 51V peak for the 1:2 complex (spectra
d and e, ) should not show 17O/51V spin-spin coupling features because the ligands in the 1:2
complex completely displace the oxo V=*O bonds of the initial 17O- labelled vanadate.
However, the large linewidth of the 51V signal resulting from the low symmetry of the complex
precludes the verification of the absence or presence of the coupling features for the 51V NMR
signal of the 1:2 (δ = 740 ppm) or 1:1 complex (δ = -410 ppm). However, the absence of NMR
signals on the 17O spectrum d clearly indicates that the 1:2 complex does not contain oxo V=*O
bonds and is a “bare” V5+ complex.
Page 35
26
The intensity of the 51V NMR signal for the final complex at [L]/[V] > 2 remained
unchanged beyond 12 days, which suggests that vanadium remained in the V(V) oxidation
state in the solution at neutral to slightly alkaline pH. If reduction of V(V) to the paramagnetic
V(IV) species were to occur, it would diminish and eventually “wash-out” the 51V NMR signal.
Further reduction to V(III) is very unlikely: V(III) is generally much less stable in aqueous
solutions, and no signals were observed in the lower 51V chemical shift range of below δ = -
1000 ppm.24,26
51V/17O NMR experiments in acidic solutions were not performed in this study because
(1) [V(L)2]- may not be the dominant and most stable complex in acidic regions and (2)
preliminary experiments suggested that redox reactions could occur between V(V) and
glutaroimide-dioxime in more acidic solutions. The stability of [V(L)2]- in acidic solution is
discussed in detail in Chapter 2 and the redox reactions between vanadium and the ligand are
discussed in Chapter 3. The 1H and 13C NMR spectra of the V(V)/glutaroimide-dioxime solutions used in the 17O/51V experiments (b, c, d, and e), as well as a solution of only glutaroimide-dioxime (a’),
were also acquired. A 1H COSY spectrum of solution c was also acquired to confirm the peak
assignments. The 1H NMR, 1H COSY, and 13C NMR spectra are shown in Figures 6-8.
The 1H spectra of the V(V)/glutaroimide-dioxime solutions (b, c, and d) show two sets
of signals at = 2.5 – 2.8 ppm and = 1.8 – 2.1 ppm, respectively. In each set, there are three
signals (labelled as ,, ) that were straight-forward to assign to the free glutaroimide-
dioxime (), the 1:1 V/L complex (), and the 1:2 V/L complex (), respectively, based on
the NMR spectrum of the pure ligand, the COSY spectrum, the spin-spin coupling patterns,
and the intensity changes as a function of the [L]/[V] ratio. The signals for the 1:1 complex
() achieve maximum intensity at [L]/[V] = 1 (spectrum b) and diminish as [L]/[V] is
increased to 2 and higher (spectra c and d), while the signals for the 1:2 complex () are weak
at [L]/[V] = 1 (spectrum b), intensify as [L]/[V] is increased to 2 (spectrum c), and achieve a
maximum at [L]/[V] > 2 (spectrum d). These observations support the proposed structures of
the 1:1 and 1:2 V(V)/glutaroimide-dioxime complexes, corroborate the 17O/51V NMR data, and
validate the hypothesized stepwise displacement of the oxo V=O bonds leading to the
formation of the non-oxo [VL2]- complex in aqueous solution.
Importantly, the 1H spectra of the complexes showed that the equivalencies of the H
atoms in the free ligand remain unchanged in the 1:1 and 1:2 complexes (Figure 5). In other
words, the same number of 1H resonances (two) with the same spin-spin coupling fine
structures is observed for the complex and the free ligand, which agrees with the coordination
modes of the ligand in the complexes hypothesized in Scheme 1 and confirms the structure of
a non-oxido V5+/glutaroimide-dioxime complex. The same analysis can be made with the 13C
NMR spectra (Figure 8).
To summarize, concurrent 51V/17O NMR experiments have unprecedentedly
demonstrated that the displacement of oxo V=O bonds in vanadates by glutaroimide-dioxime
leads to the formation of a non-oxo V5+ complex in aqueous solution. The 51V chemical shift
of the complex is identical to that of the solution of Na[V(L)2]·2H2O, suggesting that the
complex in solution is probably [V(L)2]-. 1H and 13C NMR spectra are also consistent with
these species and high symmetry in solution. Further verification of the stoichiometry was also
achieved by ESI-MS, described below.
Page 36
27
ESI-MS
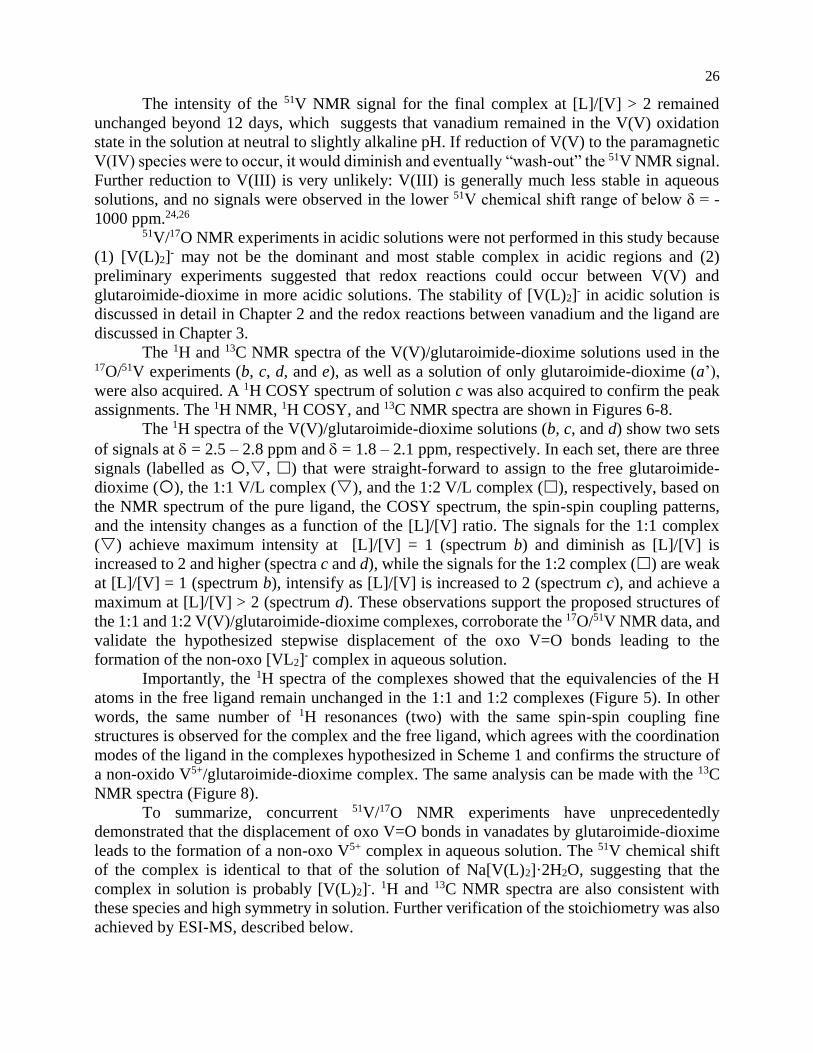
The negative mode ESI-MS spectra for two aqueous solutions (17O-enriched H2O: 10% 17O; 25% 18O; balance 16O) with [L]/[V] = 1 and 2 are shown in Figure 9. Both spectra were
obtained by diluting the solutions with ethanol/natural water (90/10 volume ratio) and directly
spraying in the instrument. The spectrum of the solution with [L]/[V] = 1 (upper spectrum)
shows a main peaks at m/z = 238.00, which corresponds to the methoxide adduct of the 1:1
[V(O)(OH)L]- complex, [V(O)(OCH3)L]- (calculated mass = 238.00) proposed in Scheme 1.
Methoxide (OCH3)- from the electrospray solvent substituted the hydroxide (OH-) of the
[V(O)(OH)L]- complex during the dilution and/or electrospray process. The solution with
[L]/[V] = 3 (lower spectrum) shows a single peak with m/z = 331.04 corresponding to [V(L)2]-
(calculated mass of 331.04), confirming the formation of the 1:2 V/L complex.
According to the manufacturer’s specifications, the 10% 17O-enriched water also
contains at least 25% 18O (see Experimental section for more details). Consequently, the initial
vanadate (Scheme 1) was actually labelled with 17O as well as 18O with the latter in significantly
larger amounts. Therefore, unnatural isotopic patterns, particularly a large (m +2) peak
corresponding to an isotopologue containing one 18O, should be observed if the vanadium
complex still contains an oxo V=*O bond from the vanadate and, more importantly, the (m +2)
peak should be absent if all oxo V=*O bonds of the vanadate are displaced by the glutaroimide-
dioxime ligand. This is indeed what is observed in both spectra. Notably, the base peak of the
mixture with the higher [L]/[V] ratio (Figure 8, lower spectrum) at m/z = 331.04 does not show
the unnatural (m + 2) isotopic pattern that could indicate the presence of one 18O atom (or two 17O atoms with a much lower probability) in the 1:2 complex. This is because all of the oxo
V=*O bonds of the initial 17,18O-labelled vanadate are displaced by the ligands to form the non-
oxo 1:2 V(V)/glutaroimide-dioxime complex in solution. The presence of a small (m +1) peak
at m/z = 331.8 is in accord with the natural 13C/15N abundances.
In contrast, the base peaks for the 1:1 complex [V(O)(OCH3)L]- shows an unnatural (m
+ 2) peak at 240.01, corresponding to the presence of one 18O atom in the complex. The
presence of the (m + 2) peak indicates incomplete displacement of the oxo V=*O bonds of the
initial 17,18O-labelled vanadate in the intermediate 1:1 complex, in agreement with Scheme 1.
It should be remarked that, for the 1:1 complex, the intensities of the (m + 1) peaks include the
contributions from the natural 13C/15N abundances, and the additional contribution from the
isotopologue containing one 17O atom.
The methoxide adduct [V(O)(OCH3)L]- results from facile substitution of OH- by
methoxide in methanol. This is consistent with the existence of the 1:1 V(V)/glutaroimide-
dioxime complex as [V(O)(OH)L]- in aqueous solution as hypothesized in Scheme 1, not as
[VO2(HL)]- observed in solid. The exact mechanism of substitution is unclear, but it is
reasonable to assume that, energetically and kinetically, substitution of a V=O bond in
[VO2(HL)]- is less favorable than that of a V-OH bond in [V(O)(OH)L]-.
To summarize, all of the ESI-MS data have validated the hypothesized reaction scheme
(Scheme 1) and confirmed the formation of the 1:2 non-oxo V5+/glutaroimide-dioxime
complex, [V(L)2]-, in aqueous solution via the displacement of the oxo V=*O bonds. The
presence of an intermediate 1:1 complex that still contains oxo V=O bonds, [V(O)(OH)L]-, in
solution has also been confirmed.
Page 37
28
Figure 9. Negative mode ESI-MS spectra of V(V)/glutaroimide-dioxime complexes in 17,18O-
enriched H2O (10% 17O; ≥ 25% 18O, balance 16O), diluted and sprayed in methanol. (Upper)
[L]/[V] = 1; (lower) [L]/[V] = 3. The (m + 2) peaks in the upper spectrum indicate one 18O
atom and retention of an oxo V=*O bond in the 1:1 complex; the lower spectrum confirms
elimination of all V=*O bonds in the 1:2 complex.
Page 38
29
Structural insights
As previously mentioned, the sorption of V(V) to poly(amidoxime) sorbents in marine
tests was much higher than that of Fe(III) and U(VI). Useful structural insights into the higher
sorption of V(V) can be gained by comparing the structural parameters and coordination modes
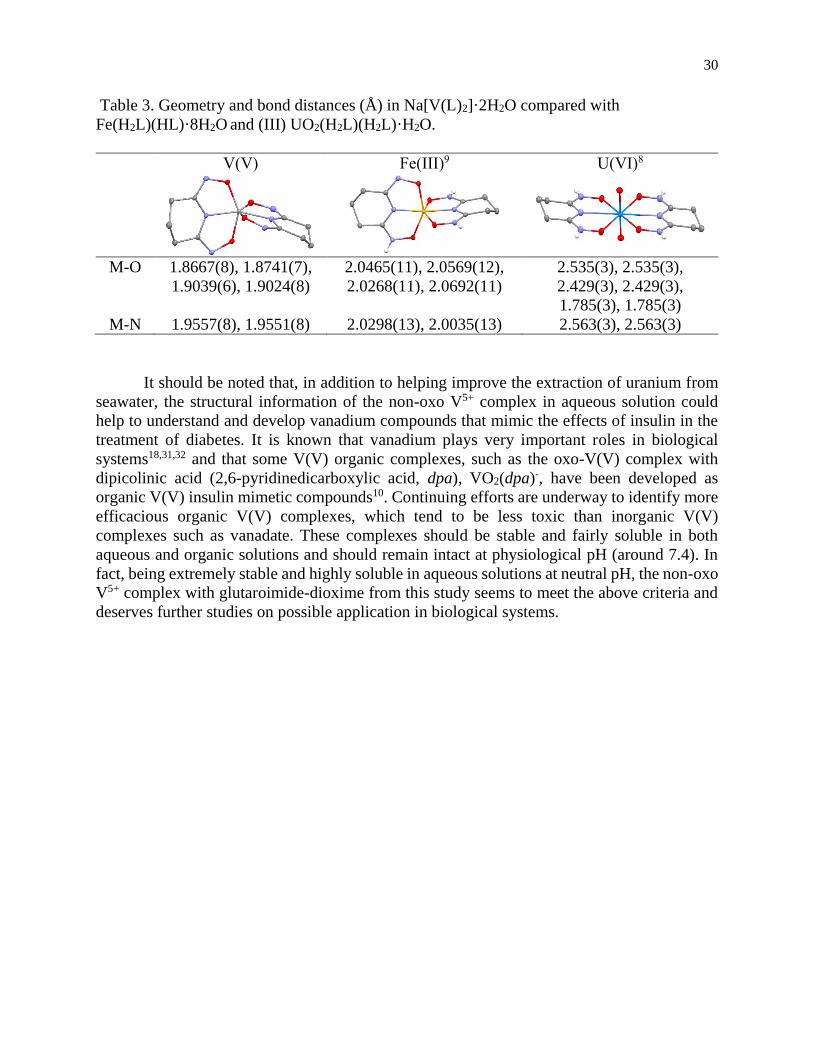
of the glutaroimide-dioxime complexes with V(V), Fe(III), and U(VI), as shown in Table 3.
Both Na[V(L)2]·2H2O and Fe(H2L)(HL)·8H2O are non-oxo metal (V5+ or Fe3+) complexes in
distorted octahedral environments with similar O-V-N and O-Fe-N bond angles of
approximately 73-75°. The average bond distances of V-O and V-N in Na[V(L)2]·2H2O are
1.8868 Å, and 1.9554 Å, respectively, and are shorter than those of Fe-O and Fe-N in
Fe(H2L)(HL)·8H2O by 0.16 Å and 0.06 Å, respectively. Taking into consideration that the ionic
radii for V(V) (0.54 Å) and low spin Fe(III) (0.55 Å) are nearly identical,28 these structure data
indicate that V5+ forms a stronger complex with glutaroimide- dioxime than Fe3+. The
formation of stronger V5+ complexes is most probably responsible for the higher sorption of
V(V) than Fe(III) by poly(amidoxime) sorbents.
The structure of the UO2(H2L)(H2L)·H2O complex is very different from those of
Na[V(L)2]·2H2O and Fe(H2L)(HL)·8H2O. In the U(VI) complex, the UO22+ moiety maintains
its linear di- oxo configuration and the two ligands coordinate to U via its equatorial plane.
Evidently, glutaroimide-dioxime is not sufficiently strong to displace the oxo U=O bonds to
form a “bare” U6+ complex in aqueous solutions. However, it is interesting to note that the
existence of a non-oxo U5+/U4+ couple was reported in the aqueous solutions of redox systems
containing the unsaturated polyoxometalate anions α-[P2W18O62]6-, P2W17O6110-, and
SiW11O398-.29,30 It is probably the strong binding ability of unsaturated heteropolyoxometalates
as well as slow kinetics of formation of the U=O bonds (from U5+ to UO2+) that results in the
existence of a non-oxo U5+ complex in aqueous solutions containing the U5+/U4+ couple.
The degree of deprotonation of glutaroimide-dioxime (as H3L) in the three complexes
decreases in the order: V(V) > Fe(III) > U(VI). In Na[V(L)2]·2H2O, both ligands are triply
deprotonated whereas in Fe(H2L)(HL)·8H2O, one ligand is doubly deprotonated and the other
is singly deprotonated. Lastly, in UO2(H2L)(H2L)·H2O, both ligands are singly deprotonated.
The trend in the degree of deprotonation actually parallels that in the strength of complexation.
Vanadium(V), in the form of the “bare” V5+ ion, undoubtedly forms the strongest complex with
glutaroimide-dioxime in which complete deprotonation of the ligand is facilitated.
In summary, the extremely strong sorption of V(V) by the poly(amidoxime) sorbents is
probably due to the formation of the very stable non-oxo V5+ complex with glutaroimide-
dioxime. To improve the selectivity of the sorbent for U(VI) over V(V), an ideal ligand would
be the one(s) with a binding ability that is sufficiently high for U(VI) but not high enough to
displace the oxo V=O bond(s) in the V(V) species. Starting with the cyclic glutaroimide-
dioxime platform, adding electron- withdrawing groups to the platform could reduce the
basicity of the imide and oxime groups and “fine-tune” the binding ability of the ligand(s).
Page 39
30
Table 3. Geometry and bond distances (Å) in Na[V(L)2]·2H2O compared with
Fe(H2L)(HL)·8H2O and (III) UO2(H2L)(H2L)·H2O.
V(V) Fe(III)9 U(VI)8
M-O
1.8667(8), 1.8741(7),
1.9039(6), 1.9024(8)
2.0465(11), 2.0569(12),
2.0268(11), 2.0692(11)
2.535(3), 2.535(3),
2.429(3), 2.429(3),
1.785(3), 1.785(3)
M-N 1.9557(8), 1.9551(8) 2.0298(13), 2.0035(13) 2.563(3), 2.563(3)
It should be noted that, in addition to helping improve the extraction of uranium from
seawater, the structural information of the non-oxo V5+ complex in aqueous solution could
help to understand and develop vanadium compounds that mimic the effects of insulin in the
treatment of diabetes. It is known that vanadium plays very important roles in biological
systems18,31,32 and that some V(V) organic complexes, such as the oxo-V(V) complex with
dipicolinic acid (2,6-pyridinedicarboxylic acid, dpa), VO2(dpa)-, have been developed as
organic V(V) insulin mimetic compounds10. Continuing efforts are underway to identify more
efficacious organic V(V) complexes, which tend to be less toxic than inorganic V(V)
complexes such as vanadate. These complexes should be stable and fairly soluble in both
aqueous and organic solutions and should remain intact at physiological pH (around 7.4). In
fact, being extremely stable and highly soluble in aqueous solutions at neutral pH, the non-oxo
V5+ complex with glutaroimide-dioxime from this study seems to meet the above criteria and
deserves further studies on possible application in biological systems.
Page 40
31
Summary and conclusions
A rare, non-oxo V(V) complex with glutaroimide-dioxime (H3L), Na[V(L)2]2H2O,
was crystallized from aqueous solution and characterized via x-ray diffraction. The complex
was found to contain two fully deprotonated L3- ligands bound to the bare V5+ cation via two
oxime oxygens and the imide nitrogen. An intermediate complex, Na[VO2(HL)], was also
isolated and found to contain the typical VO2+ moiety present in many V(V) complexes.
Further characterization using 51V, 17O, 1H, and 13C NMR spectroscopy unprecedentedly
demonstrated the stepwise displacement of the oxo oxygens to form the bare V(V)-
glutaroimide-dioxime complex. ESI-MS studies of V(V)-glutaroimide-dioxime solutions
allowed the identification the intermediate 1:1 M:L complex as well as the bare V(L)2 complex
at m/z = 331.0.
Structural insights into the much higher sorption of V(V) to amidoxime-based sorbents
relative to U(VI) and Fe(III) were gained by comparing the structural parameters of the V(V)-
glutaroimide-dioxime complex with the analogous U(VI)- and Fe(III)-glutaroimide-dioxime
complexes. For these complexes, the degree of protonation of the ligand was found to decrease
from U(VI) to V(V). In conjunction with the substantially shorter bond lengths observed for
the V(V) complex relative to the other complexes, this implies stronger bonding in the V(V)
complex and higher thermodynamic stability. In fact, the trend in binding strengths parallels
the observed trend in sorption of these cations to poly(amidoxime) sorbents in marine tests.
Lastly, as there are ongoing studies to synthesize vanadium(V) compounds suitable for
the treatment of diabetes, the structural studies with glutaroimide-dioxime are useful for aiding
the development of new, highly stable organic V(V) compounds. In fact, the high solubility of
Na[V(L)2]2H2O in aqueous and ethanol solutions coupled with its stability at neutral pH could
make it a potential candidate for study in bioinorganic vanadium studies such as for diabetic
treatments.
Page 41
32
References
(1) Tamada, M.; Seko, N.; Kasai, N.; Shimizu, T. Cost Estimation of Uranium Recovery
from Seawater with System of Braid Type Adsorbent. Transactions of the Atomic
Energy Society of Japan, 2006, 5, 358–363.
(2) Kim, J.; Tsouris, C.; Oyola, Y.; Janke, C. J.; Mayes, R. T.; Dai, S.; Gill, G.; Kuo, L. J.;
Wood, J.; Choe, K. Y.; Schneider, E.; Lindner, H. Ind. Eng. Chem. Res. 2014, 53,
6076–6083.
(3) Wang, D.; Sañudo Wilhelmy, S. a. Mar. Chem. 2009, 117, 52–58.
(4) Gill, G. A.; Kuo, L.-J.; Janke, C. J.; Park, J.; Jeters, R. T.; Bonheyo, G. T.; Pan, H.-B.;
Wai, C.; Khangaonkar, T.; Bianucci, L.; Wood, J. R.; Warner, M. G.; Peterson, S.;
Abrecht, D. G.; Mayes, R. T.; Tsouris, C.; Oyola, Y.; Strivens, J. E.; Schlafer, N. J.;
Addleman, R. S.; Chouyyok, W.; Das, S.; Kim, J.; Buesseler, K.; Breier, C.;
D’Alessandro, E. Ind. Eng. Chem. Res. 2016, 55, 4264–4277.
(5) Turekian, K. K. Oceans; Prentice-Hall: Englewood Cliffs, N. J., 1968.
(6) Kim, J.; Tsouris, C.; Mayes, R. T.; Oyola, Y.; Saito, T.; Janke, C. J.; Dai, S.;
Schneider, E.; Sachde, D. Sep. Sci. Technol. 2013, 48, 367–387.
(7) Vukovic, S.; Watson, L. a; Kang, S. O.; Custelcean, R.; Hay, B. P. Inorg. Chem. 2012,
51, 3855–3859.
(8) Tian, G.; Teat, S. J.; Zhang, Z.; Rao, L. Dalton Trans. 2012, 41, 11579.
(9) Sun, X.; Xu, C.; Tian, G.; Rao, L. Dalton Trans. 2013, 42, 14621–14627.
(10) Crans, D. C.; Mahroof-Tahir, M.; Johnson, M. D.; Wilkins, P. C.; Yang, L.; Robbins,
K.; Johnson, A.; Alfano, J. A.; Godzala, M. E.; Austin, L. T.; Willsky, G. R.
Inorganica Chim. Acta 2003, 356, 365–378.
(11) Hoard, J. L.; Scheidt, W. R.; Countryman, R. J. Am. Chem. Soc. 1971, 93, 3878–3882.
(12) Kelley, S. P.; Barber, P. S.; Mullins, P. H. K.; Rogers, R. D. Chem. Commun. 2014,
50, 12504–12507.
(13) Allen, F. H. Acta Crystallogr. Sect. B Struct. Sci. 2002, 58, 380–388.
(14) Morgenstern, B.; Kutzky, B.; Neis, C.; Stucky, S.; Hegetschweiler, K.; Garribba, E.;
Micera, G. Inorg. Chem. 2007, 46, 3903–3915.
(15) Carrondo, M. A. A. F. de C. T.; Duarte, M. T. L. S.; Fraústo da Silva, J. J. R.; da Silva,
J. A. L. Struct. Chem. 1992, 3, 113–119.
(16) Cooper, S. R.; Koh, Y. B.; Raymond, K. N. J. Am. Chem. Soc. 1982, 104, 5092–5102.
(17) da Silva, J. A. L.; Fraústo da Silva, J. J. R.; Pombeiro, A. J. L. Coord. Chem. Rev.
2013, 257, 2388–2400.
(18) Smith, P. D.; Berry, R. E.; Harben, S. M.; Beddoes, R. L.; Helliwell, M.; Collison, D.;
Garner, C. D. J. Chem. Soc. Dalt. Trans. 1997, 4509–4516.
(19) Buglyó, P.; Culeddu, N.; Kiss, T.; Micera, G.; Sanna, D. J. Inorg. Biochem. 1995, 60,
45–59.
(20) Leggett, C. J.; Rao, L. Polyhedron 2015, 95, 54–59.
(21) Bruker Analytical X-ray Systems Inc. Bruker Apex 2, 2003.
(22) Sheldrick, G. M. Acta Crystallogr. Sect. A Found. Crystallogr. 2015, 71, 3–8.
(23) Heath, E.; Howarth, O. W. J. Chem. Soc. Dalt. Trans. 1981, 1105.
(24) Howarth, O. W. Prog. Nucl. Magn. Reson. Spectrosc. 1990, 22, 453–485.
(25) Gresser, M. J.; Tracey, A. S. J. Am. Chem. Soc. 1985, 107, 4215–4220.
Page 42
33
(26) Figgis, B. N.; Kidd, R. G.; Nyholm, R. S. Proc. R. Soc. A Math. Phys. Eng. Sci. 1962,
269, 469–480.
(27) Lutz, O.; Nepple, W.; Nolle, A. Zeitschrift für Naturforsch. A 1976, 31, 3–7.
(28) Shannon, R. D. Acta Crystallogr. Sect. A 1976, 32, 751–767.
(29) Chiang, M. H.; Soderholm, L.; Antonio, M. R. Eur. J. Inorg. Chem. 2003, 2929–2936.
(30) Shilov, V. P.; Yusov, A. B.; Fedoseev, A. M.; Moisy, P. Radiochemistry 2008, 50,
455–459.
(31) Sigel, A.; Sigel, H. Metal Ions in Biological Systems: Volume 31: Vanadium and its
Role for Life; CRC Press: Boca Raton, FL, 1995.
(32) Metal Sites in Proteins and Models; Hill, H.A.O., Sadler, P.J., Thomson, A. J., Ed.;
Springer-Verlag Berlin Heidelberg, 1997.
Page 43
34
Chapter 3
Kinetic studies of glutaroimide-dioxime binding to V(V), U(VI),
and Fe(III)
Page 44
35
Introduction1
One of the major challenges with current amidoxime-functionalized polymer adsorbents
is the relatively low selectivity of these functional groups for uranium over other metals,
vanadium and iron in particular. For example, 56-day marine tests have shown that the relative
abundance of metal elements absorbed by amidoxime-functionalized polymer adsorbents (in
molar percent) follows the order: vanadium (14.9%) >> iron (1.6%) > uranium (1.0%), though
the concentrations of the three elements in seawater are comparable.1 To understand the
sorption behavior of uranium and other elements and help to improve the efficiency and
selectivity of amidoxime-functionalized adsorbents for the recovery of uranium from seawater,
both thermodynamic and kinetic studies of the interactions between amidoxime and the key
metals are necessary. Recently, a number of systematic thermodynamic and structural studies
on the complexation of amidoxime-related ligands with U(VI), Fe(III), and V(V) have been
reported, forming complexes with both 1:1 and 1:2 metal/ligand ratios as shown in Scheme 1.2–
8 The binding strength of the ligand toward the metal ions follows the trend V(V) > Fe(III) >
U(VI), in agreement with the order of adsorption of these elements in marine tests.1 The
structures of the complexes have been identified both in aqueous solution as well as in isolated
molecular complexes using a combination of characterization techniques including X-ray
crystallography, X-ray absorption, and multi-nuclear NMR spectroscopy.5–7,9 The data on the
complexation of L with V(V) are especially enlightening; vanadium actually forms a rare non-
oxido V(V) complex with glutaroimide-dioxime, 2, in the solid state as well as in aqueous
solution,5 which provides convincing interpretation for the much stronger adsorption of
vanadium than uranium and iron in marine tests (see Chapter 1).
In contrast to the number of thermodynamic studies, there have been no kinetic studies
performed to determine the rates of complexation reactions between L and U(VI), Fe(III) and
V(V). To fill in this gap and help optimize the performance of the sorption process, kinetic data
on these complexation reactions were obtained and compared among the key elements in the
present study. The kinetics of the formation of V(V) complex 2 is of particular interest because
it requires the removal of the oxido V=O bonds in vanadate so that it is expected to be slower
than the formation of V(V) complex 1, U(VI) complexes 3 and 4, and Fe(III) complexes 5 and
6 where no such oxido bonds need to break. As shown in Scheme 1, the formation of 1:2
complexes 2, 4, and 6 all occur stepwise, with the formation of the 1:1 complexes 1, 3, and 5
as intermediates, respectively. The relative rates of formation and speciation determine whether
or not 1, 3, and 5 can be observed or isolated. Anticipating drastic differences in the rates of
complexation reactions shown in Scheme 1, we have selected two spectroscopic techniques
applicable to reactions with two drastically different time scales in the present study: stopped-
flow absorption spectroscopy for fast reactions taking place over seconds and conventional
absorption spectroscopy for slow reactions taking hours to days.
The contents of this chapter have been previously published in "Kinetics of complexation of
V(V), U(VI), and Fe(III) with glutaroimide-dioxime: studies by stopped-flow and
conventional absorption spectroscopy"; Bernard F. Parker, Zhicheng Zhang, Christina J.
Leggett, John Arnold, Linfeng Rao; Dalton Transactions, 2017, DOI: 10.1039/C7DT01597F.
Page 45
36
Scheme 1. Metal complexation reactions of glutaroimide-dioxime explored in this study.
Stopped-flow kinetic experiments coupled with a detection technique can be used to
monitor reactions that occur on the millisecond to second timescale. Two reagent solutions are
rapidly mixed, and fast spectroscopic techniques monitor the reaction mixture at regular
intervals. This is a fairly common technique in analytical biochemistry since many processes
occur on this scale, including but not limited to metal binding to proteins and other
biomolecules, and enzyme-substrate interactions.10 Species are generally quantified by
fluorescence or optical absorbance, the latter of which we have used in our study. Redox
reactions of metals are also commonly investigated, due to ease of monitoring their
characteristic absorbances and timescales that are often suitable for stopped-flow
techniques.11,12
The slow reaction of the formation of complex 2, occurring in a time span from hours
to days, was monitored by techniques including conventional UV-Visible spectroscopy and
NMR experiments. 51V NMR chemical shifts of all common vanadium species have been
reported by Howarth and others, and the spectra are generally quantitative which allows
detailed speciation studies.13,14 Using these techniques in tandem, a much more complete
picture of the vanadium-ligand interactions is obtained than by any one technique alone.
In the present study, the experimental conditions were optimized to attempt to obtain
the rate of only one reaction for each metal ion, ideally with only one dominant protonation
state to enable accurate and reproducible conversion of absorbance to concentrations. This
allows us to propose the most reasonable mechanisms for the complexation reactions. Because
Page 46
37
pseudo first-order reaction conditions are difficult to maintain in these systems, initial rates are
always used in the analysis of the kinetic data.15 It should be noted that, although all the above
attempts have been made, explicit and complete rate equations were not determined in this
study due to the complexity of the reaction systems, particularly with respect to [H+] and
changing metal speciation. However, definitive reaction orders with respect to the metal ion
and the ligand were derived and data of the rates of complexation were obtained that allowed
a meaningful comparison of the kinetics among V(V), U(VI), and Fe (III) systems.
Page 47
38
Experimental
Chemicals Glutaroimide-dioxime was prepared according to literature procedure and recrystallized
twice from methanol before use.5 All other chemicals were obtained from commercial sources
and used as received. Milli-Q water was used to prepare all solutions. Vanadium solutions were
prepared by dissolving sodium orthovanadate (99.99%) in water. Iron solutions were prepared
by dissolving FeCl3⋅xH2O in dilute HCl, followed by titration with EDTA using salicyldehyde
as a complexometric indicator. The Ca/Mg-U(VI)-triscarbonato solutions were prepared by
appropriate dilutions of a standardized stock solution of U(VI) (CU = 0.246 M) with added
CaCl2, MgCl2, NaHCO3, and NaCl as appropriate.
All experiments were performed at room temperature (21 - 23°C). No particular
attempts were made to control the ionic strength. The ionic strength would vary with the acidity
of the system due to different degree of ionization of reactants (e.g., vanadate and L). However,
except for the NMR experiments where higher concentrations of reactants (up to 18 mM) were
used, the concentrations of metal ions and the ligand are from 0.2 to 0.5 mM and the
concentrations of other reactants (carbonate, Ca(II), Mg(II), etc.) are in a few mM range. By a
rough estimation, the ionic strength of the reaction systems in the stopped-flow and
conventional spectroscopic experiments was below 0.05 M.
Stopped-flow kinetic experiments Stopped-flow experiments were performed on a computer-controlled OLIS RSM-1000
Stopped-Flow Spectrometer. Two reactant solutions (typically one containing the metal ion
and the other the ligand) are loaded into two syringes, driven by pneumatic pistons, and rapidly
mixed in the mixer that is specially designed to achieve > 99% mixing for liquids with normal
viscosity within a millisecond. The OLIS RSM-1000 allows the collection of absorption spectra
(or fluorescence spectra) of the reaction mixture at certain time intervals (as short as one
millisecond) for a certain period of time, making it suitable for studying the kinetics of
complexation reactions that usually have reaction times in seconds.
Because equal volumes of the reactant solutions (the metal solution and the ligand
solution) were mixed to achieve the final reaction mixture, the ligand and metal solutions
loaded into the syringes have concentrations 2-fold of the final concentrations. When acid or
base was added, it was added to the ligand solution and allowed to reach equilibrium before
the stopped-flow experiments in order to prevent problems arising from precipitation of iron
or uranium, or formation of oligomers of vanadium. Iron solutions were prepared the same day
they were used and were checked for hydrolysis products. The absorption of the 1:1 vanadium
complex 1 was monitored at 290 nm; uranyl complexes 3 and 4 were monitored at 315 nm; the
iron complex 5 was monitored at 375 nm (Scheme 1). No buffer was used to avoid interference
that could result from the complexation between buffers and metal ions, and to prevent
additional features in absorbance spectra, which has been noted to be problematic in previous
kinetic studies performed by Larsson et. al.16. The pH of the iron and vanadium reaction
systems were checked and were found to vary little over the course of the experiment (± 0.2
pH units after initial mixing). Blank-dilution experiments were performed and no changes in
initial metal speciation or pH were observed from dilution on the stopped-flow time scale.
Page 48
39
Between 3 and 10 replicate experiments were performed for each set of concentrations.
Molar absorptivity was determined by standard dilutions of solutions of the same composition
as used in stopped-flow experiments when needed. The initial rates of the reactions were
calculated by fitting using least-squared methods in Microsoft Excel and errors in rates are
those arising from fitting the initial reaction rate of the stopped-flow experiments. Attempts
were made to fit the stopped-flow kinetic data using the Global Works software package from
OLIS Company and the results were generally agreeable with those obtained by the analysis of
initial rates. However, due to the reversibility and complex nature of the reaction, there are
multiple possible solutions for the fit found in the OLIS software without a clear indication of
which is most accurate and comparable across all data sets. Therefore, we elected to use the
analysis of initial rates throughout the present work due to its simplicity and applicability also
to the analysis of conventional spectrophotometric data for slower reactions.
Conventional UV-Visible spectrophotometry Conventional UV-Visible spectroscopy experiments were performed on a Cary 50
Spectrophotometer to study the complexation reactions that are too slow for the stopped-flow
technique, specifically, the formation of the non-oxido 1:2 vanadium complex 2, V(L)2-
(Scheme 1). Complex 2 was monitored at 440 nm. Upon acquisition of the first data point (30
minutes), all of the vanadium was expected to have formed the 1:1 complex based on previous
work and stopped-flow results, and decavanadate was never observed in any experiment.
1H and 51V NMR studies
1H NMR spectra were acquired on a Bruker AV-500 instrument (500 MHz) using a
WATERGATE solvent suppression pulse sequence. 51V NMR spectra were acquired on a
Bruker DRX-500 instrument (131 MHz). All spectra were referenced to an external standard
of VOCl3 in C6D6.
Page 49
40
Results and Discussion
Interactions between vanadium(V) and glutaroimide-dioxime
Preliminary experiments and previous work indicated that the formation of the 1:1
V(V)/L complex, VO2(HL)- (complex 1 in Scheme 1) is fast while the formation of the 1:2
V(V)/L complex, V(L)2- (complex 2 in Scheme 1) is slow.5 Therefore, stopped-flow
spectroscopy and conventional spectroscopy were used to study the rate of formation of
complexes 1 and 2, respectively. In seawater, the concentration of vanadium is extremely low
(10 - 30 nM, varying with salinity and seasons)17, such that it exists mainly as monomeric V(V)
vanadates of varying protonation states.
Rate of formation of VO2(HL)-
The stopped-flow experiments were conducted by rapidly mixing two solutions, one
vanadium solution and the other glutaroimide-dioxime solution, and monitoring the change in
the absorption spectra of the mixture over time in the wavelength region of 225 nm – 375 nm.
To ensure that the absorbance was in the linear range throughout the experiment, vanadium
concentrations of 0.050 – 0.200 mM and ligand concentrations of 0.375 – 1.00 mM were used.
In the absence of additional acid or base added to the reactants, the final pH of the reaction
mixture was 8.0 0.2 for most experiments. Under these conditions the vanadium is in the
monomeric form [H2VO4]-/[HVO4]2-.18,19
Representative absorption spectra obtained on the stopped-flow spectrometer are shown
in Figure 1, the increase in absorbance at 290 nm over time demonstrating the formation of 1
(Scheme 1) is shown in Figure 2, and kinetic data varying [L] and [V] are shown in Figures 3
and 4. The data indicate that complex 1 formed rapidly upon mixing of the two reactants,
reaching a steady state within 20-60 seconds when [V] = 0.200 mM and [L] = 0.500 mM with
no additional acid or base added into the reactant solutions. By analyzing the kinetic trace in
Figure 2 (absorbance vs. time), the initial rate of the reaction, (d[1]/dt)o, is calculated.
For the complexation reaction between V(V) and L to form complex 1, a simplified
general rate equation can be written as:
(d[1]/dt)0 = k [V]a[L]b f([H+]) (1)
Where [V] and [L] denote the initial concentrations of V and L, and a and b are reaction orders
with respect to reactants V and L, respectively. Since the reaction mechanism involving H+ is
expected to be complex and may change over different pH ranges, and it is difficult to define
the reaction order with respect to H+, we use the term f([H+]) as a function of [H+] in equation
1 rather than an exponential function.15 By maintaining a constant acidity, the rate equation can
be expressed as:
(d[1]/dt)0 = k' [V]a[L]b (2)
where k' denotes the conditional rate constant at a certain acidity.
Page 50
41
Figure 1. Representative spectra for the formation of complex 1 monitored by stopped-flow
absorption spectroscopy, showing changes in the spectra over time (0.1 – 24.0 seconds; the
number of spectra has been reduced for clarity). Conditions: [L] = 0.500 mM, [V] = 0.200 mM.
Figure 2. Absorbance changing over time at 290 nm (from Figure 1)
0
0.2
0.4
0.6
0.8
1
1.2
260 280 300 320 340 360
Ab
sorb
ance
Wavelength (nm)
0
0.2
0.4
0.6
0.8
1
0 6 12 18 24
Ab
sorb
ance
at
29
0 n
m
Time (s)
Absorbance plotted
at 290 nm
Page 51
42
Figure 3. Sample curves for the formation of complex 1 from stopped-flow kinetic experiments
showing the effect of ligand concentration. Conditions: [V] = 0.200 mM, pH = 8.
Figure 4. Sample curves for the formation of complex 1 from stopped-flow kinetic experiments
showing the effect of vanadium concentration. Conditions: [L] = 0.500 mM, pH = 8.
0
0.3
0.6
0.9
0 4 8 12 16 20
Ab
s
Time (s)
[L] = 0.375 mM
[L] = 0.500 mM
[L] = 0.625 mM
[L] = 0.750 mM
[L] = 1.00 mM
0
0.3
0.6
0.9
0 4 8 12 16 20
Ab
s
Time (s)
[V] = 0.050 mM
[V] = 0.100 mM
[V] = 0.150 mM
[V] = 0.200 mM
Page 52
43
Figure 5. Initial rate of the formation of complex 1 as a function of [V], monitored by
stopped-flow UV-Visible spectroscopy, from Figure 3. Conditions: constant [L] = 0.500 mM.
Figure 6. Initial rate of the formation of complex 1 as a function of [L], monitored by
stopped-flow UV-Visible spectroscopy, from Figure 4. Conditions: [V] = 0.200 mM.
0
0.01
0.02
0.03
0 0.06 0.12 0.18 0.24
Init
ial r
ate
(m
M·s
-1)
[V] (mM)
slope = 0.160 ± 0.010
0
0.02
0.04
0.06
0 0.3 0.6 0.9 1.2
Init
ial r
ate
(m
M·s
-1)
[L] (mM)
slope = 0.0483 ± 0.0016
Page 53
44
By keeping either [L] or [V] constant in the experiments, the rate equation becomes
(d[1]/dt)0 = kobs,V [V]a (3)
or
(d[1]/dt)0 = kobs,L [L]b (4)
By analyzing the initial reaction rate as a function of [V] or [L], the observed rate constants,
kobs,V and kobs,L, as well as the reaction orders a and b can be calculated.
Figures 5 and 6 show the plots of initial rate vs. [V] and [L], respectively. Both plots
show linear relationships that pass through the origin, indicating that a = 1 and b = 1. In other
words, the formation of complex 1 is first-order with respect to both [V] and [L]. From the
slopes of these plots, the observed rate constants were calculated to be kobs,V = (0.16 0.01) s-1
(Figure 5) and kobs,L = (0.0483 0.0016) s-1 (Figure 6). From these values, the conditional rate
constant in equation (2) (where a = 1 and b = 1) was calculated to be k’ = (0.28 ± 0.02) mM-
1⋅s-1, corresponding to the rate of formation of complex 1 being 0.028 mM⋅s-1 when [V] = 0.200
mM and [L] = 0.500 mM and pH = 8.0 0.2.
The reaction conditions shown in Figures 1-6 correspond to the systems where no
additional acid or base was added to the solutions of V or L and the pH was 8.0 0.2. Stopped-
flow experiments were also conducted at different pH (from 5.9 to 9.4) from by adding different
quantities of acid or base into the reaction mixture while maintaining constant concentrations
of other reagents, with the objectives of investigating the reaction order with respect to H+.
However, as Figure 7 shows, the dependence on acid or base is complex. Higher acidity
generally facilitates the formation of 1, and an approximate 50-fold increase in rate is observed
when adding two equivalents of acid, strongly suggesting that multiple reaction pathways could
exist and the reaction mechanism varies in different pH regions. Therefore, it is difficult to
calculate the reaction order with respect to H+ for a broad pH region.
The equilibrium vanadium and vanadium-ligand systems also vary with pH, further
complicating the reactions. However, the speciation can be calculated in the presence and
absence of ligand (Figures 9 and 10), and in a simplified case for a narrow and near neutral pH
region that is most relevant to seawater conditions, a plot of the initial rates (in the logarithm
unit) as a function of pH (Figure 8) indicates a linear correlation with a slope of 0.90 0.15,
implying that the complexation reaction is approximately first order with respect to H+, in the
narrow region of acidity. The dependence of the reaction rate on acidity strongly suggests the
deprotonation of the central N followed by protonation of the oxygen side arms in glutaroimide-
dioxime is the rate-limiting step.
Page 54
45
Figure 7. The effect of acidity on the initial rate of the formation of complex 1, monitored by
stopped-flow UV-Visible spectroscopy. Conditions: [L] = 0.500 mM, [V] = 0.200 mM.
Figure 8. The effect of pH on the initial rate of the formation of complex 1, showing the initial
rate vs. pH in a narrow near-neutral region. Conditions: [L] = 0.500 mM, [V] = 0.200 mM.
4
5
6
7
8
9
10
0
0.2
0.4
0.6
0.8
1
1.2
1.4
1.6
-0.5 -0.4 -0.3 -0.2 -0.1 0 0.1 0.2 0.3 0.4 0.5
pH
Init
ial r
ate
(μ
M·s
-1)
(positive) [H+] added / (negative) [OH-] added [mM]
0.01
0.1
66.26.46.66.87
Init
ial r
ate
(μM
·s-1
)
pH
Page 55
46
Figure 9. Speciation of 0.2 mM V(V) in the absence of L, using equilibrium constants of
V(V) speciation from literature sources.20 Conditions: [V] = 0.2 mM.
Figure 10: Speciation of 0.2 mM V(V) with 0.5 mM L, using equilibrium constants for V(V)
speciation20 and V(V) – L equilibrium constants.21 Conditions: [V] = 0.2 mM, [L] = 0.5 mM.
Page 56
47
Rate of formation of V(L)2-.
The formation of complex 2, the 1:2 V/L complex (Scheme 1), is much slower, such
that the reactions need to be monitored by conventional absorption spectroscopy over four
weeks (acquiring spectra every 1-2 days). The absorbance at 440 nm was monitored for the
formation of 2. The same concentration ranges as those used in the stopped-flow experiments
described in Section 3.1.1 were used to ensure that the absorbance was in the linear range. By
analyzing the spectra, the rate of formation of 2 as a function of time under different conditions
is calculated and shown in Figures 11-13.
The formation of the 1:2 complex 2 occurs much more slowly than that of the 1:1
complex 1. In general, the rate of formation of complex 2 increases as the concentration of
vanadium (Figure 11) is increased. In all of these experiments varying [L] and [V] (Figures 11
and 12), there seems to be an “induction” period of 1-2 days when the formation of complex 2
is extremely slow, though addition of acid eliminates this delay period along with increasing
the reaction rate as shown in Figure 13.
Similar to the formation of complex 1, the rate of formation of complex 2 is
complicated and greatly affected by the acidity. As shown in Figure 13, the reaction rate of
complex 2 is dramatically increased at higher acidity: at the two highest acid concentrations,
the concentration of complex 2 reached a maximum within two days, followed by
decomposition of complex 2 back to 1 and other products, which are discussed below. Again,
like the formation of complex 1, it is not possible to estimate the reaction order of the formation
of complex 2 with respect to [H+] due to the complexity of the reaction mechanism involving
the proton. However, it is possible to estimate the rate of formation of complex 2 to be 5 ×10⁻⁷
mM⋅s-1 under the concentrations of [V] = 0.2 mM, [L] = 0.5 mM without additional acid or
base added (pH = 8.0 0.5). In comparison with the rate of formation of 1 under the same
concentrations (2.8 ×10⁻² mM⋅s-1), the formation of complex 2 is approximately five orders of
magnitude slower than that of complex 1.
Page 57
48
Figure 11. Formation of complex 2 over time, varying [L] at constant [V] = 0.200 mM.
Figure 12. Formation of complex 2 over time, varying [V] at constant [L] = 0.500 mM.
0
0.05
0.1
0.15
0.2
0 7 14 21 28
[2]
(mM
)
Time (days)
[L] = 0.375 mM
[L] = 0.500 mM
[L] = 0.750 mM
0
0.03
0.06
0.09
0.12
0 7 14 21 28
[2]
(mM
)
Time (days)
[V] = 0.100 mM
[V] = 0.150 mM
[V] = 0.200 mM
Page 58
49
Figure 13. Formation of complex 2 over time, adding acid or base with constant [L] = 0.500
mM and [V] = 0.200 mM.
Figure 14. Spectra monitoring the formation of 2 over time by conventional UV-Vis
absorption spectroscopy. The number of spectra shown has been reduced for clarity.
Conditions: [V] = 0.200 mM; [L] = 0.500 mM.
0
0.04
0.08
0.12
0.16
0.2
0 7 14 21 28
[2]
(mM
)
Time (days)
0.4 mM OH-
No H/OH
0.2 mM H+
0.4 mM H+
0.6 mM H+
0.8 mM H+
0
0.2
0.4
0.6
0.8
1
250 300 350 400 450 500 550 600
Ab
sorb
ance
Wavelength (nm)
1h
3d
7d
14d
22d
28d
Page 59
50
Reaction mechanism of the formation of V(V) complexes 1 and 2
Due to the rarity of the non-oxido V(V) center, little is known about the kinetics of the
reactions involving such species, although examples of non-oxido V(IV) are known, with
limited kinetic studies of complex formation and decomposition.22,23 As previously described,
the dependence of the rate of formation of complexes 1 and 2 on the acid is complicated and
difficult to define in the present study. Adding acid or base, especially acid, to the reaction
mixture has significant impact on the speciation and the rate of formation of both 1 and 2, but
in fact the solution pH does not change much during the course of the reaction due to the
presence of various weakly acidic species (ligand, vanadate, and most likely the complexes)
and/or their conjugate bases that can buffer the solutions effectively. Based on the strong
dependence of reaction rates on acid, a key step in the formation of both complexes 1 and 2 is
likely the protonation and subsequent hydrolysis of one or more oxido ligands on vanadate. In
the case of complex 2, this step is many orders of magnitude slower (days) than the formation
of complex 1 (seconds). Formation of a previously reported non-oxido V(IV) complex with the
tridentate ligand derived from cis-inositol22 has shown similar time periods for equilibration of
a few days, although that reaction was found to be complex and no mechanism was elucidated.
A notable feature of the formation of complex 2 is that the rate of formation is
apparently zero-order with respect to [L] in the initial period including the “induction” period
(Figure 12), suggesting that the protonation of complex 1 and/or subsequent loss of water is
rate-determining and are much slower than the complexation with the second ligand (Scheme
2). The induction period could be attributed to the slow onset of the reaction formally producing
acid (i.e. the 1:1 complex is more basic than the 1:2 complex) resulting in acceleration of the
reaction once it starts. The bonds of the two remaining oxido ligands in complex 1 should be
stronger than the oxido bonds in orthovanadate based on bond lengths and the rate of ligand
exchange. The V=O bonds in complex 1 are 1.6781(15) and 1.6734(14) Å, whereas in
inorganic vanadates with four oxido groups, the bonds are longer, typically 1.72-1.75 Å, and
oxido ligand exchange occurs readily in basic solution.5,24,25 This is reflected in the slower
reactivity of the last two oxido ligands to form complex 2 compared to the formation of
complex 1 from vanadate. The above discussions are illustrated in Scheme 2.
Page 60
51
Scheme 2. Proposed stepwise mechanism of formation of 2 from 1 accounting for kinetic
observations. Not all tautomers of complexes and intermediates are shown.
In the absence of vanadium, glutaroimide-dioxime is unstable towards acid hydrolysis
in solutions at pH 3 or lower.26 The decomposition of the ligand alone is probably a
straightforward acid-catalyzed hydrolysis of a carboxylate derivative, ultimately to glutaric
acid.27 On the other hand, metal-catalyzed decomposition of ligand could also be a cause of the
instability of 2. The vanadium ion in 2 is a non-oxido "V5+" which would be expected to be
highly Lewis acidic, such that it could also promote ligand decomposition at much lower
concentrations of [H+] present at near-neutral pH. On the other hand, 1 appears to be stable
indefinitely, presumably due to the metal's much lower Lewis acidity due to the presence of
the two oxido ligands. When examining the reactivity at the metal center, we can view 1 as
having the composition ([VO2+][HL2-]), in contrast to 2 having the composition ([V5+][(L)2
3-]),
with the lower charge density at the metal leading to lower Lewis acidity, which in turn does
not promote ligand hydrolysis. This is also consistent with trends seen in the 51V NMR
chemical shifts, where the non-oxido compound 2 exhibits a very downfield chemical shift
(+740 ppm)5 , while most known oxovanadium(V) compounds have a much higher field signal
(-410 ppm for 1) due to significant shielding from the -bonding oxido ligands.13
Page 61
52
1H and 51V NMR of glutaroimide-dioxime – vanadium mixtures 51V and 1H NMR experiments were conducted to follow the speciation of vanadium(V)
as a function of time (over 10 days), corroborate the data obtained by absorption spectroscopy,
and help confirm our proposed mechanism. The chemical shifts on the 51V and 1H NMR spectra
can be assigned to monomeric or oligomeric vanadates, or the 1:1 and 1:2 complexes 1 and 2,
respectively, based on previous studies.5,13 Because NMR spectroscopy is relatively
insensitive, higher vanadium concentrations are needed. In the present NMR experiments, the
concentration of vanadium ranged from 3 to 18 mM, approximately 10-20 times higher than
those in UV-Visible absorption experiments.
Results of 1H and 51V NMR experiments are shown in Figures 15-24, at three different
[V]/[L] ratios. A wider variety of species are observed in this concentration regime than at low
concentrations. The 1:1 complex 1 forms very fast, and the 1:2 complex, 2, forms in days,
reaching maximum concentration at around 3 days followed by decomposition back to complex
1 and other products. Because higher concentrations of V(V) were used in the NMR
experiments, decavanadate ([HiV10O28](6-i)-) was initially observed, but reverted to monomeric
vanadate within 1-2 days, consistent with previously studied vanadate systems.14,18 As shown
in Figure 16, the concentration of decavanadate decreases in accordance with the formation of
V(V) glutaroimide-dioxime complexes. The approximate rates of formation of V(V)
complexes 1 and 2 observed by NMR corroborate very well those observed by absorption
spectroscopy.
It appears that the time it took for the decavanate to revert to monomeric vanadate and
react with glutaroimide-dioxime (1-2 days, Figures 17 and 21) coincides with the “induction”
period of the formation of complex 2 (1-2 days, Figures 11-13). However, it is unlikely that
the dissociation of decavanate is the direct cause of the delay since the same delay was also
observed at lower vanadium concentrations where no decavanadate was present, and there is
nothing inherent to the structure of decavanadate that would hinder the complexation of free
vanadates.
The NMR data (Figures 18 and 22) indicate that the rate of formation as well as the
stability of the 1:2 non-oxido V(V) complex 2 is highly dependent on added acid, in agreement
with the optical absorption data (Figure 13). With more than 2 equivalents of acid (with respect
to vanadium) added, complex 2 forms quickly and starts to decompose in 1-2 days. The
decomposition results in partial or complete hydrolysis of the ligand, since some of the
decomposition products observed are consistent with previously observed hydrolysis products
and the ammonium ion was also formed in this process.27
Page 62
53
Figure 15. 51V NMR spectra monitoring speciation of a V/L mixture over time.
Conditions: [V] = 3 mM, [L] = 6 mM, pH = 7-8.
Figure 16: 1H NMR spectra monitoring speciation of a V/L mixture over time
Conditions: [V] = 3 mM, [L] = 6 mM, pH = 7-8.
Page 63
54
Figure 17. Speciation of a V/L mixture over time monitored by 51V NMR (Figure 13).
Conditions: [L] = 6 mM, [V] = 3 mM, pH = 8.0 0.2.
Figure 18. Speciation of a V/L mixture over time monitored by 1H NMR (Figure 14).
Conditions: [L] = 6 mM, [V] = 3 mM, pH = 8.0 0.2.
0
20
40
60
80
100
0 2 4 6 8 10
V s
pec
iati
on
(%
)
Time (days)
[VL]
[VL2]
Decavanadate
0
20
40
60
80
100
0 2 4 6 8 10
Liga
nd
sp
ecia
tio
n (
%)
Time (days)
Free L
[VL]
[VL2]
Decomposition products
Page 64
55
Figure 19. 51V NMR spectra monitoring speciation of a V/L mixture over time.
Conditions: [V] = 6 mM, [L] = 6 mM, pH = 7-8.
Figure 20. 1H NMR spectra monitoring speciation of a V/L mixture over time.
Conditions: [V] = 6 mM, [L] = 6 mM, pH = 7-8.
Page 65
56
Figure 21. Speciation of a V/L mixture over time monitored by 51V NMR (Figure 17).
Conditions: [V] = 6 mM, [L] = 6 mM, pH = 7-8.
Figure 22. Speciation of a V/L mixture changing over time (note: [VL] and [VL2] ratio
determined from 51V NMR due to overlap in the 1H spectra; see Figures 18-19).
Conditions: [V] = 6 mM, [L] = 6 mM, pH = 7-8.
0
20
40
60
80
100
0 2 4 6 8 10
V s
pec
iati
on
(%
)
Time (days)
[VL]
[VL2]
Decavanadate
0
20
40
60
80
100
0 2 4 6 8 10
Liga
nd
sp
ecia
tio
n (
%)
Time (days)
Free L
[VL]
[VL2]
Decomposition products
Page 66
57
Figure 23. 51V NMR spectra monitoring speciation of a V/L mixture over time. No changes
were observed after 3 days, and no signals were observed at δ > -300 ppm.
Conditions: [V] = 12 mM, [L] = 6 mM, pH = 7-8.
Figure 24. 51V speciation of a V/L mixture changing over time (Figure 21). 1H speciation
(starting at 1 day) contains only VL. [V2] and [V4] are vanadium dimeric and tetrameric
species, respectively. Conditions: [V] = 12 mM, [L] = 6 mM, pH = 7-8.
0
20
40
60
80
100
0 2 4 6
V s
pec
iati
on
(%
)
Time (days)
[VO4]
[V2],[V4]
[VL]
Page 67
58
Interactions between U(VI) and glutaroimide-dioxime
Reaction orders of the complexation with respect to [U(VI)] and [L]
The reaction rates of uranyl with glutaroimide-dioxime to form complexes 3 and 4
(Scheme 1) were explored in the same way as vanadium. Figures 25-28 show representative
spectra and kinetic traces at 315 nm from stopped-flow spectroscopy. Under the conditions of
[U(VI)] = 0.200 mM, [L] = 0.500 mM, and [carbonate] = 1.6 mM, the kinetic trace shows two
distinct steps with different rates of formation. We assume that the two steps correspond to the
formation of 3 and 4, respectively, under these conditions. In seawater, uranium exists as uranyl
carbonate complexes, with the dominant one being calcium uranyl carbonate,
Ca2[UO2(CO3)3],6,28 and we have attempted to replicate this species in the uranyl solutions used,
as well as investigate the effect of changing the ratios of uranyl, calcium, and carbonate on the
complexation kinetics. As with vanadium, the equilibrium speciation varies with pH, and
speciation diagrams in the presence and absence of ligand are shown in Figures 31 and 32.
Figures 29 and 30 show that the correlations between the initial rates (Abss-1) and the
concentrations of [U(VI)] or [L] are linear and pass the origin on x- and y- axis, strongly
suggesting that, similar to the interaction between the ligand and vanadium, the initial rate of
the reaction with U(VI) is first-order with respect to the initial concentrations of [U(VI)] and
[L]. The slopes of these plots represent the observed first-order rate constants (Abs⋅mM-1⋅s-1)
under the experimental conditions. The U:Ca:carbonate ratio was kept constant in these
experiments to maintain constant initial uranyl speciation. Since complex 3 cannot be isolated,
we are unable to determine its molar absorptivity so that the rate for the formation of 3 or 4 in
the unit of mMs-1 is not obtainable. However, it is qualitatively evident by comparing the
observed rate constants in Figure 29 and 30 to those in Figures 5 and 6 that the formation of
U(VI) complexes 3 and 4 is faster than that of V(V) complex 1, and much faster than that of
V(V) complex 2. Further discussions on comparing the rates among V(V), U(VI) and Fe(III)
using the half-time of the reaction are provided towards the end of this chapter.
The effect of other ions on the rate of formation of U(VI)/glutaroimide-dioxime complexes Because uranium exists in seawater as ternary Ca/Mg-U(VI)-carbonate complexes,6,28
the interaction between U(VI) with the ligand under seawater conditions will be affected by
the presence of carbonate, calcium, and magnesium (sodium and potassium can also interact
with uranyl carbonate species, but the interactions and complexes formed are very weak and
are inconsequential for this discussion.) Therefore, in addition to varying [U] and [L] as
discussed above, the rate of formation of 3 and 4 was also studied at different concentrations
of carbonate, Ca2+, and Mg2+ to obtain qualitative information on the effect of these reactants
on the rate of formation of U(VI) complexes 3 and 4. As shown in Figures 33-35, higher
carbonate concentrations resulted in slower reactions due to competition of carbonate as a
ligand and that increasing the concentration of calcium also decreased the reaction rate
although this trend was not as clear as the effect of carbonate. The effect of carbonate and
Ca/Mg on the rate of formation of U(VI)/glutaroimide-dioxime complexes is understandable
because the ternary complexes, Ca2UO2(CO3)3 and [(Ca/Mg)UO2(CO3)3]2-, are stable in the
absence of strong ligands such as glutaroimide-dioxime.
Page 68
59
Figure 25. Spectra monitoring the formation of 4 over time. The number of spectra shown has
been reduced for clarity (t = 0.1s to t = 8.0 s).
Conditions: [UO2] = 0.200 mM, [L] = 0.500 mM, [CO3] = 1.200 mM, [Ca] = 2.50 mM, pH = 7.
Figure 26. Sample curves from stopped-flow kinetic experiments showing the effect of ligand
concentration. Conditions: [UO2] = 0.200 mM, [carbonate] = 1.600 mM, [Ca] = 2.50 mM, pH = 7.
0
0.5
1
1.5
275 300 325 350 375
Ab
sorb
ance
Wavelength (nm)
0
0.2
0.4
0.6
0.8
1
1.2
0 2 4 6 8 10
Ab
sorb
ance
(2
90
nm
)
Time (s)
[L] = 0.375 mM
[L] = 0.500 mM
[L] = 0.675 mM
[L] = 0.750 mM
Page 69
60
Figure 27. Sample curves from stopped-flow kinetic experiments showing the effect of uranyl
concentration. Conditions: [L] = 0.500 mM, [carbonate] = 25×[UO2], [Ca] = 25×[U], pH = 7.
Figure 28. Formation of U(VI) complexes 3 and 4 monitored by stopped-flow UV-Visible
spectroscopy showing two distinct slopes. Conditions: [U(VI)] = 0.200 mM, [L] = 0.500 mM,
[Ca] = 2.50 mM, [carbonate] = 1.6 mM
0
0.2
0.4
0.6
0.8
0 2 4 6 8 10
Ab
sorb
ance
(2
90
nm
)
Time (s)
[U] = 0.050 mM
[U] = 0.100 mM
[U] = 0.150 mM
[U] = 0.200 mM
0.35
0.4
0.45
0.5
0 1 2 3
Ab
sorb
ance
(3
15
nm
)
Time (s)
Formation of 3
Formation of 4
Page 70
61
Figure 29. Formation of U(VI) complexes 3 and 4 monitored by stopped-flow UV-Visible
spectroscopy. Conditions: constant [L] = 0.500 mM, [Ca] = 25×[U], [carbonate] = 8×[U].
Figure 30. Formation of U(VI) complexes 3 and 4 monitored by stopped-flow UV-Visible
spectroscopy. Conditions: [U] = 0.200 mM, [Ca] = 2.50 mM, [carbonate] = 1.60 mM.
0
0.1
0.2
0.3
0.4
0 0.05 0.1 0.15 0.2
Init
ial r
ate
(A
bs·
s-1)
[UO2] (mM)
0
0.1
0.2
0.3
0 0.25 0.5 0.75
Init
ial r
ate
(A
bs·
s-1)
[L] (mM)
Formation of 3
slope = 1.70 ± 0.06
Formation of 4
slope = 0.242 ± 0.013
Formation of 4
slope = 0.067 ± 0.004
Formation of 3
slope = 1.31 ± 0.02
Page 71
62
Figure 31. Speciation of 0.2 mM U(VI) in the absence of glutaroimide-dioxime, using literature
hydrolysis constants for U(VI).6 Conditions: [carbonate] = 0.6 mM, [Ca] = 2.5 mM.
Figure 32. Speciation of 0.2 mM U(VI) with 0.5 mM glutaroimide-dioxime, using literature
hydrolysis constants for U(VI)6 and ligand – U(VI) complexation.7
Conditions: [carbonate] = 0.6 mM, [Ca] = 2.5 mM.
Page 72
63
Figure 33. Effect of the concentrations of carbonate on the rate of formation of U(VI)
complexes with glutaroimide-dioxime. Two distinct steps for the formation of 3 and 4 were
observed at [carbonate] = 1.6 mM so that two initial rates (blue and orange symbols) were
plotted, but at [carbonate] > 1.6 mM, only one step was observed corresponding to the
formation of both 3 and 4. Therefore, only one “composite” initial rate (blue symbol) was
plotted for higher [carbonate]. Conditions: [U] = 0.200 mM, [L] = 0.500 mM.
Figure 34. Sample curves showing the effect of the carbonate concentration on the rate of
formation of U(VI) complexes with glutaroimide-dioxime. Note that two distinct slopes are
only visible at the lowest [carbonate]. Conditions: [UO2] = 0.200 mM, [Ca] = 2.50 mM, pH = 7.
0
0.1
0.2
0.3
0.4
0.5
0 1 2 3 4
Init
ial r
ate
(ab
s·s-1
)
[carbonate] (mM)
0
0.2
0.4
0.6
0 1 2 3 4
Ab
sorb
ance
(3
15
nm
)
Time (s)
[carbonate] = 3.2 mM
[carbonate] = 4.8 mM
[carbonate] = 6.4 mM
Page 73
64
Figure 35. Sample curves showing the effect of the counterion (Ca, Mg, Na) on the rate of
formation of U(VI) complexes with glutaroimide-dioxime.
Conditions: [U] = 0.200 mM, [L] = 0.200 mM, [carbonate] = 1.60 mM (as NaHCO3).
As shown in Figure 35, the final absorbance (at 315 nm) of the reaction mixture with
Ca(II) is substantially lower than those with Mg(II) or Na(I), which is unexpected if we assume
the final product is the same U(VI)/L complex(es) in all the solutions and there are no
interactions between the U(VI)/L complex and the cations. To explain this unexpected
observation, separate experiments were conducted by adding Ca(II), Mg(II), or Na(I) into a
solution of UO2(H2L)(HL)- and collecting the absorption spectra. It was noticed that the color
of the solution with Ca(II) intensified and became pink-red while the color of the solutions with
Na(I) or Mg(II) changed only slightly, remaining light-yellow or a bit darker yellow, suggesting
stronger interactions between the U(VI)/L complex with Ca(II). Furthermore, the spectrum of
the solution containing Ca(II) was significantly different with much lower absorbance at 315
nm than those containing Mg(II) or Na(I). Based on these results, we hypothesize that Ca(II)
that was released from the Ca2UO2(CO3)3 species upon the formation of UO2(H2L)(HL)- could
become associated with the latter, affecting the absorbance of UO2(H2L)(HL)- at 315 nm. The
association of Mg(II) with UO2(H2L)(HL)- is probably much weaker and Na(I) weaker still, so
that the absorbance of UO2(H2L)(HL)- at 315 nm was much less affected.
Reaction mechanism of the formation of U(VI) complexes 3 and 4
Illustrating the reaction mechanism of the formation of U(VI) complexes 3 and 4 is
difficult due to a few reasons: (1) both complexes 3 and 4 absorb at 315 nm and it is not possible
to obtain the molar absorptivity of either complex; (2) the acidity and the concentration of
carbonate cannot be varied independently; and (3) two distinct steps with different rates of
formation are observed only at low [carbonate] but are absent at higher [carbonate], where two
0
0.25
0.5
0.75
1
0 3 6 9 12
Ab
sorb
ance
(3
15
nm
)
Time (s)
5 mM Ca
20 mM Ca
10 mM Mg
20 mM Na
Page 74
65
discrete steps are not observed as independent processes with individual slopes (Figures 33 and
34). The latter two reasons suggest that the effect of carbonate on the formation of U(VI)/L
complexes is not as straightforward as simple first-order. As a result, only general, somewhat
speculative discussions can be made on the mechanism.
A reaction mechanism is proposed in Scheme 3, in which complex 3 is a transient
species that forms faster in the first step of the reaction while complex 4 is the final species that
forms slower in the second step. The rate of formation as well as the thermodynamic equilibria
of the U(VI)/L complexes depends not only on uranyl and ligand concentrations, but also on
carbonate and other metal ions present. This also explains the observation that the rate of
formation of complex 3 could be significantly slowed down at higher [carbonate] and become
similar to that of complex 4, (Figure 33), such that only one step corresponding to the now rate-
limiting first step is observed instead of as two discrete steps.
Scheme 3. Proposed reaction mechanism for the formation of U(VI) complexes 3 and 4.
Interactions between iron(III) and glutaroimide-dioxime The reaction between aqueous iron(III) and L to form the 1:1 complex 5 (Scheme 1)
was performed in the same way as the vanadium reactions, with one set of experiments that
vary in [Fe] and another set that vary in [L]. Rather than performing them at neutral pH, these
reactions were performed at pH = 4.5 ± 0.5, by adding additional acid. These conditions were
chosen because the dominant iron species in the reaction is only the 1:1 complex 5 [Fe(HL)]+
rather than a mixture of 5, 6, and other species, and it is possible to assign the rate to the
formation of this single species.9 Additionally, precipitation of iron oxide was observed when
additional base was added, rendering the solution-state kinetics impossible to determine
accurately at neutral pH.29
The formation of iron complex 5 is fast and was monitored by stopped-flow
spectroscopy. Sample spectra and kinetic traces from stopped-flow experiments are provided
in Figures 36-38. From the kinetic traces (absorbance vs. time), the initial rates, (d[5]/dt)o, were
calculated as a function of [Fe] (at constant [L] = 0.500 mM) and a function of [L] at constant
[Fe = 0.200 mM], shown in Figures 39 and 40, respectively.
The linearity and the convergence of the lines to the origin of the x/y axis in Figures 39
and 40 indicate that, similar to the 1:1 vanadium complex 1, the formation of the iron complex
5 is also first-order with respect to both iron and the ligand. Under the conditions tested at pH
= 4.5, an approximate conditional rate constant of k’ = (1.3 ± 0.2) mM-1⋅s-1 was calculated,
where (d[5]/dt)o = k’[Fe]⋅[L], similar to equation 2 for V(V). At this acidity (pH = 4.5), the rate
of formation, (d[5]/dt)o, was calculated to be 0.13 mM⋅s-1 when [Fe] = 0.200 mM and [L] =
0.500 mM, which is faster than that of (d[1]/dt)o = 0.028 mM⋅s-1, noting that the latter rate is
Page 75
66
at pH = 8.0. In dilute acid the iron exists as the hexaaquo cation, [Fe(H2O)6]3+, effectively free
iron.29 Since the rate of water exchange in [Fe(H2O)6]3+ is rapid, it is very likely that the rate-
determining step in the formation of complex 5 is the complexation of the ligand to Fe(III),
consistent with the mixed second-order kinetics.15
It should be pointed out that, similar to the vanadium system, the term k’ is a function
of the acidity, but was unfortunately not investigated in the present study because even slightly
varying the acidity of the system resulted in a mixture of different iron species and complicated
the analysis. In fact, significant changes in absorbance were observed when this was attempted
and, as aforementioned, precipitation of iron species occurred when small quantities of base
were added.
It is also worth noting that the concentration of dissolved iron in the ocean is very low
due to the very low solubility of iron oxides, hydroxides, and carbonates, and the iron that is
present in seawater is often bound to organic ligands and/or taken up and used by
microorganisms.30 This is also true of vanadium, although to a lesser extent.17 Therefore, the
conditions used in the study of Fe(III) in this work are less reflective of seawater conditions
than the studies of V(V) and U(VI). Further studies will be needed with more knowledge of
specific organic ligands present in the ocean and their speciation in order to accurately
determine the rate of iron interactions with glutaroimide-dioxime in seawater.
Figure 36. Sample spectra monitoring the formation of 3 over time. The number of spectra
shown has been reduced for clarity (t = 0.2 s – 20.0 s).
Conditions: [Fe] = 0.200 mM, [L] = 0.500 mM.
0
0.4
0.8
1.2
300 325 350 375 400 425
Ab
sorb
ance
(3
75
nm
)
Wavelength (nm)
Page 76
67
Figure 37. Sample curves from stopped-flow kinetic experiments showing
the effect of varying [L]. Conditions: [Fe] = 0.200 mM, pH = 4.5.
Figure 38. Sample curves from stopped-flow kinetic experiments showing
the effect of varying [Fe]. Conditions: [L] = 0.500 mM, pH = 4.5.
0
0.3
0.6
0.9
0 3 6 9 12
Ab
sorb
ance
(3
75
nm
)
Time (s)
[L] = 0.375 mM
[L] = 0.500 mM
[L] = 0.625 mM
[L] = 0.750 mM
0
0.3
0.6
0.9
0 3 6 9 12
Ab
sorb
nce
(3
75
nm
)
Time (s)
[Fe] = 0.050 mM
[Fe] = 0.100 mM
[Fe] = 0.150 mM
[Fe] = 0.200 mM
Page 77
68
Figure 39. Initial rate of the formation of Fe(III) complex 5 at pH = 4.5 as a function of [Fe]
monitored by stopped-flow UV-Visible spectroscopy. Conditions: [L] = 0.500 mM
Figure 40. Initial rate of the formation of Fe(III) complex 5 at pH = 4.5 as a function of [L]
monitored by stopped-flow UV-Visible spectroscopy. Conditions: [Fe] = 0.200 mM.
0
0.05
0.1
0.15
0 0.05 0.1 0.15 0.2 0.25
Init
ial r
ate
(m
M·s
-1)
[Fe] (mM)
slope = 0.640 ± 0.017
0
0.05
0.1
0.15
0.2
0.25
0 0.25 0.5 0.75 1
Init
ial r
ate
(m
M·s
-1)
[L] (mM)
slope = 0.358 ± 0.006
Page 78
69
Comparison of rates of formation of glutaroimide-dioxime complexes with vanadium,
uranium, and iron
Due to the difficulties in determining the reaction order with respect to the acidity in the
case of all three ions and the reaction orders with respect to carbonate and Ca/Mg ions in the
case of U(VI), the full rate equations for the interactions of glutaroimide-dioxime with the three
metal ions were not derived in this study. Nevertheless, several generalizations can be
discussed below, largely due to differences in the chemical form of the metal ions of interest.
For all three metal ions, formation of their respective 1:1 ligand-metal complexes, 1 for
V(V), 3 for U(VI), and 5 for Fe(III), is first-order in ligand and metal. This indicates that
complexation is a simple coordination reaction between one molecule of each, and the
differences in the rate constant is due to the chemical form of the metals promoting or hindering
reactivity. Based on the data from this study, the relative rates of complexation can be
compared in terms of “half-life” of the reaction, t1/2 (defined as the time at which the reaction
has proceeded 50% to completion, and can be used to compare reactions when the full rate law
is unobtainable.15), under the same concentrations of metal ions and the ligand. As shown in
Figure 41, when [M] = 0.200 mM (M represents V(V), U(VI), and Fe(III)) and [L] = 0.500
mM, the formation of the U(VI) complex 3 is the fastest of the three (t1/2 ~ 0.8 s), despite the
need for carbonate to dissociate so the ligand can bind. The rate for the U(VI) system is a
“composite” for both complexes 3 and 4, because both complexes absorb at 315 nm and it was
not possible to deduce individual absorptivities for each complex. Fe(III) reacts more slowly
(k’ = (1.3 ± 0.2) mM-1⋅s-1; t1/2 ~ 1.7 s) to form complex 5. The formation of V(V) complex 1 is
slower still (k’ = (0.27 ± 0.02) mM-1⋅s-1; t1/2 ~ 8.7 s), approximately one order of magnitude
slower than that of U(VI). The formation of the 1:2 V(V) complex 2 (Figures 11-13) is much
slower than that of all three 1:1 complexes, with the reaction still proceeding after several
weeks. The slow rate of formation of V(V) complex, the 1:2 complex 2 in particular, is
understandable because the strong oxido bonds in vanadate need to be hydrolyzed and replaced
by metal-ligand bonds through dehydration that is probably the rate-determining step in the
reaction mechanism for the V(V) system.
Page 79
70
Figure 41. Comparison of the half-life of the formation of 1:1 glutaroimide-dioxime
complexes with V(V), U(VI), and Fe(III). [L] = 0.500 mM; [M] = 0.200 mM (M represents
V(V), U(VI), and Fe(III); pH = 8.0 for V(V) and U(VI), 4.0 for Fe(III).
Implications for polymer adsorbents Though the present study has focused on the solution-state chemistry of small-molecule
analogues of the amidoxime-type ligands, the results provide insight into the sorption of metal
ions by amidoxime-based polymer fibers used in seawater tests and are highly relevant to the
selective extraction of uranium from seawater. The findings in this study are in fact consistent
with the observed sorption kinetics determined in marine tests with recently developed polymer
adsorbent materials: uranium reaching sorption equilibrium the fastest, iron taking slightly
longer time, and vanadium still increasing after 56 days in seawater flow columns.31 Also,
recent studies on the exact chemical form of metals on the sorbents using XAS spectroscopy
have revealed that the imide-dioxme functional group is still one of the major components
interacting with the metal ions. Therefore, the trends in kinetics due to the different metal ion
chemistries should hold when comparing the same ligand independent of the exact binding
mode.32
It is currently unknown whether the formation of a 1:2 V(V)/amidoxime complex
occurs on polymer fibers, which would require the vanadium to be tethered between two
polymer chains. The steric clash of the adjacent functional groups and the limited flexibility of
the macromolecular polymer chains may not allow this, in which case the vanadium would
remain in a 1:1 binding mode despite the thermodynamics favoring a 1:2 complex. This would
also vary depending on the morphology and conditioning of the polymer adsorbent used, which
would affect the thermodynamically and kinetically favored binding modes of all three
different metals.32,33
0
25
50
75
100
0 2 4 6 8 10 12
Re
acti
on
pro
gres
s (%
)
Time (s)
U(VI)
Fe(III)
V(V)
Page 80
71
The observed decomposition of the 1:2 V(V)/amidoxime complex has implications for
the recycling and reusability of polymer adsorbents. If it does form, then even stoichiometric
amounts of acid can accelerate and promote ligand decomposition. Hydrochloric acid has been
used to strip metals for their recovery and reuse the adsorbent, which is especially problematic
since harsh conditions (over 3M HCl, with heating) are needed to completely remove
vanadium.34 This treatment degrades the polymer, reducing capacity in future uses. Milder
techniques to strip metals such as elution with peroxide, hydroxylamine, or carbonate solutions
have been shown to help prevent decomposition through this method, although removal of
vanadium may still be problematic.35,36
Page 81
72
Summary and conclusions
Understanding metal binding of glutaroimide-dioxime as a small molecule analogue of
functional groups on polymer adsorbents is critical to improve selectivity for uranium over
other metals in the recovery of uranium from seawater. We have explored the kinetics of
vanadium binding with glutaroimide-dioxime in comparison with U(VI) and Fe(III). The
formation of the 1:1 complexes of all three metal ions were found to show a first-order
relationship with metal and ligand concentrations. However, other factors such as acid
concentration (for vanadium) and carbonate concentration (for uranyl) play very important
roles in binding kinetics. In the narrow and near neutral pH region, the formation of the 1:1
vanadium(V)/L complex follows the first order with respect to [H+]. Qualitatively, higher
concentrations of carbonate and counter ions such as Ca(II) and Mg(II) lower the rate of
formation of U(VI)/L complexes. Relative to each other, the 1:1 complexes, studied by
stopped-flow spectroscopy, form rapidly with rates differing by only one order of magnitude,
with U(VI) the fastest, followed by Fe(III), then V(V). Formation of the 1:2 V(V) complex
takes place over a longer period of time of several days to weeks, and its concentration (rather
than rate of formation) was monitored by conventional UV-visible spectrometry and NMR
techniques, while formation of the 1:2 uranyl complex occurs on a similar timescale to the 1:1
uranyl complex.
Based on the data from this work, reaction mechanisms for the formation of metal
complexes with glutaroimide-dioxime are proposed. In the case of vanadium, the rates of
formation of the 1:1 and 1:2 complexes are both drastically increased by adding acid, strongly
suggesting a slow protonation step followed by oxido ligand hydrolysis and loss of water to
allow ligand binding. The faster kinetics and first-order reaction rate imply a simple associative
binding mechanism for iron and uranyl as well despite the presence of strong carbonate
complexes of the latter. The slow decomposition of the 1:2 non-oxido vanadium complex in
acidic solutions was also investigated and the results can help explain the decomposition of the
amidoxime-based sorbents observed during acid elution of polymer adsorbents in marine tests.
Page 82
73
References
(1) Gill, G. A.; Kuo, L.-J.; Janke, C. J.; Park, J.; Jeters, R. T.; Bonheyo, G. T.; Pan, H.-B.;
Wai, C.; Khangaonkar, T.; Bianucci, L.; Wood, J. R.; Warner, M. G.; Peterson, S.;
Abrecht, D. G.; Mayes, R. T.; Tsouris, C.; Oyola, Y.; Strivens, J. E.; Schlafer, N. J.;
Addleman, R. S.; Chouyyok, W.; Das, S.; Kim, J.; Buesseler, K.; Breier, C.;
D’Alessandro, E. Ind. Eng. Chem. Res. 2016, 55, 4264–4277.
(2) Endrizzi, F.; Melchior, A.; Tolazzi, M.; Rao, L. Dalton Trans. 2015, 44, 13835–13844.
(3) Vukovic, S.; Hay, B. P.; Bryantsev, V. S. Inorg. Chem. 2015, 54, 3995–4001.
(4) Mehio, N.; Lashely, M. a.; Nugent, J. W.; Tucker, L.; Correia, B.; Do-Thanh, C.-L.;
Dai, S.; Hancock, R. D.; Bryantsev, V. S. J. Phys. Chem. B 2015, 119, 3567–3576.
(5) Leggett, C. J.; Parker, B. F.; Teat, S. J.; Zhang, Z.; Dau, P. D.; Lukens, W. W.;
Peterson, S. J. M.; Cardenas, A. J. P.; Warner, M. G.; Gibson, J. K.; Arnold, J.; Rao, L.
Chem. Sci. 2016, 7, 2775–2786.
(6) Endrizzi, F.; Rao, L. Chem. - A Eur. J. 2014, 20, 14499–14506.
(7) Tian, G.; Teat, S. J.; Zhang, Z.; Rao, L. Dalton Trans. 2012, 41, 11579–11586.
(8) Sun, X.; Tian, G.; Xu, C.; Rao, L.; Vukovic, S.; Kang, S. O.; Hay, B. P. Dalton Trans.
2014, 43, 551–557.
(9) Sun, X.; Xu, C.; Tian, G.; Rao, L. Dalton Trans. 2013, 42, 14621.
(10) Zheng, X.; Bi, C.; Li, Z.; Podariu, M.; Hage, D. S. J. Pharm. Biomed. Anal. 2015, 113,
163–180.
(11) Rao, L.; Zhang, Z.; Friese, J. I.; Ritherdon, B.; Clark, S. B.; Hess, N. J.; Rai, D. J.
Chem. Soc. Dalt. Trans. 2002, 267.
(12) Xu, J.; Jordan, R. B. Inorg. Chem. 1988, 27, 4563–4566.
(13) Howarth, O. W. Prog. Nucl. Magn. Reson. Spectrosc. 1990, 22, 453–485.
(14) Aureliano, M.; Ohlin, C. A.; Vieira, M. O.; Marques, M. P. M.; Casey, W. H.; Batista
de Carvalho, L. A. E. Dalton Trans. 2016, 45, 7391–7399.
(15) Espenson, J. H. Chemical kinetics and reaction mechanisms; 2nd ed.; McGraw-Hill,
1995.
(16) Larsson, K.; Cullen, T. D.; Mezyk, S. P.; McDowell, R. G.; Martin, L. R. RSC Adv.
2017, 7, 26507–26512.
(17) Wang, D.; Sañudo Wilhelmy, S. a. Mar. Chem. 2009, 117, 52–58.
(18) Heath, E.; Howarth, O. W. J. Chem. Soc. Dalt. Trans. 1981, 1105.
(19) Gresser, M. J.; Tracey, A. S. J. Am. Chem. Soc. 1985, 107, 4215–4220.
(20) Pettersson, L.; Elvingson, K. 1998; pp. 30–50.
(21) Ivanov, A. S.; Leggett, C. J.; Parker, B. F.; Zhang, Z.; Arnold, J.; Dai, S.; Abney, C.
W.; Bryantsev, V. S.; Rao, L. Manuscr. Submitt. 2017.
(22) Morgenstern, B.; Kutzky, B.; Neis, C.; Stucky, S.; Hegetschweiler, K.; Garribba, E.;
Micera, G. Inorg. Chem. 2007, 46, 3903–3915.
(23) Morgenstern, B.; Steinhauser, S.; Hegetschweiler, K.; Garribba, E.; Micera, G.; Sanna,
D.; Nagy, L. Inorg. Chem. 2004, 43, 3116–3126.
(24) Wang, P.-L.; Werner, P.; Nord, A. G. Zeitschrift für Krist. 1992, 198, 271–276.
(25) Lutz, O.; Nepple, W.; Nolle, A. Zeitschrift für Naturforsch. A 1976, 31, 3–7.
(26) Bhattacharya, S.; Kumari, N. Coord. Chem. Rev. 2009, 253, 2133–2149.
Page 83
74
(27) Kang, S. O.; Vukovic, S.; Custelcean, R.; Hay, B. P. Ind. Eng. Chem. Res. 2012, 51,
6619–6624.
(28) Bernhard, G.; Geipel, G.; Brendler, V.; Nitsche, H. J. Alloys Compd. 1998, 271–273,
201–205.
(29) Baes, C. F.; Mesmer, R. E. The Hydrolysis of Cations; John Wiley & Sons Inc: New
York, London, Sydney, Toronto, 1976.
(30) Hirose, K. Anal. Sci. 2006, 22, 1055–1063.
(31) Das, S.; Oyola, Y.; Mayes, R. T.; Janke, C. J.; Kuo, L.-J.; Gill, G.; Wood, J. R.; Dai, S.
Ind. Eng. Chem. Res. 2016, 55, 4110–4117.
(32) Abney, C. W.; Mayes, R. T.; Piechowicz, M.; Lin, Z.; Bryantsev, V. S.; Veith, G. M.;
Dai, S.; Lin, W. Energy Environ. Sci. 2016, 9, 448–453.
(33) Kim, J.; Tsouris, C.; Oyola, Y.; Janke, C. J.; Mayes, R. T.; Dai, S.; Gill, G.; Kuo, L. J.;
Wood, J.; Choe, K. Y.; Schneider, E.; Lindner, H. Ind. Eng. Chem. Res. 2014, 53,
6076–6083.
(34) Pan, H.-B.; Kuo, L.-J.; Wai, C. M.; Miyamoto, N.; Joshi, R.; Wood, J. R.; Strivens, J.
E.; Janke, C. J.; Oyola, Y.; Das, S.; Mayes, R. T.; Gill, G. A. Ind. Eng. Chem. Res.
2016, 55, 4313–4320.
(35) Oyola, Y.; Vukovic, S.; Dai, S. Dalton Trans. 2016, 8532–8540.
(36) Pan, H.-B.; Liao, W.; Wai, C. M.; Oyola, Y.; Janke, C. J.; Tian, G.; Rao, L. Dalton
Trans. 2014, 43, 10713–10718.
Page 84
75
Chapter 4
Redox activity of vanadium complexes of glutaroimide-dioxime
Page 85
76
Introduction
Vanadium is present in seawater at approximately 0.5-2 ppb (10-40 nM)1, which is
similar to that of uranium at 3.3 ppb (13 nM)2. It is mainly present in the V(V) oxidation state
due to slow oxidation of V(IV) by aerated water, however, approximately 10-15% of vanadium
is present in the V(IV) state.1 This naturally occurring mixture of oxidation states, which is
subject to seasonal and geographical variation, is a consequence of biological uptake and use
of vanadium in marine environments.1,3 Vanadium is an essential element for many organisms,
although typically in very small amounts. In vivo, vanadium is present in several chemical
environments in oxidation states ranging from V(III) – V(V), most commonly V(IV), and when
marine organisms die they release vanadium in multiple oxidation states.4
Although the complexation chemistry of V(V) has been studied recently with
glutaroimide-dioxime,5 as well as its interactions with polymer sorbents,6 similar chemistry of
V(IV) has not yet been investigated. Our initial work sought to study the interactions of V(IV)
with seawater-relevant ligands (Figure 1) in the same manner as U, Fe, V(V) and other
metals.5,7,8 In this way, we would seek to understand the role that V(IV) plays in determining
uranium sorption selectivity and see if non-oxido vanadium species could form in the V(IV)
oxidation state as for V(V). However, we discovered that V(IV) readily oxidizes to V(V) in the
presence of ligands and instead forms previously characterized V(V) complexes. Acetone
oxime, a simple oxime substrate, also reacts readily with V(IV) and was used as a model
substrate to study reaction conditions without interference due to complexation with vanadium.
The type of reactivity we investigate here has previously been observed with
hydroxamic acids, a similar class of ligands with N-OH groups, where the O atom is abstracted
upon complexation with V(III), V(IV), and Mo(V), forming the corresponding amide and
higher oxidation state metal-oxo complexes.9 One reported reaction between V(IV) and
salicylaldoxime leads to the V(V) chelating oxime complex as well as smaller amounts of other
complexes arising from coupled small organic molecules.10 Other low oxidation state metal
ions have also been observed to react similarly, including Mo(II)11 and U(IV),12 although in
seawater uranyl is present exclusively as uranyl(VI) carbonate complexes.13
Page 86
77
Figure 1. Ligands investigated for V(IV) reactivity and their known V(V) complexes.
In our attempts to prepare and characterize V(IV) complexes of the model oxime ligands
and reagents shown in Figure 1, we found that they invariably reacted to form V(V) complexes.
Cyclic voltammetry was performed on the 2:1 glutaroimide-dioxime V(V) complex 1 and,
surprisingly, it was found to undergo reduction at strongly negative potential. We also
attempted to synthesize a V(IV) complex in non-aqueous solvents both directly and through
chemical reduction of the V(V) complex, however, no stable complexes could be isolated,
suggesting that the V(IV) analogue is inherently unstable towards ligand reactivity or
disproportionation.
Page 87
78
Experimental
Chemicals Acetamidoxime was synthesized by stirring equal volumes of a 50% aqueous
hydroxylamine solution, acetonitrile, and ethanol (5 mL each) at room temperature for 24
hours, followed by heating to 40°C in a glass petri dish until all the volatiles evaporated and a
white solid remained. It was then dissolved in water (5 mL) and evaporated again. The resulting
solid was redissolved in approximately 10 mL of water and its concentration was determined
by 1H NMR spectroscopy and protonation titrations.
Glutaroamidoxime (LB)14 and vanadyl toluenesulfonate15 were synthesized according
to literature procedures. Glutaroimide-dioxime (LA) was synthesized according to literature
procedure and recrystallized twice from methanol before use.16
Vanadyl (V(IV)) solutions were prepared by reducing a solution of acidified V2O5 with
excess hydroxylamine hydrochloride. V(IV) was precipitated as VO2 by the addition of sodium
hydroxide, then redissolved in hydrochloric acid. The concentration of V(IV) was determined
by titration with a solution of KMnO4 of known concentration.
Tetraethylammonium vanadium(V) bis(glutaroimide-dioxime) ([NEt4][1]) was
prepared by adding glutaroimide-dioxime (290 mg, 2.1 mmol), ammonium metavanadate (117
mg, 1.0 mmol), and tetraethylammonium bromide (168 mg, 0.80 mmol) to a mixture of water
(10 mL) and methanol (5 mL). The mixture was stirred vigorously for 30 minutes at room
temperature, during which the mixture turned dark brown and the solids completely dissolved.
The mixture was transferred to a glass petri dish and warmed at 40°C overnight, during which
all the solvent evaporated to leave a dark brown solid. The solid was extracted with
dichloromethane (5×10 mL), dried over magnesium sulfate, filtered, and the solvent removed
to give a brown oil. This was crystallized from dichloromethane (20 mL) layered with an equal
volume of THF. Large dark brown-black blocks of [NEt4][1] formed over several days. It is
very soluble in chloroform, dichloromethane, alcohols, and most other polar solvents, has trace
solubility in THF, and is insoluble in all low-polarity solvents. The same product can be
obtained in similar yield by using sodium orthovanadate instead of ammonium metavanadate,
adjusting the pH to 6-8. Yield: 230 mg (0.50 mmol, 63%). 1H NMR (CDCl3, 500 MHz): 1.23
ppm, t, 12H, N(CH2CH3)4, 1.95 ppm, quintet, 4H, CH2CH2CH2, 2.62 ppm, t, 8H, CH2CH2CH2,
3.18 ppm, , t, 8H, N(CH2CH3)4; 13C NMR(CDCl3, 126 MHz): 7.7 ppm, N(CH2CH3)4, 21.4
ppm, CCH2CH2CH2C, 21.6 ppm, CCH2CH2CH2C, 52.5 ppm, N(CH2CH3)4, 154.0 ppm, C=N-
O; 51V NMR (CDCl3, 132 MHz): 739 ppm.
All other chemicals were obtained from commercial sources and used as received.
Cyclic voltammetry
Cyclic voltammetry experiments were performed on a Gamry Instruments Reference
600 potentiostat and data acquired with Gamry Framework software. Experiments in
acetonitrile and DCM were performed in an inert atmosphere glovebox using dry solvent with
0.1 M [NBu4][PF6] electrolyte, with a Pt disc working electrode, Pt gauze counter electrode
and Pt wire quasi-reference electrode. Experiments in water and methanol were performed with
a Pt disc working electrode, Pt wire counter electrode and Ag/AgCl reference electrode, with
0.2 M KCl as the electrolyte in water and 0.2 M [NEt4][Cl] in methanol. Non-aqueous
Page 88
79
potentials were referenced against ferrocene (Fc+/Fc at 0 V) and aqueous potentials referenced
against potassium ferricyanide ([Fe(CN)6]3-/[Fe(CN)6]4- at +0.04 V; Fc+/Fc nominally at 0 V).
NMR
An internal standard of approximately 1 mM t-butanol (the exact concentration
calculated per experiment based on stock solution volumes) in D2O/H2O mixtures was used as
the solvent for quantitative experiments. 1H NMR spectra in water or H2O/D2O mixtures were
acquired on a Bruker AV-500 instrument (500 MHz) with a WATERGATE solvent
suppression pulse sequence. 51V NMR spectra were acquired on a Bruker DRX-500 instrument
(132 MHz).
Crystallography X-ray structural determination was performed on a Bruker APEX diffractometer with a
Bruker fixed-Chi 3-Circle goniometer, a Bruker SMART APEX II CCD detector, and a
monochromatized fine-focus sealed Mo-kα X-ray source. A crystal was coated with paratone
oil and mounted in a Kaptan loop, which was mounted on the goniometer with a nitrogen
cryostream held at a temperature of 100 ± 0.5 K. Crystallography data was processed in the
WinGX software package, solved using the SHELXTL software package and refined with the
SHELXL software package, with semiempirical absorption correction with SADABS,
included in SHELXTL.17 All non-hydrogen and non-solvent atoms were refined
anisotropically, and non-solvent hydrogens were placed using a riding model. Solvent oxygen
atoms were refined isotropically and solvent hydrogens were not located.
Page 89
80
Results and Discussion
Attempts to prepare reduced LAA-vanadium(IV) complex
In order to study the complexation behavior of vanadium(IV) with LA, we initially
attempted a direct synthesis from LA and aqueous vanadyl under a variety of reaction
conditions, varying pH, stoichiometry, and the rate and order of addition of reagents. However,
in water, only known V(V) species were identified as products: 1, 2,5 and free vanadates, the
exact species of the latter was dependent on concentrations and pH.18 Regardless of the
conditions used, V(V) species were invariably produced, with the reaction changing to the
amber-brown color of 1. To preclude the role of oxygen in these reactions, water degassed by
boiling or sparging with nitrogen was used with no change in outcome, indicating that V(IV)
oxidation is caused by the ligand itself.
When the same reaction was performed in dry, degassed methanol, the reaction mixture
turned a deep red color within seconds, followed by a slow change to amber, indicating the
formation of 1. If the reaction was carried out under argon and the solvent is removed rapidly
just after the onset of the reaction, the only product that solidified from the reaction was
toluenesulfonic acid. The remainder of the reaction was a viscous red oil which contains
polyoxovanadates (V(V)).18 When water is added to the red solution or oil, the vanadium
clusters hydrolyze immediately and form the V(V) complex 1 with its characteristic dark amber
color. If the reaction is performed in basic methanol (sodium methoxide) or methanol with a
drop of added water, the red color was not observed, instead forming 1 directly.19
The reaction of V(IV) with glutaroimide-dioxime was also tested in aprotic solvents.
Vanadyl acetylacetonate was dissolved in dry acetonitrile and excess LA. Due to the low
solubility of LA, the reaction proceeded slowly, and the solution first turned green and then
amber, also forming a brown-black precipitate. Small amounts of 1 were present in solution
(determined by 51V NMR spectroscopy), and the insoluble black product could not be extracted
into any solvent, including water, implying some irreversible decomposition process.
Disproportionation of a LA-V(IV) species formed initially could be occurring to form insoluble,
reduced metal oxides. Based on these results, cyclic voltammetry was performed to determine
the accessibility of the V(IV) oxidation state from 1 and establish possible reaction conditions.
Cyclic voltammetry of complex 1 In order to solubilize 1 in non-aqueous solvents to perform nonaqueous reductions, a
cation exchange reaction was performed to synthesize the organic-soluble tetraethylammonium
complex. The extraction of 1 in the presence of tetraethylammonium bromide from water into
immiscible organic solvents failed and all compounds remained in the aqueous phase.
However, the complex was successfully isolated by synthesizing 1 in the presence of
tetraethylammonium bromide in a water/methanol mixture, evaporating the solution to dryness,
then extracting into dichloromethane. [NEt4][1] was obtained as very dark brown-black block
crystals by layering a dichloromethane solution with THF. [NEt4][1] was used in all cyclic
voltammetry experiments due to its exact stoichiometry and higher purity, unlike the sodium
salt isolated from water which may contain excess reagents and salts.
Page 90
81
Figure 2. Cyclic voltammograms of 1 in several solvents, all measured at a scan rate of 100
mV/s against a Pt working electrode.
Figure 3. Reduction of [NEt4][1] in DCM measured at different scan rates (in mV/s)
-2.5 -1.5 -0.5 0.5 1.5
E (V vs. Fc+/Fc)
-1.6 -1.5 -1.4 -1.3 -1.2 -1.1V vs. Fc/Fc+
255075100200300400500750
H2O
MeOH
MeCN
DCM
Page 91
82
Figure 4. Linear plot of the flowing current vs the square root of the scan rate for the first
reduction of [NEt4][1] in DCM.
In water, one irreversible reduction was observed at Epc -920 mV vs. Fc+/Fc, which we
assign to the reduction of V(V) to V(IV), followed by subsequent decomposition. This is more
negative than other V(V)/V(IV) redox potentials (-600 mV for [VVO2]+/[VIVO]2+ in acid or -
400 mV for [VVO4]3-/[H2VIVO4]2- in strong base, relative to ferrocene),20 suggesting that the
vanadium center is more electron rich due to binding of the strongly electron-donating ligand
(Figure 2). No oxidation wave was observed on the return scan, and solids were observed to
plate onto the electrode, so deposition of V(IV) as VO2 is likely, since the V(IV) complex that
is formed is not stable. Decomposition could conceivably proceed through ligand dissociation
and hydrolysis to form free vanadium as VO2.
Cyclic voltammetry was also performed in non-aqueous solvents to investigate if
performing the experiments in water was precluding the isolation of a V(IV) complex. In
methanol, the same irreversible behavior was observed, with an irreversible reduction at a
similar potential of Epc -1000 mV. The similarity of the electrochemical behavior and chemical
reactions (see above) suggest that a similar process may be taking place in both cases, with the
V(IV) complex that is transiently formed reacting with the ligand and then dissociating and
depositing as VO2 or other vanadium oxide.
Different electrochemical behavior was observed in the aprotic solvents acetonitrile and
dichloromethane. For the former, an irreversible reduction occurs at Epc -1.5 V, at more
negative potential than in water or methanol. In this case, the initial reduction likely occurs in
the same manner as in the protic solvents, but without a proton source for the ligand to
dissociate completely and the V(IV) complex to hydrolyze, the acetonitrile coordinates or
reacts, leading to a V(IV) complex that remains soluble. A reverse wave is observed on the
return scan, but appears with almost no peak-to-peak separation, a different peak height, and
Page 92
83
does not follow normal square-root law behavior. The oxidation occurring is likely this new
V(IV) complex reoxidizing to V(V), with other oxidations of reacted ligands observed at more
positive potentials.
Lastly, cyclic voltammetry was also performed in dichloromethane, as it is
noncoordinating and may show different behavior as a result if solvent coordination is
important. This appears to be the case, since the reduction shows reversible behavior unlike in
the other solvents, with a reduction at Epc -1.41 V (E1/2 -1.32 V) and a peak-to-peak separation
of 190 mV. Although this value is relatively large, the square root law is linear (Figures 3 and
4) and the large separation is therefore attributed to uncompensated resistance from the solvent.
This process is at a similar potential as in acetonitrile so we attribute it to the same initial
reduction. However, the V(IV) complex is stable in DCM, since the solvent is noncoordinating
and generally less reactive, making it reversible on the CV timescale.
We attempted the chemical reduction of 1 in both aqueous and nonaqueous solvents; to
target a reduction at E1/2 (-1.32 V) we used cobaltocene as a reducing agent (-1.33 V for
[Cp2Co]+/[Cp2Co]) which would be a mild reaction if it were irreversible.21 This was attempted
in both acetonitrile and DCM, and in both cases, no reaction was observed initially, but within
an hour an intractable black solid started to form in the same manner as the direct reaction with
vanadyl acetylacetonate (above), and no products could be isolated, implying that a possible
V(IV) complex is inherently unstable, with this decomposition in aprotic solvents being caused
by a lack of hydrolysis reaction pathways.
The reduction of 1 in protic solvents was also attempted with a variety of reducing
agents in water or water-methanol mixtures before performing cyclic voltammetry
experiments. Several common reducing agents including hydroxylamine, hydrazine, sodium
thiosulfate, and zinc metal were all tested, spanning reduction potentials between -0.29 V and
-1.16 V vs. ferrocene,21,22 and in all cases, no reaction was observed. Although any V(IV)
products would be paramagnetic and not necessarily observable by NMR spectroscopy, all 1H
and 51V NMR spectra as well as absorption spectra remained unchanged. This lack of reactivity
suggests that the presence of the two amidoxime ligands on vanadium greatly stabilizes the
complex against reduction compared to other V(V) complexes, which have reduction potentials
in the range of +0.6 V vs. ferrocene (for [VO]2+/[VO2]+), +0.1 – + 0.75 V for non-oxido cis-
inositol complexes23 or -0.25 – +0.49 V for Amvadin derivatives, with the lower end of the
range occurring in organic solvents (discussed below).24 Since the ligands are strongly electron-
donating, such that they displace all oxido groups on the metal upon coordination, they are
poor ligands with respect to stabilizing the lower oxidation state on vanadium.
The unusual redox behavior of 1 and its reluctance to be reduced is not a direct
consequence of the rare non-oxo environment, as several other air-stable non-oxo V(IV)
complexes are known. One of them is Amvadin, a natural product that is found in the
hyperaccumulating fungus Amanita muscaria (Figure 5, left).25 In contrast to 1, vanadium is
present exclusively in the V(IV) oxidation state in naturally-occurring Amavadin as well as
synthetic derivatives, and although the V(V) form is readily accessible by chemical oxidizing
agents such as hydrogen peroxide, it will slowly revert to the stable V(IV) oxidation state over
time with no apparent decomposition.19 In some organic solvents, however, the V(V) form is
favored, turning red, indicating an easily accessible redox couple. This is notable because the
ligand in Amavadin, 2,2'-(hydroxyimino)dipropionate, contains a central N-OH
Page 93
84
hydroxylamine group that is deprotonated in the complex, similar to the four N-O groups in 1,
yet it is inert when directly bonded to V(IV). A limited number of other non-oxido V(IV)
complexes are known, including a complex with a cis-inositol derived ligand and other similar
compounds (Figure 5, right) that are also unstable when oxidized to V(V).23,26
Figure 5. Stable non-oxido V(IV) complexes.
Vanadium(IV) reactivity with amidoximes and oximes In addition to amidoxime A, the reactions of other amidoximes and oximes with V(IV)
were also monitored by 1H and 51V NMR spectroscopy. We first tested glutarodi(amidoxime)
(amidoxime B, LB)14 and acetamidoxime27 as models for other functional groups on uranium
sorbents, and acetone oxime as a simple oxime which should react to form a single product,
acetone (substrates shown in Figure 1). For these substrates, only free V(V) species were
observed in the products instead of metal complexes, as the substrates and probable products
are expected to be poor ligands (Figures 6-11). The presence of any 51V NMR signals is
indicative of oxidation from V(IV) to V(V) since V(IV) is NMR-silent.18 Small amounts of
VO2 precipitation is observed, especially in the reactions of LB, although no attempts were
made to quantify this. Table 1 shows the amount of products produced at different
vanadium/oxime ratios.
Page 94
85
Table 1. Product mixtures of V(IV) reactions with LB, acetamidoxime, and acetone oxime.
Substrate (S) [S] V:S ratio Unreacted [S] [product] [decomposition]
1 6:1 0 0.85
LB 6 1:1 2.4 3.2
20 1:3 11.0 9.0
2 3:1 0 1.2 0.2
acetamidoxime 12 1:2 6.1 2.4 0.01
36 1:6 32 1.8 4.3
2 3:1 1.1 0.97
acetone oxime 12 1:2 9.3 5.6
36 1:6 32 2.9
[VO2+] = 6 mM for all reactions. All concentrations are in mM. Product is acetamide for
acetamidoxime, acetone for acetone oxime. Decomposition is all other signals that are not
product or unreacted substrate. Precipitate was present in the reactions of LB and small
amounts were present in reactions of acetamidoxime.
Figure 6. 1H NMR spectra of LB – V(IV) mixtures
Page 95
86
Figure 7. 51V NMR spectra of LB – V(IV) mixtures
Figure 8. 1H NMR spectra of acetamidoxime – V(IV) mixtures.
Page 96
87
Figure 9. 51V NMR spectra of acetamidoxime – V(IV) mixtures. All signals correspond to
known V(V) vanadate species.
Figure 10. 1H NMR spectra of acetone oxime – V(IV) mixtures. Only acetone and acetone
oxime are observed.
Page 97
88
Figure 11. 51V NMR spectra of acetone oxime – V(IV) mixtures. All signals correspond to
known V(V) vanadate species.
For these substrates, the formation of a heterogeneous mixture by the addition of base
was necessary for any reaction to occur. This could indicate that the formation of a hydrated
vanadium oxide VO(OH)2 or a similar species may be the reactive form of vanadium needed
and the free vanadyl ion is inert.3.These reactions transiently turn a blue-grey color with the
formation of a colloid (as observed by the Tyndall effect, Images 1 and 2 below) which then
reacts with the substrates (Scheme 1). The heterogeneous nature of this reaction also explains
its slow and variable kinetics, taking hours to days to react fully. The reaction mixtures remain
slightly acidic, around pH 4-6, so vanadium oxidation is not caused by strong base, and the
substrates are not reactive towards hydrolysis due to low pH.28
The formation of the VO2 colloid in situ appears to be necessary for reactivity of the
substrates other than LA. With multiple vanadium centers in close proximity, this can allow for
two-electron processes and oxygen atom abstraction. This type of reactivity is well known with
vanadium oxides, notably in the contact process that is used on an industrial scale to produce
sulfuric acid.29 To confirm its reactivity, the colloidal material was isolated as a dark blue solid
by centrifugation and decanting of the solution, after allowing a reaction involving acetone
oxime to proceed for one hour. When a fresh solution of oxime was added to the solid the
reaction proceeded, producing the expected amount of acetone, almost 0.5 equivalents. VO2
prepared in the absence of acetone oxime was also tested for its reactivity, either as a wet solid
after isolation by centrifugation and decanting of the solution, or after it had been heated to
dryness. Both forms did react, although much smaller amounts of acetone were produced than
when the VO2 was formed in the presence of acetone oxime and solid VO2 was still present in
the reactions, especially with dry VO2 (Table 2).The large difference in amounts of acetone
Page 98
89
produced can be attributed to the nature of the colloid and its surface. When the colloid is
formed, acetone oxime or other substrate may act as a surfactant enhancing its reactivity, while
hydrated VO2 shows much lower reactivity and dried VO2 lower still.
Scheme 1. reaction of acetone oxime (upper) or acetamidoxime (lower) with V(IV) and base.
Similar reactions take place with LB. The exact composition of the V(IV) colloid is unknown,
and the product V(V) species depend on concentration and pH.
Image 1. Tyndall effect observed in V(IV) – acetone oxime reactions, forming colloidal VO2
Page 99
90
Image 2. Reaction appearance dependent on added base. 0.5 equivalents additional base
added (with respect to V) from left to right; 0.5 eq. to 4.0 eq.
Excess acetone oxime is present as the substrate.
Table 2. Vanadium dioxide reactivity resulting from preparation method.
VO2 preparation Equivalents of acetone
produced (relative to V)
Prepared in the presence of acetone oxime, decanted 0.49
Precipitated without acetone oxime 0.16
Precipitated without acetone oxime, dried at 120°C 0.12
[acetone oxime] = 20 mM
When the reaction of LB was performed at higher concentrations and on a larger scale
in an attempt to isolate products, VO2 precipitated which slowly settled over one week, during
which the solution turned from blue to green to yellow-brown. The supernatant was then
decanted and allowed to slowly evaporate, upon which brown crystals of glutardi(amidinium)
decavanadate, [(H2N)2C(CH2)3C(NH2)2]6⋅[V10O28]2, were obtained. The structure was
confirmed by single crystal X-ray diffraction (Figure 12 and Table 3). Decavanadate formation
is observed as a consequence of an acidic solution, high vanadium concentration, and a poor
ligand that does not interact directly with vanadium at all.18 Although the amidinium ion was
isolated in the crystal structure, hydrolysis can occur to form the more stable amide, as seen
previously in amidoxime reactivity.30 Therefore, in many cases the ammonium ion was
observed in the 1H NMR spectra of these reactions as a distinctive 1:1:1 triplet at δ = 7.16 ppm
due to 1H-14N coupling, along with the formation of amides or carboxylic acids. The integration
of the ammonium signal is significantly lower than ideal stoichiometry, however this is due to
incomplete hydrolysis of amidines, H-D exchange in solution, and possible loss of volatile
NH3.
Page 100
91
Figure 12. Crystal structure of glutaramidinium decavanadate
([(H2N)2C(CH2)3C(NH2)2]6[V10O28]2⋅11H2O).
This type of reductive deoxygenation of amidoximes has been reported previously with
transfer hydrogenation reactions31 and enzyme activity.32 In the latter case, O-substituted
amidoximes were used as prodrugs for relatively reactive and less bioavailable amidines in
vitro and in vivo after deoxygenation by liver enzymes. A somewhat similar deoxygenation
reaction of amidoximes and imide-dioximes has been reported with nitrous acid, although in
that case the amine portion of the amidoxime also reacts, as the reaction produces nitrous oxide
and the amide.30,33,34 Similar reactivity has been observed with hydroxamic acids, although only
when N-substituted, reacting with reduced V(III), V(IV), Mo(IV), and Mo(V).9 In contrast,
stable hydroxamate complexes are known with all of these oxidation states without N-
substitution. Limited examples of V(IV) reacting with salicylaldoxime and salicylamidoxime
have also been reported, where the V(V) complex was isolated in low yield.10 The low yield
reported is consistent with 2 equivalents of V(IV) reacting with each ligand, in a one-electron
process on the metal and two-electron process abstracting an oxygen atom from the ligand,
resulting in at least half of the ligand remaining intact.
Page 101
92
Table 3. Crystallographic data for glutaramidinium decavanadate
[(H2N)2C(CH2)3C(NH2)2]6[V10O28]2⋅11H2O
Formula C40H106N24O67V20
Formula weight (g⋅mol-1) 2894.11
Space group Pna21
a (Å) 18.6232(16)
b (Å) 37.606(3)
c (Å) 13.3441(11)
α (°) 90
β (°) 90
γ (°) 90
V (Å3) 9345.6(14)
Z 4
ρcalc (g⋅cm-3) 2.057
μ (mm-1) 2.014
Crystal size (mm×mm×mm) 0.15×0.15×0.05
Crystal color and form brown block
R1 (I > 2σ(I)) 0.0390
wR2 (I > 2σ(I)) 0.0952
R1 (all data) 0.0427
wR2 (all data) 0.0974
GoF 1.028
Largest difference peak/hole (e⋅Å3) 1.303 / -0.655
In seawater, the majority of vanadium is present in the V(V) oxidation state and so
V(IV) is not expected to be a major competitor for binding. Moreover, V(IV) may be bound to
proteins or small bioligands from which it occurs in organisms, which could attenuate its
reactivity. Despite these mitigating factors, V(IV) is still a potential concern, since the
irreversible reaction would permanently reduce polymer capacity for uranium, forming amides
and similar functional groups that cannot easily be converted back to amidoximes. The very
high affinity of glutaroimide-dioxime towards many metals is also a disadvantage here since it
could extract V(IV) efficiently from other ligands and then the complex proceed to react with
other possible reducing agents other than a second equivalent of V(IV). Because this reaction
is irreversible, it contributes to sorbent degradation and loss of uranium capacity upon cycling
and as such further study is warranted with sorbent samples.
Page 102
93
Vanadium(IV) reactivity with glutaroimide-dioxime (LA)
After exploring the reactivity of V(IV) with simple oximes and amidoximes, we then
looked the reaction of LA with V(IV) by NMR to explain our observations described earlier.
Unlike the other substrates, the reactions remained homogeneous throughout the reaction and
no added base was needed. We attribute this difference in reactivity between LA and the other
substrates to the effectiveness of LA as a ligand, where a transient V(IV) complex forms in
solution.
In order to determine if O-atom transfer or other reactivity was occurring between
vanadyl and LA, quantitative NMR experiments were performed. When the two reagents were
mixed, the reaction mixtures turned dark brown within seconds as observed previously. NMR
spectra were acquired after approximately 6 hours to allow more complete reaction. In these
reactions, the 51V NMR spectra contained the known 1:1 and 2:1 complexes as well as free
vanadium when excess vanadium is present.5 Glutaroimidoxime was identified as one
decomposition product by comparison with an NMR spectrum of the pure compound (Figures
13 and 14) although the major decomposition product, likely arising from further reaction of
glutaroimidoxime, was not able to be identified, not matching previously reported
intermediates of hydrolytic decomposition.28
Figure 13. 1H NMR spectrum of product mixture of LA and V(IV) after 6 hours. Major
decomposition product at δ = 2.91 ppm unidentified. Conditions. 18 mM LA, 6 mM VO2+.
Page 103
94
Figure 14. 1H NMR spectra of LA – V(IV) mixtures. The ligand spectrum contains dioxane as
an additional internal standard, and the inset showing the presence of NH4+.
Figure 15. 51V NMR spectra of LA – V(IV) mixtures. Complex 1 is the signal at +740 ppm,
complex 2 is at -460 ppm, and other signals are vanadates.
Page 104
95
Table 4. Product mixtures of V(IV) and glutaroimide-dioxime (LA).
[LA] V:LA ratio Unreacted [LA] [LA] in 1 [LA] in 2 [decomposition]
1 6:1 0 0 0.24 0.69
12 1:2 0.23 1.7 2.0 8.6
18 1:3.3 1.0 3.0 4.1 9.1
[VO2+] = 6 mM for all reactions. All concentrations are in mM. Multiple decomposition
products were observed that could generally not be identified or quantified separately. Spectra
acquired 6 hours after mixing.
The concentrations of products vary depending on the ratio of reagents used, shown in
Table 4. Here we can see that more than one equivalent of vanadyl reacts with one molecule of
LA, as the concentration of decomposition products exceeds the vanadium concentration when
excess LA is used. Additionally, if excess ligand remains after the V(IV) is oxidized to V(V),
it forms the complexes 1 and 2, which are the products observed previously.
We propose that the rapid homogeneous reaction of LA with vanadyl occurs through the
formation of a transient V(IV) complex followed by reaction with another equivalent of V(IV)
(Scheme 2). This effectively amounts to disproportionation of the vanadium, but rather than
being reduced to V(III), the ligand is reduced instead to form a second equivalent of V(V). This
mechanism is also consistent with the lack of sensitivity to oxygen (see above), making a free
radical mechanism very unlikely. Without complexation to form a transient LA-V(IV) complex
or the presence of organic radicals, a third-order reaction would be needed, which is not
consistent with the rapid reaction and is relatively rare.
Page 105
96
Scheme 2. Proposed reaction mechanism of glutaroimide-dioxime with V(IV). The V(IV)
species shown are hydrated with variable amounts of water and the V(V) product species
vary depending on concentration and pH.
Page 106
97
Summary and conclusions
In this work we have investigated the reactivity taking place between vanadium(IV) and
amidoxime ligands. Rather than form stable V(IV) complexes with glutaroimide-dioxime (LA),
the ligand reacts to oxidize the vanadium to V(V), resulting in the formation of the known non-
oxido V(V) complex of LA, 1. Based on the observed stoichiometry of the reaction and products
observed, we propose that a V(IV) complex is formed transiently due to the strong chelating
ability of LA, but this then reacts with more reduced vanadium to form V(V) in solution. The
reductive reaction of V(IV) was also explored with ligands and substrates that are similar to
LA; glutarodi(amidoxime) (LB), acetamidoxime, and acetone oxime. These three substrates
required the precipitation of VO2 as a colloid, followed by the same oxygen transfer reaction
to form V(V) with an observed vanadium/oxime stoichiometry.
Cyclic voltammetry was performed on the non-oxido V(V) complex of glutaroimide-
dioxime, [NEt4][1], to investigate whether reduction of this complex is possible, and we found
that reduction is possible electrochemically but at a very reducing potential (E ≈ -1.0 to -1.5 V
vs. ferrocene), and is generally irreversible. Only in dichloromethane was it found to be
reversible electrochemically, but upon attempted chemical reduction no products could be
isolated. We attribute this to slow reaction of a transient V(IV) complex and lack of available
hydrolysis pathways in an aprotic, relatively inert solvent. In protic solvents, no V(IV) complex
could be formed either through reduction of 1 or direct reaction of LA with V(IV) sources, and
only V(V) complexes were obtained.
The ligands explored in this study (LA, LB, and acetamidoxime) are analogues of
functional groups on polymer sorbents for the extraction of uranium from seawater. Vanadium
is the most problematic competitor for binding sites, but past work has focused on V(V), which
makes up the majority of vanadium in seawater. However, vanadium also naturally occurs as
V(IV) due to biological redox activity, and V(IV) composes a small but non-negligible amount
of total dissolved vanadium in the ocean. Due to the prompt and irreversible reaction of V(IV)
with LA and other analogues, V(IV) will react to permanently damage amidoxime-
functionalized polymer sorbents, which is a potentially greater concern than the reversible,
albeit strong, binding of V(V) which simply competes with U(VI) for binding and extraction.
Page 107
98
References
(1) Wang, D.; Sañudo Wilhelmy, S. A. Mar. Chem. 2009, 117, 52–58.
(2) Turekian, K. K. Oceans; Prentice-Hall: Englewood Cliffs, N. J., 1968.
(3) Kustin, K.; McLeod, G. C.; Gilbert, T. R.; Le Briggs, B. R. In Structure and Bonding.
Copper, Molybdenum, and Vanadium in Biological Systems.; 1983; Vol. 53, pp. 139–
160.
(4) Dennis Chasteen, N. In Copper, Molybdenum, and Vanadium in Biological Systems;
Springer Berlin Heidelberg: Berlin, Heidelberg, 1983; pp. 105–138.
(5) Leggett, C. J.; Parker, B. F.; Teat, S. J.; Zhang, Z.; Dau, P. D.; Lukens, W. W.;
Peterson, S. J. M.; Cardenas, A. J. P.; Warner, M. G.; Gibson, J. K.; Arnold, J.; Rao, L.
Chem. Sci. 2016, 7, 2775–2786.
(6) Pan, H.-B.; Kuo, L.-J.; Wai, C. M.; Miyamoto, N.; Joshi, R.; Wood, J. R.; Strivens, J.
E.; Janke, C. J.; Oyola, Y.; Das, S.; Mayes, R. T.; Gill, G. A. Ind. Eng. Chem. Res.
2016, 55, 4313–4320.
(7) Tian, G.; Teat, S. J.; Zhang, Z.; Rao, L. Dalton Trans. 2012, 41, 11579.
(8) Sun, X.; Xu, C.; Tian, G.; Rao, L. Dalton Trans. 2013, 42, 14621.
(9) Brown, D. A.; Bögge, H.; Coogan, R.; Doocey, D.; Kemp, T. J.; Müller, A.; Neumann,
B. Inorg. Chem. 1996, 35, 1674–1679.
(10) Zerbib, V.; Robert, F.; Gouzerh, P. J. Chem. Soc. Chem. Commun. 1994, 98, 2179.
(11) Chilou, V.; Gouzerh, P.; Jeannin, Y.; Knobler, C. B. Inorganica Chim. Acta 1990, 178,
23–25.
(12) Smith, W. L.; Raymond, K. N. J. Inorg. Nucl. Chem. 1979, 41, 1431–1436.
(13) Endrizzi, F.; Rao, L. Chem. - A Eur. J. 2014, 20, 14499–14506.
(14) Tian, G.; Teat, S. J.; Rao, L. Dalton Trans. 2013, 42, 5690–5696.
(15) In Inorganic Syntheses; Coucouvanis, D., Ed.; John Wiley & Sons, Inc.: New York,
USA, 2002; Vol. 33, pp. 75–121.
(16) Leggett, C. J.; Rao, L. Polyhedron 2015, 95, 54–59.
(17) Sheldrick, G. M. Acta Crystallogr. Sect. A Found. Crystallogr. 2015, 71, 3–8.
(18) Howarth, O. W. Prog. Nucl. Magn. Reson. Spectrosc. 1990, 22, 453–485.
(19) Vanadium: Biochemical and Molecular Biological Approaches; Michibata, H., Ed.;
2014.
(20) Bratsch, S. G. J. Phys. Chem. Ref. Data 1989, 18, 1–21.
(21) Connelly, N. G.; Geiger, W. E. Chem. Rev. 1996, 96, 877–910.
(22) CRC Handbook of Chemistry and Physics; Rumble, J. R., Ed.; 98th Editi.; CRC
Press/Taylor & Francis: Boca Raton, FL, 2017.
(23) Lodyga-Chruscinska, E.; Szebesczyk, A.; Sanna, D.; Hegetschweiler, K.; Micera, G.;
Garribba, E. Dalt. Trans. An Int. J. Inorg. Chem. 2013, 42, 13404–13416.
(24) Smith, P. D.; Berry, R. E.; Harben, S. M.; Beddoes, R. L.; Helliwell, M.; Collison, D.;
Garner, C. D. J. Chem. Soc. Dalt. Trans. 1997, 4509–4516.
(25) da Silva, J. A. L.; Fraústo da Silva, J. J. R.; Pombeiro, A. J. L. Coord. Chem. Rev.
2013, 257, 2388–2400.
(26) Morgenstern, B.; Kutzky, B.; Neis, C.; Stucky, S.; Hegetschweiler, K.; Garribba, E.;
Micera, G. Inorg. Chem. 2007, 46, 3903–3915.
Page 108
99
(27) Vukovic, S.; Watson, L. a; Kang, S. O.; Custelcean, R.; Hay, B. P. Inorg. Chem. 2012,
51, 3855–3859.
(28) Kang, S. O.; Vukovic, S.; Custelcean, R.; Hay, B. P. Ind. Eng. Chem. Res. 2012, 51,
6619–6624.
(29) Holmes, H. N.; Elder, A. L. Ind. Eng. Chem. 1930, 22, 471–473.
(30) Elvidge, J. A.; Linstead, R. P.; Salaman, A. M. J. Chem. Soc. 1959, 208–215.
(31) Mahajan, U. S.; Godinde, R. R.; Mandhare, P. N. Preparation of Amidines from
Amidoximes via Transfer Hydrogenation. Synthetic Communications, 2011, 41, 2195–
2199.
(32) Clement, B. Drug Metab. Rev. 2002, 34, 565–579.
(33) Eloy, F.; Lenaers, R. Chem. Rev. 1962, 62, 155–183.
(34) Garny, F. Berichte der Dtsch. Chem. Gesellschaft 1891, 24, 3426–3437.
Page 109
100
Chapter 5
Uranyl binding studies with a 1,3,5-triazine hydroxylamine ligand
Page 110
101
Introduction
In addition to glutaroimide-dioxime, acetamidoxime and similar amidoxime-type
ligands that are analogous to polymer sorbents for uranium, other ligands are being explored
for both improved affinity and selectivity. In order to find optimal ligands for this purpose,
several strategies can be employed, each with their own drawbacks. One is direct ligand design,
exploiting differences in geometry and electronic structure that favour certain binding modes
over others, which has been done with uranyl by using appropriately large binding pockets for
its selective complexation,1–4 however, such ligands are relatively complex and are unsuitable
for large-scale synthesis and applications. Ligand screening is another approach which lends
itself well to high-throughput techniques, and this technique has been applied to selective
uranyl extraction5,6 (Chapter 6). A third approach is to use ligands that are known to form
complexes with other metals, and then study binding affinity and selectivity for uranyl, and
make improvements through design modifications.7–10 All of these techniques can benefit from
computational analysis, especially when trends are established with known complexes, then
applied to the study of new ligands.11–13
For the purpose of extracting uranium from seawater, several similar ligands with
similar geometries are possible candidates (Figure 1). Dipicolinic acid is a simple, naturally
occurring carboxylic acid that forms strong chelating complexes with many metal ions,
including vanadium14,15, actinides10,16, and hundreds of other complexes with transition
metals17. The rigid and favourable geometry of the ligand means that it forms strong complexes
with uranyl, although selectivity is not optimal for this purpose as it chelates strongly with
many different metals.
The bis(hydroxylamino)-1,3,5-triazine ligand (H2bihyat) is the subject of investigation
in this study. The morpholine-substituted ligand is used exclusively in this study due to its
relative ease of synthesis and characterization of these complexes, as well as enabling direct
comparison to the known iron18 and vanadium19,20 complexes. Nonetheless, many similar
ligands in this class are known with varying functional groups at the third position (Figure 2),
and the modular synthesis allows for the straightforward derivatization, albeit with varying
yields and solubilities.18 The 1,3,5-triazine core also has potential for the design of other ligands
with binding groups other than hydroxylamine, including thiolates21, phosphonates22,
pyrazoles23, or as a building block for larger functional groups such as pyridyl derivatives24.
The vanadium chemistry of this ligand has been studied extensively, and one key feature
is that it is known to not form 2:1 non-oxido complexes with vanadium(V), instead only
forming a dioxo complex with 1:1 stoichiometry, [(VO2)(bihyat)]-,19 in contrast to
glutaroimide-dioxime25 (see Chapter 2). Additionally, this complex is several orders of
magnitude weaker (log β = 17.87) than the 1:1 glutaroimide-dioxime complex (log β = 21.2 for
[(VO2)(glutaroimide-dioxime)]2-)26. In highly basic solution with pH > 11, free vanadate is
released from the H2bihyat complex, while glutaroimide-dioxime remains tightly bound. This
is a useful property, as this allows strong base to be used as an eluent to free vanadium rather
than relying on strong acid as is currently done, because strong acid often results in sorbent
degradation.27,28 The triazine does form a stronger complex than dipicolinic acid at neutral pH,
reflecting its stronger electron-donating properties.
Page 111
102
Figure 1. Structurally similar ligands investigated for selective uranyl binding
A limited of complexes of the 1,3,5-triazine ligands with other transition metals have
also been reported, including with titanium29 and molybdenum30, largely in nonaqueous
solvents. For the former, a 2:1 complex with distorted octahedral geometry, similar to the iron
complex, was formed, and it was found to have high hydrolytic stability in the presence of
neutral water. Molybdenum forms a dioxo species, like vanadium, however it is a neutral
species due to the (VI) oxidation state, and is only stable at pH < 5.5 in water, with a similar
monomer-dimer equilibrium but favouring the dimer.30
In order to study solution-state interactions of H2bihyat with uranyl, similar techniques
will be used as with vanadium as well as our previous studies of uranyl with seawater-relevant
ligands.31–34 Potentiometry is a key technique that allows us to determine quantitative binding
constants (usually reported as formation constants, log β) as well as survey an entire system
over a wide pH range. NMR spectroscopy also provides important solution-state binding
information that can confirm the existence of complexes, and in some cases their symmetry or
identity, and NMR has been extensively used in our previous work with vanadium. A solid-
state structure has also been determined by X-ray crystallography, and while it does not directly
inform about solution-state binding or selectivity, it provides further proof of metal-ligand
interactions and support of speciation, and allows for the comparison of some bonding
parameters which reflect the nature of metal-ligand interactions.
Page 112
103
(a) General structure of 1,3,5-triazine
hydroxylamine ligands.
(b) Vanadium complexes of H2bihyat19
and H3trihyat20 ligands.
(c) Titanium29 and iron18 complexes of
triazine hydroxylamine ligands.
(d) Molybdenum(VI) complex of
H2bihyat showing monomer-dimer
equilibrium in water.30
Figure 2. Related 1,3,5-triazine hydroxylamine ligands and previously reported
transition metal complexes of these ligands.
Page 113
104
Experimental
Chemicals
H2bihyat was synthesized as described previously.19 Uranyl stock solutions were
prepared by dissolving UO3 in perchloric acid or hydrochloric acid, followed by dilution with
water. The concentration of uranium was determined by fluorimetry35 or titration with
Arsenazo III36, and free acid concentration determined by Gran titration. Acid and base stock
solutions were standardized before use.
Potentiometric titrations
Potentiometric titrations were performed using an autotitration unit consisting of a
double jacket glass titration cell and a Metrohm dosimat (907 Titrando) connected to a pH
electrode (Orion model 8102). The temperature of the titration cell was maintained at (25 ±
0.1) °C by circulating water from a constant temperature water bath. An inert atmosphere was
maintained in the titration cell by passing Ar gas over the solution to exclude CO2 during
titrations. Prior to each titration, an acid/base titration with standardized HCl and NaOH was
performed to obtain the electrode parameters E0, γH, and γOH. These parameters allowed the
calculation of hydrogen ion concentrations from the measured EMF in subsequent titrations.
In a typical titration, a solution (about 15 mL) containing appropriate amounts of UO22+ and
ligand was titrated with a standardized solution of NaOH. Multiple titrations were conducted
with solutions of different concentrations of metal ions. The potentiometric titration data were
analyzed to obtain the stability constants of the metal/ligand complexes by the Hyperquad 2008
program.
UV-Visible absorbance spectroscopy Absorption spectra were acquired on a Cary 50 Spectrophotometer. A 2 mm quartz
cuvette was used, and the baseline corrected against a blank solution of water in the cuvette.
To prepare the solutions, H2bihyat (3.2 mg, 0.0125 mmol) was suspended in water (15
mL, 0.8 mM), and an aqueous solution of uranyl chloride (0.00625 mmol in 0.1 mL) was added
with stirring. The mixture immediately turned an amber color, and upon further stirring the
ligand fully dissolved. After 30 minutes, the solution was measured to be pH 5-6. 1 mL aliquots
were taken and adjusted to different pH values for absorption spectra. The remainder of the
solution at pH 5-6 was allowed to stand for 3 weeks at room temperature, during which large
very dark brown blocks suitable for X-ray diffraction formed.
X-ray crystallography
X-ray structural determination was performed on a Bruker APEX diffractometer with a
Bruker fixed-Chi 3-Circle goniometer, a Bruker APEX I CCD detector, and a
monochromatized fine-focus sealed Mo-kα X-ray source. A crystal was coated with paratone
oil and mounted in a Kaptan loop, which was mounted on the goniometer with a nitrogen
cryostream held at a temperature of 100 ± 0.5 K. Crystallography data was processed in the
WinGX software package, solved using the SHELXTL software package and refined with the
SHELXL software package, with semiempirical absorption correction with SADABS,
included in SHELXTL.37 All non-hydrogen atoms were refined anisotropically, and all
hydrogen atoms were located in difference maps and refined isotropically.
Page 114
105
NMR 1H NMR spectra in H2O or H2O/D2O mixtures were acquired on a Bruker AV-500
spectrometer (500 MHz) using a WATERGATE pulse sequence for solvent suppression, and
referenced to an external standard of C6D6. 1H NMR spectra in DMSO-d6 and MeOD were
acquired on a Bruker AV-500 spectrometer and referenced to the residual solvent peak. 13C
NMR spectra were acquired on a Bruker DRX-500 spectrometer (126 MHz), referenced to an
external standard of C6D6.
Page 115
106
Results and discussion
Potentiometric studies
The results of potentiometric titrations of the uranyl – H2bihyat systems indicate that
both 1:1 and 2:1 species can be formed, dependent on pH; the stability constants are
summarized in Table 1 below. The modelled speciation at a 1:2 U/L ratio as a function of pH
is shown in Figure 3 and a sample titration is provided in Figure 4. The ligand protonation
constants (pKa) were determined in the 0.5 M NaCl ionic medium, and are very close to
literature reported values.19 H2bihyat is more acidic than glutaroimide-dioxime, with the second
protonation constant of 8.0 ± 0.3, so the protonation state in an oceanic environment of pH = 8
would mean that the ligand is half-deprotonated, further facilitating complexation.38
The same (m,h,l) stoichiometries and charges are observed for complexes of both
glutaroimide-dioxime and H2bihyat, such that comparison between species is straightforward.
The stability constants are slightly higher for glutaroimide-dioxime overall, although the higher
first pKa value means that they are generally comparable starting from the protonation states
of the ligand that would be dominant at pH 7-9. For both systems, 2:1 complexes dominate at
neutral to basic pH, while 1:1 complexes are favoured in acid, although 2:1 complexes are still
present. The formation of UO2(HL)2, complex 6 for L=bihyat, shows the largest difference
between the respective formation constants, although this is a relatively minor component of
both systems and is not present in neutral to basic solution.
It should be noted that carbonate was not included in this system. Although this is not
needed for comparison between glutaroimide-dioxime and H2bihyat starting from the same
uranyl carbonate species, comparisons between uranyl and vanadium are somewhat more
qualitative in nature.39 Nonetheless, the similar stability of the uranyl complexes and the much
weaker nature of the vanadium complexes of H2bihyat compared to glutaroimide-dioxime
mean that U/V selectivity should be significantly improved with sorbents based on a triazine
hydroxylamine structure.
Iron is another significant competitor for uranium extraction from seawater, although
not to the same extent as vanadium.28 To assess U/Fe selectivity, the formation constants for
iron(III) can be compared between the H2bihyat18 and glutaroimide-dioxime40 complexes in the
same manner. The formation constant for [Fe(bihyat)2]-, the form isolated from water, is log *β
= -2.73 ± 0.3, which can be converted to a cumulative stability constant of 34.0 ± 0.4, compared
to 36.02 ± 1.07 for glutaroimide-dioxime. This indicates that U/Fe selectivity may be slightly
improved although not to the extent of U/V selectivity.
To avoid precipitation of uranium during titrations, all experiments were performed
with an excess of ligand, with M/L ratios ranging from 1:2.1 to 1:3.3. Based on NMR evidence,
we believe that an unobserved species 2 does form in solution with an approximate stability
constant of log β = 7 ± 1. With a larger constant, we would expect to see 2 in the titrations
performed. Further evidence and discussion of this complex is provided below.
Page 116
107
Table 1. Summary of thermodynamic parameters for uranyl complexes with glutaroimide-
dioxime and bis-(hydroxylamino)-1,3,5-triazine (H2bihyat). Data for glutaroimide-dioxime
and uranyl formation constants are from our past work.31
Reaction
Log β (25oC, 0.5 M NaCl)
H+ + L2- = HL- 12.06 ± 0.23 10.40 ± 0.14
2H+ + L2- = H2L 22.76 ± 0.31 18.38 ± 0.23
3H+ + L2- = H3L+ 24.88 ± 0.35 23.71 ± 0.28
UO22+ + L2- = UO2(L) 17.8 ± 1.1 17.47 ± 0.27 1
UO22+ - H+ + L2- = UO2(OH)(L)- 7 ± 1 (estimated) 2
UO22+ + H+ + L2- = UO2(HL) + 22.7 ± 1.3 19.9 ± 2.5 3
UO22+ + 2L2- = UO2(L)2
2- 27.5 ± 2.3 26.7 ± 0.56 4
UO22+ + H+ + 2L2- = UO2(HL)(L)- 36.8 ± 2.1 33.4 ± 0.50 5
UO22+ + 2H+ + 2L2- = UO2(HL)2 43.0 ± 1.1 37.8 ± 2 6
Page 117
108
Figure 3. Calculated speciation as a function of pH. Species are as listed in Table 1.
Conditions: [UO2] = 0.2 mM, [L] = 4 mM.
Figure 4. Sample titration of uranyl with H2bihyat. Species are as listed in Table 1.
Base equivalents are with respect to ligand. Black circles are measured pH, line is calculated
pH. Conditions: [UO2] = 0.362 mM, [UO2]:[L] = 2.17:1.
0%
25%
50%
75%
100%
2 4 6 8 10
Co
mp
osi
tio
n
pH
2
4
6
8
10
12
0%
20%
40%
60%
80%
100%
0 1 2 3 4Base equivalents added
pH
Spec
iati
on
[UO2]2+
3
1
6
5 4
[UO2]2+
3
1
6
5
4
Page 118
109
UV-Visible absorption
In order to corroborate changes in pH and investigate the electronic structure of the
U(VI)-H2bihyat complexes, we investigated their UV-Visible absorption spectra. During the
titrations, a deep amber color was observed, and we sought to investigate if it varied at different
acidities to use as another characterization of solution binding. Spectrophotometric titrations
can be used in a similar manner as potentiometric titrations, by titrating acid into a mixture and
fitting it to calculated or known absorption spectra of the individual components.
Spectrophotometry is generally less accurate and reliable as potentiometric data when it is
available, especially with uranyl, whose color tends to be weak and vary less than other actinide
or transition metal species.10,38,41
The free ligand is colorless and has no visible absorption, but absorbs strongly in the
ultraviolet region due to its conjugated aromatic core (Figure 5). Uranyl also has weak visible
absorption, appearing pale yellow in solution. In contrast, when they are mixed, darker amber
colors are observed. The dramatic change and increase in intensity of color is the result of new
ligand-metal charge transfer transitions that can occur.42 Interestingly, the UV absorption of
the free ligand extends further towards the visible region than in complexes, with an absorption
cutoff at about 320 nm, as opposed to 290-300 nm when uranyl is present. This indicates that
the transitions observed in the triazine core are affected by the presence of uranyl, either
through participation of the nitrogen atom in bonding or distortions in geometry upon binding
which affects conjugation throughout the molecule.20
Although full spectrophotometric titrations were not performed, the spectra can
nonetheless corroborate the different stoichiometries observed over a wide pH range. As the
pH is raised from acidic to neutral, the major absorption band at 450 nm appears. The
absorption does not change significantly with protonation state as the pH changes, however,
the absorption decreases as the pH is increased further, and the band shifts to 425 nm in more
basic solution, as the 2:1 complexes are formed. This absorption is slightly weaker, which is
consistent with previously observed symmetric vs. asymmetric actinyl species.10,41 Several
absorption bands of lower intensity can be seen around 340 nm and 640 nm, the former of
which contributes to the overall yellow-amber color observed.
Page 119
110
Figure 5. UV-Visible absorption spectra of uranyl – H2bihyat solutions.
The lower spectrum is an inset of the upper spectrum.
Conditions: [L] = 0.8 mM, [UO2] = 0.4 mM (except ligand only solution), 2 mm cuvette.
0
0.3
0.6
0.9
1.2
250 350 450 550 650 750
Ab
sorb
ance
Wavelength (nm)
0
0.1
0.2
0.3
250 350 450 550 650 750
Ab
sorb
ance
Wavelength (nm)
Ligand only
pH ~3.5
pH ~4.5
pH ~5.5
pH ~6.5
pH ~7.5
pH ~8.5
pH ~9.5
Page 120
111
Solid-state binding
After the solutions were prepared and pH adjusted for the UV-Visible absorption
spectroscopy studies, the solutions were allowed to stand at room temperature. Over the course
of three weeks, dark brown-black blocks of 1⋅2H2O formed from the solution at pH 5.5 and
the solution decolored. All of the other solutions remained colored but clear with no signs of
precipitation or crystallization. At this pH, 1 is expected to be dominant uranium species in
solution (Table 1 and Figure 3), although we are not able to explain why no solids were
observed in the other containers where 1 was also dominant at pH 4.5 and 6.5. The long
crystallization time and remaining color in the other containers also indicates that the uranium-
H2bihyat complexes are stable over long periods of time in the pH range observed here, which
is necessary for prolonged immersion in the ocean and recycling if incorporated into polymer
sorbents, with targets of 6 uses of 4-8 weeks each being targets for reuse.28,43 Several attempts
were made to isolate and crystallize a 2:1 complex; 4, 5, or 6. However, all methods tested with
either water or water and cosolvents containing these species never resulted in any isolable
solid material, in contrast to the uranyl – glutaroimide-dioxime complex where the structure
with 2:1 stoichiometry was obtained, not 1:1.
The crystal structure of 1⋅2H2O was obtained, and is shown in Figure 6. The complex
crystallizes in the P21/c space group with no symmetry elements within the molecule. Selected
bond lengths and angles are presented in Table 2 with comparisons to the U – glutaroimide-
dioxime31 and V – H2bihyat complexes19. Crystal structure data is shown in Table 3 below.
In the structure, the uranyl ion remains close to linear, at 175.7° with typical U=O bond
lengths of 1.787 and 1.779 Å. The U-ligand bonds of 1 are approximately 0.1Å shorter than
the analogous bonds in the glutaroimide-dioxime complex. However, this could be a
consequence of the ligand in 1 being of the form [bihyat]2-, while glutaroimide-dioxime is in
the [H-glutaroimide-dioxime]- protonation state. Despite having shorter bonds to uranyl, the
O–M–O bite angle in 1 is slightly larger than glutaroimide-dioxime, at 126.6° compared to
121.1°. This would suggest that differences in bond lengths and angles may be due to ligand
geometry rather than significantly different bond character, due to the rigidity of both ligands.
The metal-ligand bond lengths for the vanadium complex [VO2(bihyat)]- are significantly
shorter than those in 1 as a consequence of the smaller ionic radius of V vs. U.
Page 121
112
Figure 6. Crystal structure of the 1:1 U(VI)/H2bihyat complex 1⋅2H2O. Thermal ellipsoids
are at the 50% probability level. One water molecule is hidden for clarity.
Table 2. Selected Bond lengths and angles in the crystal structure of 1⋅2H2O and comparison
to bis(glutaroimide-dioxime) uranyl31 and V(V)/H2bihyat.19
Bond length (Å)
or angle (°) 1⋅2H2O
(UO2)(glutaroimide-
dioxime)2 [VO2(bihyat)]-
M–O (ligand) 2.362(2), 2.410(2) 2.535(3), 2.429(3) 1.974(3), 1.994(3)
M–N 2.439(2) 2.563(3) 1.993(3)
M=O (oxo) 1.787(2), 1.779(2) 1.785(3) 1.624(3), 1.637(3)
M–O (water) 2.368(2), 2.375(2)
O–M–O (ligand) 126.61(7) 121.05(9) 145.52(12)
O=M=O (oxo) 175.70(9) 180.0 111.06(19)
Table 3. Crystal structure data for 1⋅2H2O.
Page 122
113
1⋅2H2O
Formula C9H20N6O8U
Formula weight (g⋅mol-1) 578.32
Space group Monoclinic, P21/c
a (Å) 11.476(3)
b (Å) 13.364(3)
c (Å) 11.110(3)
α (°) 90
β (°) 106.465(4)
γ (°) 90
V (Å3) 1634.1(7)
Z 4
ρcalc (g⋅cm-3) 2.351
μ (mm-1) 9.986
F(000) 1088
Crystal size (mm × mm × mm) 0.100 × 0.060 × 0.060
Crystal color and form Dark brown block
Theta range for data collection 1.850 to 25.371°
Index ranges -13<=h<=13, -16<=k<=16, -13<=l<=13
Reflections collected 44023
Independent reflections 2983 [R(int) = 0.0386]
R1 (I > 2σ(I)) 0.0138
wR2 (I > 2σ(I)) 0.0345
R1 (all data) 0.0139
wR2 (all data) 0.0345
GoF 1.175
Largest difference peak/hole (e⋅Å3) 0.619 / -0.891
Page 123
114
NMR solution binding studies
NMR experiments were performed to determine solution speciation of the
H2bihyat/uranyl system to corroborate potentiometric titration experiments. In water, the 1:1
complex is observed in acidic to neutral solution (Figures 3 and 4). However, once crystallized
from solution as (L)(UO2)⋅2H2O (crystal structure), it is insoluble in neutral or acidic water,
indicative of a neutral low-polarity species. All the spectra acquired have broad peaks,
indicative of hydrogen bonding and/or dynamic equilibrium in solution.
Upon adding base to the 1:1 complex in water (3 equivalents, final pH = 12), it
redissolves, likely due to exchange of water on uranyl with hydroxide. We propose that the
complex is deprotonated in solution, forming the anionic complex [(L)(UO2)(OH)]-, 2. This is
not present in speciation models from the potentiometric titrations. However, experiments were
only performed with a 2:1 or larger excess of ligand relative to uranyl. When a formation
constant of log β = 7.0 for 2 (m,h,l = 1,-1,1) is added, it is never observed at 2:1 or higher U/L
ratios but at a 1:1 ratio, it appears at pH = 9 and is the only species present at pH = 12. The
addition of more ligand results in the solution becoming a slightly paler color, and the NMR
spectra show that a new species is formed, which we assign to the 2:1 complex, with excess
ligand and very small amounts of the 1:1 complex also present. The 13C spectra are consistent
with these species (Figure 9), and a 2D 1H-13C HSQC spectrum was acquired to confirm these
assignments (Figure 10).
In addition to spectra in water, NMR spectra of the isolated 1:1 complex was also
acquired in methanol and DMSO (Figure 8). In both cases, distinct peaks are observed for the
1:1 complex, showing coupling that is absent in water. Excess ligand was added to both
solutions, where different behavior was seen between the different solvents. In DMSO, the
ligand did not interact with the 1:1 complex even after standing for 12 hours. In this case, the
1:1 complex is preferred over the neutral 2:1 complex. In methanol, a complex mixture is
formed, likely a mixture of 1:1 and 2:1 complexes, and possibly with methanol exchanging
with coordinated water in the 1:1 complex. Peaks could not be assigned to specific species,
although qualitatively several different complexes are present, likely all in dynamic
equilibrium.
Page 124
115
Figure 7. 1H NMR spectra of H2bihyat/UO2
2+ in water.
Figure 8. 1H NMR spectra of H2bihyat/UO2
2+ in Methanol and DMSO.
Page 125
116
Figure 9. 13C NMR spectra of H2bihyat/UO2
2+ in water
(upper: full spectra; lower: aliphatic region only)
Figure 10. 1H-13C HSQC spectrum of the aliphatic region to confirm peak assignments
Page 126
117
Summary and conclusions
In this study we have investigated the solution-state and solid-state interactions of
uranyl with a 1,3,5-triazine hydroxylamine ligand, H2bihyat. Solution and solid-state chemistry
of this and closely-related triazine ligands have previously been studies with several metals,
notably vanadium and iron, which are the major competitors for uranyl binding in polymer
sorbents. The ligand has a rigid planar core and chelates to metals through (O,N,O) binding, in
the same manner as glutaroimide-dioxime which is the ligand that has received the most
attention for uranyl extraction.
Solution binding studies through potentiometry and NMR studies have shown that both
1:1 and 1:2 U/L complexes can form, with the former being favoured only at low pH. Formation
constants for complexes are slightly lower than for the analogous glutaroimide-dioxime
complexes, for instance, 43.0 vs. 37.8 for the respective neutral UO2(HL)2 species. This is
somewhat offset by the ligand protonation state; at seawater pH glutaroimide-dioxime is in the
neutral form while H2bihyat is half deprotonated, so binding will occur more readily. NMR
speciation is consistent with the stoichiometries observed by potentiometry, and the behaviour
of the complex in other solvents gives insight into the binding mechanism. In the course of
these studies, we isolated and crystallized the 1:1 U/H2bihyat complex, obtaining the crystal
structure through X-ray diffraction. The ligand binds in a tridentate fashion with bond lengths
and angles typical of uranyl complexes, similar to the analogous glutaroimide-dioxime
complex. It is unusual, however, that this complex with 1:1 stoichiometry was isolated, in
contrast to glutaroimide-dioxime, where only the 2:1 complex was crystallized.
Although this ligand does not offer significantly improved binding affinity to uranyl
when compared to glutaroimide-dioxime, it has much greater selectivity for uranium over
vanadium. Consequently, overall uranium capacity should increase due to fewer binding sites
being occupied by vanadium. Polymer reconditioning and reuse also benefits from weaker
vanadium binding, since the strong acid needed to remove vanadium from glutaroimide-
dioxime is not needed; base can be used instead. The incorporation of the triazine moiety into
polymers may be a synthetic challenge, but research into this is currently underway. Additional
solution state studies are planned for this system, including computational studies, solution and
solid-state EXAFS studies, and investigating transuranic complexes of H2bihyat.
Page 127
118
References
(1) Sather, A. C.; Berryman, O. B.; Rebek, J. J. Am. Chem. Soc. 2010, 132, 13572–13574.
(2) Sather, A. C.; Berryman, O. B.; Moore, C. E.; Rebek, Jr., J.; Rebek, J. Chem. Commun.
(Camb). 2013, 49, 6379–6381.
(3) Prudden, A. R.; Lien, N. R.; Telford, J. R. Chem. Commun. (Camb). 2004, 172–173.
(4) Lashley, M. A.; Ivanov, A. S.; Bryantsev, V. S.; Dai, S.; Hancock, R. D. Inorg. Chem.
2016.
(5) Parker, B. F.; Knight, A. S.; Vukovic, S.; Arnold, J.; Francis, M. B. Ind. Eng. Chem.
Res. 2016, 55, 4187–4194.
(6) Zhou, L.; Bosscher, M.; Zhang, C.; Özçubukçu, S.; Zhang, L.; Zhang, W.; Li, C. J.;
Liu, J.; Jensen, M. P.; Lai, L.; He, C. Nat. Chem. 2014, 6, 236–241.
(7) Mullen, L.; Gong, C.; Czerwinski, K. J. Radioanal. Nucl. Chem. 2007, 273, 683–688.
(8) Berry, R. E.; Smith, P. D.; Harben, S. M.; Helliwell, M.; Collison, D.; David Garner,
C. Chem. Commun. 1998, 2, 591–592.
(9) Ghosh, S.; Biswas, S.; Bauzá, A.; Barceló-Oliver, M.; Frontera, A.; Ghosh, A. Inorg.
Chem. 2013, 52, 7508–7523.
(10) Xu, C.; Tian, G.; Teat, S. J.; Rao, L. Inorg. Chem. 2013, 52, 2750–2756.
(11) Vukovic, S.; Hay, B. P. Inorg. Chem. 2013, 0, 7805–7810.
(12) Mehio, N.; Lashely, M. A.; Nugent, J. W.; Tucker, L.; Correia, B.; Do-Thanh, C.-L.;
Dai, S.; Hancock, R. D.; Bryantsev, V. S. J. Phys. Chem. B 2015, 119, 3567–3576.
(13) Vukovic, S.; Watson, L. a; Kang, S. O.; Custelcean, R.; Hay, B. P. Inorg. Chem. 2012,
51, 3855–3859.
(14) Crans, D. C.; Mahroof-Tahir, M.; Johnson, M. D.; Wilkins, P. C.; Yang, L.; Robbins,
K.; Johnson, A.; Alfano, J. A.; Godzala, M. E.; Austin, L. T.; Willsky, G. R.
Inorganica Chim. Acta 2003, 356, 365–378.
(15) Hakimi, M.; Kukovec, B. M.; Rezvaninezhad, M.; Schuh, E.; Mohr, F. Zeitschrift fur
Anorg. und Allg. Chemie 2011, 637, 2157–2162.
(16) Xu, C.; Tian, G.; Teat, S. J.; Liu, G.; Rao, L. Chemistry 2013, 19, 16690–16698.
(17) Allen, F. H. Acta Crystallogr. Sect. B Struct. Sci. 2002, 58, 380–388.
(18) Gun, J.; Ekeltchik, I.; Lev, O.; Shelkov, R.; Melman, A. Chem. Commun. (Camb).
2005, 5319–5321.
(19) Nikolakis, V. A.; Tsalavoutis, J. T.; Stylianou, M.; Evgeniou, E.; Jakusch, T.; Melman,
A.; Sigalas, M. P.; Kiss, T.; Keramidas, A. D.; Kabanos, T. A. Inorg. Chem. 2008, 47,
11698–11710.
(20) Nikolakis, V. a; Exarchou, V.; Jakusch, T.; Woolins, J. D.; Slawin, A. M. Z.; Kiss, T.;
Kabanos, T. a. Dalton Trans. 2010, 39, 9032–9038.
(21) Hunks, W. J.; Jennings, M. C.; Puddephatt, R. J. Inorg. Chem. 1999, 38, 5930–5931.
(22) Maxim, C.; Matni, A.; Geoffroy, M.; Andruh, M.; Hearns, N. G. R.; Clérac, R.;
Avarvari, N. New J. Chem. 2010, 34, 2319.
(23) Garner, M.; Reglinski, J.; Cassidy, I.; Spicer, M. D.; Kennedy, A. R. Chem. Commun.
1996, 355, 1975.
(24) Lewis, F. W.; Harwood, L. M.; Hudson, M. J.; Drew, M. G. B.; Desreux, J. F.; Vidick,
G.; Bouslimani, N.; Modolo, G.; Wilden, A.; Sypula, M.; Vu, T. H.; Simonin, J. P. J.
Am. Chem. Soc. 2011, 133, 13093–13102.
Page 128
119
(25) Leggett, C. J.; Parker, B. F.; Teat, S. J.; Zhang, Z.; Dau, P. D.; Lukens, W. W.;
Peterson, S. J. M.; Cardenas, A. J. P.; Warner, M. G.; Gibson, J. K.; Arnold, J.; Rao, L.
Chem. Sci. 2016, 7, 2775–2786.
(26) Ivanov, A. S.; Leggett, C. J.; Parker, B. F.; Zhang, Z.; Arnold, J.; Dai, S.; Abney, C.
W.; Bryantsev, V. S.; Rao, L. Manuscript Submitted 2017.
(27) Oyola, Y.; Vukovic, S.; Dai, S. Dalton Trans. 2016, 8532–8540.
(28) Kim, J.; Tsouris, C.; Oyola, Y.; Janke, C. J.; Mayes, R. T.; Dai, S.; Gill, G.; Kuo, L. J.;
Wood, J.; Choe, K. Y.; Schneider, E.; Lindner, H. Ind. Eng. Chem. Res. 2014, 53,
6076–6083.
(29) Peri, D.; Alexander, J. S.; Tshuva, E. Y.; Melman, A. Dalton Trans. 2006, 4169–4172.
(30) Vi, M.; Stylianou, M.; Nikolakis, V. A.; Chilas, G. I.; Jakusch, T.; Vaimakis, T.; Kiss,
T.; Sigalas, M. P.; Keramidas, A. D.; Kabanos, T. A. Inorg. Chem. 2012, 51, 13138–
13147.
(31) Tian, G.; Teat, S. J.; Zhang, Z.; Rao, L. Dalton Trans. 2012, 41, 11579–11586.
(32) Tian, G.; Teat, S. J.; Rao, L. Dalton Trans. 2013, 42, 5690–5696.
(33) Endrizzi, F.; Melchior, A.; Tolazzi, M.; Rao, L. Dalton Trans. 2015, 44, 13835–13844.
(34) Endrizzi, F.; Leggett, C. J.; Rao, L. Ind. Eng. Chem. Res. 2016, 55, 4249–4256.
(35) Smith, N. A.; Cerefice, G. S.; Czerwinski, K. R. J. Radioanal. Nucl. Chem. 2013, 295,
1553–1560.
(36) Savvin, S. Talanta 1961, 8, 673–685.
(37) Sheldrick, G. M. Acta Crystallogr. Sect. A Found. Crystallogr. 2015, 71, 3–8.
(38) Endrizzi, F.; Rao, L. Chem. - A Eur. J. 2014, 20, 14499–14506.
(39) Endrizzi, F.; Leggett, C. J.; Rao, L. Ind. Eng. Chem. Res. 2016, 55, 4249–4256.
(40) Sun, X.; Xu, C.; Tian, G.; Rao, L. Dalton Trans. 2013, 42, 14621–14627.
(41) Sun, X.; Tian, G.; Xu, C.; Rao, L.; Vukovic, S.; Kang, S. O.; Hay, B. P. Dalton Trans.
2014, 43, 551–557.
(42) Denning, R. G. J. Phys. Chem. A 2007, 111, 4125–4143.
(43) Gill, G. A.; Kuo, L.-J.; Janke, C. J.; Park, J.; Jeters, R. T.; Bonheyo, G. T.; Pan, H.-B.;
Wai, C.; Khangaonkar, T.; Bianucci, L.; Wood, J. R.; Warner, M. G.; Peterson, S.;
Abrecht, D. G.; Mayes, R. T.; Tsouris, C.; Oyola, Y.; Strivens, J. E.; Schlafer, N. J.;
Addleman, R. S.; Chouyyok, W.; Das, S.; Kim, J.; Buesseler, K.; Breier, C.;
D’Alessandro, E. Ind. Eng. Chem. Res. 2016, 55, 4264–4277.
Page 129
120
Chapter 6
An alternative approach to selective U(VI) extraction from seawater
using a combinatorial peptoid ligand system
Page 130
121
Introduction1
Much of the recent work on uranium recovery has focused on the amidoxime functional
group that binds uranyl with a high affinity and with selectivity over many, but not all, other
metal ions. The related glutaroimide-dioxime ligand (the cyclized product of two amidoxime
groups) as well as monomeric amidoximes are also of interest as molecular analogues of the
groups that are present on the amidoxime-functionalized polymer fibers.1,2 These ligands are
effective, but they have notable drawbacks, the most significant of which include: (1) a lack of
selectivity for uranyl over vanadium and (2) degradation of the polymer under the harsh
conditions that are needed to liberate the strongly bound uranium and other metal species from
the adsorbent.3,4
Given the above limitations, there is significant interest in exploring new systems that
can bind uranyl selectively over vanadium and other competing metal ions present at high
concentrations. However, the process of designing and synthesizing large receptors to exploit
the unique geometry of uranyl is inherently costly and time-consuming. Instead of relying
solely on conventional, one-at-a-time ligand design, we are augmenting our efforts with
combinatorial approach, using ligand libraries to identify robust and selective ligands through
the use of large libraries of potential binding candidates.5–7
Combinatorial screening is a powerful technique that is commonly used for discovering
new molecules for therapeutic applications and catalysis. Recently, an in silico screening
approach has been used to explore uranyl-binding with engineered proteins, using a
computational library to search for an appropriately-sized binding pocket.8 This approach has
been quite successful for the generation of an engineered protein that can bind with a very high
affinity (at the femtomolar level). However, using engineered proteins is not feasible on the
large scale that is proposed for polymer sorbents, as the cost would likely be prohibitively
expensive.
The peptoid framework lends itself well to our goal, as it is a relatively inexpensive and
versatile scaffold with the ability to create selective metal binding pockets.7,9–12 In recent work,
we have used a peptoid-based platform to identify selective ligands for toxic metals in complex
environments: chromium in natural water sources and cadmium in blood.13,14 Inspired by the
successful removal of aqueous Cr(VI) from stream and seawater, the screening procedure was
adapted to identify selective ligands for uranyl. These ligands were then resynthesized and
verified for their uranyl binding ability. To provide insight into the binding interactions, a
computational approach was implemented to model solution-state binding modes, which may
be difficult to determine experimentally. Density functional theory (DFT) methods have been
used previously to characterize the peptoid backbone;15 here this approach has been extended
to explore the binding modes and conformational flexibilities of peptoids when binding metals.
The contents of this chapter have been previously published in "A Peptoid-Based
Combinatorial and Computational Approach to Developing Ligands for Uranyl
Sequestration from Seawater"; Bernard F. Parker, Abigail S Knight, Sinisa Vukovic, John
Arnold, Matthew B. Francis; Industrial & Engineering Chemistry Research; 2016, 55 (15), p.
4187-4194.
Page 131
122
In this report, we thus describe the full combination of combinatorial screening using a peptoid
library and computational efforts implemented that are required to identify new, inexpensive
ligand design leads that could be adapted for the sequestration of uranyl from seawater.
Page 132
123
Methods
Peptoid synthesis General techniques used for peptoid synthesis were according to procedures in our
previous work.13 Tentagel MB NH2 resin (140-170 μm, 0.3 mmol/g) was purchased from Rapp-
Polymere (Tuebingen, German). Butylamine, histamine, and piperonylamine were
incorporated without protecting groups. N-boc-ethylenediamine was purchased and used as
received. Cyesteamine was protectected with a trityl group as reported by Maltese.16 β-alanine
and glycine were purchased as hydrochloride salts of the respective t-butyl esters. To obtain
the free bases, they were treated with 1 M NaOH solution saturated with NaCl and extracted
with a mixture of 15:85 isopropanol:chloroform (v/v). The organic layers were dried over
sodium sulfate and the solvent removed by evaporation to give the free bases. All other
materials were purchased from commercial sources and used without further purification unless
otherwise noted.
Tentagel MB NH2 resin was swollen in dichloromethane (DCM) before peptoid
synthesis. Fmoc solid-phase synthesis was used to incorporate the first four linker members
using HCTU as a coupling agent. The resin was split evenly into seven fritted columns, then
acylation and addition of the first amine were performed as developed by Zuckermann et. al.17
For each acylation step, the resin beads were exposed to a solution of chloroacetic acid in
dimethylformamide (DMF) (0.4 mM) as well as a solution of diisopropylcarbodiimide in DMF
(2 M) with gentle agitation for 5 min on a nutator. The solutions were removed by filtration,
and the resin rinsed with DMF. The resin beads were then exposed to a solution of amine in
DMF (2 M) with gentle agitation for 2 h on a nutator. The solutions were removed by filtration,
then all the resin was combined and mixed in DCM for 5 min. These steps were repeated three
more times to add three more amines. After the resin was combined the last time, a solution of
4-methylpiperidine in DMF (20%) was added to the resin to remove any acyl groups from
imidazoles. The resin was then filtered and rinsed with DMF. The protecting groups were
removed by incubation with a cleavage solution of 95:2.5:2.5 trifluoroacetic
acid:water:triisopropylsilane for 1.5 h, then rinsed with DCM, dried under vacuum, and
refrigerated until use.
Screening and sequencing
Before incubating in the screening solution, a 40 mg portion of the resin was swelled in
water overnight. The screening buffer (7 mL) was added, consisting of 2 mM UO2(OAc)2 , 1
M NaCl, 1 M MgSO4, 20 mM NaHCO3 , adjusted to pH 7, and incubated for 1 h. The library
was then rinsed with water (3x1 mL) to remove ions not bound to the ligands, then with ethanol
(1 mL) to remove excess water. The resin was then transferred to a Petri dish. No color changes
were observed after incubation. The dye solution was prepared by diluting 50 μL of an aqueous
1 mM solution of arsenazo III sodium salt into 1 mL ethanol. This was then added to the beads
and allowed to sit for 1 min before removal of the excess dye solution. Upon evaporation of
the remaining solvent, the dye would be trapped in the resin, binding to the metal if present.
The resin in the Petri dish was then examined using a Leica S6D Microscope (Leica, Germany).
The 15 individual beads with the most intense blue-green color were selected for ligand
identification.
Page 133
124
To avoid radiological contamination and ensure proper sequencing, the metal ions were
removed by placing the selected beads on the membrane of a centrifugal filter unit. Amberlite
cation exchange resin (Na+ form, 0.5 mg) was added to the filtrate collection tube of the filter
unit, to which 1 M HCl (0.5 mL) was added. The tube was agitated gently on a nutator for 15
min, followed by centrifugation. The acid solution was then removed, and water was added
(0.5 mL). The tube was again gently agitated on a nutator for 15 min, followed by
centrifugation and removal of the water. The water rinse was repeated 3 times. The beads were
then placed in a Petri dish with ethanol (0.5 mL), then individually selected and placed into
individual Eppendorf tubes. Ethanol (5 μL) was added to each. The tubes were then placed in
a computer controlled photoreactor with UVA bulbs for 8 h to cleave the peptoids from the
resin beads.
After photocleavage, the ethanol was removed via evaporation and a solution (0.5 μL)
consisting of 1:1 water:acetonitrile with tris(2-carboxyethyl)phosphine (0.5 mM). This solution
was then mixed with matrix solution (0.5 μL) consisting of 1:1 water:acetonitrile with 0.1%
trifluoroacetic acid, 0.6 M ammonium phosphate, and α-cyano-4-hydroxycinnamic acid (5 mg)
and spotted on a stainless steel MALDI plate. MALDI-TOF MS (Voyager- DE instrument,
Applied Biosystems) was used to identify the selected sequences by mass, and then and
MALDI-TOF-TOF MS/MS (AB Sciex TF4800, Applied Biosystems) was used to sequence
the peptoids by fragmentation.
Peptoid screening Peptoid synthesis was performed according to the general procedures in our previous
work on Tentagel MB NH2 resin.13 For incubation with uranyl, the resin was swelled in water
overnight prior to the addition of the screening buffer, which consisted of 2 mM UO2(OAc)2 ,
1 M NaCl, 1 M MgSO4, and 20 mM NaHCO3 , adjusted to pH 7. The resin was incubated for
1 h, then rinsed briefly with water (3x1 mL) to remove ions not bound to the ligands. No color
changes were observed after incubation. Ethanol (1 mL) was then added to remove excess
water. The resulting resin was transferred to a Petri dish. The dye solution was prepared by
diluting 50 μL of an aqueous 1 mM solution of arsenazo III sodium salt into 1 mL of ethanol.
This was then added to the beads for 1 min before removal of the excess dye solution. Upon
evaporation of the remaining solvent, the dye was trapped in the resin, binding to the metal if
present. The resin in the Petri dish was then examined using an optical microscope, and the 15
individual beads with the most intense blue-green colors were selected for ligand identification.
Sequencing was then performed in the same fashion as in previous work.13
Fluorescence spectroscopy
Synthesis of peptoids for fluorescence experiments were also performed according to
procedures in our previous work.13 For preparative scale synthesis, the sequences were
prepared analogously, using Fmoc-Rink Amide MBHA resin (Anaspec, Fremont, CA) instead
of Tentagel MB NH2 resin. The resin was treated with 20% 4-methylpiperidine in DMF to
cleave the initial fluorenylmethyl (Fmoc) group, followed by a cleavage cocktail of 95:2.5:2.5
trifluoroacetic acid:water:triisopropylsilane to remove the peptoids from the resin and cleave
the protecting groups from the submonomers. The trifluoroaceitc acid was removed by
evaporation and the peptoids precipitated from diethyl ether, then suspended in water. They
Page 134
125
were then purified by reverse-phase HPLC on a semi-preparatory HPLC column (Agilent). The
fractions were then concentrated by speed vacuum and lyophilized.
A series of 2-20 μL portions of 10 mM or 80 mM solutions of UO2(NO3)2 were added
to each peptoid sample (100 μM, 1.00 mL) containing 20 mM HEPES buffer at pH 7. The
fluorescence was then measured at each increment using a Photon Technology International
Quanta Master 4 L-format scanning spectrofluorimeter with a LPS-220B 75W xenon lamp,
using a 1 cm path length, 1.5 mL quartz cuvette. The excitation wavelength used was 200 nm,
and emission was measured over 300-550 nm wavelengths, with the maximum emission at 321
nm, with 1 nm wavelength increments and 1 s integration times were used for all in.
Concurrently, the uranyl fluorescence emission grew in at 369 nm, and at high uranyl
concentrations (>1500 μM) it overlapped with the piperonyl emission. The emission was
plotted against the concentration of uranyl and fit to a logistic binding curve (Equation 1). A1
and A2 are the asymptotes of the data, p is the slope of the curve, and x0 is the inflection point
used to approximate the dissociation constant.
𝑦 = (𝐴1 − 𝐴2)
(1 +𝑥𝑥0
)𝑝+ 𝐴2 (1)
DFT studies
Following prior calculations on uranyl amidoximate complexes (and references
therein), electronic structure calculations were used to optimize geometries for uranyl
complexes containing amidoximate and carbonate ligands.18 These calculations were
performed with the Gaussian 09 A2 package using density functional theory (DFT) at the
B3LYP level of theory.19–21 The Stuttgart Reactive small core 1997 effective core potential was
used for uranium, replacing 60 core electrons to account for scalar relativistic effects.22 The
valence electrons in this basis set are represented by a contracted [8s/7p/6d/ 4f] basis; 6-
31+G(d,p) basis sets were used for carbon, nitrogen, oxygen, and hydrogen atoms. Frequency
calculations were performed to verify that geometries were minima. Solvation free energies
have been calculated with the IEFPCM method, with corrections for standard concentrations.23–
26 Full coordinates for reported structures (optimized atomic coordinates, absolute energies,
and images) are provided at the end of this chapter.
Page 135
126
Results and Discussion
Library design Given the success of the library screened for chromate ligands, an analogous library
was synthesized with four variable positions (Figure 1). Each of these sites displayed a side
chain chosen from the seven possible submonomers shown in the figure, providing 2401
possible structures.13 The library was synthesized on poly(ethylene glycol) (PEG)-grafted
polystyrene resin to allow for use in organic solvents during synthesis and in aqueous solutions
during screening. A photocleavable residue was incorporated as the first residue to allow facile
cleavage of the peptoid from the resin for ligand sequencing after the screening procedure. A
previously established step-wise peptoid synthesis protocol using chloroacetic acid was used
to incorporate the seven submonomers.27 Binding moieties, including amines, carboxylic acids,
and thiols, were included. In addition, two nonbinding groups were also incorporated to
influence the secondary structures and steric interactions of the peptoids. The peptoid tetramers
were attached to the resin via a linker to increase the distance between the ligands and the
synthesis resin, and to include a bromine isotopic tag (79Br/81Br) to aid in the identification of
the structures by MALDI-TOF-TOF MS/MS.
The library was evaluated for binding by incubation in a screening solution consisting
of 1 M NaCl, 1 M MgSO4, 20 mM NaHCO3 (as a buffer, adjusted to pH 7), and 2 mM
UO2(OAc)2. After one hour, the resin was rinsed with water to remove unbound or weakly
bound uranyl (Figure 2; the resin shown is from preliminary tests in the absence of carbonate
in the screening buffer to illustrate changes in color in the presence of uranyl). Due to the weak
visible absorption of uranyl species, the screening solutions appeared colorless, and no color
changes were observed in the library resin upon uranyl addition. To identify the uranyl binders,
arsenazo III was used as a visualization agent.28 It is an arsenic acid-based dye that has an
intense purple color as the free acid or in the presence of alkali metal salts; however, upon
binding to certain metals (such as uranyl) it changes to a blue or green color. After the
incubation of the peptoid library with the screening solution, arsenazo III was added as a
solution in ethanol to aid in the visualization of peptoids coordinated to uranyl. After the dye
was added, less than 10% of the library beads showed any color change from purple. Of the
beads that did change color, most were a lighter blue-purple shade, and only about 30 beads
had a clear green color. A sample of library that was exposed to the buffer solution without
uranyl followed by treatment with arsenazo III showed only purple beads, thus ruling out false
positives due to peptoid interactions with the dye.
After the dye was applied and the resin was visualized under an optical microscope,
fifteen individual beads were selected manually using a micropipette. In order to sequence the
peptoids present on the beads, uranyl had to be removed to ensure proper fragmentation during
MALDI-TOF-TOF MS/MS analysis for sequencing and to avoid radiological contamination
of equipment and instruments. This was performed by transferring the selected beads to the top
side of an ultrafiltration membrane, which was loaded with excess ion exchange resin (to
chelate the uranyl) in the lower chamber. Aqueous HCl (1 M) was added to the top and bottom
chambers, and the system was equilibrated for 1 h.
Page 136
127
Figure 1. Peptoid structure and library schematic.
Figure 2. Screening methodology and application of the arsenazo III dye.
Page 137
128
There are some drawbacks to using arsenazo III as a screening dye, the most significant
of which is false positives caused by the interference of other ions. Ions that can interfere
include the lanthanides, barium, lead, bismuth, thorium, a few transition metals, and, notably,
calcium, which is present in high concentrations in natural seawater.28 Interference from
calcium was confirmed by testing ocean water, water with artificial aquarium salts, and calcium
chloride solution, all with or without added uranyl (1-10 mM). In all assays, virtually all of the
resin beads changed to a blue to blue-green color, indicative of calcium binding. Therefore,
calcium was avoided in preparing the buffer solution used (see above). Additionally,
quantitative arsenazo III assays have frequently been performed in strongly acidic solutions,
which is not optimal to determine binding constants in ocean water conditions.8,28,29
Characterization of the uranyl ligands Out of the fifteen beads selected, four were successfully sequenced using MALDI TOF-
TOF MS-MS, and the three unique sequences were obtained. Notably, in these structures, the
only groups that were present were carboxylic acids and non-binding side chains. This can be
rationalized by differences in bonding preferences between uranyl and transition metal ions:
the bonding between uranyl and ligands (including solvents) is generally quite ionic in
character, with the short, strong U=O bonds being inert and trans to each other.30 Ligands
frequently bind in the equatorial plane around the linear dioxo groups, favoring higher
coordination numbers with 5 or 6 equatorial donor atoms. Harder bases are generally preferred
over softer groups such as thiols. Carboxylate groups often are bidentate ligands that can fill
one or multiple coordination sites, unlike the other groups tested in the library.
In order to study binding of the peptoids to uranyl, sequence b was resynthesized on a
larger scale on a different resin (Fmoc-Rink Amide MBHA resin instead of Tentagel MB NH2
resin). The synthesis was performed in the same manner as the screening library. Before use,
the peptoids were cleaved from the resin and purified by reverse-phase HPLC, lyophilized,
then used as aqueous stock solutions.
Fluorescence spectroscopy was investigated as a technique to confirm binding and
establish the affinities of the identified peptoids. The uranyl ion itself is fluorescent and indeed
several bands can be observed directly under certain conditions. Its fluorescence spectrum and
ability to quench other fluorophores varies widely with its chemical environment (pH, solvent,
other ions present), and this feature can be used to study uranyl speciation by comparison with
model uranyl compounds.31,32 This technique does have drawbacks, however, as spectral
measurements are often performed in the presence of phosphoric acid and time-resolved
fluorescence spectroscopy is required.
Due to the difficulty in monitoring uranyl fluorescence, we sought to use a nearby
fluorescent molecule that would be quenched by the proximity of uranyl. The piperonyl group
in two of the peptoid sequences fluoresces weakly at 325 nm, and was therefore selected for
monitoring. HEPES was chosen as a non-binding buffer and found not to interfere with uranyl
fluorescence, unlike phosphate or carbonate-based buffers. The addition of sodium chloride
also affected uranyl fluorescence, so measurements were performed in its absence. A titration
of uranyl (0-5000 μM) into a solution of HEPES (20 mM) and peptoid (100 μM) (Figure 4),
allowed the calculation of an approximate dissociation constant (700±200 μM) for sequence b.
Page 138
129
Figure 3. Uranyl-binding sequences obtained upon screening with a 2 mM uranyl solution.
Fluorescence of a uranyl-peptoid complex increased at 369 nm (one of several bands)
during the titration, and an isosbestic point was present at about 353 nm, suggesting a 1:1
association at these concentrations.33 At uranyl concentrations above 1500 μM this signal and
a signal from free uranyl overlapped with the diminishing piperonyl fluorescence, resulting in
an increase in fluorescence intensity at 325 nm from a shoulder of the uranyl peak. In a control
experiment, no signal was observed for titrating uranyl at the concentrations used in these
experiments (up to 5000 μM) into the same buffer solution in the absence of the peptoid,
reflecting the different behavior of free uranyl depending on environment.
Fluorescence spectroscopy was attempted in the same manner with sequence a, but the
signal observed was much lower in intensity and did not change monotonically. This indicated
that additional fluorescent species or other unusual behavior was involved in that case. The use
of other dedicated fluorophores, rather than relying on the intrinsic fluorescence of the side
chains, is an alternate approach that could be applied for future libraries. This is anticipated to
increase the signal intensity, allow tuning of the fluorescence wavelength to reduce interference
of uranyl fluorescence, and improve consistency between different sequences.
Page 139
130
Figure 4. Peptoid sequence b fluorescence upon uranyl addition.
Figure 5. Peptoid sequence b binding curve constructued from data from Figure 4. Kd =
700±200 μM (the dissociation constant reflecting uranyl affinity for the peptoid) was
calculated by approximating the inflection point of the binding curve.
Page 140
131
Computational analysis
Computational methods are widely used to study proteins and metalloproteins, as well
as small molecule organometallic complexes. Some computational work has been done on
peptoid secondary structure in a similar fashion, but this is less well established and is hindered
by the relative lack of structural data available. These previous studies also do not address
metal binding.15 Based on our extensive previous work on uranyl binding, Density Functional
Theory (DFT) was chosen to model the binding of uranyl to the peptoid ligands in aqueous
solution.2,18,34
The reactions of uranyl binding to a peptoid are shown in Equation 2
[UO2(H2O)5]2+ + Pep ⇌ [UO2Pep(H2O)5−𝑛]2−𝑥 + 𝑥 H3O+ + (𝑛 − 𝑥) H2O (2)
where Pep is the peptoid, x is charge of the peptoid in the complex (since one proton is released
upon binding of one carboxylate group to uranium) and n is the number of water molecules
released from the equatorial plane of uranyl, [UO2(H2O)5]2+. In seawater conditions, uranyl is
present as a triscarbonato complex, but this was not modeled here. For the purpose of
identifying the most promising structural candidates as ligands the pentaaquo uranyl complex
served as a model, providing dramatic savings in time-consuming calculations containing
heavy atoms. For the same reason, the peptoids considered in the simulations were truncated
versions of the original structures; linkers and non-binding residues were removed as including
them would be inconsequential when modeling uranyl binding.2 Such approximations also help
in simplifying the conformational analysis of the free peptoids, which (even after shortening of
the chain) still included thousands of conformers. Evaluation of the thermodynamic process
for Equation 2 with only the most stable conformers was done by a standard expression shown
in Equation 3.
Δ𝐺𝑏𝑖𝑛𝑑(𝑎𝑞) = 𝐺(𝑎𝑞) ([UO2Pep(H2O)5−𝑛]2−𝑥) + 𝑥 ⋅ 𝐺(𝑎𝑞)(H3O+) + (𝑛 − 𝑥) ⋅ 𝐺(𝑎𝑞)(H2O)
− 𝐺(𝑎𝑞) ([UO2(H2O)5]2−𝑥) − 𝐺(𝑎𝑞)(Pep) (3)
Calculations of free energies in solution were done by Density Functional Theory
(DFT), the details of which are given in the Methods section. Full coordinates and images of
the complexes presented and investigated are provided at the end of this chapter.
Out of three most promising peptoid sequences (Figure 3) only sequence a was studied
in detail. Energetic differences between sequences a, b, and c are not known, and while the
relative trends in binding for different conformers of one ligand can be accurately calculated,
even the best computational approaches may be insufficient to predict the energies of binding
for different ligands in solution reliably.34 Our goal is not to determine this difference, but
rather to use the computational results to understand what makes these three sequences
successful, and use that knowledge to improve the peptoid library design in future generations
of screening. Moreover, by studying sequence a we implicitly obtain results for sequence b and
approximations for sequence c since special cases of a binding uranyl with only two carboxyl
groups are almost identical to potential binding modes of the other sequences. Conformational
Page 141
132
analysis was performed on this sequence (Figure 6) to determine the lowest energy conformer
to use in binding calculations and assess the flexibility of the peptoid ligand.
conf 1 conf 2 conf 3
Figure 6. Representative conformations for peptoid sequence a. Conformation I was used for
calculations of free energies of binding uranyl in solution in Equation 3.
Peptoid a can bind uranyl with three different motifs; with one, two or three carboxylate
groups. Carboxylate groups bind in the equatorial plane of uranyl either as mono- or bidentate
ligands, with a total of five or six atoms in the equatorial plane. Additionally, protons on the
peptoid can establish hydrogen bonds to oxygen atoms of the uranyl ion. By systematic
conformational search we optimized and obtained free energies in solution for all possible
conformations of the complexes between peptoid a and uranyl. Relative energies for the most
stable conformations for each of the binding motifs, with the most stable carboxylate binding
modes and overall coordination number for that motif, are given in Table 2, with corrections
for standard concentrations of solutes and water.26
Table 1. Relative energies for the most stable conformer for possible binding modes of
peptoid sequence a to uranyl. Full calculations and data are available in Table 2.
Binding mode Relative ΔGbind(aq)
[kcal/mol]
ΔS
[cal/mol⋅K]
a1 4.86 68.4
a2 7.67 63.4
a3 6.06 68.6
a12 11.33 19.1
a23 3.90 22.3
a13 0.0 22.7
a123 8.69 -18.3
a123h 10.06 -20.5
Page 142
133
T
able
2.
Ener
gie
s fo
r b
ind
ing
mo
de
anal
ysi
s of
pep
toid
seq
uen
ce a
wit
h u
ranyl.
Corr
ecti
ons
are
mad
e fo
r st
andar
d
conce
ntr
atio
ns
of
solu
tes
(1 M
) an
d w
ater
(55.3
4 M
.)26
Page 143
134
Two opposing effects of binding multiple carboxylate groups can be observed in the
relative binding energies of the different coordination modes. Binding multiple carboxylate
groups increases the enthalpy of binding, while there is a corresponding decrease in the entropy
of the system due to the chelation of the peptoid around the metal. This trend can be observed
in Table 2, where a1, a2 and a3 (binding through carboxylate group 1, 2, or 3, respectively)
are less stable than a13 due to the enthalpy of binding, while a123 (binding through all three
carboxylates) is less stable than a13 due to the loss of entropy. This trend is the same if uranyl
is not explicitly solvated with five water molecules. The situation with two groups binding
uranyl is quite different; the changes in the strain of the peptoid backbone favor certain binding
modes. Peptoid a12 is one of the least preferred binding modes, while a13 represents one of
the best. Although a13 is the most stable complex, we are not categorically declaring any
conformation to be the single preferred motif of binding between peptoid a and uranyl because
the energies are quite close and margins of error from our methods do not give us confidence
to definitively favor one over the other Images of the three dimensional complexes of this
binding mode as well as a123 and a123h are shown in Figure 7.
Figure 7. Selected optimized structures and schematics of peptoid sequence a with uranyl.
Colors are used to distinguish the different carboxylate residues (orange: carboxylate 1, pink:
carboxylate 2, green: carboxylate 3). Relative energies are reported in Tables 1 and 2 and full
coordinates can be found at the end of this chapter.
a13 a123 a123h
Page 144
135
Another aspect of the uranyl ion's unique geometry is the possible Lewis basicity of the
uranyl oxo groups, which has been explored for possible selective recognition through
hydrogen bonds in molecular ligands;35–37 these generally involve tethering a hydrogen bond
donor to the functional groups that bind uranyl in its equatorial plane, with the goal being that
complexes formed with uranyl are stabilized relative to other metals due to this interaction as
well as other possible geometrical constraints of the ligand. For this reason, the binding mode
where all three carboxylate residues coordinate to uranyl has been explored with a hydrogen
bonding interaction with the terminal N-H atom of the peptoid interacting with one of the
uranyl oxo groups (Figure 7, a123h). This does not take into account the strength of the
hydrogen bond, but rather geometric constraints that may favor or disfavor it. In situations
where the terminal N-H proton is distant from the oxo group, both groups are expected to form
hydrogen bonds with water molecules (which were not modeled explicitly). Based on the small
difference in energy between structures a123 and a123h (Figure 7), this hydrogen bond may
form but is not expected to be a driving factor in binding and is unlikely to contribute towards
selectivity over other metals. This small difference in energy also demonstrates the multiple
potential binding modes of the carboxylate residues, either monodentate or bidentate. The
peptoid backbone conformation and sterics influences the favored carboxylate binding mode
as well as overall uranyl coordination number, analogous to effects seen in polymer
adsorbents.38 Since this hydrogen bond is not anticipated to be significant for binding and
selectivity, future libraries may incorporate other moieties at this position, such as an additional
residue or a fluorophore, to improve binding or assist with spectroscopy, respectively.
Page 145
136
Summary and conclusions
In this work, techniques were adapted and established for the screening of combinatorial
peptoid libraries to discover new ligands for uranyl binding for purposes of extraction from
seawater. A dye-based screening process with arsenazo III was used to visualize resin beads
that displayed uranyl-binding peptoid sequences, from which three unique sequences were
identified. Fluorescence spectroscopy was used to estimate the affinity of one of the sequences,
which was found to be approximately 700 ± 200 μM, indicating relatively weak binding that
will be improved upon in future library generations. DFT was used to model peptoid binding
to help elucidate the solution-state configuration of the peptoid. This information that the large
size of uranyl favors multidentate ligands such as carboxylates and that the peptoid backbone
folding may constrain binding is being used to guide future library design.
The combinatorial and modular nature of the peptoid synthesis and screening lends itself
well to straightforward testing of future libraries, using the same screening techniques but with
new library designs designs and members. The shortfalls of the initial library may be addressed
with a new selection of submonomers, including groups that are expected to have a higher
affinity for uranyl such as phosphonates and amidoximes.39 Other submonomers and linkers in
the peptoid backbone can also be considered to tune the secondary structure. Some other
improvements are also possible for binding; since the terminal N-H group is not likely to be
important to binding, this is a suitable attachment point for a fluorophore to quantify binding.
For computations, molecular modeling techniques are being explored in addition to DFT, due
to the greater processing speed to allow for rapid modeling of peptoids and uranyl binding.
Page 146
137
References
(1) Tian, G.; Teat, S. J.; Zhang, Z.; Rao, L. Dalton Trans. 2012, 41, 11579–11586.
(2) Vukovic, S.; Hay, B. P. Inorg. Chem. 2013, 0, 7805–7810.
(3) Kim, J.; Tsouris, C.; Mayes, R. T.; Oyola, Y.; Saito, T.; Janke, C. J.; Dai, S.;
Schneider, E.; Sachde, D. Sep. Sci. Technol. 2013, 48, 367–387.
(4) Kang, S. O.; Vukovic, S.; Custelcean, R.; Hay, B. P. Ind. Eng. Chem. Res. 2012, 51,
6619–6624.
(5) Francis, M. B.; Finney, N. S.; Jacobsen, E. N. J. Am. Chem. Soc. 1996, 118, 8983–
8984.
(6) Nitz, M.; Franz, K. J.; Maglathlin, R. L.; Imperiali, B. ChemBioChem 2003, 4, 272–
276.
(7) Nalband, D. M.; Warner, B. P.; Zahler, N. H.; Kirshenbaum, K. Biopolymers 2014,
102, 407–415.
(8) Zhou, L.; Bosscher, M.; Zhang, C.; Ozçubukçu, S.; Zhang, L.; Zhang, W.; Li, C. J.;
Liu, J.; Jensen, M. P.; Lai, L.; He, C. Nat. Chem. 2014, 6, 236–241.
(9) Simon, R. J.; Kania, R. S.; Zuckermann, R. N.; Huebner, V. D.; Jewell, D. a; Banville,
S.; Ng, S.; Wang, L.; Rosenberg, S.; Marlowe, C. K. Proc. Natl. Acad. Sci. 1992, 89,
9367–9371.
(10) Maayan, G.; Ward, M. D.; Kirshenbaum, K. Chem. Commun. 2009, 56–58.
(11) Knight, A. S.; Zhou, E. Y.; Francis, M. B.; Zuckermann, R. N. Adv. Mater. 2015, n/a-
n/a.
(12) Izzo, I.; Ianniello, G.; De Cola, C.; Nardone, B.; Erra, L.; Vaughan, G.; Tedesco, C.;
De Riccardis, F. Org. Lett. 2013, 15, 598–601.
(13) Knight, A. S.; Zhou, E. Y.; Pelton, J. G.; Francis, M. B. J. Am. Chem. Soc. 2013, 135,
17488–17493.
(14) Knight, A. S.; Zhou, E. Y.; Francis, M. B. Chem. Sci. 2015, 4042–4048.
(15) Butterfoss, G. L.; Renfrew, P. D.; Kuhlman, B.; Kirshenbaum, K.; Bonneau, R. J. Am.
Chem. Soc. 2009, 131, 16798–16807.
(16) Maltese, M. J. Org. Chem. 2001, 66, 7615–7625.
(17) Zuckermann, R. N.; Kerr, J. M.; Kent, S. B. H.; Moos, W. H. J. Am. Chem. Soc. 1992,
114, 10646–10647.
(18) Vukovic, S.; Watson, L. a; Kang, S. O.; Custelcean, R.; Hay, B. P. Inorg. Chem. 2012,
51, 3855–3859.
(19) Frisch, M. J. et. al. Gaussian 09, revision A.2; Gaussian, Inc.: Wallingford, CT, 1997.
(20) Becke, A. D. J. Chem. Phys. 1993, 98, 5648.
(21) Lee, C.; Yang, W.; Parr, R. G. Phys. Rev. B 1988, 37, 785–789.
(22) Dolg, M.; Stoll, H.; Preuss, H.; Pitzer, R. M. J. Phys. Chem. 1993, 97, 5852–5859.
(23) Miertuš, S.; Scrocco, E.; Tomasi, J. Chem. Phys. 1981, 55, 117–129.
(24) Cances, E.; Mennucci, B.; Tomasi, J. J. Chem. Phys. 1997, 107, 3032.
(25) Mennucci, B.; Cancès, E.; Tomasi, J. J. Phys. Chem. B 1997, 101, 10506–10517.
(26) Kremleva, A.; Krüger, S.; Rösch, N. Inorganica Chim. Acta 2009, 362, 2542–2550.
(27) Burkoth, T. S.; Fafarman, A. T.; Charych, D. H.; Connolly, M. D.; Zuckermann, R. N.
J. Am. Chem. Soc. 2003, 125, 8841–8845.
Page 147
138
(28) Savvin, S. Talanta 1961, 8, 673–685.
(29) Alimarin, I. P.; Sawin, S. B. Pure Appl. Chem. 1966, 13.
(30) Denning, R. G. J. Phys. Chem. A 2007, 111, 4125–4143.
(31) Bernhard, G.; Geipel, G.; Brendler, V.; Nitsche, H. J. Alloys Compd. 1998, 271–273,
201–205.
(32) Matsushima, R.; Sakuraba, S. J. Am. Chem. Soc. 1971, 93, 7143–7145.
(33) Thordarson, P. Chem. Soc. Rev. 2011, 40, 1305–1323.
(34) Vukovic, S.; Hay, B. P.; Bryantsev, V. S. Inorg. Chem. 2015, 54, 3995–4001.
(35) Sather, A. C.; Berryman, O. B.; Rebek, J. J. Am. Chem. Soc. 2010, 132, 13572–13574.
(36) Franczyk, T. S.; Czerwinski, K. R.; Raymond, K. N. J. Am. Chem. Soc. 1992, 114,
8138–8146.
(37) Watson, L. a; Hay, B. P. Inorg. Chem. 2011, 50, 2599–2605.
(38) Abney, C. W.; Mayes, R. T.; Piechowicz, M.; Lin, Z.; Bryantsev, V. S.; Veith, G. M.;
Dai, S.; Lin, W. Energy Environ. Sci. 2016, 9, 448–453.
(39) Culf, A. S.; Ouellette, R. J. Molecules 2010, 15, 5282–5335.
Page 148
139
Coordinates and 3D images for all optimized structures
a1
C -1.18823 -1.61654 -1.76942 H 4.126476 -2.89717 -2.07748
O -1.03178 -1.42389 -2.96799 C 5.509544 -1.83621 -3.19858
N -2.33392 -2.19556 -1.261 H 5.848351 -0.79497 -3.24585
C -0.09726 -1.20103 -0.75587 H 5.155828 -2.09468 -4.21347
H 0.215932 -2.06289 -0.16209 C 6.687497 -2.73194 -2.81791
H -0.49303 -0.43726 -0.07354 H 7.033875 -2.48694 -1.80508
C -2.57288 -2.42157 0.151991 H 6.395462 -3.7898 -2.78892
H -3.07293 -3.39181 0.263007 C 7.859376 -2.58701 -3.7626
C -3.39607 -2.59531 -2.18591 O 8.812517 -3.52216 -3.5216
H -3.03146 -2.47026 -3.20471 O 7.976325 -1.74573 -4.62919
H -4.29419 -1.97842 -2.05486 C -3.45876 -1.31466 0.800335
H -3.6588 -3.64661 -2.0187 H -4.44078 -1.26987 0.323615
C 2.107472 -1.57286 -1.65604 H -2.96379 -0.34424 0.677044
O 2.052634 -2.73662 -1.25772 C -3.64245 -1.55761 2.268148
N 1.082716 -0.68605 -1.41975 O -4.78411 -1.84405 2.775413
C 3.314754 -1.08296 -2.45508 O -2.64454 -1.51017 3.07573
H 3.009167 -1.07787 -3.52265 O -3.66128 -3.76469 4.837367
H 3.574818 -0.04851 -2.20131 U -3.94479 -2.0278 4.990917
C 1.025336 0.680582 -1.93652 O -4.25658 -0.3283 5.356377
H -0.00527 0.875394 -2.24708 O -1.57246 -1.74055 5.78765
H 1.632863 0.766082 -2.8382 H -1.15078 -0.86375 5.749472
C 1.473172 1.720461 -0.87958 O -4.23491 -2.45054 7.470581
H 0.938941 1.5537 0.059686 H -4.16844 -3.31025 7.921201
H 2.5476 1.619741 -0.69351 H -4.4361 -1.78244 8.148642
C 1.156415 3.129155 -1.33149 O -6.42337 -2.46294 5.100126
O 0.212453 3.789529 -0.9495 H -7.04298 -1.73818 4.902605
O 2.036968 3.569959 -2.26116 H -6.79131 -3.25902 4.677156
H -1.62842 -2.48619 0.692569 H -0.88996 -2.38431 5.527205
N 4.455111 -1.93957 -2.19408 H 1.762201 4.466733 -2.53445
Page 149
140
2
C -0.92333 -3.16668 -4.60865 H 2.771304 -6.4019 -7.12199
O -0.92479 -2.72634 -5.75648 H 3.310886 -6.90929 -5.51442
N -1.99067 -3.83499 -4.07729 C 4.925191 -6.64237 -6.92709
C 0.333888 -2.98483 -3.71815 H 5.21607 -5.96922 -7.73903
H 0.701683 -3.95515 -3.37747 H 5.675317 -6.55998 -6.13087
H 0.079809 -2.42183 -2.81246 C 4.958043 -8.04837 -7.48398
C -2.09112 -4.25173 -2.68055 O 4.593918 -8.97303 -6.55537
H -2.5579 -5.24345 -2.65629 O 5.271593 -8.35495 -8.61424
C -3.17988 -3.99906 -4.92014 C -2.92304 -3.2702 -1.82008
H -2.87019 -4.15203 -5.95461 H -3.94491 -3.19407 -2.19839
H -3.82948 -3.11559 -4.88415 H -2.46209 -2.27555 -1.85695
H -3.74197 -4.8698 -4.57183 C -3.00092 -3.71958 -0.37578
C 2.303991 -2.90425 -5.24154 O -3.99882 -4.09465 0.196302
O 3.053906 -2.23946 -5.95731 O -1.78057 -3.67176 0.225187
N 1.394324 -2.27981 -4.41656 O 1.208118 4.553465 -4.51251
C 2.358951 -4.43102 -5.26036 U 2.750193 4.01644 -5.1896
H 2.292304 -4.84187 -4.24413 O 4.321026 3.701621 -5.93365
H 1.454236 -4.77606 -5.80252 O 3.94231 5.001897 -3.19869
C 1.246162 -0.83339 -4.6066 H 4.839518 4.685245 -2.99126
H 0.295598 -0.52819 -4.16124 O 3.033907 6.399348 -6.00312
H 1.197978 -0.61721 -5.67572 H 2.404355 7.131116 -5.88294
C 2.413576 -0.05567 -3.969 H 3.778439 6.739733 -6.52874
H 2.421248 -0.12113 -2.87615 O 1.704719 3.842023 -7.47935
H 3.353384 -0.49717 -4.3303 H 2.135248 3.242472 -8.11529
C 2.463738 1.386834 -4.36375 H 0.750812 3.656845 -7.54258
O 3.015108 2.272584 -3.61314 H 3.473203 5.06642 -2.34805
O 2.002771 1.80182 -5.48827 H -1.89297 -3.98404 1.143995
H -1.09524 -4.36228 -2.25086 H 4.652199 -9.84898 -6.98294
N 3.597785 -4.87407 -5.86869
C 3.554787 -6.24942 -6.35473
Page 150
141
a3
C 4.951096 4.896685 -7.82328 C 10.76444 5.81189 -10.9275
O 5.515047 3.861822 -8.17501 H 10.63715 5.619975 -12.0007
N 4.171252 4.958586 -6.70181 H 10.9251 4.832764 -10.437
C 5.115542 6.192622 -8.65374 C 12.01277 6.704976 -10.7181
H 5.53065 6.990699 -8.03477 H 11.88752 7.638041 -11.2729
H 4.14531 6.528739 -9.03692 H 12.11536 6.932027 -9.65038
C 3.384531 6.123441 -6.30892 C 13.26211 6.018927 -11.1693
H 3.459545 6.232528 -5.22053 O 13.80186 6.263947 -12.3093
C 3.993713 3.728888 -5.92493 O 13.84236 5.128964 -10.4447
H 4.919589 3.152772 -5.94669 C 1.892293 6.00592 -6.70995
H 3.190463 3.102057 -6.33246 H 1.437324 5.134801 -6.23259
H 3.749658 3.995141 -4.89268 H 1.812944 5.895849 -7.79715
C 7.348007 6.201232 -9.56023 C 1.118132 7.229279 -6.2693
O 7.774991 6.670721 -8.5037 O 0.38974 7.295245 -5.30386
N 6.01705 5.978885 -9.77387 O 1.365605 8.294329 -7.07781
C 8.334623 5.828509 -10.6757 O 14.68375 3.408054 -12.7948
H 8.439479 4.726193 -10.6505 U 15.56421 4.720261 -12.0034
H 7.946105 6.092016 -11.6662 O 16.63737 5.926298 -11.2847
C 5.473771 5.307393 -10.9542 O 15.90915 5.814027 -14.2501
H 4.697191 4.614935 -10.6168 H 16.12264 6.763757 -14.2754
H 6.24326 4.692537 -11.4234 O 17.676 3.540184 -12.759
C 4.887663 6.310197 -11.9775 H 17.7234 2.709423 -13.2629
H 4.126459 6.932712 -11.5002 H 18.58908 3.83158 -12.5924
H 5.684336 6.95835 -12.3571 O 15.97546 3.217486 -10.0192
C 4.227408 5.579298 -13.1257 H 16.19372 3.629114 -9.16412
O 3.04049 5.361413 -13.2327 H 15.32854 2.51636 -9.82391
O 5.138402 5.139477 -14.0348 H 15.24603 5.667287 -14.9479
H 3.813266 7.025311 -6.74696 H 0.855749 9.051523 -6.73027
N 9.595675 6.51671 -10.4374
H 9.656202 6.707208 -9.43585
Page 151
142
a12
C -0.75142 3.480891 0.733919 N -3.44121 0.347134 -1.91093
O -1.8516 3.929161 1.043097 H -4.29817 0.85788 -1.71141
N 0.280138 4.2941 0.325887 C -3.75062 -1.09183 -1.83808
C -0.46431 1.962624 0.80974 H -3.96946 -1.42919 -0.81728
H 0.384547 1.788043 1.478552 H -4.66051 -1.22301 -2.43402
H -0.14063 1.589584 -0.1637 C -2.6608 -1.9933 -2.44874
C 1.56232 3.800128 -0.17101 H -2.20301 -1.53007 -3.33083
H 2.344084 4.49546 0.152231 H -3.12071 -2.92985 -2.79618
C 0.018688 5.732918 0.23666 C -1.5687 -2.39776 -1.48422
H 0.950638 6.276451 0.41785 O -0.44219 -2.85639 -1.87994
H -0.72176 6.005361 0.989616 O -1.74751 -2.26083 -0.23267
H -0.37628 6.015144 -0.74747 C 1.643055 3.614631 -1.70556
C -2.64133 0.826945 0.457065 H 2.577237 3.080652 -1.92678
O -3.72287 0.447973 0.892111 H 0.813224 3.00496 -2.07159
N -1.59335 1.191501 1.287953 O 0.432656 -4.07082 1.043821
C -2.38192 0.880425 -1.06745 U 0.532372 -2.405 0.434225
H -2.23305 1.928539 -1.35962 O 0.797626 -0.78858 -0.25353
H -1.44499 0.360677 -1.29533 C 1.660535 4.89478 -2.51283
C -1.77659 1.059609 2.737137 O 0.909799 5.170459 -3.42346
H -2.66861 0.448212 2.869478 O 2.660799 5.729706 -2.11786
H -1.97117 2.041637 3.188497 H 2.623963 6.516222 -2.69497
C -0.57277 0.40248 3.457164 H 2.834144 -1.92 2.073413
H 0.267645 1.089435 3.59946 O 2.981959 -2.54619 1.334638
H -0.90856 0.108078 4.460752 H 3.204945 -3.39653 1.746457
C -0.06464 -0.83193 2.738807 H 2.454297 -4.22251 -1.33682
O -0.89717 -1.62946 2.207552 O 2.103383 -3.32215 -1.42244
O 1.183795 -1.03927 2.567583 H 1.437165 -3.34891 -2.13905
H 1.785534 2.838735 0.29425
Page 152
143
a13
C -1.51273 -3.30237 0.987562 H 5.158556 -0.14503 0.848964
O -1.38655 -4.47625 0.646917 H 3.678406 -0.23213 -0.09537
N -2.68645 -2.83427 1.536302 C 3.719323 1.324154 1.449726
C -0.40946 -2.25937 0.726664 H 4.443131 2.035895 1.040224
H -0.1137 -1.79788 1.667703 H 3.795403 1.321647 2.542001
H -0.83952 -1.45592 0.114775 C 2.345765 1.796344 1.047148
C -2.83797 -1.5863 2.293687 O 1.303826 1.37991 1.648711
H -3.46493 -1.82462 3.15963 O 2.179557 2.58148 0.047807
C -3.80447 -3.77312 1.639763 C -3.47351 -0.40817 1.513794
H -3.81314 -4.27905 2.615491 H -4.07013 -0.75702 0.665056
H -3.71734 -4.52884 0.859615 H -4.15898 0.142402 2.173294
H -4.74541 -3.22619 1.517548 C -2.46046 0.610657 1.024846
C 2.049751 -2.47417 0.417835 O -1.35416 0.735962 1.636829
O 3.007634 -2.82731 -0.27521 O -2.69317 1.348346 0.012124
N 0.764876 -2.79953 0.057021 O -0.666 3.649536 0.92899
C 2.308727 -1.67499 1.718052 U -0.28428 2.183953 0.008456
H 1.636613 -0.82068 1.809336 O 0.069611 0.774565 -1.01128
H 2.101695 -2.33381 2.573672 C 0.666793 -5.42646 -2.7358
C 0.582617 -3.36925 -1.2923 O 0.089662 -4.86548 -3.64764
H 1.187146 -2.78871 -1.99613 O 1.113874 -6.70536 -2.85247
H -0.46565 -3.24579 -1.5681 H 0.870006 -7.00932 -3.74737
C 0.967401 -4.84869 -1.37702 H 0.474845 4.688854 -1.72035
H 2.032854 -4.98193 -1.16461 O 0.743128 3.759551 -1.80881
H 0.407751 -5.42174 -0.62977 H 1.68025 3.709228 -1.53539
H -1.87468 -1.26398 2.692566 H -1.57764 2.696181 -2.79165
N 3.678489 -1.19089 1.832667 O -1.86854 2.971161 -1.90665
H 4.303319 -1.97389 1.654541 H -2.6687 2.453516 -1.69384
C 4.067564 -0.10163 0.926765
a23
Page 153
144
C 2.3208 -0.47976 -0.86774 N 0.187582 -4.44695 0.990428
O 2.449178 0.008713 -1.99195 H 1.107497 -4.3958 0.554813
N 2.993045 0.052055 0.208852 C -0.55266 -5.59568 0.454211
C 1.574946 -1.82522 -0.72739 H -1.53018 -5.62633 0.945431
H 1.615362 -2.19938 0.289648 H -0.75192 -5.52696 -0.62662
H 2.185489 -2.50875 -1.34092 C 0.22014 -6.87899 0.763721
C 2.82595 -0.28586 1.626559 H 0.43359 -6.93286 1.840247
H 2.004537 -0.99082 1.736259 H 1.196298 -6.89448 0.261532
C 3.967678 1.108067 -0.08678 C 2.532192 0.932238 2.534806
H 3.516401 2.104361 -0.02635 H 2.415441 0.556607 3.560523
H 4.345576 0.969386 -1.1 H 3.356996 1.649378 2.548273
H 4.794034 1.036402 0.628914 C 1.254216 1.645708 2.136618
C -0.76549 -2.6463 -0.53502 O 1.164623 2.915524 2.123607
O -1.82949 -2.9325 -1.09053 O 0.283467 0.944182 1.717156
N 0.180371 -1.88269 -1.1821 O -2.08888 2.883058 1.14419
C -0.50556 -3.15645 0.893032 U -0.59358 2.650435 0.218778
H 0.026924 -2.41761 1.500414 O 0.909726 2.602211 -0.71709
H -1.49713 -3.27708 1.337356 C -0.53044 -8.1337 0.380493
C -0.16965 -1.4054 -2.53397 O -1.71259 -8.21305 0.12169
H -0.38983 -2.27211 -3.1701 O 0.285354 -9.22269 0.377813
H 0.706463 -0.8912 -2.92588 H -0.27034 -9.99411 0.155442
C -1.40799 -0.46829 -2.61663 H -0.6975 5.531255 1.427388
H -1.47879 -0.07942 -3.63715 O 0.030939 5.064468 0.986073
H -2.30509 -1.06075 -2.4069 H 0.670918 4.817392 1.683094
C -1.40465 0.684704 -1.6484 H -0.61017 5.027505 -1.78852
O -1.177 0.45331 -0.41512 O -1.34423 4.489431 -1.44978
O -1.59615 1.898197 -1.99957 H -1.62293 3.901726 -2.18042
H 3.744053 -0.76884 1.99275
Page 154
145
a123
C -1.68159 -1.61463 -1.92928 C 0.98725 1.58471 -0.79159
O -1.7446 -1.43689 -3.15198 O 1.69945 1.56606 0.26768
N -2.80852 -1.51371 -1.14517 O -0.23899 1.91174 -0.71712
C -0.34869 -2.06246 -1.31317 H -1.99153 -2.04773 0.72121
H -0.26312 -3.10866 -1.64223 N 1.98821 -2.48645 0.87475
H -0.34389 -2.0452 -0.22873 H 1.97902 -3.27513 1.51859
C -2.96675 -1.8889 0.26677 C 2.91728 -1.45174 1.35095
H -3.51092 -2.84686 0.29656 H 2.68462 -0.5119 0.84322
C -4.05682 -1.1911 -1.83737 H 3.96392 -1.70662 1.09196
H -3.9233 -1.35537 -2.906 C 2.85776 -1.2463 2.8741
H -4.33045 -0.14282 -1.67044 H 3.15551 -2.16993 3.38659
H -4.86157 -1.83571 -1.46138 H 3.59532 -0.47168 3.12076
C 2.09686 -1.85935 -1.54598 C 1.50278 -0.8202 3.46019
O 3.10402 -1.44427 -2.13211 O 0.86317 -1.59497 4.16627
N 0.85526 -1.33173 -1.79014 O 1.13158 0.41779 3.19423
C 2.26563 -2.96218 -0.48033 C -3.77128 -0.88553 1.14545
H 1.59751 -3.80841 -0.68511 H -4.06458 -1.42027 2.05442
H 3.30397 -3.31078 -0.61701 H -4.67961 -0.56468 0.62594
C 0.81288 -0.1359 -2.66165 C -2.9417 0.32654 1.54127
H -0.22688 0.1203 -2.83231 O -2.40043 0.36179 2.69642
H 1.25907 -0.39526 -3.62868 O -2.66517 1.20395 0.67156
C 1.55913 1.10296 -2.10942 O -0.28862 -0.39016 1.02701
H 2.62522 0.90335 -1.99892 U -0.31503 1.25946 1.67928
H 1.424 1.89855 -2.85489 O -0.3623 2.90789 2.35961
Page 155
146
a123h
C -1.74091 -1.49408 -1.99762 C 0.7442 1.66292 -0.93957
O -1.86046 -1.1747 -3.18647 O 1.48675 1.88232 0.07254
N -2.83147 -1.48466 -1.15905 O -0.51641 1.73121 -0.81168
C -0.39332 -2.04937 -1.50622 H -1.94455 -2.22376 0.60258
H -0.32345 -3.02356 -2.01631 N 1.99546 -2.54639 1.07782
H -0.41295 -2.2311 -0.43825 H 1.12888 -2.03221 1.22387
C -2.93589 -2.01424 0.20629 C 3.10648 -1.76636 1.64871
H -3.48287 -2.96992 0.15473 H 3.35539 -0.87101 1.06106
C -4.10146 -1.05849 -1.74921 H 3.99511 -2.41339 1.65828
H -4.02115 -1.10322 -2.83456 C 2.79042 -1.32486 3.09697
H -4.33627 -0.02999 -1.45198 H 2.43011 -2.17168 3.68999
H -4.9041 -1.72534 -1.40958 H 3.71832 -0.94576 3.5442
C 2.04935 -1.72456 -1.36933 C 1.76051 -0.19775 3.12281
O 3.1032 -1.22289 -1.77773 O 0.61319 -0.34485 3.63325
N 0.82723 -1.25763 -1.80462 O 2.03995 0.87265 2.48305
C 2.12528 -2.88708 -0.34458 C -3.68683 -1.10874 1.22224
H 1.38499 -3.66336 -0.57218 H -3.91556 -1.72594 2.09711
H 3.11569 -3.32723 -0.49996 H -4.62906 -0.75044 0.79607
C 0.85107 -0.13795 -2.77394 C -2.82773 0.06605 1.66095
H -0.15936 -0.01019 -3.14508 O -2.19535 0.00471 2.76052
H 1.48993 -0.43098 -3.6171 O -2.62611 1.01893 0.84814
C 1.38793 1.20999 -2.23828 O -0.07667 -0.45858 0.91447
H 2.46705 1.16492 -2.08742 U -0.24372 1.16027 1.65555
H 1.17231 1.95789 -3.01483 O -0.46697 2.74976 2.42236